winery wastewater treatment & reuse: membrane bioreactor
TRANSCRIPT
WINERY WASTEWATER
TREATMENT & REUSE:
Membrane Bioreactor Technology
By: Anu Shah, P.E.SUMMIT ENGINEERING, INC.463 AVIATION BLVD. STE 200SANTA ROSA, CA [email protected]
Membrane Bioreactor
• Membrane bioreactor (MBR) – High-rate activated sludge process– Microfiltration replaces clarifier– Compact treatment unit– High effluent quality allows recycling
• 0.1 micron pore size, polyvinylidene fluoride (PVDF) membranes
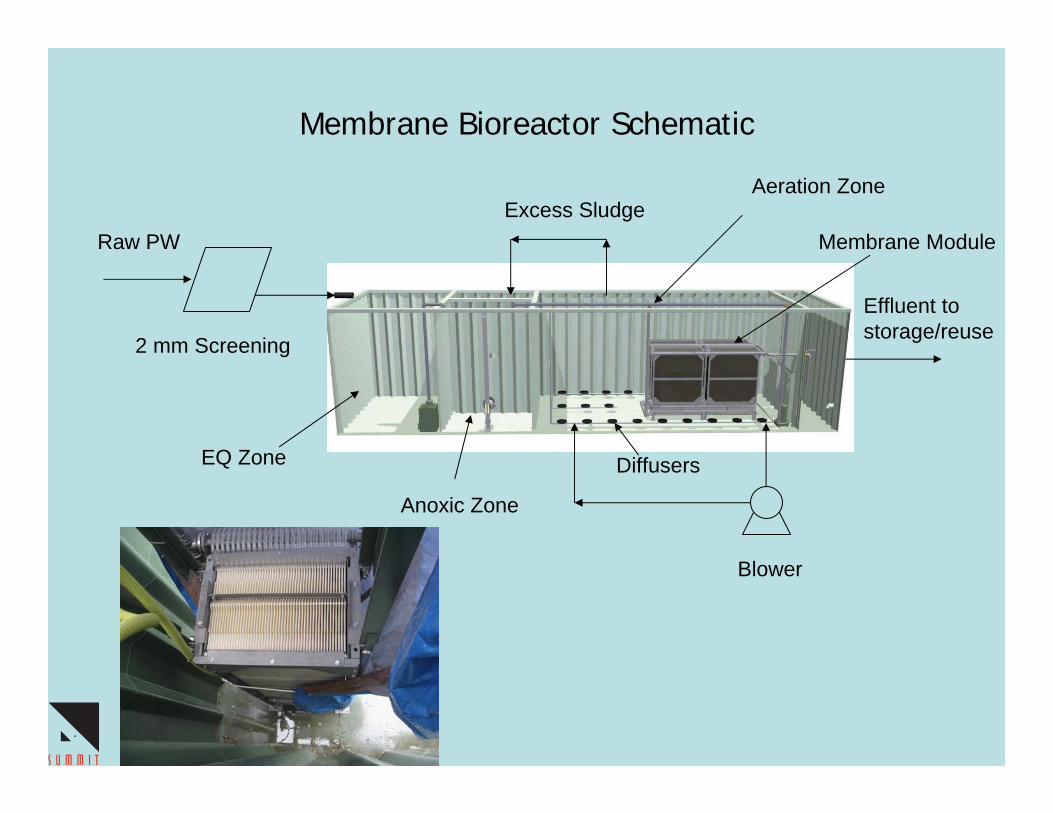
Membrane Bioreactor Schematic
Blower
Diffusers
Membrane Module
2 mm Screening
Raw PW
EQ Zone
Excess Sludge
Anoxic Zone
Effluent to storage/reuse
Aeration Zone
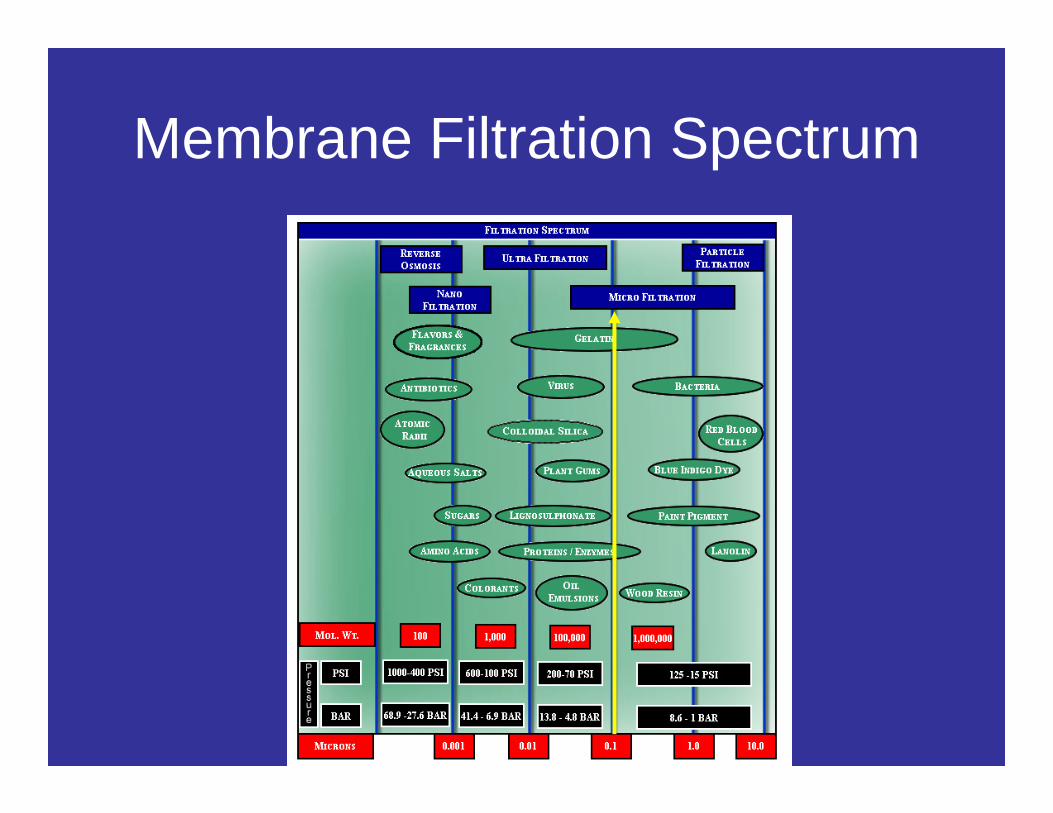
Membrane Filtration Spectrum
Membrane Bioreactor
• Typical flow rate: 5,000 to 20,000 gpd
• Optimal winery size: 50,000 to 250,000 cases
• 10,000 gpd unit: 60’ L x 12’ W x 11.5’ High reactor,
- roughly 1/10th of a pond area.
- energy: 30 HP
• Modularity
Flat Plate Membrane
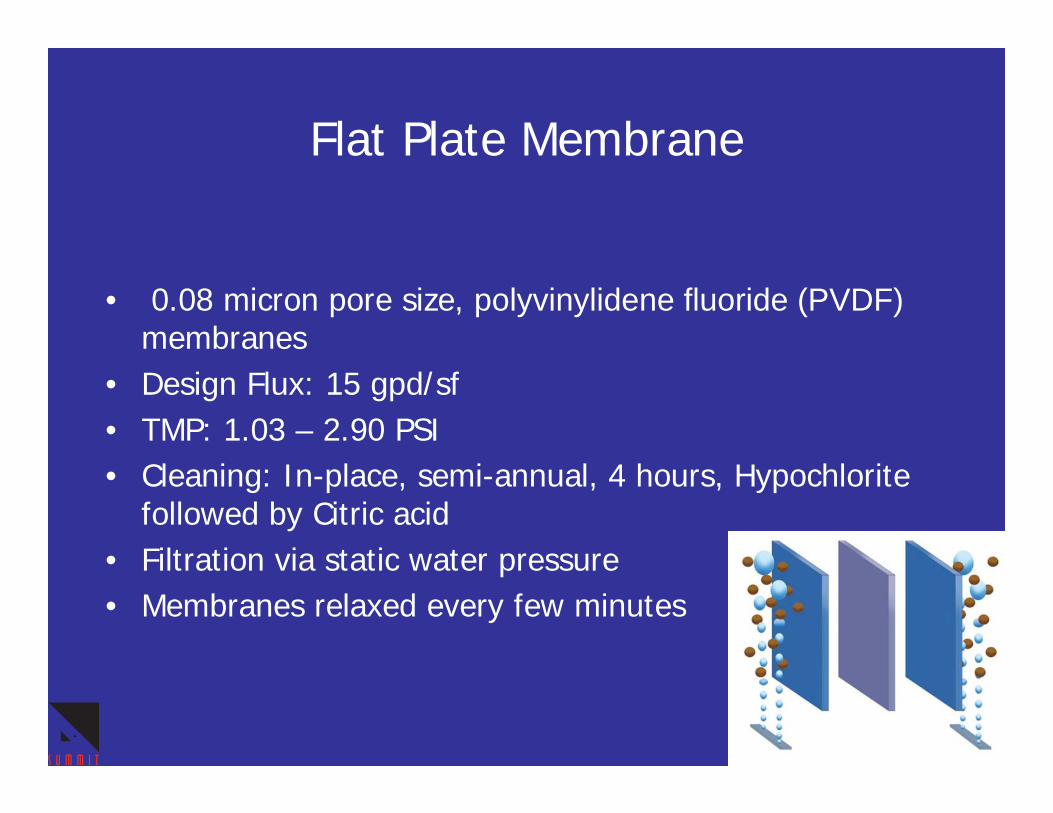
• 0.08 micron pore size, polyvinylidene fluoride (PVDF)membranes
• Design Flux: 15 gpd/sf• TMP: 1.03 – 2.90 PSI• Cleaning: In-place, semi-annual, 4 hours, Hypochlorite
followed by Citric acid• Filtration via static water pressure• Membranes relaxed every few minutes
Hollow Fiber Membrane
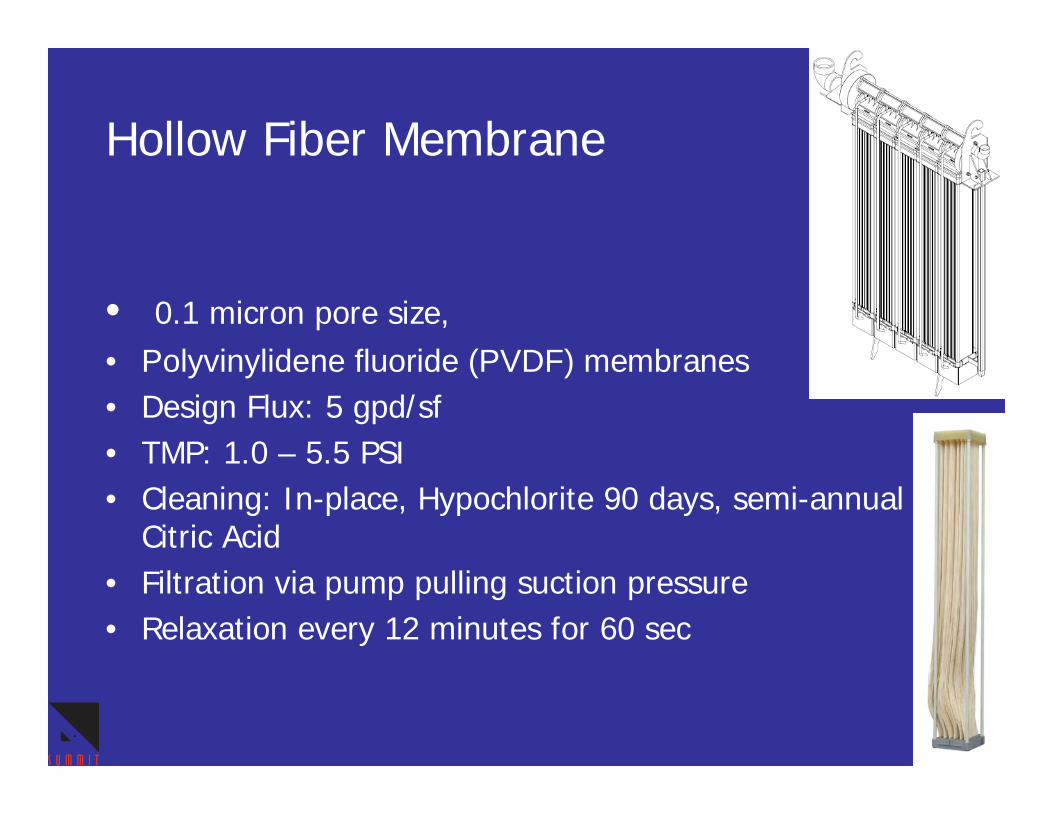
• 0.1 micron pore size, • Polyvinylidene fluoride (PVDF) membranes• Design Flux: 5 gpd/sf• TMP: 1.0 – 5.5 PSI• Cleaning: In-place, Hypochlorite 90 days, semi-annual
Citric Acid • Filtration via pump pulling suction pressure• Relaxation every 12 minutes for 60 sec
Membrane Bioreactor Process Parameters
• Flow – readout
• Dissolved Oxygen – readout
• pH - readout
• Transmembrane Pressure - readout
• Effluent Quality – BOD, TSS, N, P – wet chemistry
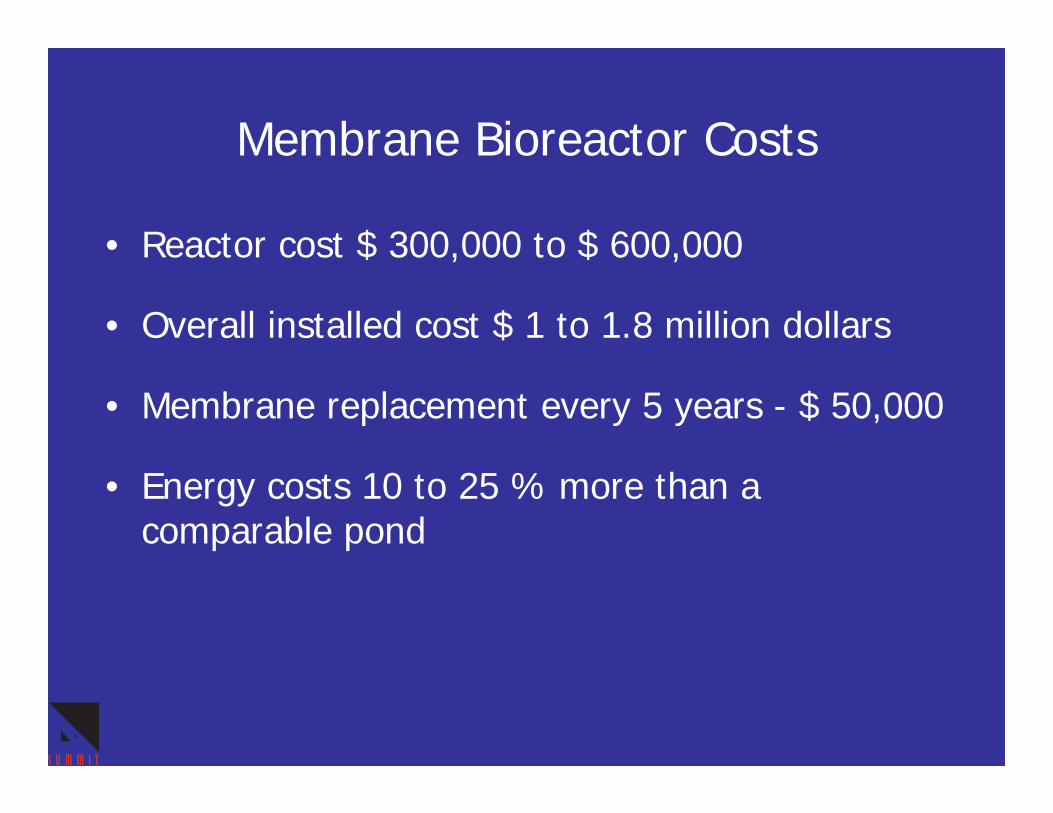
Membrane Bioreactor Costs
• Reactor cost $ 300,000 to $ 600,000
• Overall installed cost $ 1 to 1.8 million dollars
• Membrane replacement every 5 years - $ 50,000
• Energy costs 10 to 25 % more than a comparable pond
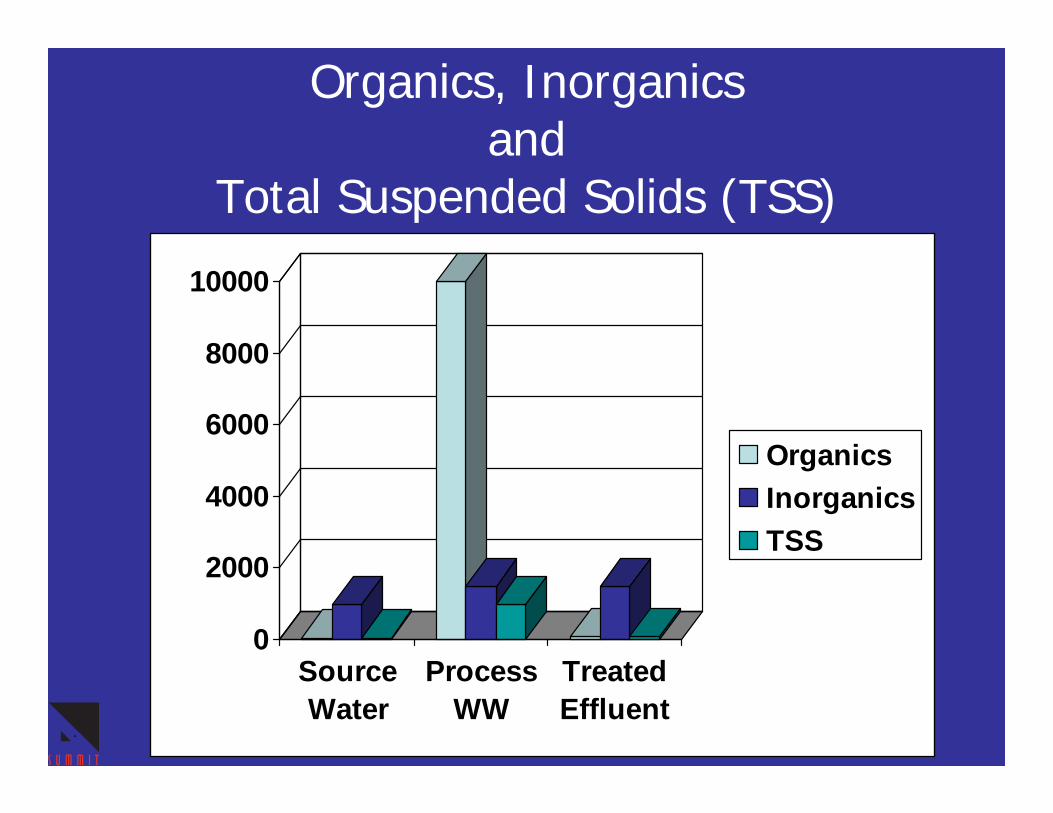
Organics, Inorganics and
Total Suspended Solids (TSS)
0
2000
4000
6000
8000
10000
SourceWater
ProcessWW
TreatedEffluent
OrganicsInorganicsTSS
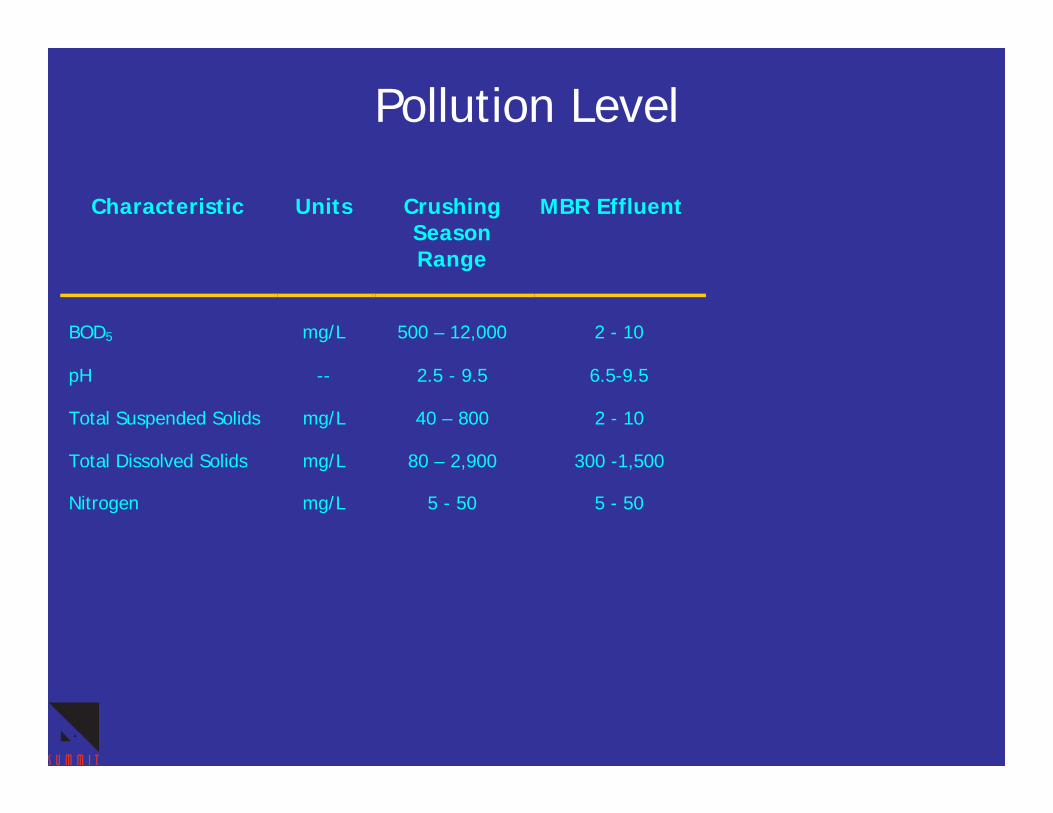
Pollution Level
Characteristic Units Crushing Season
MBR Effluent
Range
BOD5
mg/L
500 – 12,000
2 - 10
pH -- 2.5 - 9.5 6.5-9.5
Total Suspended Solids mg/L 40 – 800 2 - 10
Total Dissolved Solids mg/L 80 – 2,900 300 -1,500
Nitrogen mg/L 5 - 50 5 - 50
Membrane Bioreactor Effluent Quality
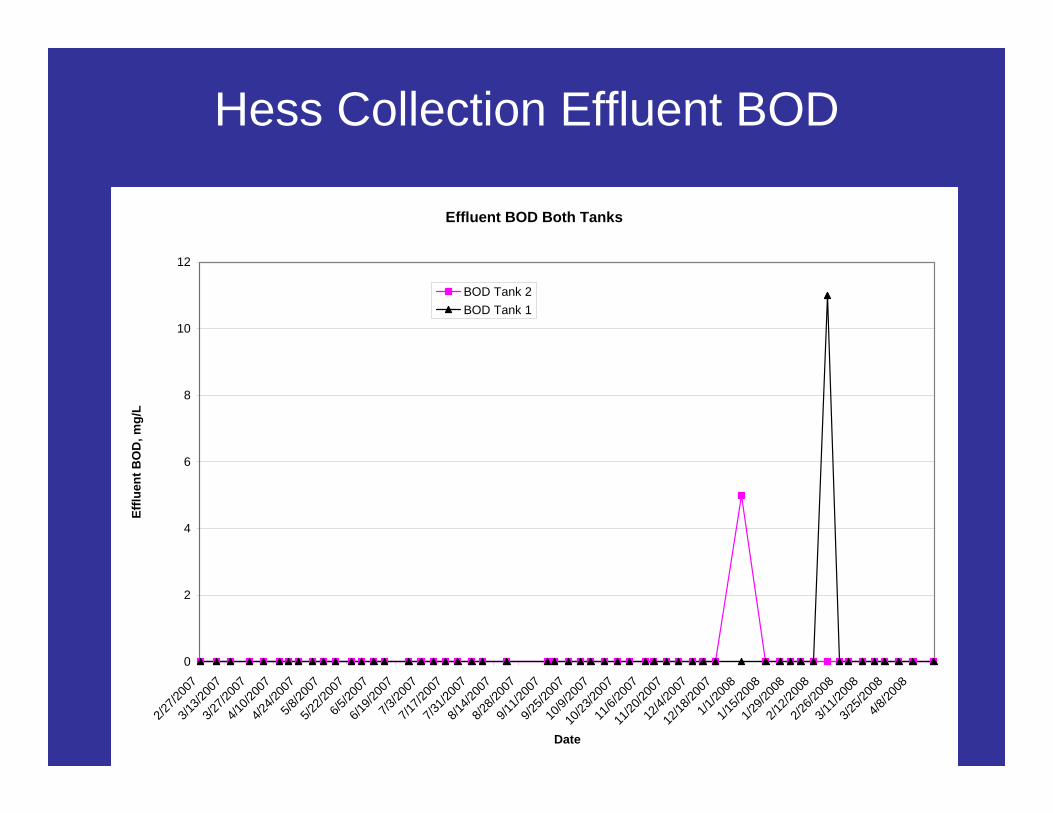
• BOD and TSS < 10 mg/L consistently, majority of samples below 2 mg/L
• Instrumentation, process control and lab testing ensures better operation and effluent quality
• Effluent quality independent of sludge settling characteristics
• Membrane tear - small but distinct increase in the TSS/BOD
• Ability to denitrify with anoxic zone – low nitrogen achievable
Membrane Bioreactor Effluent Reuse
• Consistent effluent quality with low BOD & TSS allows for more reuse options
• Vineyard and landscape Irrigation
• Reuse inside the winery – toilet flushing, floor rinsing, initial rinse of tanks
• Prepares the effluent for further membrane treatment
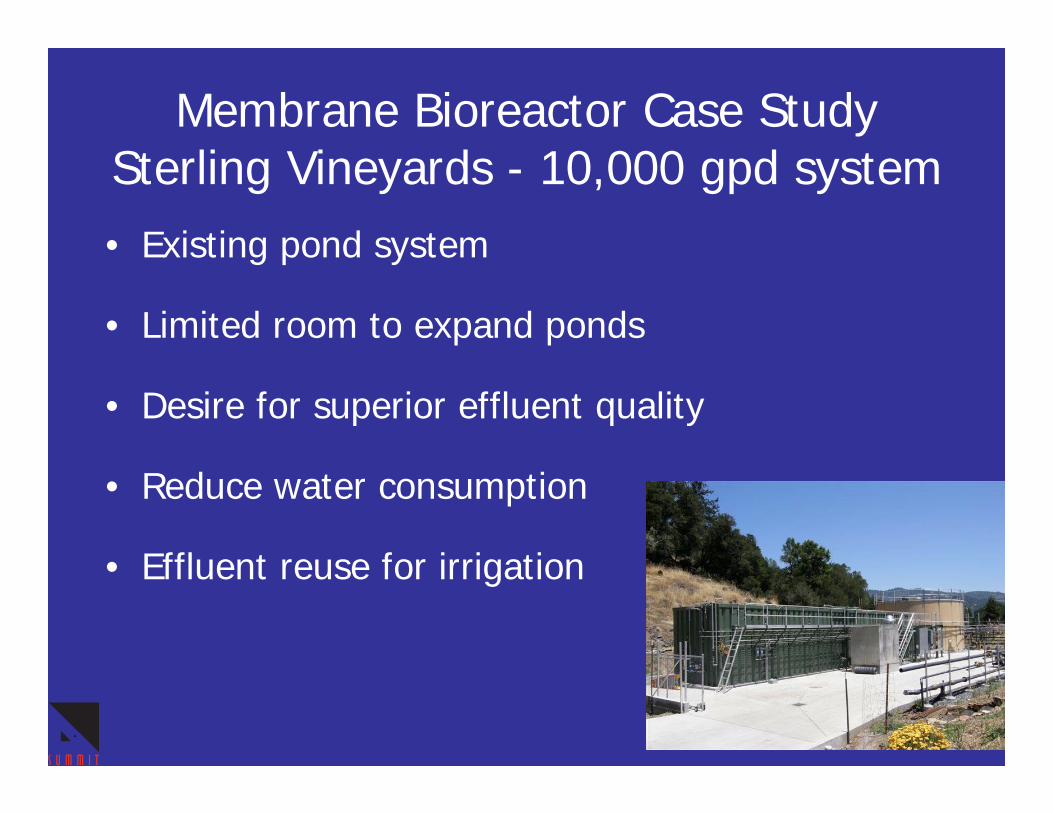
Membrane Bioreactor Case StudySterling Vineyards - 10,000 gpd system• Existing pond system
• Limited room to expand ponds
• Desire for superior effluent quality
• Reduce water consumption
• Effluent reuse for irrigation
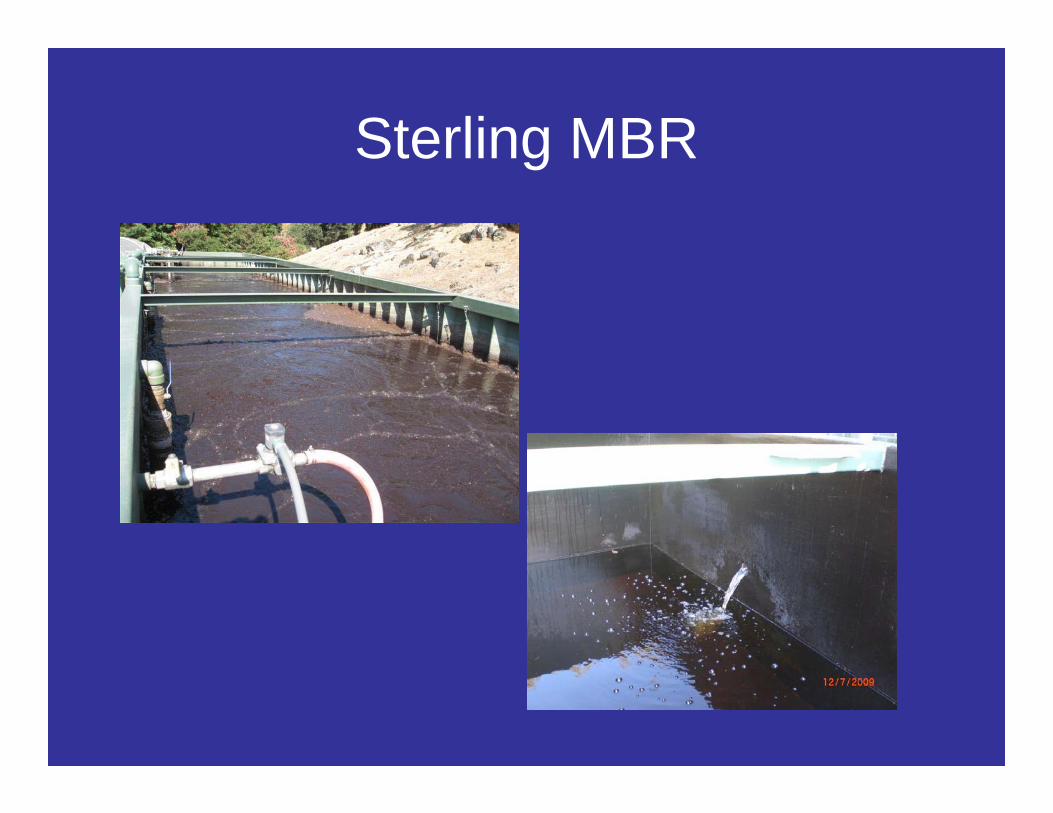
Sterling MBR
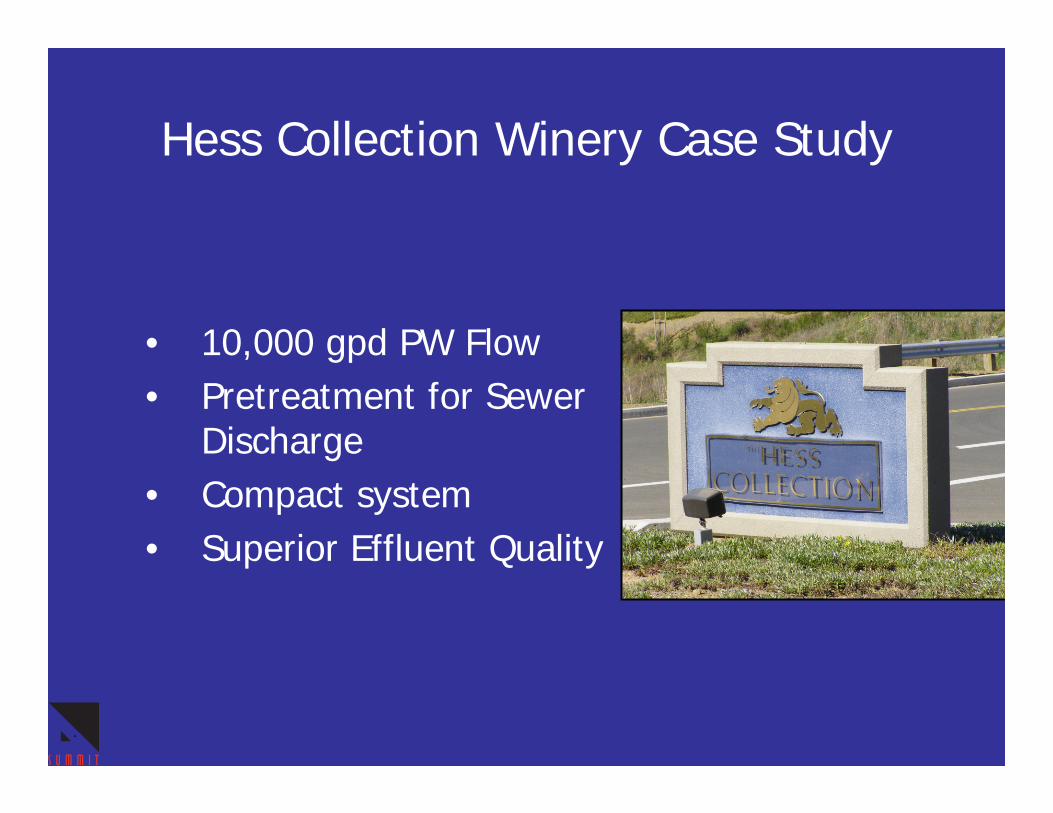
Hess Collection Winery Case Study
• 10,000 gpd PW Flow• Pretreatment for Sewer
Discharge• Compact system • Superior Effluent Quality
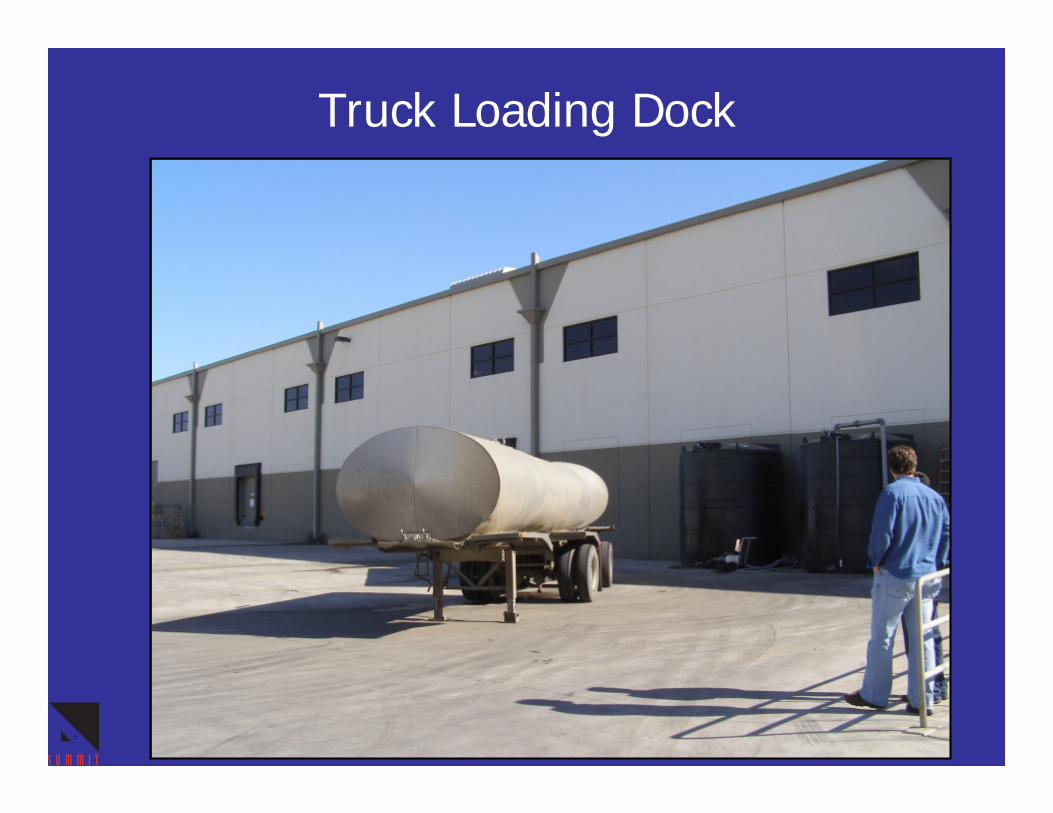
Truck Loading Dock
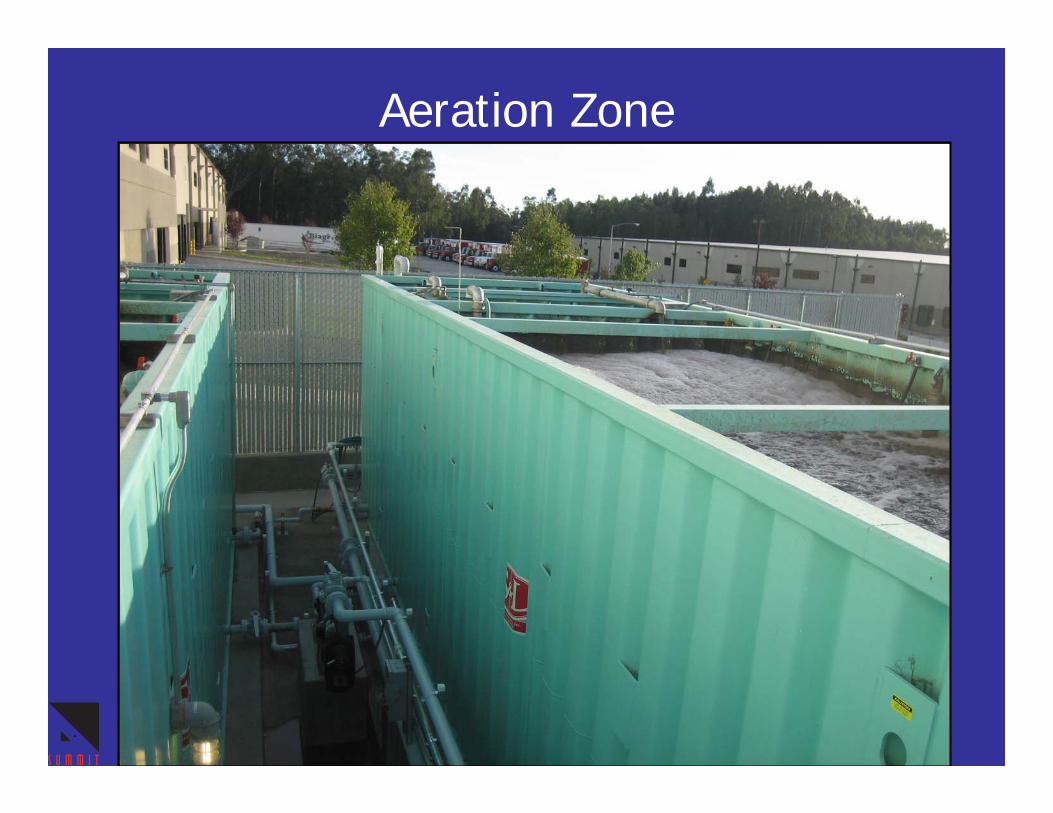
Aeration Zone
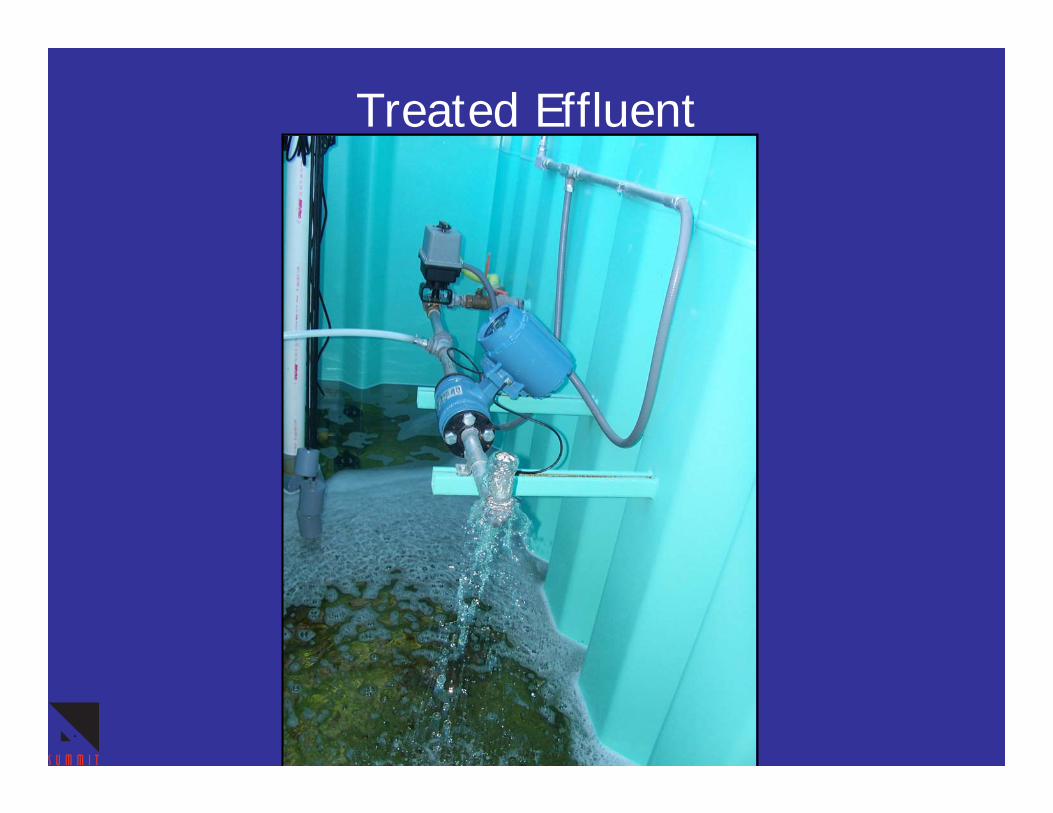
Treated Effluent
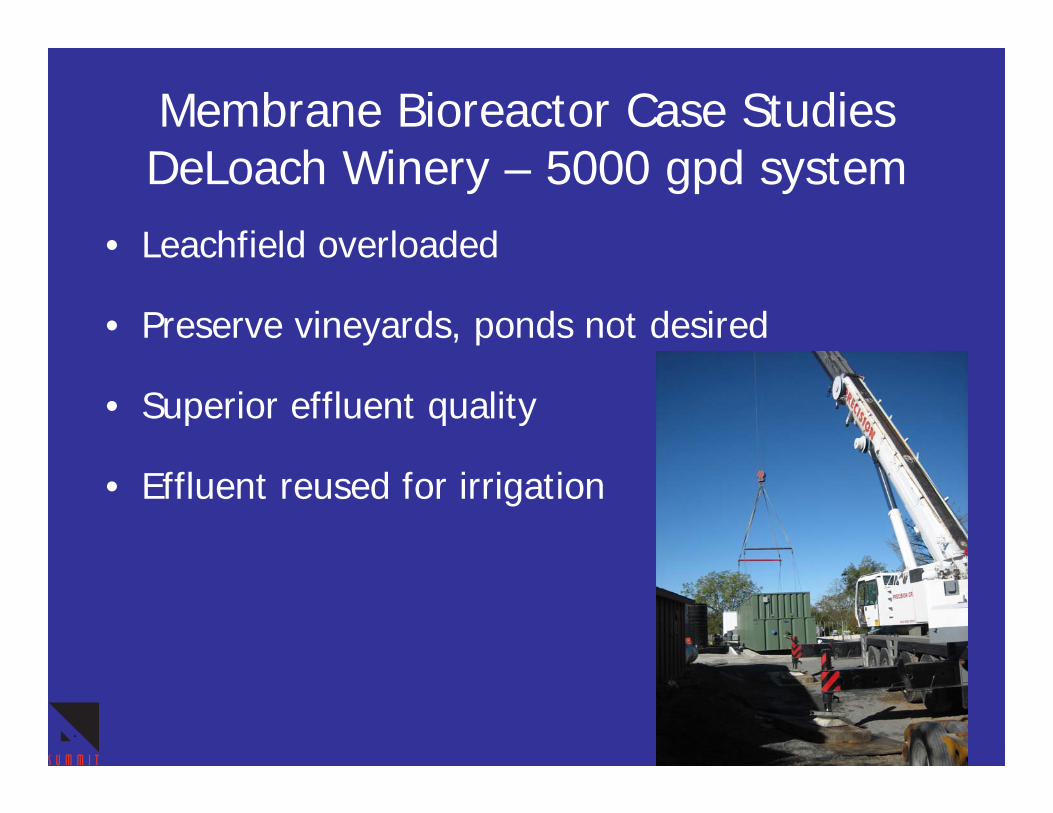
Membrane Bioreactor Case StudiesDeLoach Winery – 5000 gpd system
• Leachfield overloaded
• Preserve vineyards, ponds not desired
• Superior effluent quality
• Effluent reused for irrigation
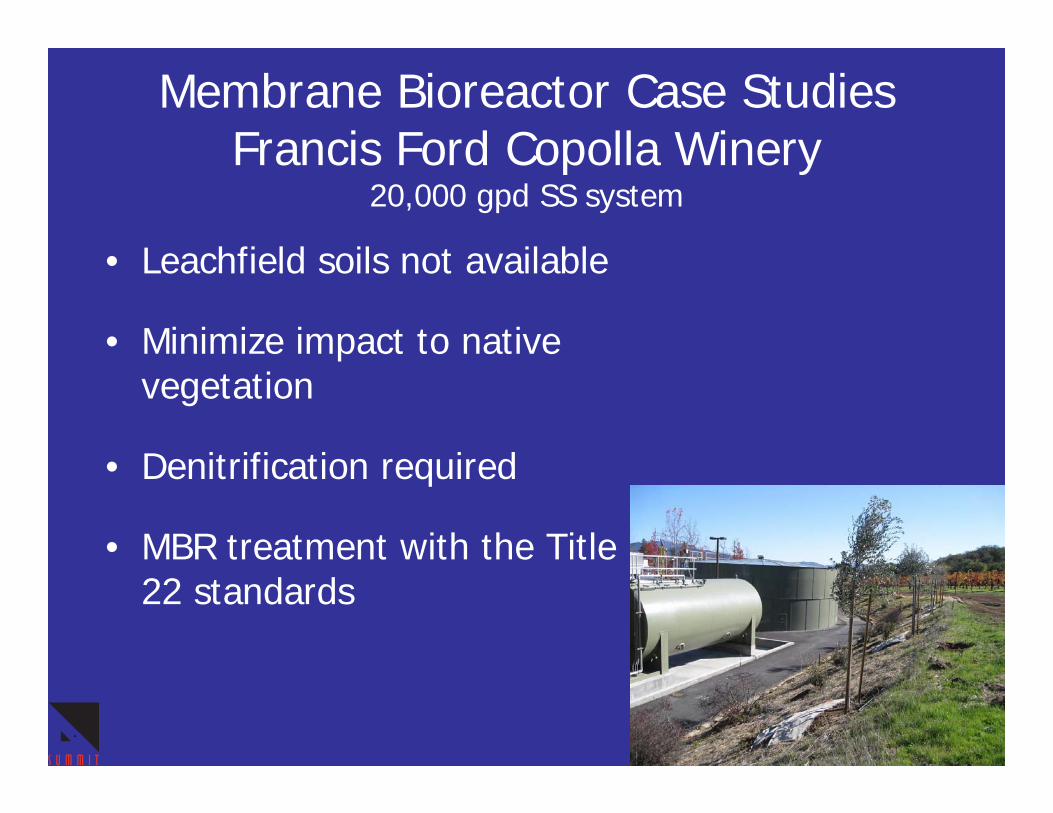
Membrane Bioreactor Case StudiesFrancis Ford Copolla Winery
20,000 gpd SS system
• Leachfield soils not available
• Minimize impact to native vegetation
• Denitrification required
• MBR treatment with the Title 22 standards
Influent COD
0
10000
20000
30000
40000
50000
60000
70000
80000
90000
100000
12/19
/2006
1/9/2
007
1/23/2
007
2/6/2
007
2/20/2
007
3/12/2
007
3/27/2
007
4/10/2
007
4/24/2
007
5/
8/200
75/2
4/200
76/5
/2007
6/20/2
007
7/10/2
007
7/23/2
007
8/7/20
07 8/
21/20
079/1
1/200
79/2
5/200
710
/8/20
071/8
/2008
1/24/2
008
2/05
/2008
2/1
9/200
83/3
/2008
3/18
/084/1
/2008
4/21/2
008
5/12/2
008
6/2/20
086/1
6/200
8
Date
Influ
ent C
OD
, mg/
L
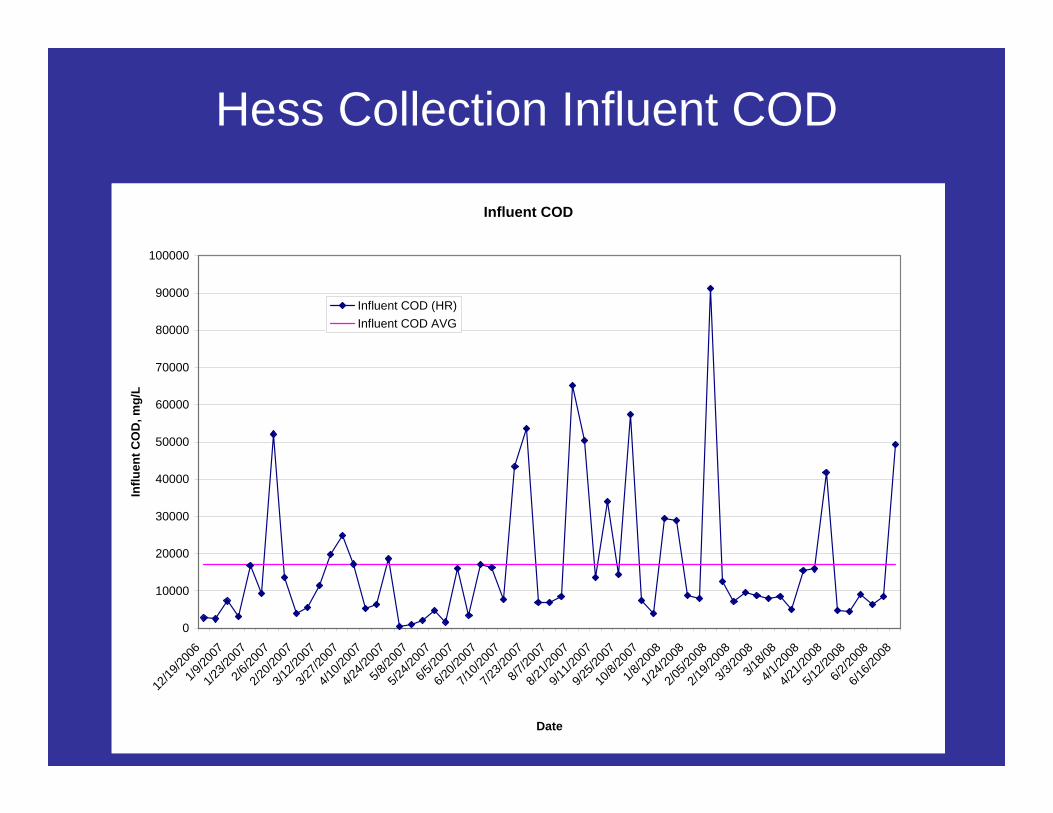
Influent COD (HR)Influent COD AVG
Hess Collection Influent COD
Influent TSS
0
1000
2000
3000
4000
5000
6000
7000
8000
9000
10000
12/19
/2006
1/9/2
007
1/23/2
007
2/6/2
007
2/20/2
007
3/12/2
007
3/27/2
007
4/10/2
007
4/24/2
007
5/
8/200
75/2
4/200
76/5
/2007
6/20/2
007
7/10/2
007
7/23/2
007
8/7/20
07 8/
21/20
079/1
1/200
79/2
5/200
710
/8/20
071/8
/2008
1/24/2
008
2/05
/2008
2/1
9/200
83/3
/2008
3/18
/084/1
/2008
4/21/2
008
5/12/2
008
6/2/20
086/1
6/200
8
Date
Influ
ent T
SS, m
g/L
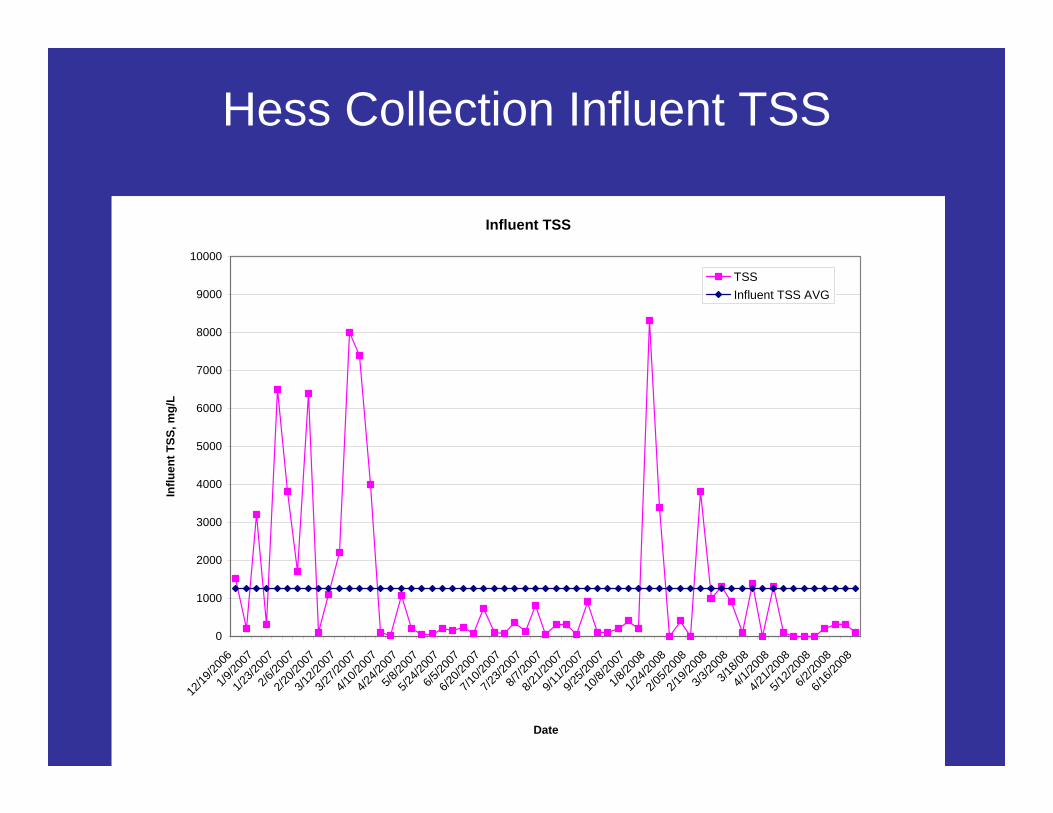
TSS Influent TSS AVG
Hess Collection Influent TSS
Effluent BOD Both Tanks
0
2
4
6
8
10
12
2/27/2
007
3/13/2
007
3/27/2
007
4/10/2
007
4/24/2
007
5/8/20
075/2
2/200
76/5
/2007
6/19/2
007
7/3/20
077/1
7/200
77/3
1/200
78/1
4/200
78/2
8/200
79/1
1/200
79/2
5/200
710
/9/20
0710
/23/20
0711
/6/20
0711
/20/20
0712
/4/20
0712
/18/20
071/1
/2008
1/15/2
008
1/29/2
008
2/12/2
008
2/26/2
008
3/11/2
008
3/25/2
008
4/8/20
08
Date
Efflu
ent B
OD
, mg/
L
BOD Tank 2BOD Tank 1
Hess Collection Effluent BOD
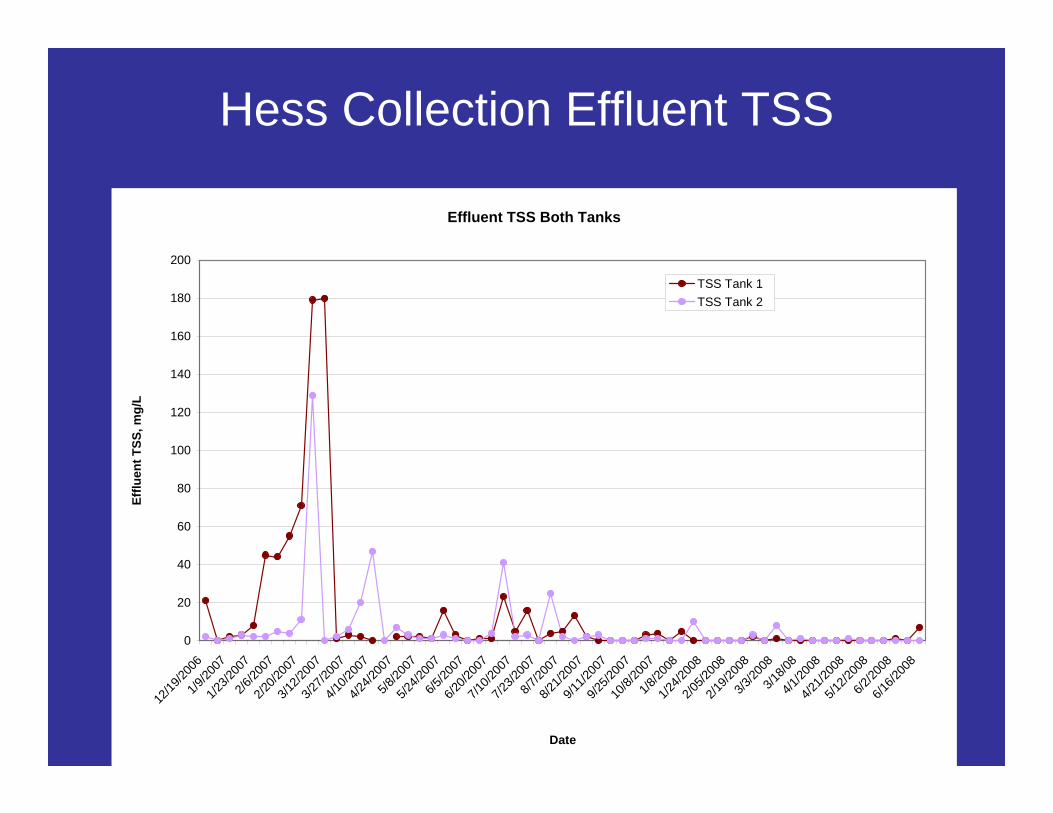
Effluent TSS Both Tanks
0
20
40
60
80
100
120
140
160
180
200
12/19
/2006
1/9/2
007
1/23/2
007
2/6/2
007
2/20/2
007
3/12/2
007
3/27/2
007
4/10/2
007
4/24/2
007
5/
8/200
75/2
4/200
76/5
/2007
6/20/2
007
7/10/2
007
7/23/2
007
8/7/20
07 8/
21/20
079/1
1/200
79/2
5/200
710
/8/20
071/8
/2008
1/24/2
008
2/05
/2008
2/1
9/200
83/3
/2008
3/18
/084/1
/2008
4/21/2
008
5/12/2
008
6/2/20
086/1
6/200
8
Date
Efflu
ent T
SS, m
g/L
TSS Tank 1 TSS Tank 2
Hess Collection Effluent TSS
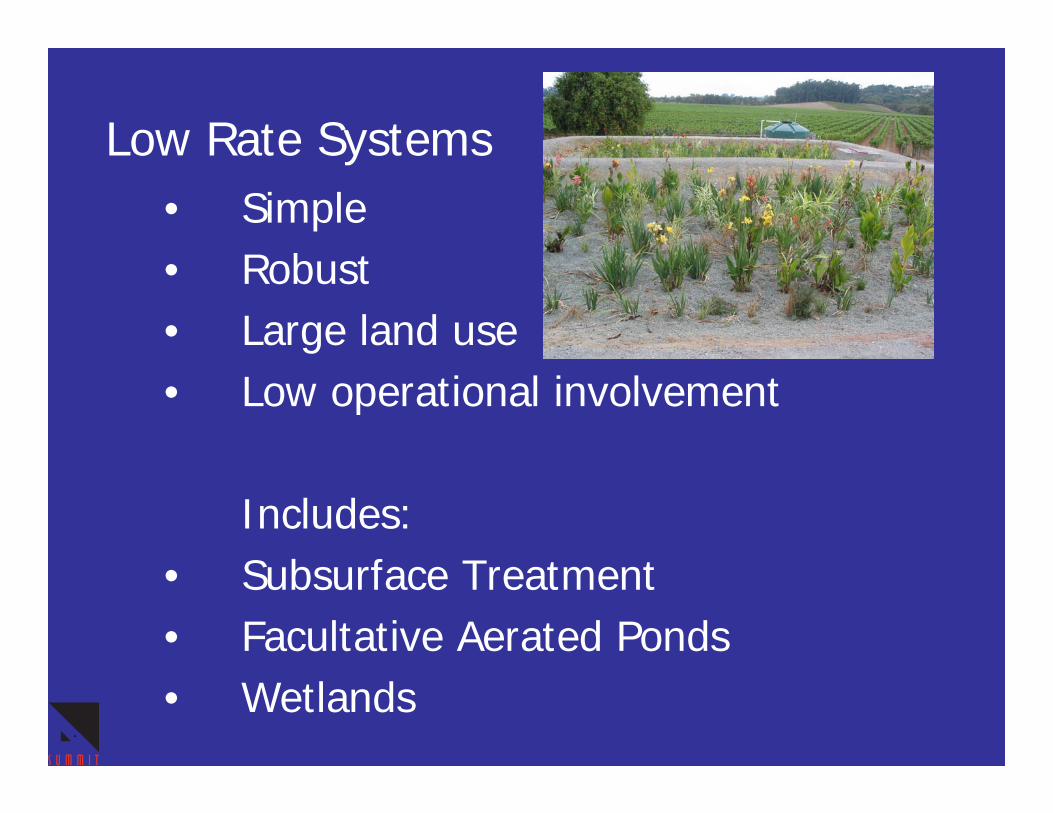
Low Rate Systems• Simple• Robust• Large land use• Low operational involvement
Includes:• Subsurface Treatment • Facultative Aerated Ponds• Wetlands
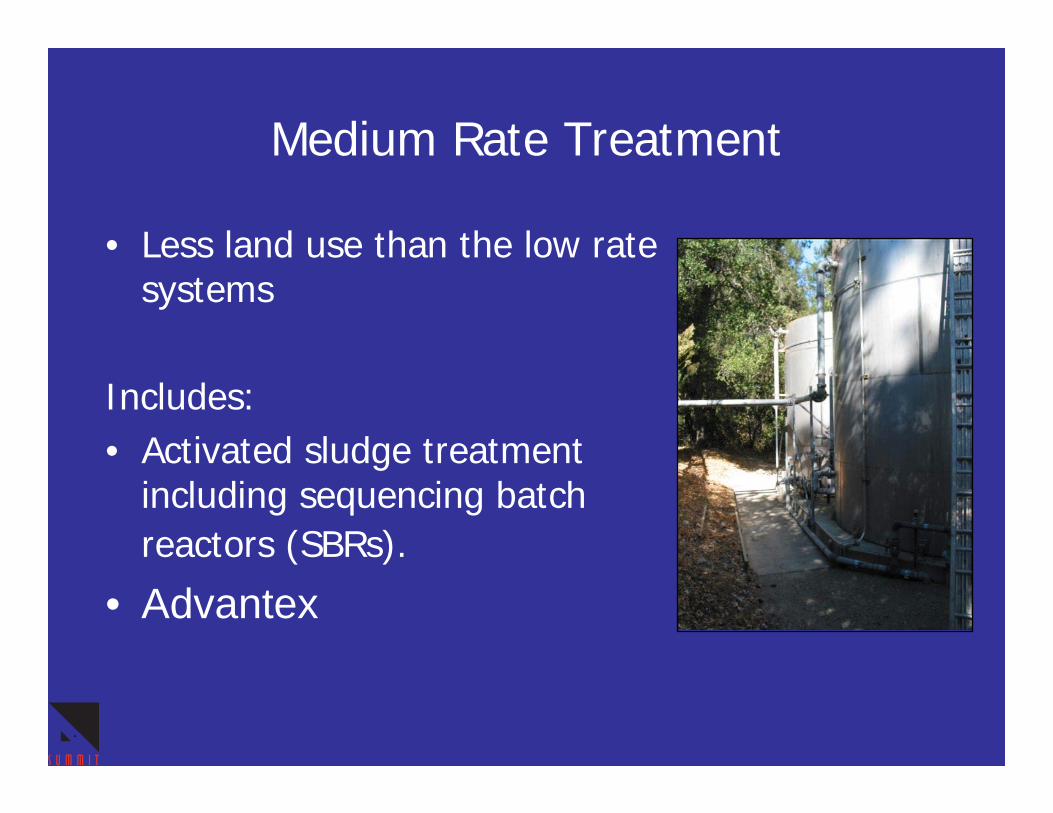
Medium Rate Treatment
• Less land use than the low rate systems
Includes:• Activated sludge treatment
including sequencing batch reactors (SBRs).
• Advantex
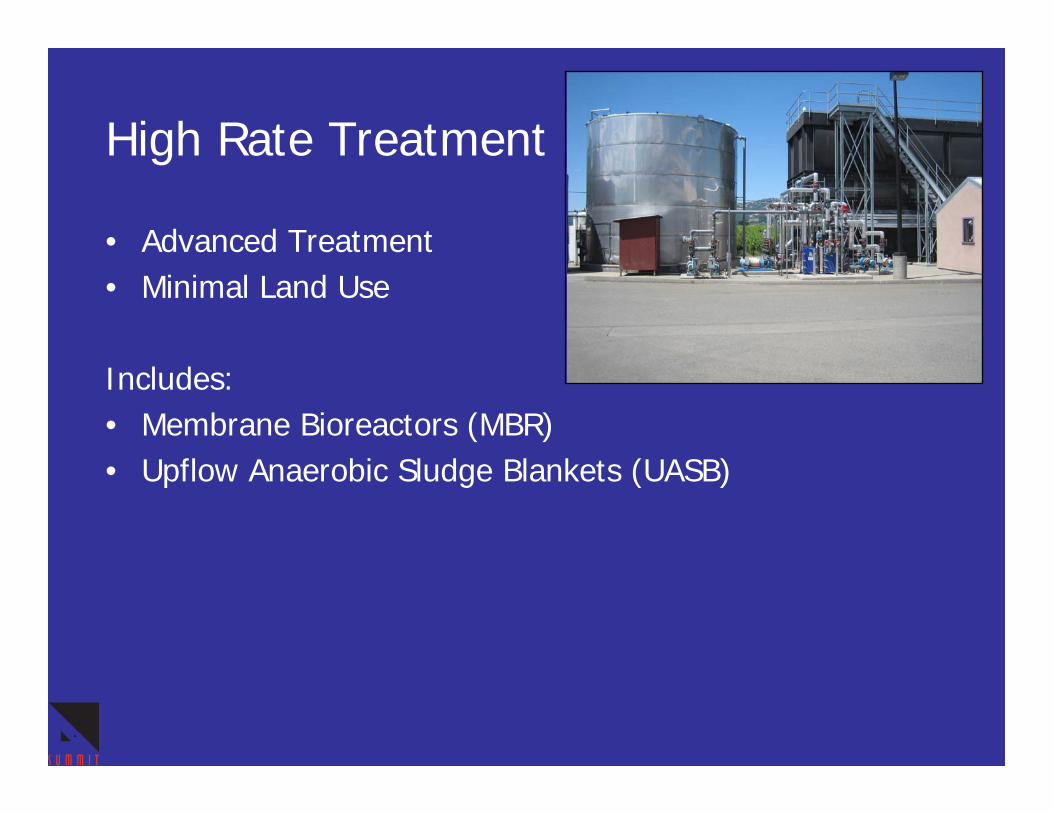
High Rate Treatment
• Advanced Treatment • Minimal Land Use
Includes:• Membrane Bioreactors (MBR)• Upflow Anaerobic Sludge Blankets (UASB)
Subsurface Treatment
• Settling (Septic) Tank Followed By Perforated Subsurface Piping
• Low visual impact• Require low maintenance and operator attention • Downside is these systems require large land use
Factors affecting Subsurface Treatment:• Depth and quality of the soil • Depth to groundwater• Setback from wells, flood zones, etc.
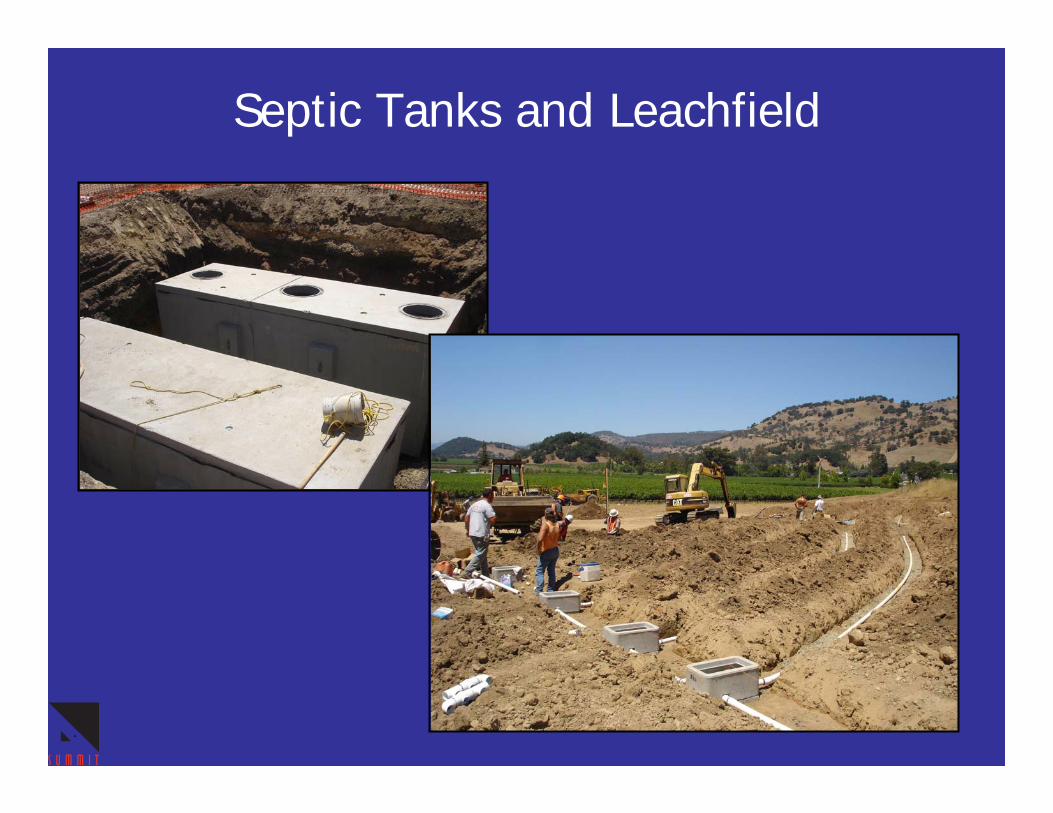
Septic Tanks and Leachfield
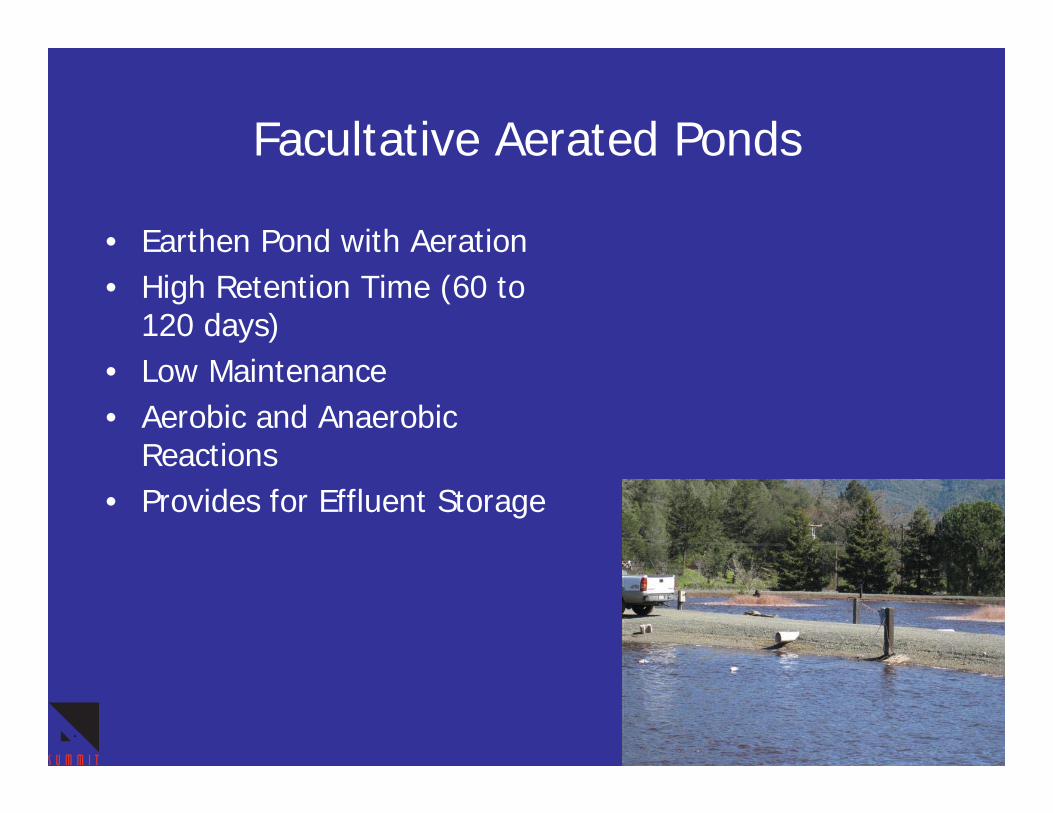
Facultative Aerated Ponds
• Earthen Pond with Aeration• High Retention Time (60 to
120 days)• Low Maintenance• Aerobic and Anaerobic
Reactions• Provides for Effluent Storage
Summary
• MBR is an option when high effluent quality is desired for effluent reuse
• Over 99 percent removal efficiencies were achieved for BOD5, COD and TSS
• Space saving technology
• Current pricing attractive for 50,000 to 250,000 case wineries