wind tunnel testing_report
TRANSCRIPT
LTR DESCRIPTION DATE APPROVED
SIGNATURES DATE 972 Mission Street, Suite 500 San Francisco, CA 94103
ORIGINATOR: TITLE:
WIND TURBINE TEST REPORT CHECKED BY: CLIENT: AIDG APPROVED: 21DEC10 DRAWING NO: TBD REV
:
05 SHEET 1 OF 27
Wind Turbine Test Report
WIND TURBINE TEST REPORT
CATAPULT DESIGN & ENGINEERS WITHOUT BORDERS REV 05 SHEET 2 OF 27
Contents Contents ......................................................................................................................................................................... 2 Introduction .................................................................................................................................................................... 3
General Project Description ....................................................................................................................................... 3 Catapult Design and Engineers Without Borders ...................................................................................................... 3 Design Background.................................................................................................................................................... 3 Test Background ........................................................................................................................................................ 4
Testing............................................................................................................................................................................ 4 Test Objectives........................................................................................................................................................... 4 Test Set-up ................................................................................................................................................................. 5
Rotor Configurations.............................................................................................................................................. 5 Data Collection ...................................................................................................................................................... 6
Test Procedure............................................................................................................................................................ 8 Deviations .................................................................................................................................................................. 8
Changes to Test Set-up .......................................................................................................................................... 9 Changes to Test Procedure..................................................................................................................................... 9
Analysis of Results......................................................................................................................................................... 9 Format of Raw Data ................................................................................................................................................... 9 Analysis Performed.................................................................................................................................................. 10
Power ................................................................................................................................................................... 10 Maximum Efficiency (Cp) ................................................................................................................................... 14 Tip Speed Ratio.................................................................................................................................................... 15
Test Results .................................................................................................................................................................. 16 Savonius Rotor ......................................................................................................................................................... 16
Test Parameters .................................................................................................................................................... 16 Charts ................................................................................................................................................................... 16
Lenz Rotor................................................................................................................................................................ 19 Test Parameters .................................................................................................................................................... 19 Charts ................................................................................................................................................................... 19
Discussion of Results ................................................................................................................................................... 22 Data Collection ........................................................................................................................................................ 22 Comparison of Rotors .............................................................................................................................................. 22
Efficiency ............................................................................................................................................................. 22 Cp vs TSR ............................................................................................................................................................ 22 Other Performance Factors .................................................................................................................................. 23
Validation of Results................................................................................................................................................ 23 Research materials ............................................................................................................................................... 23 Motor tests............................................................................................................................................................ 23
Conclusion ............................................................................................................................................................... 24 Security ........................................................................................................................................................................ 25 Special Thanks ............................................................................................................................................................. 25 References .................................................................................................................................................................... 26 Appendix ...................................................................................................................................................................... 27
WIND TURBINE TEST REPORT
CATAPULT DESIGN & ENGINEERS WITHOUT BORDERS REV 05 SHEET 3 OF 27
Introduction
General Project Description The Appropriate Infrastructure Development Group (AIDG) operating in Guatemala has requested that Catapult Design and Engineers Without Borders (EWB-USA) develop a small, vertical-axis wind turbine for manufacture and sale in Guatemala. The goal of the wind turbine is to supply low levels (~10-20 Watts) of electricity to rural families living in areas with no regular access to a power grid but with relatively consistent wind (~15 mph). The turbine output will be used to charge batteries that will later be used to charge cellular phones, power LED lights, and run radios. The price target for the turbine is $100 in raw materials and assembly costs, preferably using locally available materials and personnel.
Catapult Design and Engineers Without Borders Catapult Design is a non-profit design firm that develops products designed for people living in impoverished communities. Catapult works with organizations, both for-profits and non-profits, which have a social or humanitarian mission and are attempting to help people meet their basic needs using technology. Catapult is based in San Francisco, California, and was founded in 2008 by a team of engineers and designers that had met while volunteering for Engineers Without Borders. Engineers Without Borders - USA (EWB-USA) is a large, national, volunteer-based non-profit. They partner with local communities and non-governmental organizations to help create a more stable and prosperous world by addressing people's basic human needs by providing necessities such as clean water, power, sanitation, and education. The EWB-USA team that contributes to this project is the Appropriate Technology Design Team (ATDT), which is a project team of the Engineers Without Borders – San Francisco Professionals Chapter.
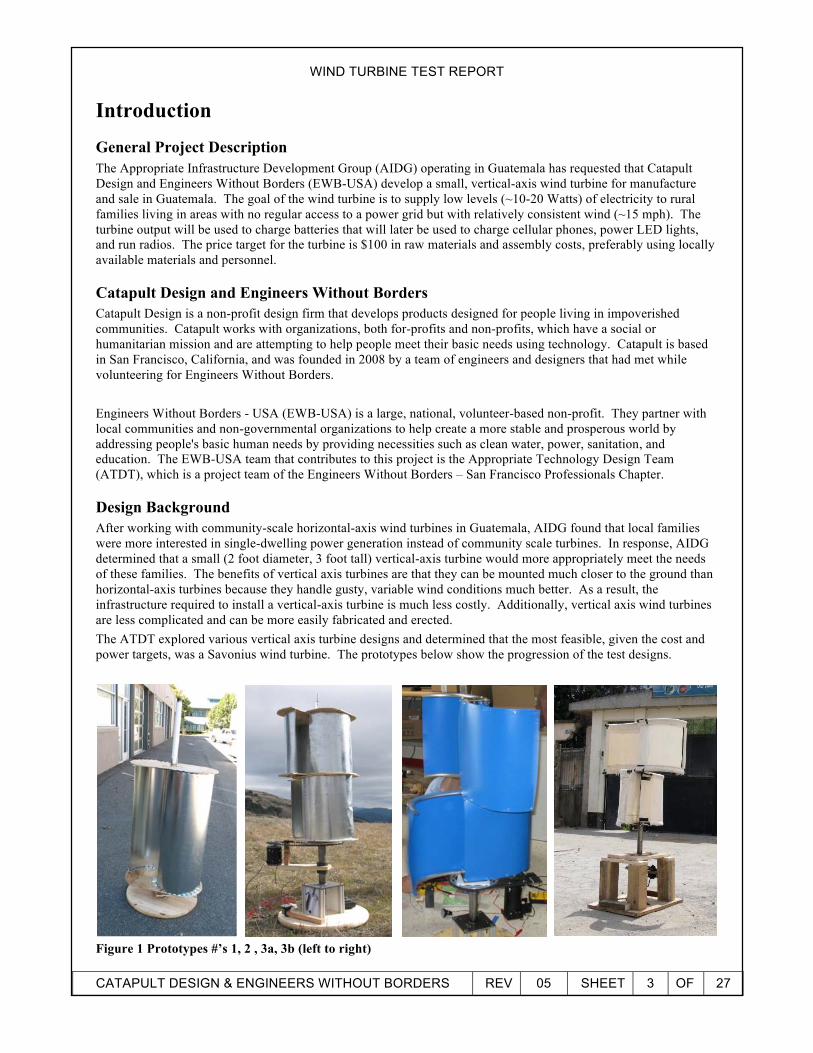
Design Background After working with community-scale horizontal-axis wind turbines in Guatemala, AIDG found that local families were more interested in single-dwelling power generation instead of community scale turbines. In response, AIDG determined that a small (2 foot diameter, 3 foot tall) vertical-axis turbine would more appropriately meet the needs of these families. The benefits of vertical axis turbines are that they can be mounted much closer to the ground than horizontal-axis turbines because they handle gusty, variable wind conditions much better. As a result, the infrastructure required to install a vertical-axis turbine is much less costly. Additionally, vertical axis wind turbines are less complicated and can be more easily fabricated and erected. The ATDT explored various vertical axis turbine designs and determined that the most feasible, given the cost and power targets, was a Savonius wind turbine. The prototypes below show the progression of the test designs.
Figure 1 Prototypes #’s 1, 2 , 3a, 3b (left to right)
WIND TURBINE TEST REPORT
CATAPULT DESIGN & ENGINEERS WITHOUT BORDERS REV 05 SHEET 4 OF 27
As can be seen in the photographs, Prototype #1 had only two blades and was made of sheet metal. As the design progressed, a second set of sheet metal blades was added in Prototype #2. In Prototype #3a the sheet metal blades were replaced with bent conduit and plastic sheet. Prototype #3b was fabricated in Guatemala and has bent conduit and sewn canvas blades. The final Savonius prototype, shown in Figure 3, was made of plywood disks and plastic sheet. In the course of exploring the Savonius design, the ATDT also encountered a similar vertical-axis design, the Lenz Turbine. The originator of the Lenz Turbine, Ed Lenz, claimed excellent performance characteristics for this turbine and the ATDT decided to fabricate one in order to compare it to the Savonius design. The Lenz Prototype can be seen in figure 2. Catapult Design became involved with the final Savonius and Lenz prototypes, and began to lead the development of the two rotor design for testing.
Test Background Two wind turbine rotor prototypes, Lenz and Savonius styles, were tested at the NASA-Ames Research Center at Moffett Field in the 7x10 Wind Tunnel operated by the US Army Aeroflightdynamics Directorate (AFDD). Prior to our use of the 7x10 Wind Tunnel, we had attempted to test the rotors in naturally occurring wind at locations as varied as Twin Peaks, Ocean Beach, and Candlestick Point (all in San Francisco, California). However, due to the unpredictable and uncontrollable nature of the wind, we were consistently unable to collect quality data. After a number of months spent unsuccessfully chasing the wind, we approached the AFDD with a request to use one of their tunnels to test our turbine designs. Our request was granted and in August of 2009 we were given full access to the 7x10 Wind Tunnel for two weeks. In the course of these tests we compared the two basic turbine rotor blade designs as well as three different angles of attack for the blades on each rotor.
Testing
Test Objectives The primary goal of these tests was to assess the general feasibility of the designs for the given objectives and constraints as well as to confirm the predicted power output of the turbines found in existing literature and documentation. Secondary goals were to characterize the performance of various blade geometries and angles of attack, to identify the superior blade geometry of those considered, and to produce data which would be used as the foundation for the design of an electrical generator. In order to accomplish these goals, the tests conducted in the 7x10 Wind Tunnel were focused on collecting the following rotor performance data across a range of wind speeds:
1. Mechanical torque generated by the rotor and rotational speed of the rotor, collected concurrently in a given wind speed.
2. Consistent tests for all the rotor geometries evaluated. 3. Power curves for all rotor geometries at specific, predetermined wind speeds. These curves were produced
from the torque and rotational speed data collected in #1. 4. Calculated efficiency of each rotor geometry using the power curves.
WIND TURBINE TEST REPORT
CATAPULT DESIGN & ENGINEERS WITHOUT BORDERS REV 05 SHEET 5 OF 27
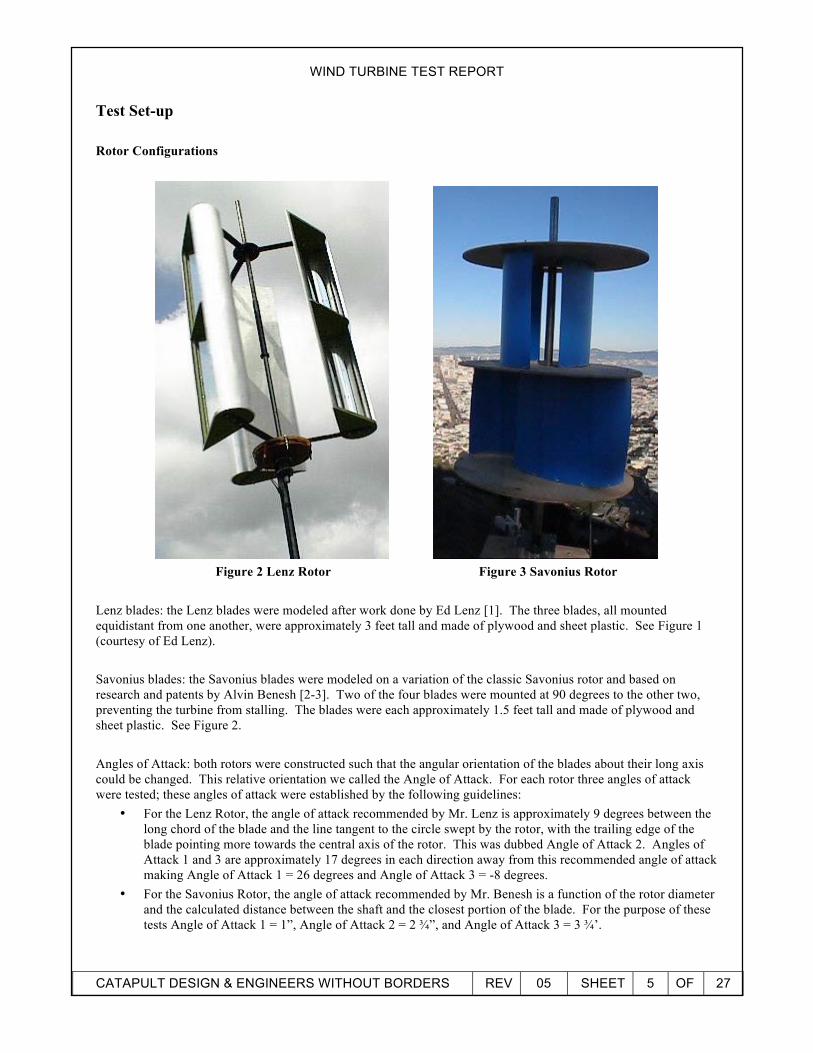
Test Set-up Rotor Configurations
Figure 2 Lenz Rotor Figure 3 Savonius Rotor Lenz blades: the Lenz blades were modeled after work done by Ed Lenz [1]. The three blades, all mounted equidistant from one another, were approximately 3 feet tall and made of plywood and sheet plastic. See Figure 1 (courtesy of Ed Lenz).
Savonius blades: the Savonius blades were modeled on a variation of the classic Savonius rotor and based on research and patents by Alvin Benesh [2-3]. Two of the four blades were mounted at 90 degrees to the other two, preventing the turbine from stalling. The blades were each approximately 1.5 feet tall and made of plywood and sheet plastic. See Figure 2. Angles of Attack: both rotors were constructed such that the angular orientation of the blades about their long axis could be changed. This relative orientation we called the Angle of Attack. For each rotor three angles of attack were tested; these angles of attack were established by the following guidelines:
• For the Lenz Rotor, the angle of attack recommended by Mr. Lenz is approximately 9 degrees between the long chord of the blade and the line tangent to the circle swept by the rotor, with the trailing edge of the blade pointing more towards the central axis of the rotor. This was dubbed Angle of Attack 2. Angles of Attack 1 and 3 are approximately 17 degrees in each direction away from this recommended angle of attack making Angle of Attack 1 = 26 degrees and Angle of Attack 3 = -8 degrees.
• For the Savonius Rotor, the angle of attack recommended by Mr. Benesh is a function of the rotor diameter and the calculated distance between the shaft and the closest portion of the blade. For the purpose of these tests Angle of Attack 1 = 1”, Angle of Attack 2 = 2 ¾”, and Angle of Attack 3 = 3 ¾’.
WIND TURBINE TEST REPORT
CATAPULT DESIGN & ENGINEERS WITHOUT BORDERS REV 05 SHEET 6 OF 27
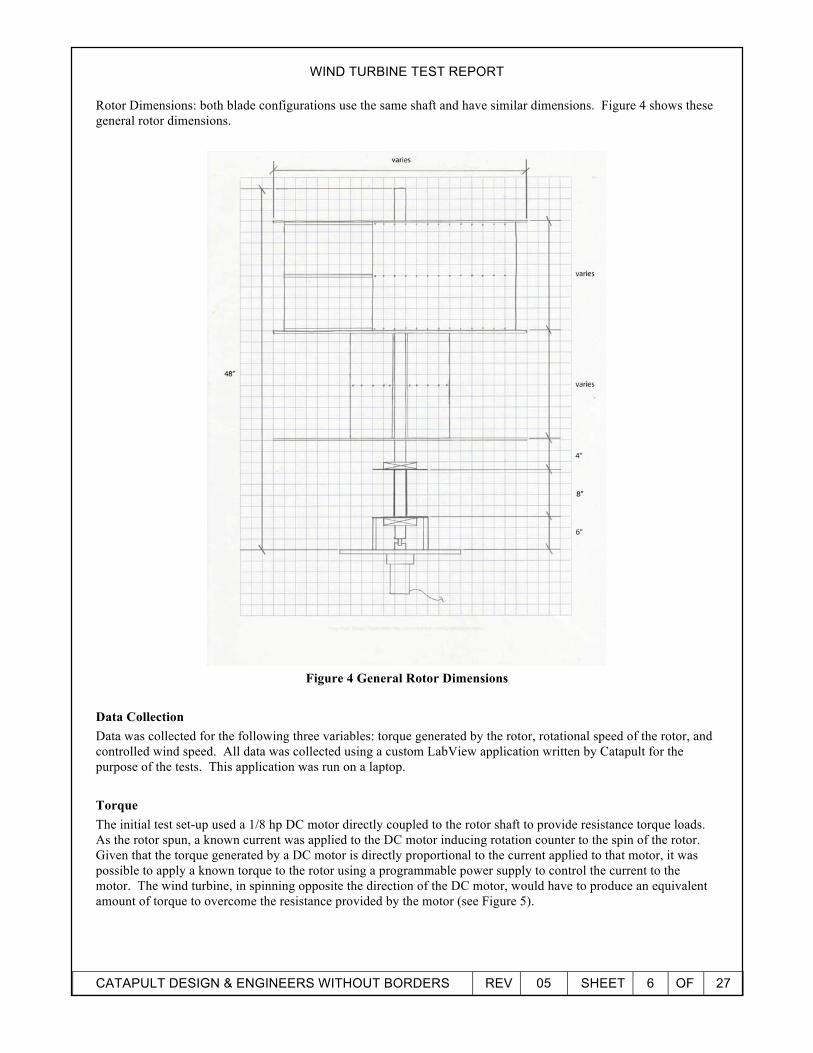
Rotor Dimensions: both blade configurations use the same shaft and have similar dimensions. Figure 4 shows these general rotor dimensions.
Figure 4 General Rotor Dimensions
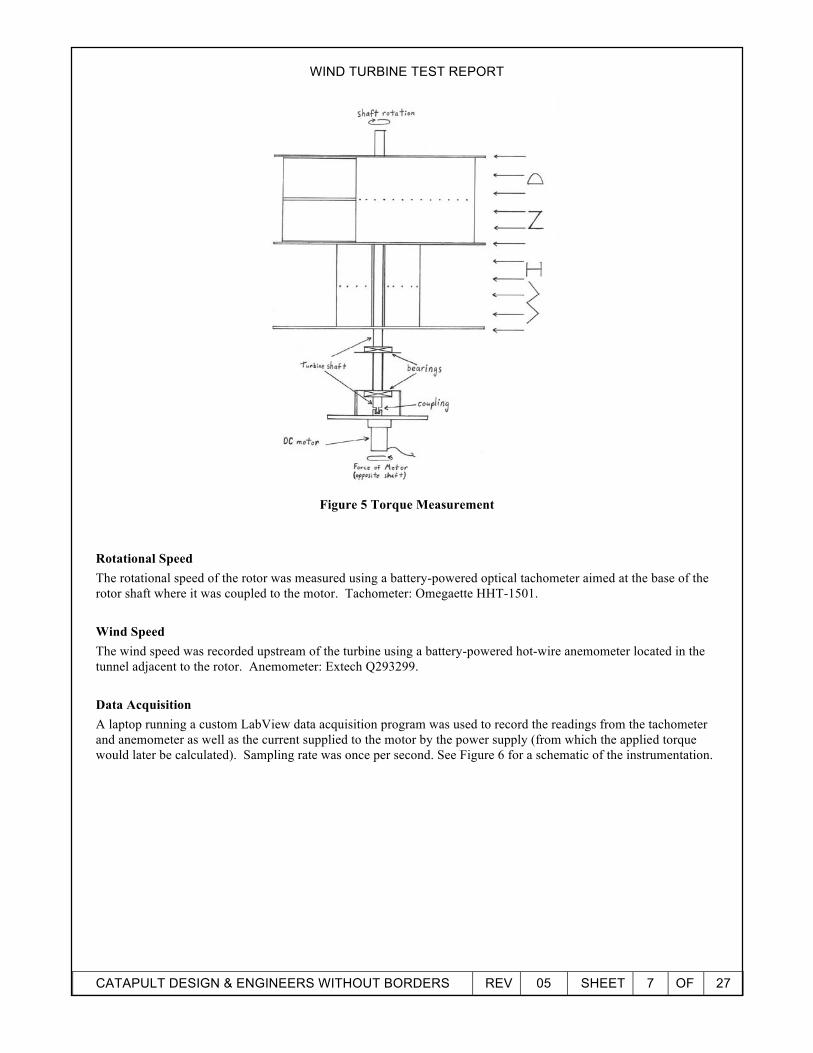
Data Collection Data was collected for the following three variables: torque generated by the rotor, rotational speed of the rotor, and controlled wind speed. All data was collected using a custom LabView application written by Catapult for the purpose of the tests. This application was run on a laptop. Torque The initial test set-up used a 1/8 hp DC motor directly coupled to the rotor shaft to provide resistance torque loads. As the rotor spun, a known current was applied to the DC motor inducing rotation counter to the spin of the rotor. Given that the torque generated by a DC motor is directly proportional to the current applied to that motor, it was possible to apply a known torque to the rotor using a programmable power supply to control the current to the motor. The wind turbine, in spinning opposite the direction of the DC motor, would have to produce an equivalent amount of torque to overcome the resistance provided by the motor (see Figure 5).
WIND TURBINE TEST REPORT
CATAPULT DESIGN & ENGINEERS WITHOUT BORDERS REV 05 SHEET 7 OF 27
Figure 5 Torque Measurement
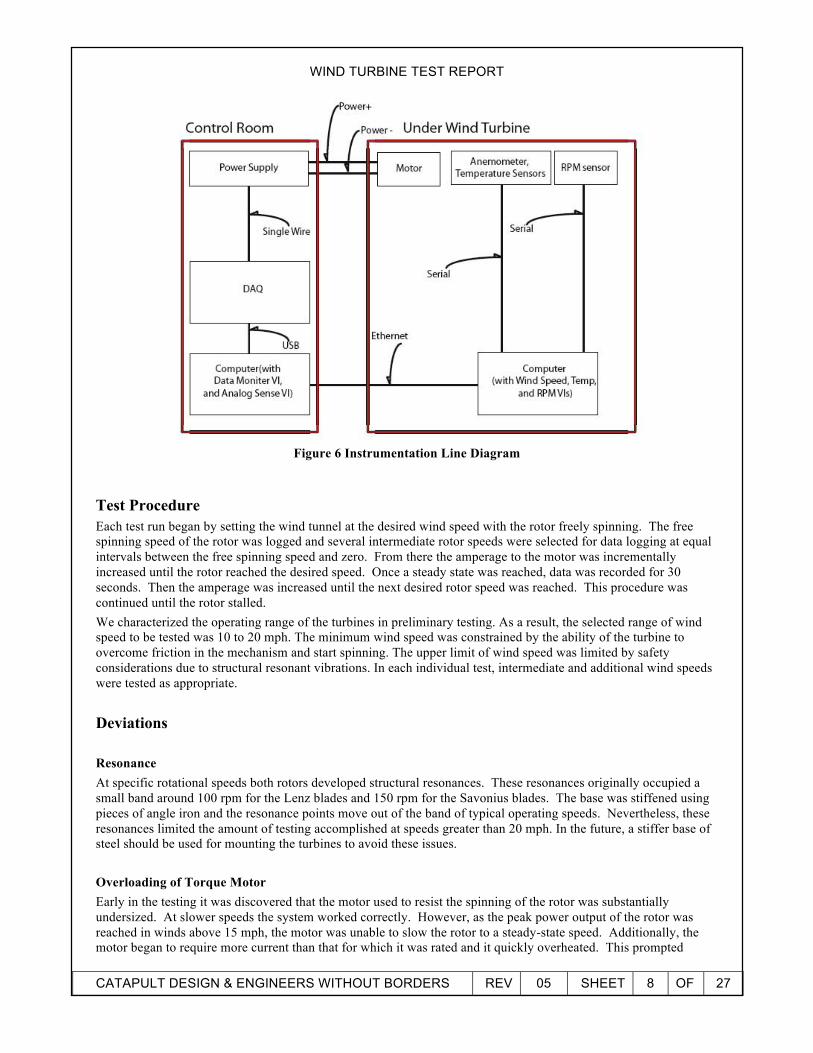
Rotational Speed The rotational speed of the rotor was measured using a battery-powered optical tachometer aimed at the base of the rotor shaft where it was coupled to the motor. Tachometer: Omegaette HHT-1501. Wind Speed The wind speed was recorded upstream of the turbine using a battery-powered hot-wire anemometer located in the tunnel adjacent to the rotor. Anemometer: Extech Q293299. Data Acquisition A laptop running a custom LabView data acquisition program was used to record the readings from the tachometer and anemometer as well as the current supplied to the motor by the power supply (from which the applied torque would later be calculated). Sampling rate was once per second. See Figure 6 for a schematic of the instrumentation.
WIND TURBINE TEST REPORT
CATAPULT DESIGN & ENGINEERS WITHOUT BORDERS REV 05 SHEET 8 OF 27
Figure 6 Instrumentation Line Diagram
Test Procedure Each test run began by setting the wind tunnel at the desired wind speed with the rotor freely spinning. The free spinning speed of the rotor was logged and several intermediate rotor speeds were selected for data logging at equal intervals between the free spinning speed and zero. From there the amperage to the motor was incrementally increased until the rotor reached the desired speed. Once a steady state was reached, data was recorded for 30 seconds. Then the amperage was increased until the next desired rotor speed was reached. This procedure was continued until the rotor stalled. We characterized the operating range of the turbines in preliminary testing. As a result, the selected range of wind speed to be tested was 10 to 20 mph. The minimum wind speed was constrained by the ability of the turbine to overcome friction in the mechanism and start spinning. The upper limit of wind speed was limited by safety considerations due to structural resonant vibrations. In each individual test, intermediate and additional wind speeds were tested as appropriate. Deviations Resonance At specific rotational speeds both rotors developed structural resonances. These resonances originally occupied a small band around 100 rpm for the Lenz blades and 150 rpm for the Savonius blades. The base was stiffened using pieces of angle iron and the resonance points move out of the band of typical operating speeds. Nevertheless, these resonances limited the amount of testing accomplished at speeds greater than 20 mph. In the future, a stiffer base of steel should be used for mounting the turbines to avoid these issues. Overloading of Torque Motor Early in the testing it was discovered that the motor used to resist the spinning of the rotor was substantially undersized. At slower speeds the system worked correctly. However, as the peak power output of the rotor was reached in winds above 15 mph, the motor was unable to slow the rotor to a steady-state speed. Additionally, the motor began to require more current than that for which it was rated and it quickly overheated. This prompted
WIND TURBINE TEST REPORT
CATAPULT DESIGN & ENGINEERS WITHOUT BORDERS REV 05 SHEET 9 OF 27
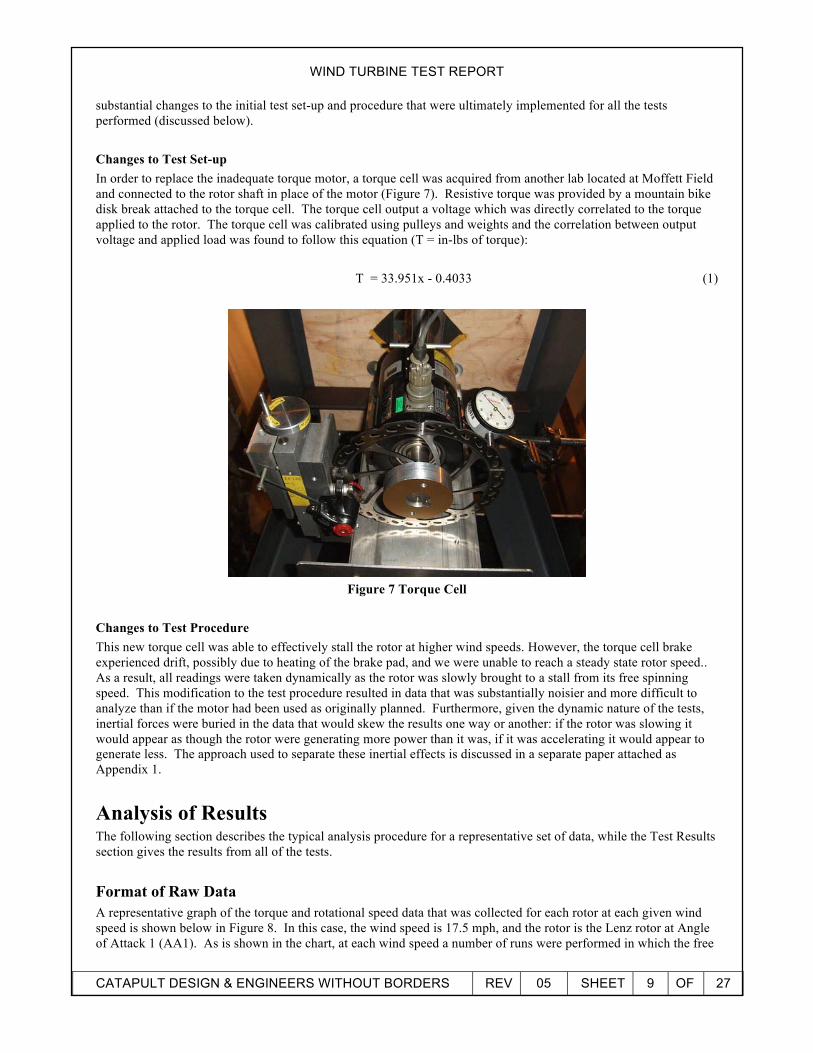
substantial changes to the initial test set-up and procedure that were ultimately implemented for all the tests performed (discussed below). Changes to Test Set-up In order to replace the inadequate torque motor, a torque cell was acquired from another lab located at Moffett Field and connected to the rotor shaft in place of the motor (Figure 7). Resistive torque was provided by a mountain bike disk break attached to the torque cell. The torque cell output a voltage which was directly correlated to the torque applied to the rotor. The torque cell was calibrated using pulleys and weights and the correlation between output voltage and applied load was found to follow this equation (T = in-lbs of torque):
T = 33.951x - 0.4033 (1)
Figure 7 Torque Cell
Changes to Test Procedure This new torque cell was able to effectively stall the rotor at higher wind speeds. However, the torque cell brake experienced drift, possibly due to heating of the brake pad, and we were unable to reach a steady state rotor speed.. As a result, all readings were taken dynamically as the rotor was slowly brought to a stall from its free spinning speed. This modification to the test procedure resulted in data that was substantially noisier and more difficult to analyze than if the motor had been used as originally planned. Furthermore, given the dynamic nature of the tests, inertial forces were buried in the data that would skew the results one way or another: if the rotor was slowing it would appear as though the rotor were generating more power than it was, if it was accelerating it would appear to generate less. The approach used to separate these inertial effects is discussed in a separate paper attached as Appendix 1.
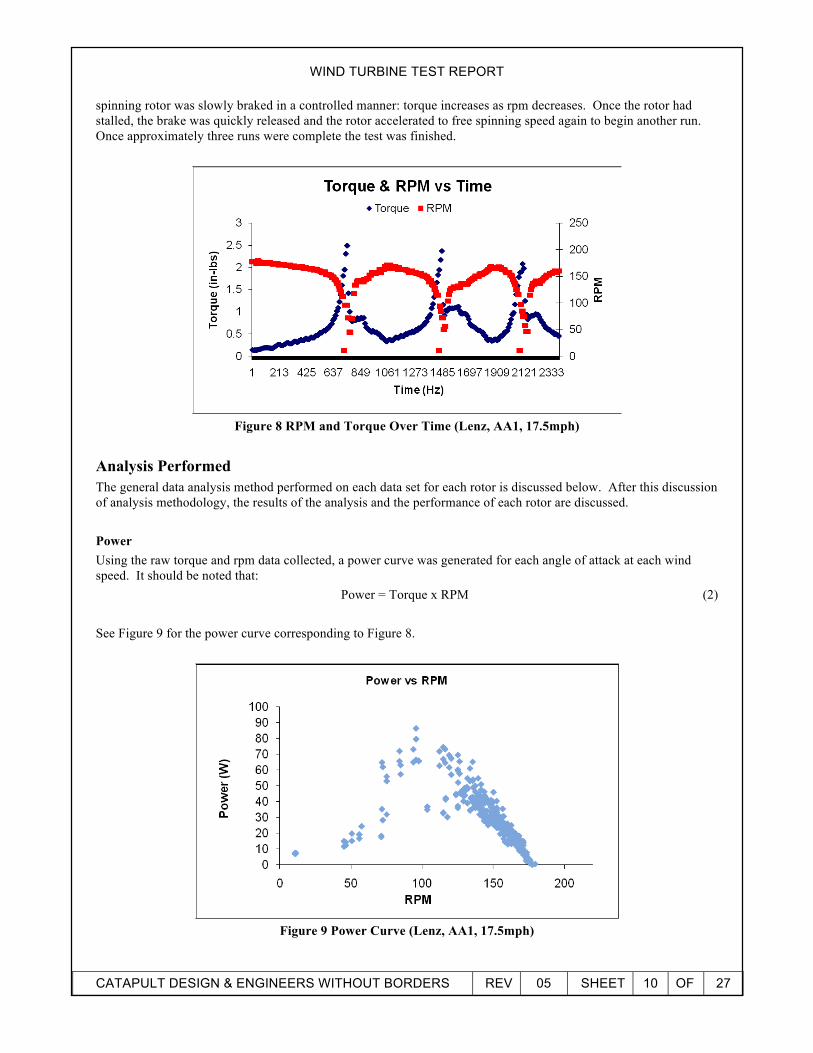
Analysis of Results The following section describes the typical analysis procedure for a representative set of data, while the Test Results section gives the results from all of the tests. Format of Raw Data A representative graph of the torque and rotational speed data that was collected for each rotor at each given wind speed is shown below in Figure 8. In this case, the wind speed is 17.5 mph, and the rotor is the Lenz rotor at Angle of Attack 1 (AA1). As is shown in the chart, at each wind speed a number of runs were performed in which the free
WIND TURBINE TEST REPORT
CATAPULT DESIGN & ENGINEERS WITHOUT BORDERS REV 05 SHEET 10 OF 27
spinning rotor was slowly braked in a controlled manner: torque increases as rpm decreases. Once the rotor had stalled, the brake was quickly released and the rotor accelerated to free spinning speed again to begin another run. Once approximately three runs were complete the test was finished.
Figure 8 RPM and Torque Over Time (Lenz, AA1, 17.5mph)
Analysis Performed The general data analysis method performed on each data set for each rotor is discussed below. After this discussion of analysis methodology, the results of the analysis and the performance of each rotor are discussed. Power Using the raw torque and rpm data collected, a power curve was generated for each angle of attack at each wind speed. It should be noted that:
Power = Torque x RPM (2) See Figure 9 for the power curve corresponding to Figure 8.
Figure 9 Power Curve (Lenz, AA1, 17.5mph)
WIND TURBINE TEST REPORT
CATAPULT DESIGN & ENGINEERS WITHOUT BORDERS REV 05 SHEET 11 OF 27
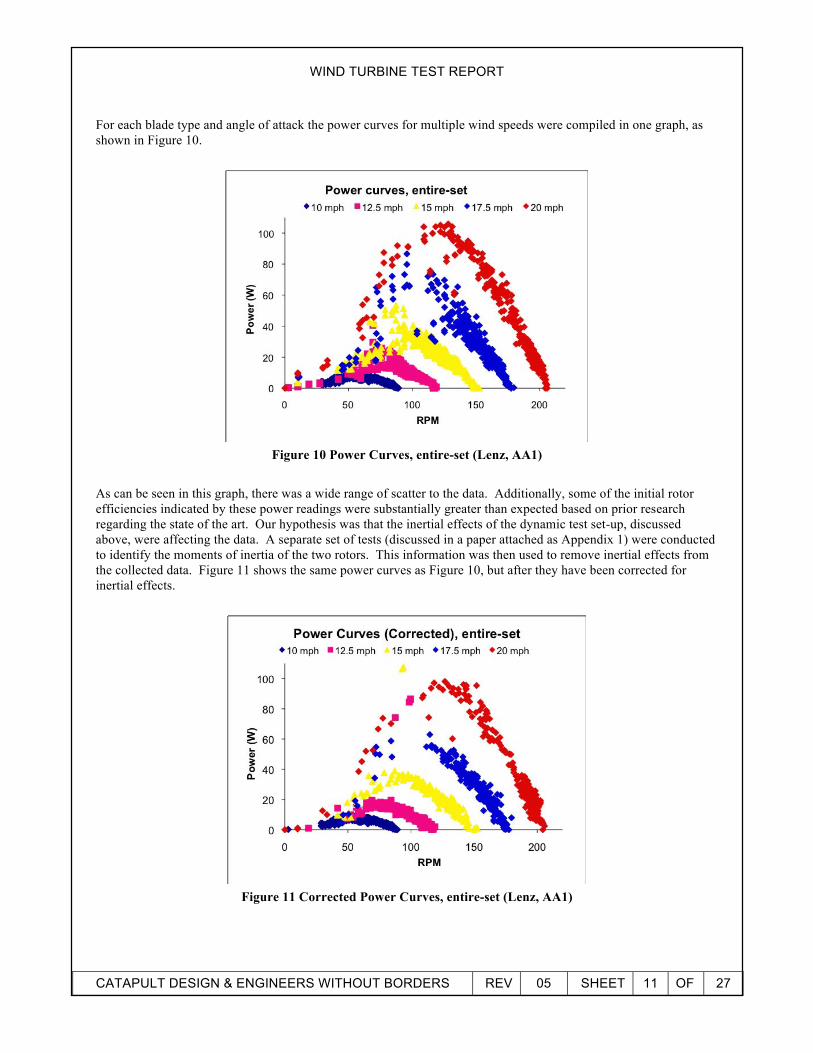
For each blade type and angle of attack the power curves for multiple wind speeds were compiled in one graph, as shown in Figure 10.
Figure 10 Power Curves, entire-set (Lenz, AA1)
As can be seen in this graph, there was a wide range of scatter to the data. Additionally, some of the initial rotor efficiencies indicated by these power readings were substantially greater than expected based on prior research regarding the state of the art. Our hypothesis was that the inertial effects of the dynamic test set-up, discussed above, were affecting the data. A separate set of tests (discussed in a paper attached as Appendix 1) were conducted to identify the moments of inertia of the two rotors. This information was then used to remove inertial effects from the collected data. Figure 11 shows the same power curves as Figure 10, but after they have been corrected for inertial effects.
Figure 11 Corrected Power Curves, entire-set (Lenz, AA1)
WIND TURBINE TEST REPORT
CATAPULT DESIGN & ENGINEERS WITHOUT BORDERS REV 05 SHEET 12 OF 27
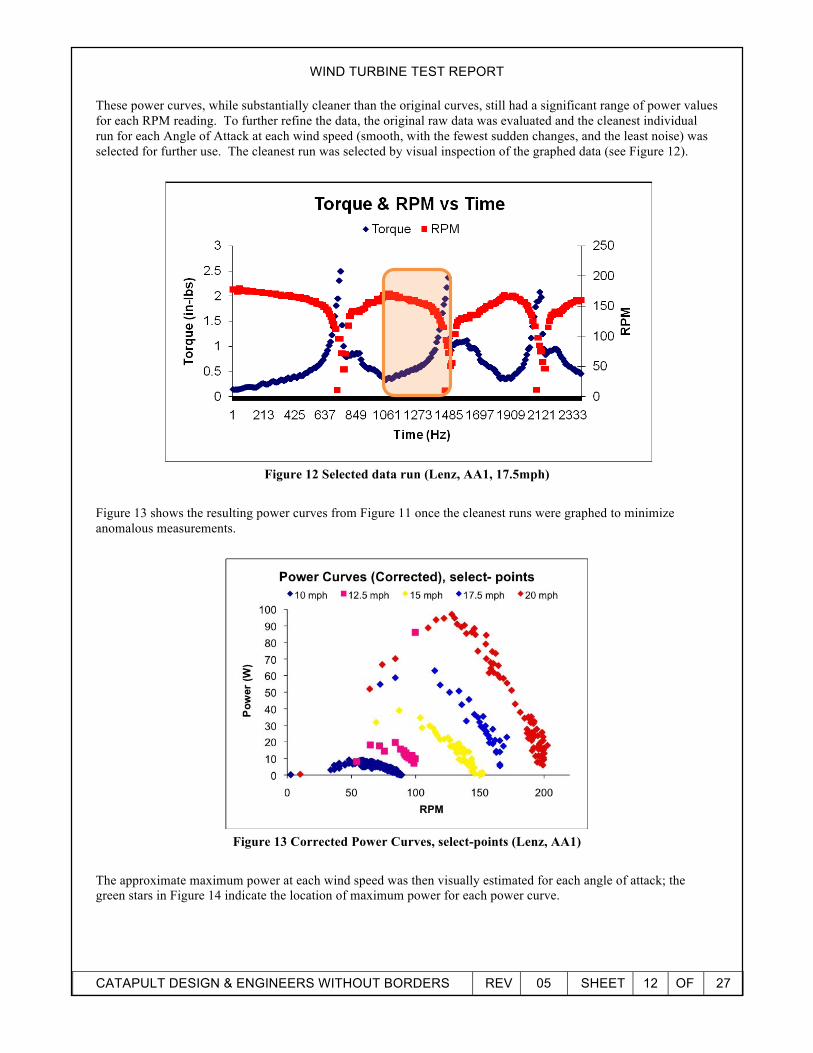
These power curves, while substantially cleaner than the original curves, still had a significant range of power values for each RPM reading. To further refine the data, the original raw data was evaluated and the cleanest individual run for each Angle of Attack at each wind speed (smooth, with the fewest sudden changes, and the least noise) was selected for further use. The cleanest run was selected by visual inspection of the graphed data (see Figure 12).
Figure 12 Selected data run (Lenz, AA1, 17.5mph)
Figure 13 shows the resulting power curves from Figure 11 once the cleanest runs were graphed to minimize anomalous measurements.
Figure 13 Corrected Power Curves, select-points (Lenz, AA1)
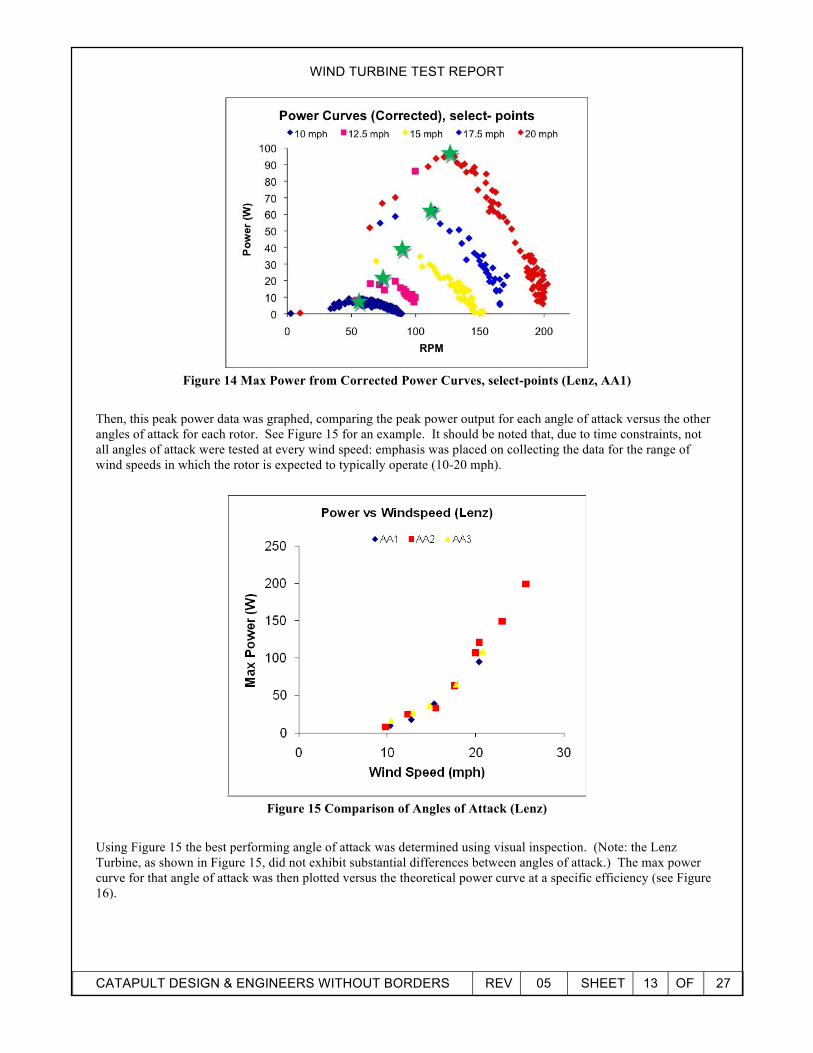
The approximate maximum power at each wind speed was then visually estimated for each angle of attack; the green stars in Figure 14 indicate the location of maximum power for each power curve.
WIND TURBINE TEST REPORT
CATAPULT DESIGN & ENGINEERS WITHOUT BORDERS REV 05 SHEET 13 OF 27
Figure 14 Max Power from Corrected Power Curves, select-points (Lenz, AA1)
Then, this peak power data was graphed, comparing the peak power output for each angle of attack versus the other angles of attack for each rotor. See Figure 15 for an example. It should be noted that, due to time constraints, not all angles of attack were tested at every wind speed: emphasis was placed on collecting the data for the range of wind speeds in which the rotor is expected to typically operate (10-20 mph).
Figure 15 Comparison of Angles of Attack (Lenz)
Using Figure 15 the best performing angle of attack was determined using visual inspection. (Note: the Lenz Turbine, as shown in Figure 15, did not exhibit substantial differences between angles of attack.) The max power curve for that angle of attack was then plotted versus the theoretical power curve at a specific efficiency (see Figure 16).
WIND TURBINE TEST REPORT
CATAPULT DESIGN & ENGINEERS WITHOUT BORDERS REV 05 SHEET 14 OF 27
Maximum Efficiency (Cp) The maximum efficiency (Cp) of each rotor was determined by first calculating the maximum efficiency at each point. This was done by dividing the maximum power measured in the rotor versus the calculated theoretical power available in the wind at each wind speed:
Cp =Protor/ Pwind (3) Where: Cp = efficiency Protor = power at rotor (Watts) Pwind = power available in the wind (Watts) The maximum efficiencies at each wind speed were then averaged to produce a general maximum rotor efficiency. The theoretical power in the wind was calculated using the following equation, which represents the amount of energy present in the wind and available to the rotor.
Pwind = 0.5 x rho x A x V3 (4) Where: Pwind = power available in the wind (Watts) rho = air density (1.225 kg/m3) A = swept area of rotor (m2) V = velocity of wind (m/s) Finally, the theoretical power available to the rotor was calculated using the following equation.
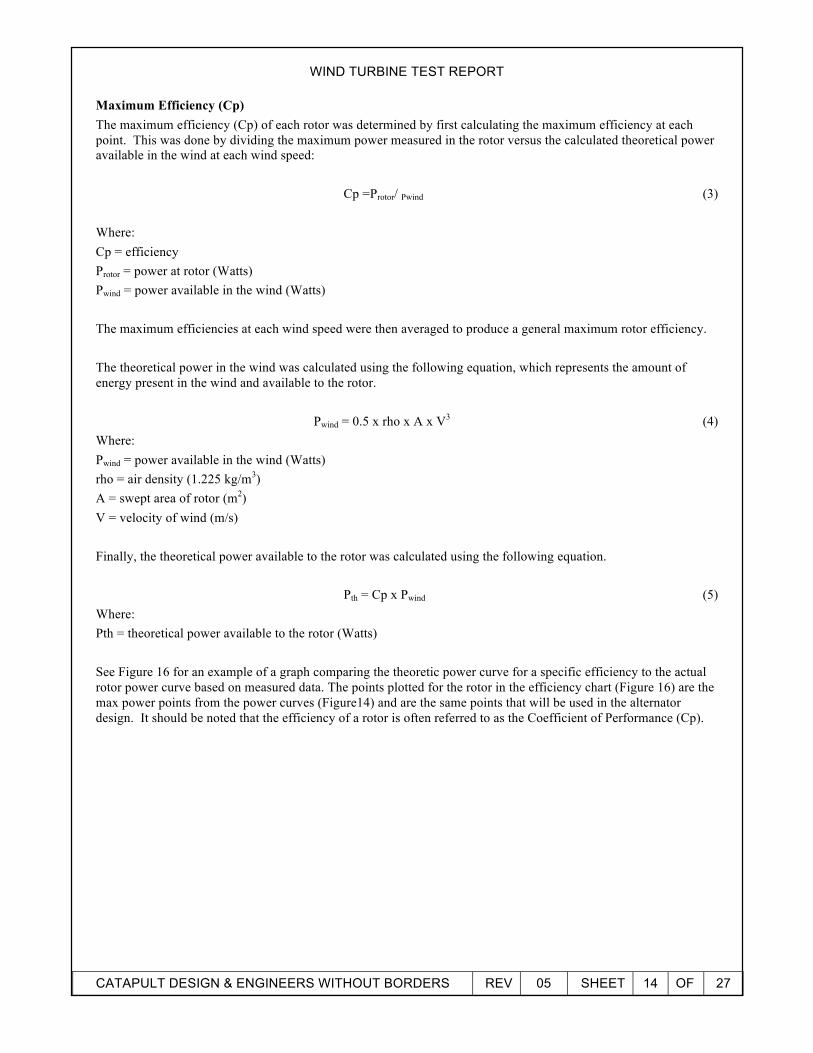
Pth = Cp x Pwind (5) Where: Pth = theoretical power available to the rotor (Watts) See Figure 16 for an example of a graph comparing the theoretic power curve for a specific efficiency to the actual rotor power curve based on measured data. The points plotted for the rotor in the efficiency chart (Figure 16) are the max power points from the power curves (Figure14) and are the same points that will be used in the alternator design. It should be noted that the efficiency of a rotor is often referred to as the Coefficient of Performance (Cp).
WIND TURBINE TEST REPORT
CATAPULT DESIGN & ENGINEERS WITHOUT BORDERS REV 05 SHEET 15 OF 27
Figure 16 Lenz vs Efficiency (AA1)
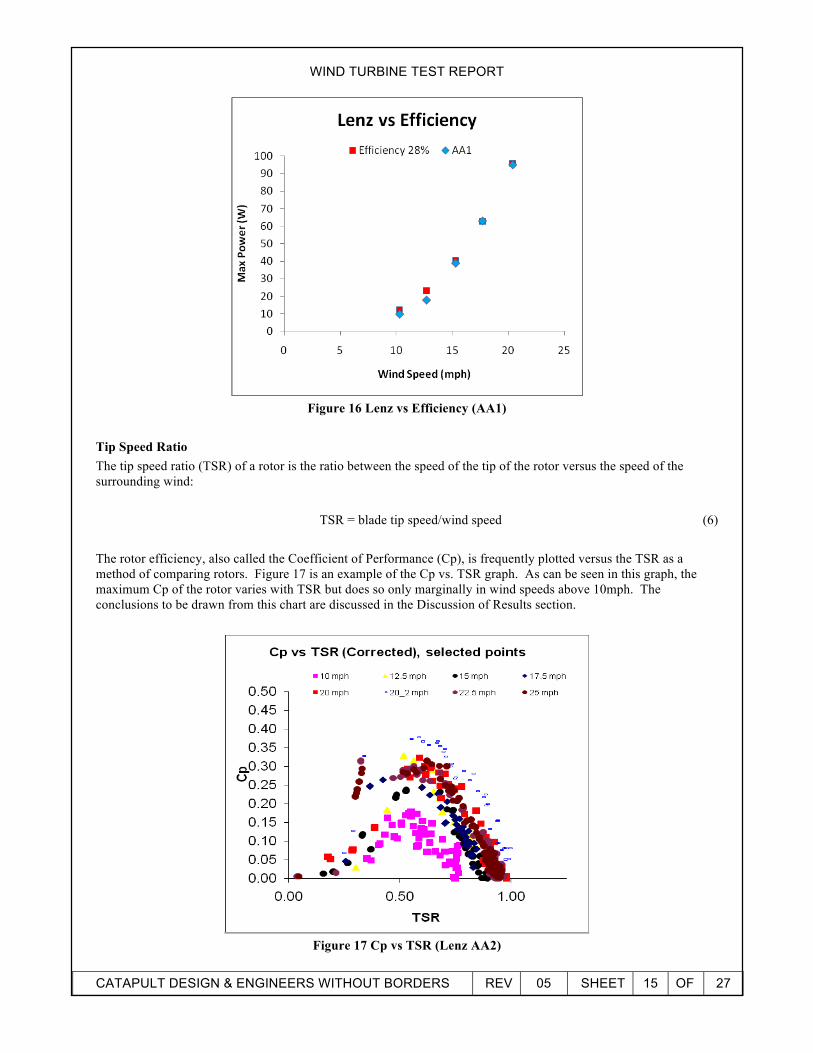
Tip Speed Ratio The tip speed ratio (TSR) of a rotor is the ratio between the speed of the tip of the rotor versus the speed of the surrounding wind:
TSR = blade tip speed/wind speed (6) The rotor efficiency, also called the Coefficient of Performance (Cp), is frequently plotted versus the TSR as a method of comparing rotors. Figure 17 is an example of the Cp vs. TSR graph. As can be seen in this graph, the maximum Cp of the rotor varies with TSR but does so only marginally in wind speeds above 10mph. The conclusions to be drawn from this chart are discussed in the Discussion of Results section.
Figure 17 Cp vs TSR (Lenz AA2)
WIND TURBINE TEST REPORT
CATAPULT DESIGN & ENGINEERS WITHOUT BORDERS REV 05 SHEET 16 OF 27
Test Results
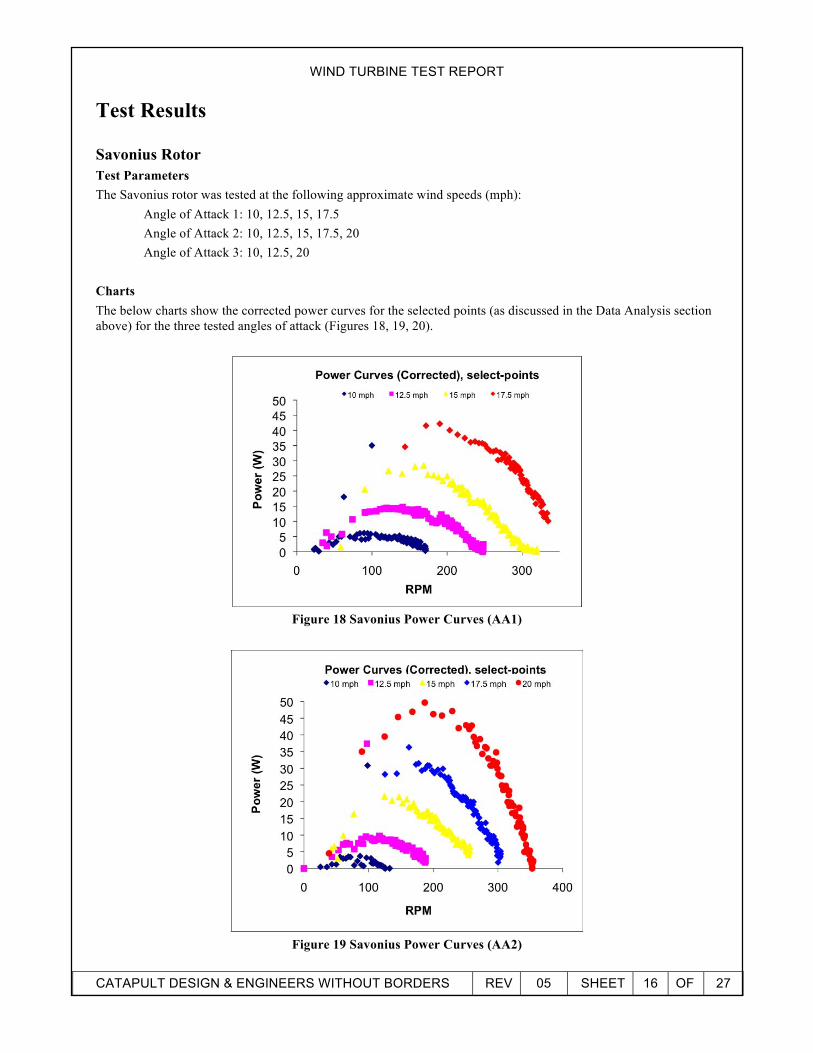
Savonius Rotor Test Parameters The Savonius rotor was tested at the following approximate wind speeds (mph): Angle of Attack 1: 10, 12.5, 15, 17.5 Angle of Attack 2: 10, 12.5, 15, 17.5, 20 Angle of Attack 3: 10, 12.5, 20 Charts The below charts show the corrected power curves for the selected points (as discussed in the Data Analysis section above) for the three tested angles of attack (Figures 18, 19, 20).
Figure 18 Savonius Power Curves (AA1)
Figure 19 Savonius Power Curves (AA2)
WIND TURBINE TEST REPORT
CATAPULT DESIGN & ENGINEERS WITHOUT BORDERS REV 05 SHEET 17 OF 27
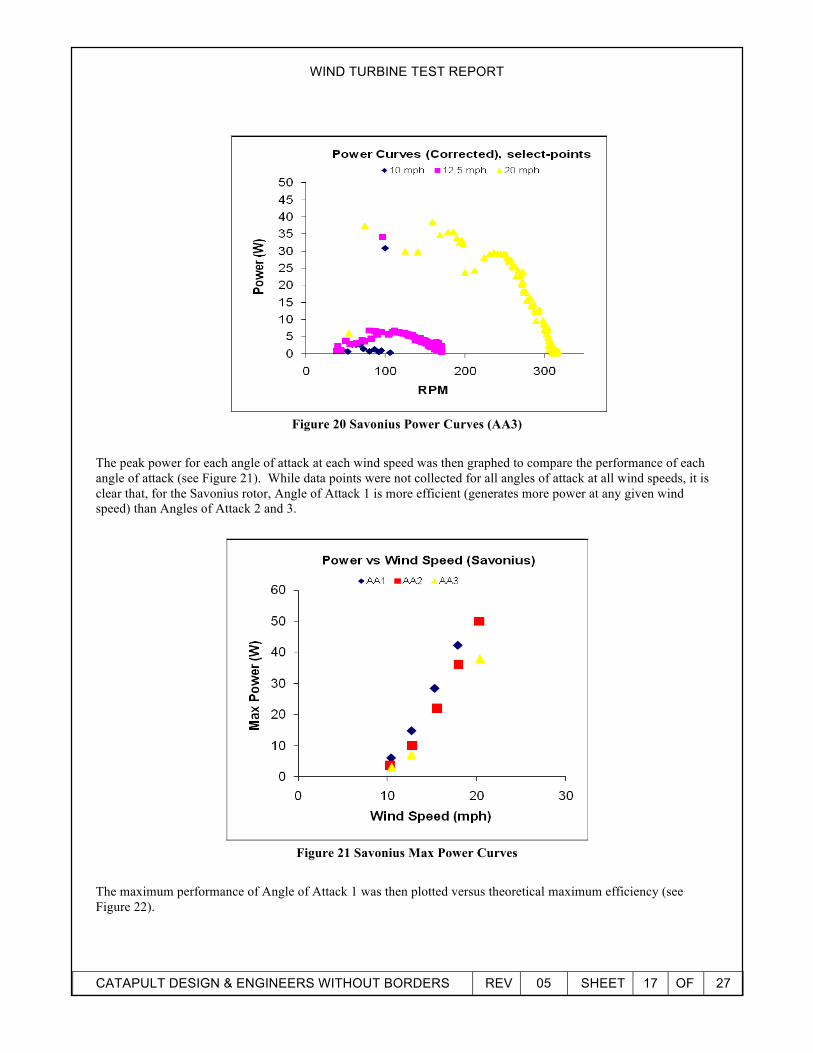
Figure 20 Savonius Power Curves (AA3)
The peak power for each angle of attack at each wind speed was then graphed to compare the performance of each angle of attack (see Figure 21). While data points were not collected for all angles of attack at all wind speeds, it is clear that, for the Savonius rotor, Angle of Attack 1 is more efficient (generates more power at any given wind speed) than Angles of Attack 2 and 3.
Figure 21 Savonius Max Power Curves
The maximum performance of Angle of Attack 1 was then plotted versus theoretical maximum efficiency (see Figure 22).
WIND TURBINE TEST REPORT
CATAPULT DESIGN & ENGINEERS WITHOUT BORDERS REV 05 SHEET 18 OF 27
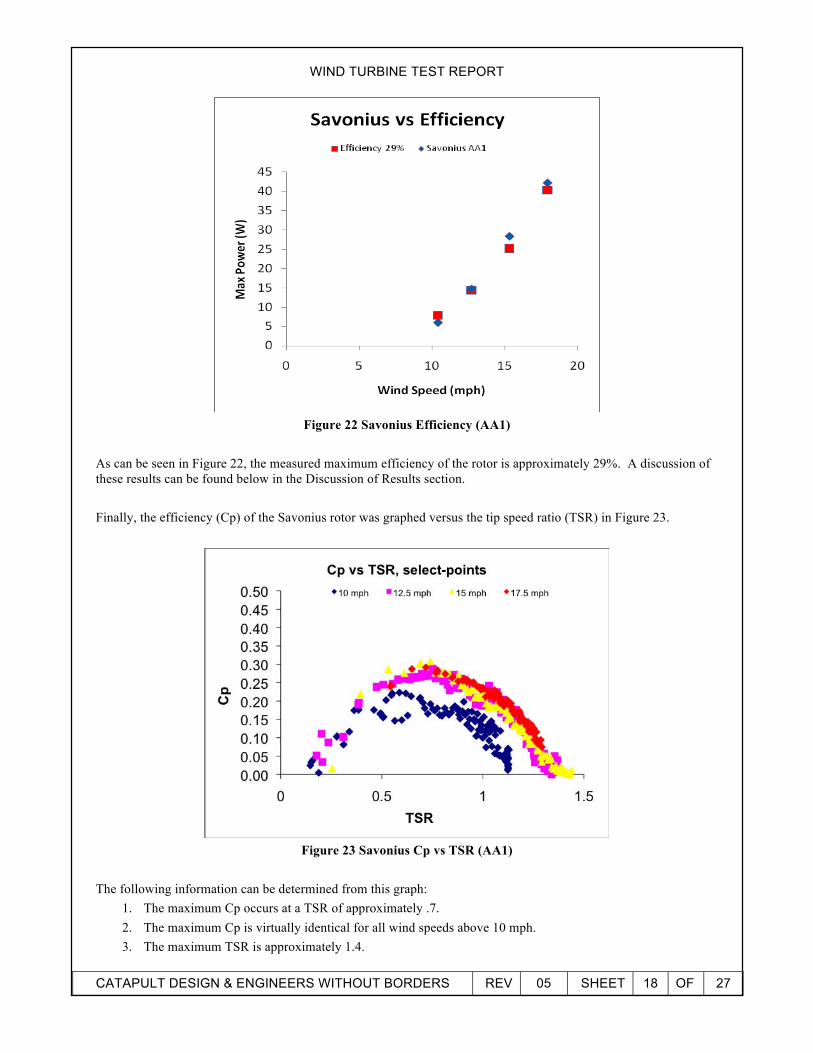
Figure 22 Savonius Efficiency (AA1)
As can be seen in Figure 22, the measured maximum efficiency of the rotor is approximately 29%. A discussion of these results can be found below in the Discussion of Results section. Finally, the efficiency (Cp) of the Savonius rotor was graphed versus the tip speed ratio (TSR) in Figure 23.
Figure 23 Savonius Cp vs TSR (AA1)
The following information can be determined from this graph:
1. The maximum Cp occurs at a TSR of approximately .7. 2. The maximum Cp is virtually identical for all wind speeds above 10 mph. 3. The maximum TSR is approximately 1.4.
WIND TURBINE TEST REPORT
CATAPULT DESIGN & ENGINEERS WITHOUT BORDERS REV 05 SHEET 19 OF 27
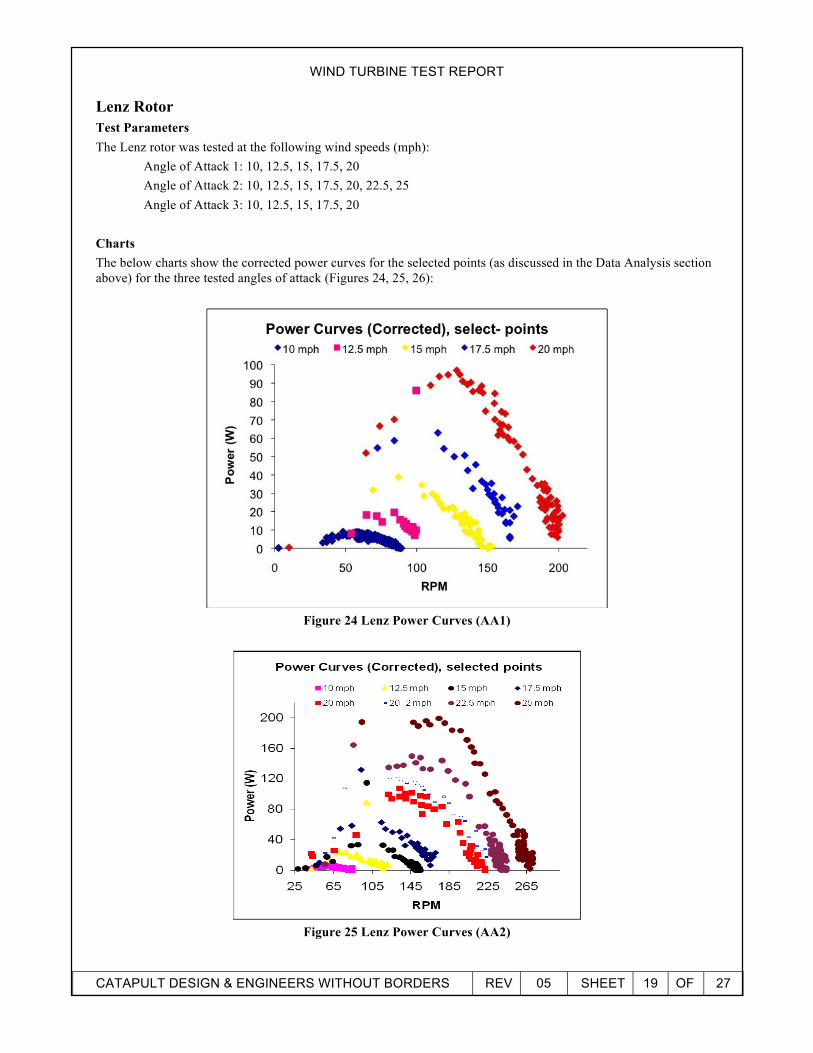
Lenz Rotor Test Parameters The Lenz rotor was tested at the following wind speeds (mph): Angle of Attack 1: 10, 12.5, 15, 17.5, 20 Angle of Attack 2: 10, 12.5, 15, 17.5, 20, 22.5, 25 Angle of Attack 3: 10, 12.5, 15, 17.5, 20 Charts The below charts show the corrected power curves for the selected points (as discussed in the Data Analysis section above) for the three tested angles of attack (Figures 24, 25, 26):
Figure 24 Lenz Power Curves (AA1)
Figure 25 Lenz Power Curves (AA2)
WIND TURBINE TEST REPORT
CATAPULT DESIGN & ENGINEERS WITHOUT BORDERS REV 05 SHEET 20 OF 27
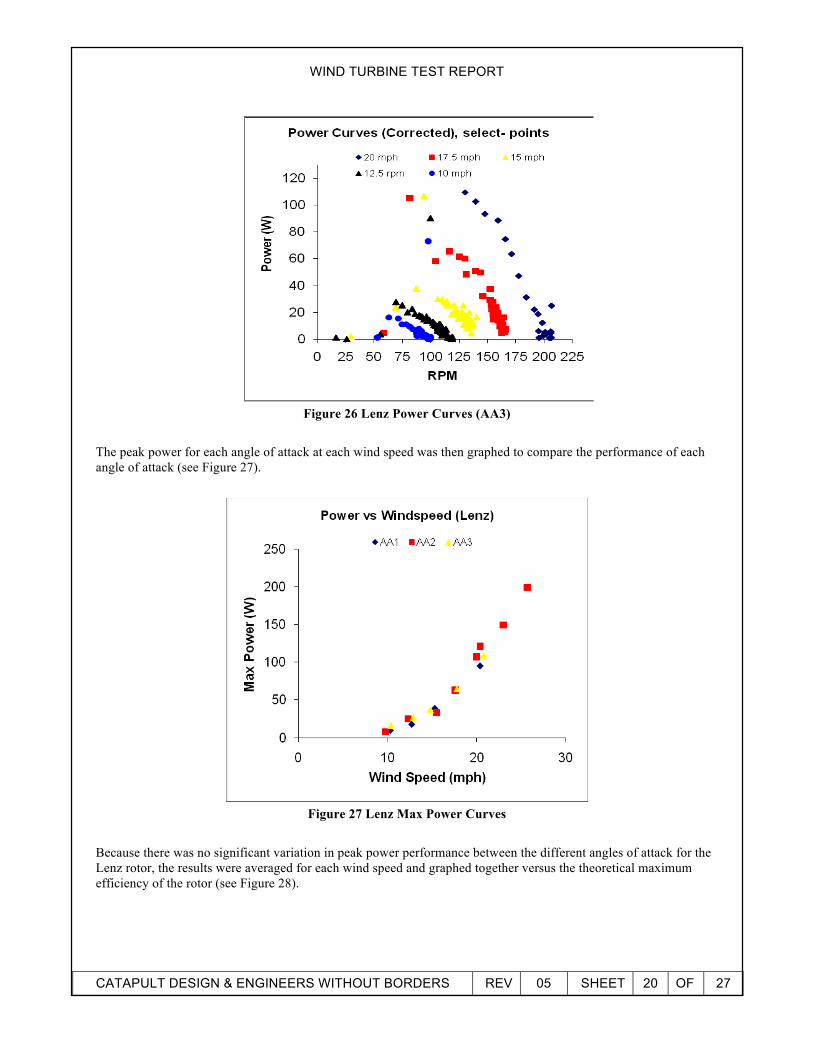
Figure 26 Lenz Power Curves (AA3)
The peak power for each angle of attack at each wind speed was then graphed to compare the performance of each angle of attack (see Figure 27).
Figure 27 Lenz Max Power Curves
Because there was no significant variation in peak power performance between the different angles of attack for the Lenz rotor, the results were averaged for each wind speed and graphed together versus the theoretical maximum efficiency of the rotor (see Figure 28).
WIND TURBINE TEST REPORT
CATAPULT DESIGN & ENGINEERS WITHOUT BORDERS REV 05 SHEET 21 OF 27
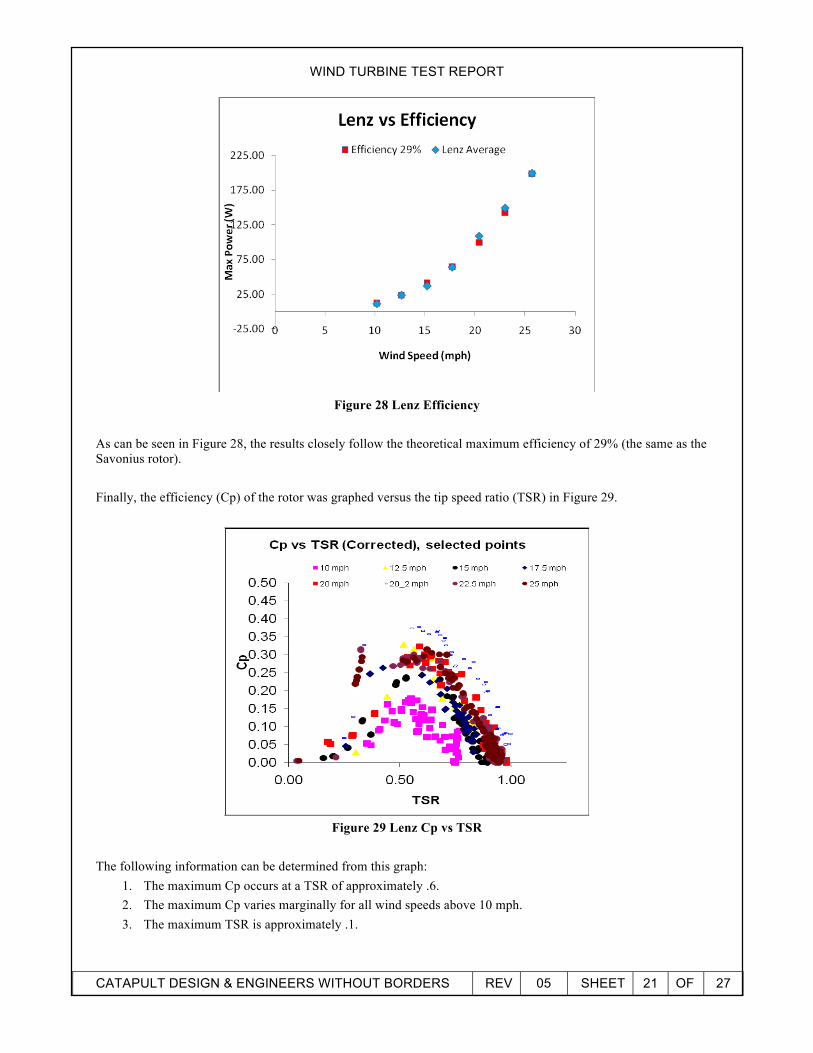
Figure 28 Lenz Efficiency
As can be seen in Figure 28, the results closely follow the theoretical maximum efficiency of 29% (the same as the Savonius rotor). Finally, the efficiency (Cp) of the rotor was graphed versus the tip speed ratio (TSR) in Figure 29.
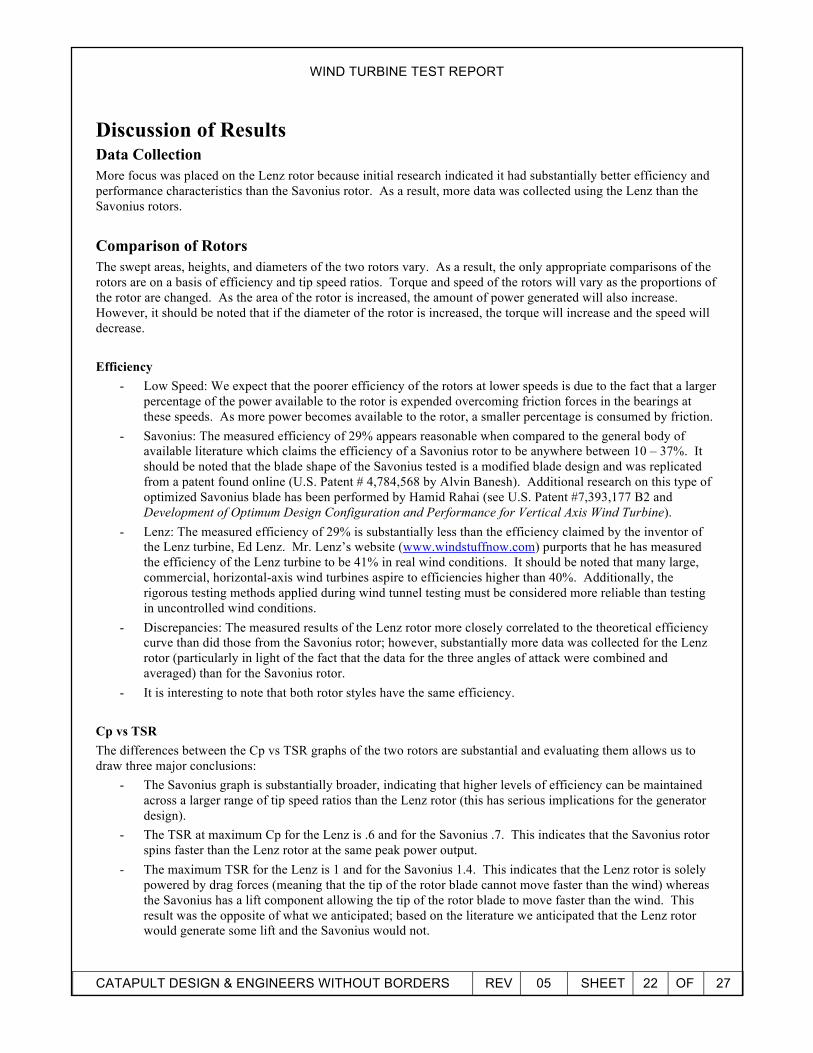
Figure 29 Lenz Cp vs TSR
The following information can be determined from this graph:
1. The maximum Cp occurs at a TSR of approximately .6. 2. The maximum Cp varies marginally for all wind speeds above 10 mph. 3. The maximum TSR is approximately .1.
WIND TURBINE TEST REPORT
CATAPULT DESIGN & ENGINEERS WITHOUT BORDERS REV 05 SHEET 22 OF 27
Discussion of Results Data Collection More focus was placed on the Lenz rotor because initial research indicated it had substantially better efficiency and performance characteristics than the Savonius rotor. As a result, more data was collected using the Lenz than the Savonius rotors. Comparison of Rotors The swept areas, heights, and diameters of the two rotors vary. As a result, the only appropriate comparisons of the rotors are on a basis of efficiency and tip speed ratios. Torque and speed of the rotors will vary as the proportions of the rotor are changed. As the area of the rotor is increased, the amount of power generated will also increase. However, it should be noted that if the diameter of the rotor is increased, the torque will increase and the speed will decrease. Efficiency
- Low Speed: We expect that the poorer efficiency of the rotors at lower speeds is due to the fact that a larger percentage of the power available to the rotor is expended overcoming friction forces in the bearings at these speeds. As more power becomes available to the rotor, a smaller percentage is consumed by friction.
- Savonius: The measured efficiency of 29% appears reasonable when compared to the general body of available literature which claims the efficiency of a Savonius rotor to be anywhere between 10 – 37%. It should be noted that the blade shape of the Savonius tested is a modified blade design and was replicated from a patent found online (U.S. Patent # 4,784,568 by Alvin Banesh). Additional research on this type of optimized Savonius blade has been performed by Hamid Rahai (see U.S. Patent #7,393,177 B2 and Development of Optimum Design Configuration and Performance for Vertical Axis Wind Turbine).
- Lenz: The measured efficiency of 29% is substantially less than the efficiency claimed by the inventor of the Lenz turbine, Ed Lenz. Mr. Lenz’s website (www.windstuffnow.com) purports that he has measured the efficiency of the Lenz turbine to be 41% in real wind conditions. It should be noted that many large, commercial, horizontal-axis wind turbines aspire to efficiencies higher than 40%. Additionally, the rigorous testing methods applied during wind tunnel testing must be considered more reliable than testing in uncontrolled wind conditions.
- Discrepancies: The measured results of the Lenz rotor more closely correlated to the theoretical efficiency curve than did those from the Savonius rotor; however, substantially more data was collected for the Lenz rotor (particularly in light of the fact that the data for the three angles of attack were combined and averaged) than for the Savonius rotor.
- It is interesting to note that both rotor styles have the same efficiency.
Cp vs TSR The differences between the Cp vs TSR graphs of the two rotors are substantial and evaluating them allows us to draw three major conclusions:
- The Savonius graph is substantially broader, indicating that higher levels of efficiency can be maintained across a larger range of tip speed ratios than the Lenz rotor (this has serious implications for the generator design).
- The TSR at maximum Cp for the Lenz is .6 and for the Savonius .7. This indicates that the Savonius rotor spins faster than the Lenz rotor at the same peak power output.
- The maximum TSR for the Lenz is 1 and for the Savonius 1.4. This indicates that the Lenz rotor is solely powered by drag forces (meaning that the tip of the rotor blade cannot move faster than the wind) whereas the Savonius has a lift component allowing the tip of the rotor blade to move faster than the wind. This result was the opposite of what we anticipated; based on the literature we anticipated that the Lenz rotor would generate some lift and the Savonius would not.
WIND TURBINE TEST REPORT
CATAPULT DESIGN & ENGINEERS WITHOUT BORDERS REV 05 SHEET 23 OF 27
Other Performance Factors - Resonance: Both rotors experienced shaking due to structural resonance as the rotors spun. However, the
resonance seemed to occur at lower frequencies and with greater intensity in the Lenz rotor as compared to the Savonius.
- Start-up: The wind speed at which each rotor would begin spinning varies substantially depending on the starting orientation of the rotor to the direction of the wind. However, the Lenz rotor exhibited a greater propensity to stall during start-up if it was not oriented correctly.
Validation of Results The data collected and resulting conclusions have been validated through comparison to other research documents as well as secondary tests. Research materials The following research documents indicate that the Savonius rotor performance documented in this report are reasonable and fit within the current body of technical research.
- Development of Optimum Design Configuration and Performance for Vertical Axis Wind Turbine [4] - Experimental investigations on single stage modified Savonius Rotor [5]
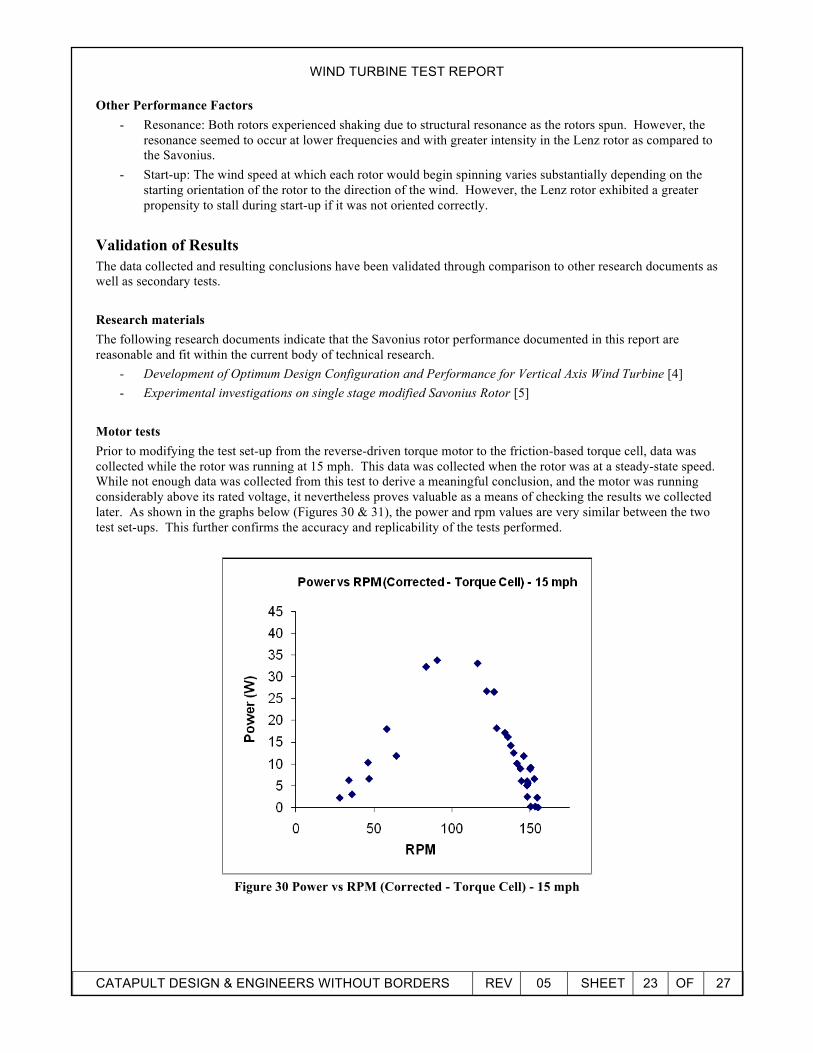
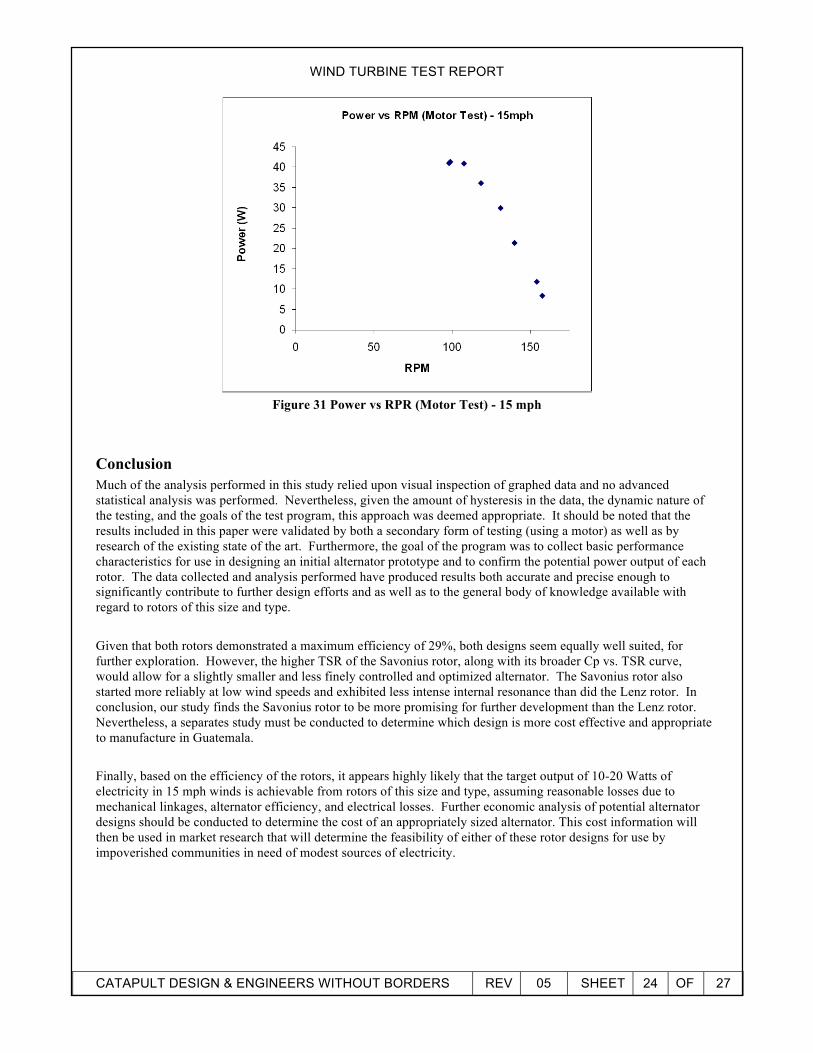
Motor tests Prior to modifying the test set-up from the reverse-driven torque motor to the friction-based torque cell, data was collected while the rotor was running at 15 mph. This data was collected when the rotor was at a steady-state speed. While not enough data was collected from this test to derive a meaningful conclusion, and the motor was running considerably above its rated voltage, it nevertheless proves valuable as a means of checking the results we collected later. As shown in the graphs below (Figures 30 & 31), the power and rpm values are very similar between the two test set-ups. This further confirms the accuracy and replicability of the tests performed.
Figure 30 Power vs RPM (Corrected - Torque Cell) - 15 mph
WIND TURBINE TEST REPORT
CATAPULT DESIGN & ENGINEERS WITHOUT BORDERS REV 05 SHEET 24 OF 27
Figure 31 Power vs RPR (Motor Test) - 15 mph
Conclusion Much of the analysis performed in this study relied upon visual inspection of graphed data and no advanced statistical analysis was performed. Nevertheless, given the amount of hysteresis in the data, the dynamic nature of the testing, and the goals of the test program, this approach was deemed appropriate. It should be noted that the results included in this paper were validated by both a secondary form of testing (using a motor) as well as by research of the existing state of the art. Furthermore, the goal of the program was to collect basic performance characteristics for use in designing an initial alternator prototype and to confirm the potential power output of each rotor. The data collected and analysis performed have produced results both accurate and precise enough to significantly contribute to further design efforts and as well as to the general body of knowledge available with regard to rotors of this size and type. Given that both rotors demonstrated a maximum efficiency of 29%, both designs seem equally well suited, for further exploration. However, the higher TSR of the Savonius rotor, along with its broader Cp vs. TSR curve, would allow for a slightly smaller and less finely controlled and optimized alternator. The Savonius rotor also started more reliably at low wind speeds and exhibited less intense internal resonance than did the Lenz rotor. In conclusion, our study finds the Savonius rotor to be more promising for further development than the Lenz rotor. Nevertheless, a separates study must be conducted to determine which design is more cost effective and appropriate to manufacture in Guatemala. Finally, based on the efficiency of the rotors, it appears highly likely that the target output of 10-20 Watts of electricity in 15 mph winds is achievable from rotors of this size and type, assuming reasonable losses due to mechanical linkages, alternator efficiency, and electrical losses. Further economic analysis of potential alternator designs should be conducted to determine the cost of an appropriately sized alternator. This cost information will then be used in market research that will determine the feasibility of either of these rotor designs for use by impoverished communities in need of modest sources of electricity.
WIND TURBINE TEST REPORT
CATAPULT DESIGN & ENGINEERS WITHOUT BORDERS REV 05 SHEET 25 OF 27
Security This test was run for Catapult Design and Engineers Without Borders, both non-profit organizations testing a rotor for the developing world. All information is non-proprietary, but all data/video recording during wind tunnel testing belongs solely to Catapult Design and Engineers Without Borders.
Special Thanks To the U.S. Army Aeroflightdynamics Directorate and the personnel who volunteered their time. In particular, Nili Gold, Jose Navarrete, and Farid.
WIND TURBINE TEST REPORT
CATAPULT DESIGN & ENGINEERS WITHOUT BORDERS REV 05 SHEET 26 OF 27
References 1. Lenz, Ed. “VAWT.” WindStuffNow. Web. August 2008. 2. Benesh, Alvin. “Wind Turbine System Using a Vertical Axis Savonius-type Rotor.” US Patent 4784568.
15 Nov. 1988. 3. Rahai, Hamid R. et al. “Vertical Axis Wind Turbine with Optimized Blade Profile.” US Patent 7393177
B2. 1 July 2008. 4. Rahai, Hamid R. “Development of Optimum Design Configuration and Performance for Vertical Axis
Wind Turbine: Feasibility Analysis and Final EISG Report.” California Energy Commission Publications: CEC-500-2005-084. May 2005.
5. Kamoji, M.A., S.B. Kedare, and S.V. Prabhu. “Experimental Investigations on Single Stage Modified Savonius Rotor.” Applied Energy Volume 86, Issues 7-8, July-August 2009: 1064-1073.
WIND TURBINE TEST REPORT
CATAPULT DESIGN & ENGINEERS WITHOUT BORDERS REV 05 SHEET 27 OF 27
Appendix Appendix 1: ATDT Wind Turbine Inertia Tests
ATDT Wind Turbine Inertia Tests
Sarah Felix
Revision 1, January 2010
1 Background
Due to the braking configuration during wind tunnel testing, we were unable to obtain steadystate torque measurements at different wind speeds. We instead measured torque while vary-ing the turbine RPM as slowly as possible. However, the dynamic nature of the measurementintroduced inertial effects. For example, the torque reading would be higher than expected(relative to the anticipated torque curve shape) as we were slowing the turbine down becauseof the extra torque required to decelerate the turbine. The following measurements attemptedto identify the inertia of the Lenz turbine. Friction and drag forces are also significant, so themeasurements included these effects as well.
2 Method
2.1 Physical Tests
Two dynamic tests were performed to obtain enough independent relationships in order tosolve for inertia, friction, and drag parameters.
• TEST 1: Start the turbine spinning and release. Measure rotational speed versus timeuntil the turbine slows to a stop.
• TEST 2: Hang a known mass from the end of a string that is attached to the turbineshaft using a pulley. Release the weight and allow it to drop, accelerating the turbine.Measure rotational speed versus time until the mass reached the floor.
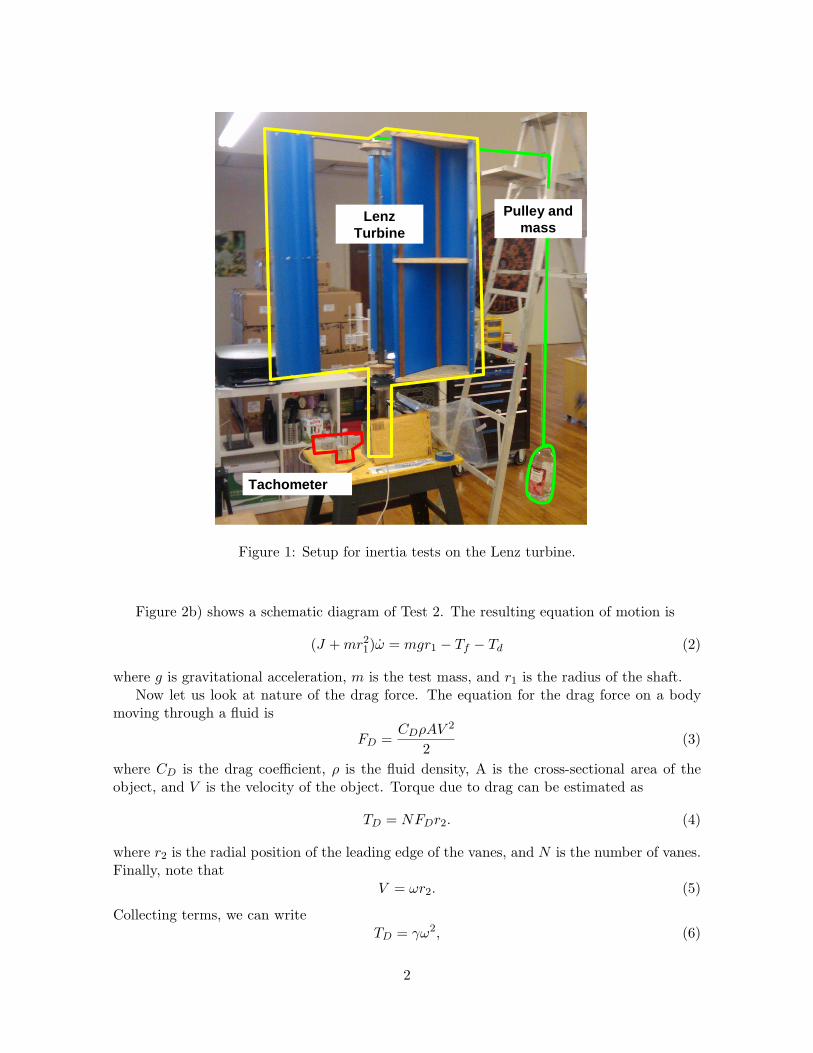
Rotational speed was measured using a tachometer focused on the shaft of the turbine.Data from the tachometer was collected using LabView. Figure 1 shows the test setup con-figured for Test 2.
2.2 Theory and Data Processing
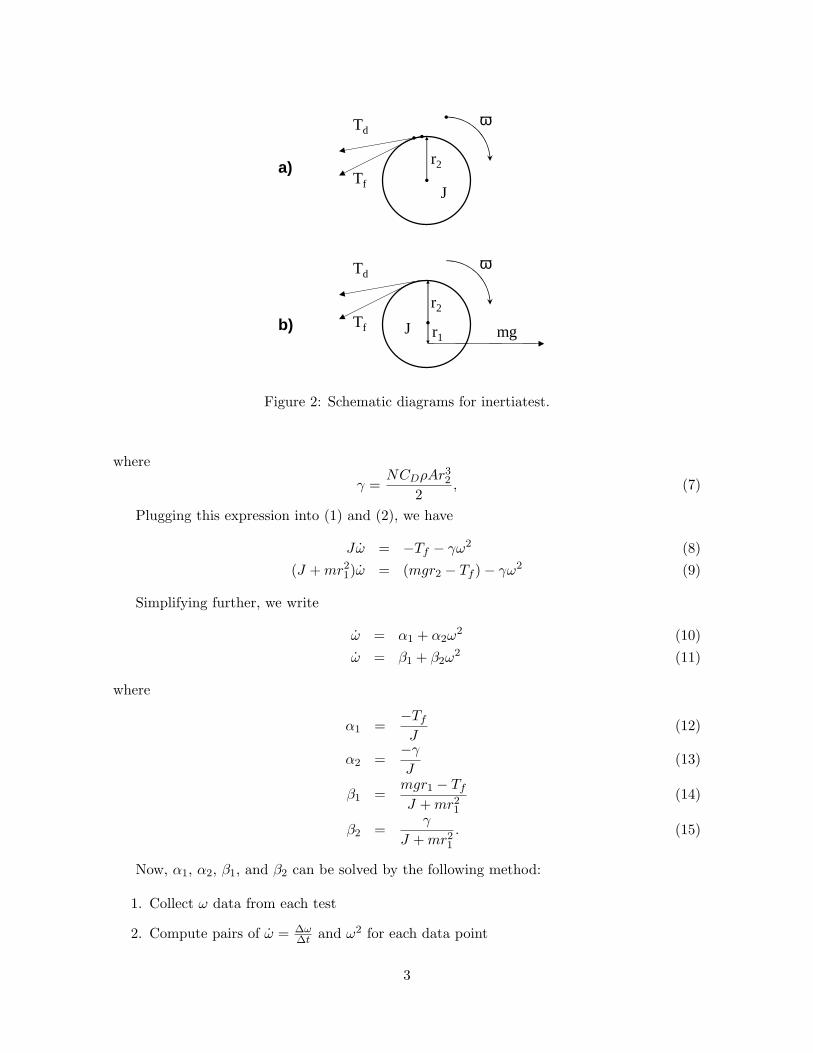
Figure 2a) shows a schematic diagram of Test 1. The resulting equation of motion is
Jω̇ = −Tf − Td (1)
where J is the rotational inertia of the turbine, ω is the rotational speed of the turbine, Tf isthe frictional force, assumed to be constant, and Td is the drag force.
1
Tachometer
Pulley and mass
Lenz Turbine
Figure 1: Setup for inertia tests on the Lenz turbine.
Figure 2b) shows a schematic diagram of Test 2. The resulting equation of motion is
(J + mr21)ω̇ = mgr1 − Tf − Td (2)
where g is gravitational acceleration, m is the test mass, and r1 is the radius of the shaft.Now let us look at nature of the drag force. The equation for the drag force on a body
moving through a fluid is
FD =CDρAV 2
2(3)
where CD is the drag coefficient, ρ is the fluid density, A is the cross-sectional area of theobject, and V is the velocity of the object. Torque due to drag can be estimated as
TD = NFDr2. (4)
where r2 is the radial position of the leading edge of the vanes, and N is the number of vanes.Finally, note that
V = ωr2. (5)
Collecting terms, we can writeTD = γω2, (6)
2
ω
r2
Td
TfJ
ω
r2
Td
Tf J r1 mg
a)
b)
Figure 2: Schematic diagrams for inertiatest.
where
γ =NCDρAr3
2
2, (7)
Plugging this expression into (1) and (2), we have
Jω̇ = −Tf − γω2 (8)(J + mr2
1)ω̇ = (mgr2 − Tf )− γω2 (9)
Simplifying further, we write
ω̇ = α1 + α2ω2 (10)
ω̇ = β1 + β2ω2 (11)
where
α1 =−Tf
J(12)
α2 =−γ
J(13)
β1 =mgr1 − Tf
J + mr21
(14)
β2 =γ
J + mr21
. (15)
Now, α1, α2, β1, and β2 can be solved by the following method:
1. Collect ω data from each test
2. Compute pairs of ω̇ = ∆ω∆t and ω2 for each data point
3
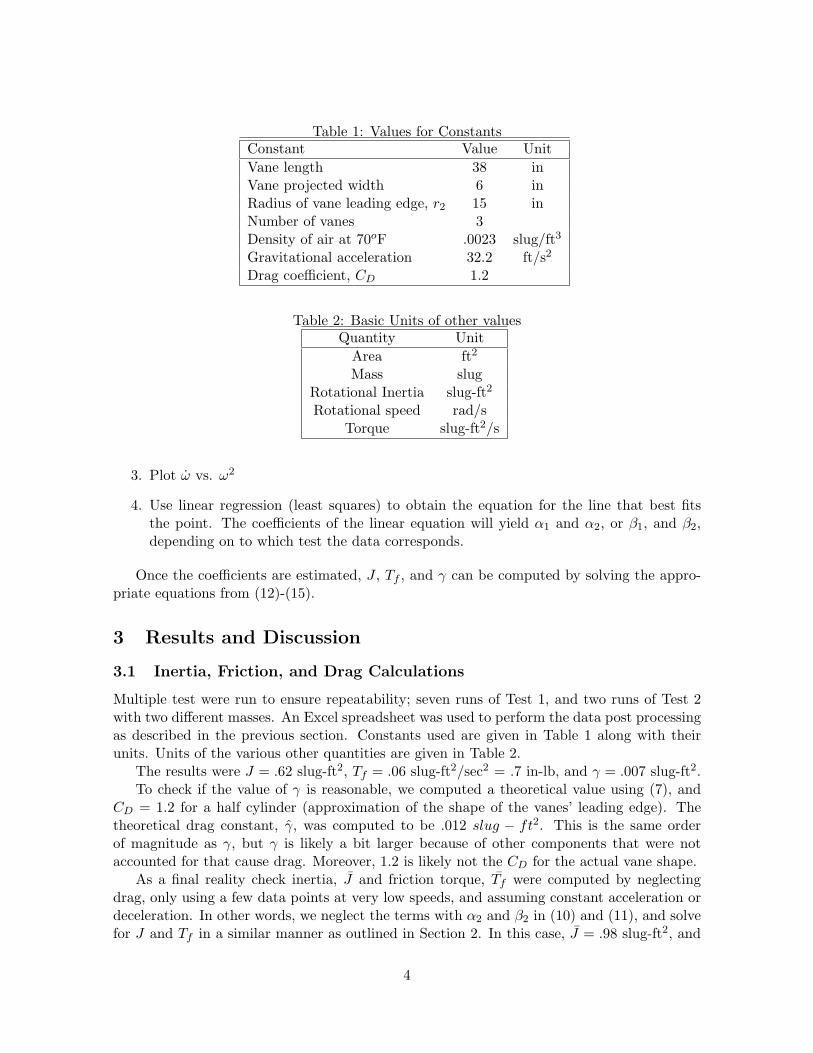
Table 1: Values for ConstantsConstant Value UnitVane length 38 inVane projected width 6 inRadius of vane leading edge, r2 15 inNumber of vanes 3Density of air at 70oF .0023 slug/ft3
Gravitational acceleration 32.2 ft/s2
Drag coefficient, CD 1.2
Table 2: Basic Units of other valuesQuantity Unit
Area ft2
Mass slugRotational Inertia slug-ft2
Rotational speed rad/sTorque slug-ft2/s
3. Plot ω̇ vs. ω2
4. Use linear regression (least squares) to obtain the equation for the line that best fitsthe point. The coefficients of the linear equation will yield α1 and α2, or β1, and β2,depending on to which test the data corresponds.
Once the coefficients are estimated, J , Tf , and γ can be computed by solving the appro-priate equations from (12)-(15).
3 Results and Discussion
3.1 Inertia, Friction, and Drag Calculations
Multiple test were run to ensure repeatability; seven runs of Test 1, and two runs of Test 2with two different masses. An Excel spreadsheet was used to perform the data post processingas described in the previous section. Constants used are given in Table 1 along with theirunits. Units of the various other quantities are given in Table 2.
The results were J = .62 slug-ft2, Tf = .06 slug-ft2/sec2 = .7 in-lb, and γ = .007 slug-ft2.To check if the value of γ is reasonable, we computed a theoretical value using (7), and
CD = 1.2 for a half cylinder (approximation of the shape of the vanes’ leading edge). Thetheoretical drag constant, γ̂, was computed to be .012 slug − ft2. This is the same orderof magnitude as γ, but γ is likely a bit larger because of other components that were notaccounted for that cause drag. Moreover, 1.2 is likely not the CD for the actual vane shape.
As a final reality check inertia, J̄ and friction torque, T̄f were computed by neglectingdrag, only using a few data points at very low speeds, and assuming constant acceleration ordeceleration. In other words, we neglect the terms with α2 and β2 in (10) and (11), and solvefor J and Tf in a similar manner as outlined in Section 2. In this case, J̄ = .98 slug-ft2, and
4
0
20
40
60
80
100
120
0 50 100 150 200
RPM
To
rqu
e (i
n-l
b)
10 mph 12.5 mph 15 mph 17.5 mph 20 mph
Power curves, all points
0
20
40
60
80
100
0 50 100 150 200
RPM
Pow
er (
W)
0
20
40
60
80
100
120
0 50 100 150 200
RPM
Torq
ue (
in-l
b)
10 mph 12.5 mph 15 mph 17.5 mph 20 mph
0
20
40
60
80
100
0 50 100 150 200
RPM
Pow
er (
W)
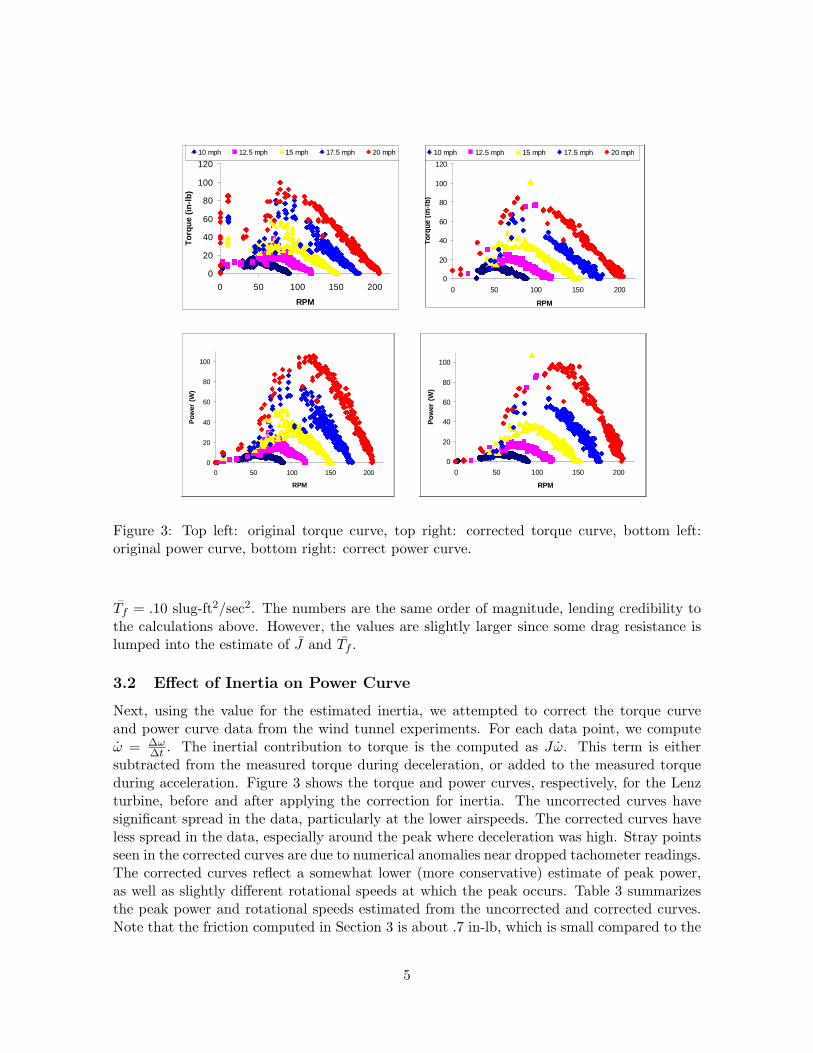
Figure 3: Top left: original torque curve, top right: corrected torque curve, bottom left:original power curve, bottom right: correct power curve.
T̄f = .10 slug-ft2/sec2. The numbers are the same order of magnitude, lending credibility tothe calculations above. However, the values are slightly larger since some drag resistance islumped into the estimate of J̄ and T̄f .
3.2 Effect of Inertia on Power Curve
Next, using the value for the estimated inertia, we attempted to correct the torque curveand power curve data from the wind tunnel experiments. For each data point, we computeω̇ = ∆ω
∆t . The inertial contribution to torque is the computed as Jω̇. This term is eithersubtracted from the measured torque during deceleration, or added to the measured torqueduring acceleration. Figure 3 shows the torque and power curves, respectively, for the Lenzturbine, before and after applying the correction for inertia. The uncorrected curves havesignificant spread in the data, particularly at the lower airspeeds. The corrected curves haveless spread in the data, especially around the peak where deceleration was high. Stray pointsseen in the corrected curves are due to numerical anomalies near dropped tachometer readings.The corrected curves reflect a somewhat lower (more conservative) estimate of peak power,as well as slightly different rotational speeds at which the peak occurs. Table 3 summarizesthe peak power and rotational speeds estimated from the uncorrected and corrected curves.Note that the friction computed in Section 3 is about .7 in-lb, which is small compared to the
5
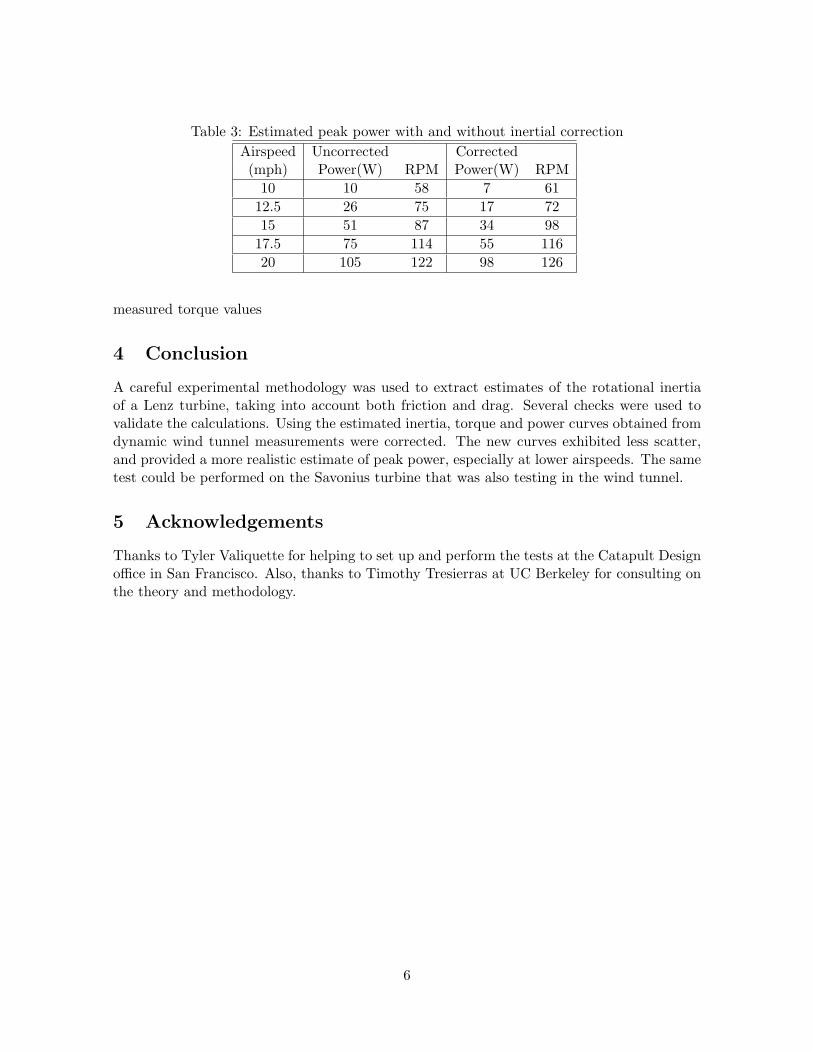
Table 3: Estimated peak power with and without inertial correctionAirspeed Uncorrected Corrected(mph) Power(W) RPM Power(W) RPM
10 10 58 7 6112.5 26 75 17 7215 51 87 34 98
17.5 75 114 55 11620 105 122 98 126
measured torque values
4 Conclusion
A careful experimental methodology was used to extract estimates of the rotational inertiaof a Lenz turbine, taking into account both friction and drag. Several checks were used tovalidate the calculations. Using the estimated inertia, torque and power curves obtained fromdynamic wind tunnel measurements were corrected. The new curves exhibited less scatter,and provided a more realistic estimate of peak power, especially at lower airspeeds. The sametest could be performed on the Savonius turbine that was also testing in the wind tunnel.
5 Acknowledgements
Thanks to Tyler Valiquette for helping to set up and perform the tests at the Catapult Designoffice in San Francisco. Also, thanks to Timothy Tresierras at UC Berkeley for consulting onthe theory and methodology.
6