wind power for williams college: a feasibility study - sustainability
TRANSCRIPT

Wind Power for Williams College:
A Feasibility Study
Prepared for the Zilkha Center for Environmental
Initiatives by JJ Augenbraun
Summer 2009
Figure 1. Wind turbines at the Searsburg, VT wind farm.

2
Executive Summary
This report addresses the feasibility of developing a wind project on land owned by
Williams College. It examines a range of various issues related to such a project. The idea for a
wind farm on College property dates to the late 1970s when Reed Zars ’77 first proposed putting
wind turbines on the Berlin Pass. While Reed Zars’ proposal and future studies focused on Berlin
Pass, this report also examines the possibility of using land in Hopkins Memorial Forest (HMF).
Further research during the course of this project leads to the conclusion that Berlin Pass is a
better site for wind turbines than HMF (Figure E1). Berlin Pass is closer to usable roads, closer
to utility grid interconnection, and does not have the land use issues of HMF. In addition, a
project on Berlin Pass will allow all the wind turbines to be placed in the same state which would
not necessarily be the case with a multi-turbine project in HMF.
The environmental impact of a project on Berlin Pass is expected to be minimal. Less
than two acres of Berlin Pass will be directly impacted by construction activities. No wildlife
migratory corridors will be impacted and there will be minimal disruption of wetlands. Noise
produced by the turbines will not be above background noise levels for the vast majority of
nearby residents. Based on similar projects’ experiences, avian deaths are expected to be
extremely limited. Finally, the Taconic Crest hiking trail will need to be slightly rerouted to
avoid any potential ice throw injury liability.
Analysis of wind data from the Taconic Crest demonstrates very favorable wind
conditions. The average wind speeds at 30, 40, and 50 meters are 4.98 m/s, 5.92 m/s, and 7.13
Figure E1. Locations of the two potential sites on property owned by the College.

3
m/s respectively based on four and a half years of data collected in ten minute increments.
Estimated wind speeds at 80 and 100 meters are 7.83 m/s and 8.16 m/s respectively. The average
wind direction is 284.5 degrees (west-northwest). Estimated annual power production per turbine
ranges from approximately 6 to 10 GWh depending on the brand, capacity, and size of the wind
turbine. Based on an annual desired total production of 17 to 22 GWh to meet the College’s
entire electricity draw from the electrical grid, approximately three wind turbines would be
needed. The estimated total cost for a three turbine project of Vestas 1.8 MW turbines is
approximately $17,000,000. Depending on various factors such as incentives, ownership
structure, and cost of electricity, payback on a three turbine project could be in the five to ten
year range with an internal rate of return of approximately 15% and a net present value of about
$6.9 million.
The next step for this project is finding a professional developer to do a more complete
feasibility study. That study should address interconnection standards, road construction to
Berlin Pass, full economic and environmental impact analysis, and other engineering challenges.
Once that study is completed and the College decides to move forward with the project,
permitting in Berlin and Williamstown could be pursued.

4
Introduction
In 2007, Williams College adopted a goal to reduce greenhouse gas emissions by 10%
below the College’s 1990-1991 levels by 2020.1 Some of this reduction can be achieved by
conservation efforts and efficiency improvements already underway. However, to fully achieve
this goal will require the use of some sort of renewable, clean energy source. While there are
many options for clean energy, wind energy stands out as a logical choice given the ample wind
present on the mountaintops surrounding Williamstown. In light of the clean nature of wind
energy, this report explores the possibility of using large scale wind turbines on Williams
College property to reduce the College’s dependency on fossil fuels by providing enough
electricity to offset the College’s annual electricity consumption from the grid.
Based on class work I did for my Renewable Energy and Sustainable Campus
Geosciences class, I determined that constructing a wind turbine on campus is not practical given
the prevailing wind conditions in the Purple Valley. Even small scale wind turbines constructed
on campus buildings will not produce much more than 7,000 kWh per turbine per year in the best
case scenarios. The average yearly wind speed of 3.2 m/s at 15 meters above the Science Center
roofline is simply too low to support significant levels of electricity production.2 Approximately
3,150 building mounted small turbines would be needed to supply the 22,000,000 kWh of
electricity purchased each year.3 As such, in this report I explore other College owned property
that could host large wind turbines capable of producing in the multi-megawatt range.
Harvesting wind energy is not a new idea at Williams College. Reed Zars ’77 first
proposed the idea of putting wind turbines on the Berlin Pass in the fall of 1976. His initial
vision evolved through a thesis completed by Thomas Black ’81. Black eventually arranged for
the installation of a 100 foot (approximately 30 meters) tower with anemometers on Berlin Pass
to conduct a fifteen month feasibility study. Based on the data collected from this tower, Black
concluded that the Berlin Pass location was a good candidate for wind energy, with an estimated
twenty year payback based on the wind turbines of the era. However, no action was taken by the
school based on his recommendations.
The cost of installing and operating wind turbines has dropped considerably since Black’s
time. As a result, a group of students led by Nick Hiza ’02 reopened the investigation into wind
power for the College. Over the course of a year and a half, this group of students focused on
evaluating Berlin Pass as the site for several large scale wind turbines that could provide a
significant portion of the College’s power. Pro forma financial analysis suggested payback in the
four to eight year range for a multi-unit wind farm.
Despite the attractive economics outlined by Hiza’s group, again no further significant
action was taken toward developing the site. Hiza’s proposal was also met with some opposition
from the residents of Berlin, NY. The town of Berlin contains the land on which Hiza suggested
the College construct several wind turbines. When Hiza proposed installing a meteorological
tower on the Berlin Pass site, the town of Berlin called for a full environmental impact analysis
evaluating the impact as if the College were installing a wind farm rather than a simple 50 meter
measuring tower.4
1 Schapiro, Morton. Letters from the President and Trustees. Presented 24 January 2007.
2 Augenbraun, JJ. Small Scale Wind Turbines at Williams College. Final report for Geosciences 206. 19 May 2009.
3 Energy Use. http://www.williams.edu/resources/sustainability/energy_use.php.
4 Information on the history of student work exploring wind energy at Berlin Pass gathered from Hiza et al (May
2003). The Berlin Wind Project: An Interim Report on Project Feasibility and Potential Environmental
Impact, p. 58-63.
5
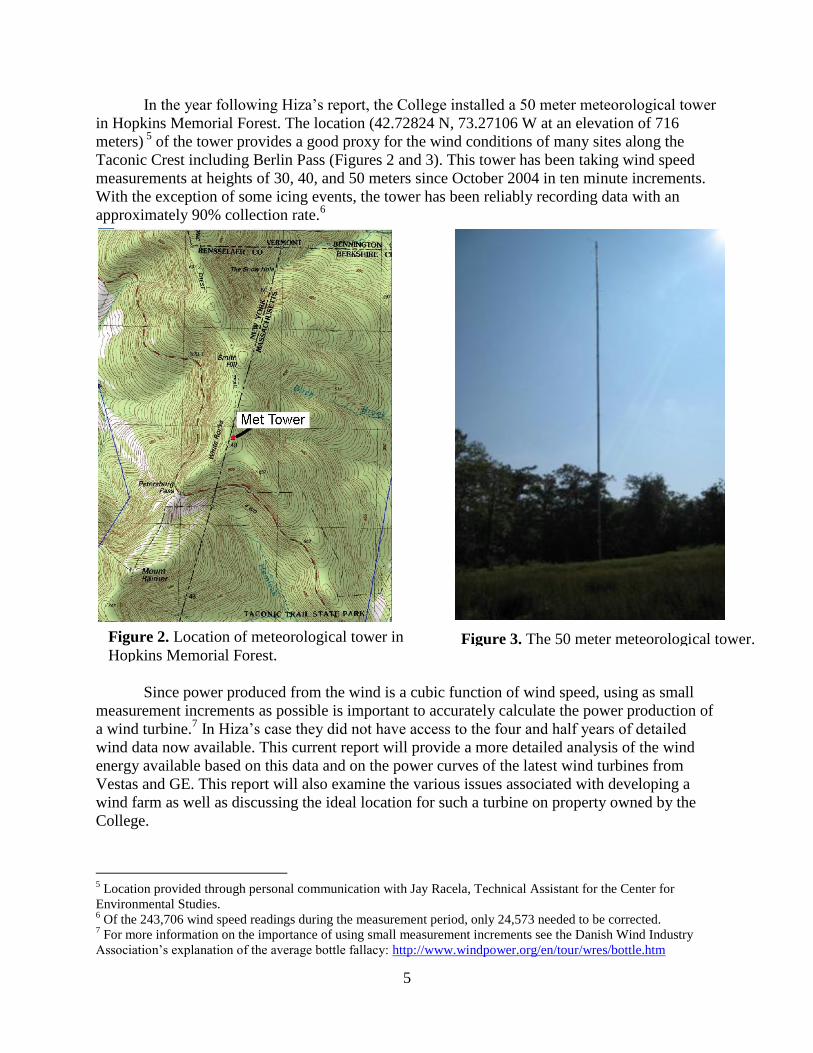
In the year following Hiza’s report, the College installed a 50 meter meteorological tower
in Hopkins Memorial Forest. The location (42.72824 N, 73.27106 W at an elevation of 716
meters) 5
of the tower provides a good proxy for the wind conditions of many sites along the
Taconic Crest including Berlin Pass (Figures 2 and 3). This tower has been taking wind speed
measurements at heights of 30, 40, and 50 meters since October 2004 in ten minute increments.
With the exception of some icing events, the tower has been reliably recording data with an
approximately 90% collection rate.6
Since power produced from the wind is a cubic function of wind speed, using as small
measurement increments as possible is important to accurately calculate the power production of
a wind turbine.7 In Hiza’s case they did not have access to the four and half years of detailed
wind data now available. This current report will provide a more detailed analysis of the wind
energy available based on this data and on the power curves of the latest wind turbines from
Vestas and GE. This report will also examine the various issues associated with developing a
wind farm as well as discussing the ideal location for such a turbine on property owned by the
College.
5 Location provided through personal communication with Jay Racela, Technical Assistant for the Center for
Environmental Studies. 6 Of the 243,706 wind speed readings during the measurement period, only 24,573 needed to be corrected.
7 For more information on the importance of using small measurement increments see the Danish Wind Industry
Association’s explanation of the average bottle fallacy: http://www.windpower.org/en/tour/wres/bottle.htm
Figure 3. The 50 meter meteorological tower. Figure 2. Location of meteorological tower in
Hopkins Memorial Forest.

6
Potential Sites
Overview
Ideal wind sites have several important characteristics. First, for wind turbines to be
effective they require consistent high wind speeds. Since wind speeds generally increase with
altitude, the higher the proposed site, the better the winds for generating electricity. In addition, a
site with few nearby obstructions such as taller surrounding mountains or large buildings is
desired. Furthermore, the ideal site should have the potential for road and power line
accessibility. Moreover, a site should be chosen that minimizes the engineering challenges
associated with constructing roads and power lines to the wind turbine site. A site should also be
chosen that will allow for the least wetland, wildlife, and general environmental disruption by
construction activities as possible. Finally, permitting requirements should be considered in the
selection of a site. Since permitting for a wind turbine currently falls under the responsibility of
the affected town, regulations can vary widely from one site to another depending on town
location.
Off campus, property owned by the College meeting at least the altitude criteria includes
Hopkins Memorial Forest (HMF) and parts of the Berlin Pass area (Figure 4). Both HMF and
Berlin Pass have relatively high altitudes (approximately 700 meters for both sites) compared to
their surroundings. The College could always consider purchasing additional land at other local
sites, but most other sites would have to deal with many of the same issues as HMF and Berlin
Pass sites outlined in the following sections.
Figure 4. Locations of the two potential sites on property owned by the College.

7
Property Descriptions
Hopkins Memorial Forest consists of approximately 2,600 acres spread over
northwestern Massachusetts and adjoining pieces of Vermont and New York (Figure 5). Most of
the land contained in HMF was consolidated between 1887 and 1910 by Colonel Amos
Lawrence Hopkins. In 1935, Williams College deeded the land to the United States Forest
Service to be used as an experimental research facility. The land was returned to the College in
1968. Since then the College has continued to use the forest for research and educational
purposes.8
Although the ridge running through the western part of HMF appears to be an attractive
site for wind turbines, there are several major drawbacks. First, some turbines would have to be
constructed in New York and some in Massachusetts. This would effectively double the number
of permits required for the project. In addition, the ridge is narrower than the proposed ridge in
Berlin Pass which could potentially limit the number of turbines that could be constructed on the
site. Furthermore, the nearest electrical grid interconnection is a minimum of 3,000 meters from
the site and unlike with the Berlin Pass site there are not even old jeep access roads to the site.9
8 Hopkins Memorial Forest: History. http://www.williams.edu/CES/hopkins/history/historyhome.htm.
9 Personal communication with Professor David Dethier of Williams College Geosciences Department.
Figure 5. Detailed map of Hopkins Memorial Forest boundaries and hiking trails.

8
The largest problem with the HMF site is an obstacle dating back to 1935 when the U.S.
Forest Service took over management of the land: the permanent plot system. The permanent
plot system allowed for the inventorying of all major growth in the forest. Since 1935, the plots
have been resurveyed several times and detailed records have been kept on the forest. These
records form the basis for one of the best long-term databases of “unmanaged” deciduous forests
in the world. Since these plots cover approximately 95% of the HMF land, including much of the
ridge, installing wind turbines in HMF would be extremely disruptive to research dating back to
1935. 10
The likelihood of getting approval to disrupt these plots is quite slim. The combination of
the permanent plot systems and long distances to a usable road and electrical grid
interconnection make HMF a very poor site for building wind turbines. As such, I will not
further consider HMF as a potential site for wind turbines throughout the rest of this report.
Instead, I will focus on the second, and more promising, possibility of Berlin Pass.
The Berlin Pass site consists of approximately 400 acres straddling the Massachusetts-
New York state line (Figure 6). Most of the property is in New York, specifically in the town of
Berlin. The land on the Massachusetts side is in Williamstown. The part in Williamstown
encompasses some of the land the College ski team used for practice during the 1950s and
1960s. The College received most of the land in this parcel in 1972 through alumni gifts. This
site has the added benefit of the potential for higher wind speeds due to the funneling effect of
the Green Hollow ridgelines that extend to the west into New York (Figure 7).11
10
HMF Permanent Plot System. http://oit.williams.edu/hmfplot/methodology.php?which=plotsystem. 11
Hiza et al. The Berlin Wind Project, p. 9-11.
Figure 6. Detailed map of the Berlin Pass site.

9
Berlin Pass contains similar terrain to HMF, but there is more room on the New York
side of the border to install wind turbines. In fact, Hiza’s group found that there was actually
room to install approximately seven wind turbines on the property in Berlin.12
Therefore, we can
eliminate the issue of having to permit turbines in two states. In addition, Berlin Pass has not
been the site of ongoing environmental research. Berlin Pass is also not as pristine as HMF due
to its history as a ski area and the presence of several jeep/ATV tracks. Overall, a wind project
has more potential for success on Berlin Pass than in HMF.
Road Access
Major construction would need to be undertaken to build a road from the nearest existing
access road to the proposed site. However, there is already a fairly well maintained and relatively
well compacted dirt road (Berlin Road) that runs from Route 2 to the base of the old College Ski
Area. This road runs to within 1,400 meters of the proposed site. An unmaintained jeep track
runs the remaining distance to the turbine site (blue line in Figure 10). However, this track has
fallen into disrepair with numerous washouts and fallen trees (Figures 8 and 9).
12
Hiza et al. The Berlin Wind Project, p. 15-16.
Figure 7. Projected effect of Green Hollow ridgelines on wind patterns.
Figure 9. Damage to jeep track.
Figure 8. Jeep track.

10
According to the Petricca Construction Company, this jeep track could be feasibly
repaired to support both maintenance vehicles and transport vehicles for all wind turbine
components.13
Although this is the most obvious route, there are two other potential paths for
roads to the site. The first alternate route involves extending Green Hollow Road in Berlin (red
line in Figure 10). This would require constructing a road of at least 2,000 meters in length (or
upgrading the existing unmaintained jeep track). However, the College does not own land all the
way to the end of the existing Green Hollow Road and would have to obtain land easements in
Berlin to construct the road.
The other alternative route would again involve repairing/upgrading another jeep track of
approximately 2,000 meters from where Route 2 crosses Petersburg Pass (yellow line in Figure
10). Again, this road would pass through land the College does not own. A further complication
comes from the possibility that this road may have to traverse two states, adding to the number of
permits required. Overall, the jeep track from the old ski area appears to be the most suitable
path to the turbine site. It has the added benefit of being constructed entirely on College property
unlike extending Green Hollow Road or the dirt road from Petersburg Pass. Further analysis by
an engineer is necessary to determine the best route for such a road.
13
According to a proposal obtained from Petricca Construction Company by Hiza.
Figure 10. Three potential paths for roads to the proposed site.

11
Grid Interconnection
A utility grid interconnection is essential for transmitting the power produced by the wind
turbines. There are two potential points of interconnection for this project. Power lines could be
strung from the site to the termination of power lines on Green Hollow Road. Taking a direct
route, these power lines would run for a minimum of 1,600 meters. Only part of these power
lines would be on College property. Special easements would have to be obtained from private
property owners in Berlin to allow for these power lines. If these power lines were constructed,
the turbines would interconnect with New York State Electric and Gas (NYSEG) which operates
the electrical grid in Berlin, NY. NYSEG provides detailed interconnection requirements in its
Bulletin 86-01: Requirements for Independent Power Producers of Electricity.14
These
requirements specify strict standards for quality of electricity generated and the level of
equipment used.
The other possible site for interconnection is with the end of National Grid’s power lines
on Berlin Road in Williamstown. The power lines on Berlin Road terminate at the last house on
that road which is approximately 1,000 meters from the end of Berlin Road. Therefore, power
lines from the Massachusetts side of the site would have to run for a minimum of 1,800 meters.
While this is longer than for power lines from Berlin, the entire length of the power line could be
constructed alongside an existing road or on College property. This would minimize the
challenge of constructing power lines on private property. In addition, the power lines in
Williamstown have recently been upgraded making them more likely to be able to handle the
power produced by the wind turbines.15
National Grid has similar regulations as NYSEG for
interconnection standards.
In either case, Williams College would be responsible for all costs associated with the
interconnection study and construction of the power lines. An interconnection study is necessary
to determine if the NYSEG or National Grid power lines can support the added load of a wind
turbine farm.16
The study might find that power lines have to be upgraded beyond the initial
interconnection point to safely transport the electricity. In addition, it will not be feasible to
connect the wind turbines “behind” the meter at the College’s heating plant (where grid
electricity enters the campus’ distribution system). For liability reasons, National Grid will not
allow anyone else to string power lines on the company’s poles.17
While connecting “behind” the
meter would increase the value of the transmitted electricity by essentially running the electricity
meter backwards, the added costs of building an independent transmission system would not
make financial sense.
Permitting and Zoning Considerations
There are three main permitting considerations for this project: the turbines, the power
lines, and the road. The proposed site is in a rural use district of Berlin, NY. Berlin does not have
town by-laws, but it does have land use regulations. The land use regulations place a maximum
height restriction of 10.7 meters (35 feet) on structures built in rural use districts.18
14
Available at http://www.nyseg.com/SuppliersAndPartners/interconnectioninfo.html. 15
Personal communication with Joanne DeRose, Representative of National Grid. 16
Personal communication with Alex Kuriakose, Senior Engineer for Distributed Generation Services at National
Grid. 17
Personal communication with Joanne DeRose, Representative of National Grid. 18
Berlin Town Board. Town of Berlin: Land Use Regulations, 1988, p. 9.

12
Since a wind turbine would exceed the maximum height for a rural use district, a special
permit would need to be obtained from the town of Berlin. The Town of Berlin Zoning Board of
Appeals would need to issue this permit pursuant to Article VIII of the Town of Berlin: Land
Use Regulations. Included in this section of the regulations is a clause that allows for the zoning
board to reject an application for purely aesthetic reasons.19
Previous attempts to install just a
meteorological tower were met with resistance and the demand for a full environmental impact
analysis of the type required for installing wind turbines. In addition, several letters from
residents of Berlin were sent to the College administration opposing the idea of a wind farm on
Berlin Pass. This reaction by town members indicates that there may be resistance to a plan for
College turbines on the ridge. However, the political climate of the town may have changed
since representatives of the College last approached the town in 2003. As such, the completion of
a full environmental impact analysis along with visual simulations may convince the Zoning
Board of Appeals to allow the issuance of a special permit for this project.
In addition to obtaining a special use permit from the Town of Berlin, a wind farm needs
to obtain clearance from the Federal Aviation Administration (FAA). The FAA requires that a
Notice of Proposed Construction be filed for any structure over 61 meters (200 feet). The FAA
will then determine if there is a potential for interference with air traffic or radar systems. Based
on the FAA approval of the Hoosac Wind Project (a distance of about 10 kilometers from the
Harriman-North Adams Airport), it is likely that the FAA would approve wind turbines on
Berlin Pass which is a distance of approximately 9 kilometers from the same airport.20
Wind
turbines need to be lit in accordance with FAA regulations. This means placing lights on the
outermost wind turbines and having another light every 800 meters within the wind farm.21
These regulations mean that a College wind farm would most likely need two or three lights
depending on the total number of wind turbines.
Unlike the construction of the actual wind turbines, road and power line construction will
likely have to deal with the regulations of both Williamstown and Berlin (if we build the road
and power lines from the Williamstown side). At the least, we will have to follow Berlin’s
regulations for these construction activities. In Berlin and Williamstown, road construction
appears to be allowed on private property as an incidental or accessory use for the property. In at
least Williamstown (and likely Berlin), we will need to conduct a site survey to determine the
environmental impact. Depending on the presence of waterways and certain species, special
permits may need to be filed with the proper conservation agencies.22
In Berlin, power lines are
granted a special height exception allowing them to be constructed to a height of 30.5 meters
(100 feet). In Williamstown, power lines may be constructed to a height of 10.7 meters (35 feet).
In certain situations, a special use permit may be obtained in Williamstown to increase the
maximum height of structures to 13.7 meters (45 feet).23
Even under the more stringent
Williamstown regulations, the power lines should not exceed the maximum allowed heights.
Overall, the main challenge with the permitting process will be obtaining the approval of
the Berlin Zoning Board of Appeals for a special use permit. Tactfully approaching the town
government will be important for securing this permit. The absence of any wetlands on the site
19
See pages 12-14 of Hiza’s feasibility study for a more complete outline of the procedure for obtaining a special
permit from the Zoning Board of Appeals. 20
Airspace Issues in Wind Turbine Siting. http://www.masstech.org/renewableenergy/MTC_FAA.pdf. 21
Development of Obstruction Lighting Standards for Wind Turbine Farms.
http://www.airtech.tc.faa.gov/safety/Downloads/TN05-50.pdf. 22
Personal communication with Jason Moran, Project Manager for Williams College Facilities Department. 23
See Town of Berlin: Land Use Regulations (page 7) and Code of Williamstown.

13
allows the College to avoid dealing with any of the special variance issues associated with
wetlands.24
Environmental Impact
I will briefly summarize the environmental impact of wind turbines on Berlin Pass in this
report.25
There are usually four major areas of environmental consideration with wind turbine
projects: noise, avian risk, ice throw danger, and ecological impact. There are two sources of
noise from wind turbines, mechanical noise and aerodynamic noise. Mechanical noise (noise
from metal components moving in the turbine’s gearbox) has been greatly reduced. Through a
combination of specially designed gearboxes, blades that minimize vibrations, and sound
insulation, manufactures have largely eliminated mechanical noise, and it is no longer considered
a major source of noise.26
Aerodynamic noise is still a minor concern, but modern turbines
minimize this source of noise through careful blade design and low rotational speed of rotors.
This noise comes from the wind hitting the blades just as noise comes from leaves rustling in the
wind.27
Modern turbines emit approximately 100 dB(A) of noise. This level of noise quickly
drops as you increase the distance from the turbine. At a distance of 170 meters (560 feet) from
the turbine, noise is in the 40-44 dB(A) range. This is about the same level of noise as in a quiet
office.
24
Hiza et al. The Berlin Wind Project, p. 10. 25
See Chapter 4, starting on p. 22, of Hiza’s feasibility study for a more complete analysis of environmental impact. 26
Low Mechanical Noise. http://www.windpower.org/en/tour/design/quietma.htm. 27
Low Aerodynamic Noise. http://www.windpower.org/en/tour/design/quietae.htm.
Figure 11. Noise impact of wind turbines on Berlin Pass. This graphic was created based on the assumption of
seven wind turbines, so actual noise levels of a three turbine project would be even less. Darkest blue represents
40+ dB(A). Next lighter shade of blue represents 30-40 dB(A) and lightest blue represents less than 30 dB(A).

14
Beyond approximately 260 meters (850 feet) sound drops to 35-39 dB(A). This level is
equivalent to a whispered conversation. Beyond approximately 475 meters (1560 feet), wind
turbine noise is below 35 dB(A) which is essentially masked by the background noise of the
environment.28
Based on these numbers, very few residents will experience any increase in
background noise due to the installation of turbines on the ridge. The closest houses will
experience the barely audible noise level of about 35 dB(A) (Figure 11).
Risk to avian population is expected to be minor in an environment like Berlin Pass.
Studies performed at a wind turbine in Denmark show that birds will alter their paths by a few
hundred meters to avoid wind turbines. Studies from Canada show that migratory birds will also
alter their paths around wind turbines.29
In addition, local empirical evidence supportw the low
risk to birds. The Searsburg, Vermont wind farm has been operating for almost twelve years and
has recorded only two bird fatalities. 30
That site operates ten wind turbines which would imply a
bird fatality rate of one per sixty years of wind turbine operation.
In a cold environment like Berlin Pass, blade icing should be considered. However, based
on years of observations at the Searsburg project, ice is rarely thrown from the turbines. The
rotation of the rotor generally keeps ice formation at a minimum. When ice does form it tends to
melt and eventually drop off the blade rather than being thrown large distances.31
Despite the
relative safety, General Electric Energy recommends a setback distance from any hiking trails of
approximately 180 meters (600 feet) to avoid any potential ice throw danger. The Taconic Crest
trail runs through the proposed site. As such, it may be necessary to reroute the trail around the
wind turbines to avoid any potential liability issues.32
Any development in a wilderness environment disturbs the natural ecology and all efforts
should be made to protect the natural environment. It is expected that ecological impacts at the
site would be minimal as the site contains no endangered species or sensitive habitats such as
wetlands. In addition, according to previous student research, wind turbine construction and
operation would not impact wildlife migratory corridors through the site. Less than 1% or
approximately 2 acres of the total College property on Berlin Pass would be impacted by
construction activities. This estimate includes road construction from the Williamstown side as
well as the foundations for the wind turbines. Parts of this site have already been disturbed from
previous use as a ski area, which means the site is no longer as pristine as other sites in the
Berkshires.33
Overall, it is expected that any negative environmental impacts of building wind
turbines on Berlin Pass would be outweighed by the benefits of generating clean, renewable
wind energy.
28
Sound from Turbines. http://www.windpower.org/en/tour/env/sound.htm#minor. 29
Birds and Wind Turbines. http://www.windpower.org/en/tour/env/birds.htm. 30
Personal communication with Martha Staskus, Vermont Environmental Research Associates. 31
Ibid. 32
For a full discussion of rerouting the trail, see pages 27-30 of Hiza’s feasibility study. Total cost of rerouting the
trail would be approximately $14,000 adjusted for inflation by CPI Inflation Calculator. 33
Canada et al. Report on the Feasibility of a Wind Power Project on the Berlin Pass, p. 12.

15
Wind Analysis
Overview
In order for any wind project to be economically viable, sufficient wind resources are
required. Four and a half years of ten minute wind speed data collected from the Taconic Crest
strongly support the presence of sufficient winds to make any project along the ridgeline
financially successful. In this section I will explain how I estimated wind speeds at the typical
hub heights of commercial wind turbines as well as provide power production estimates of
possible turbines for the site.
Methodology
I obtained wind data from the meteorological tower in HMF spanning from November
11, 2004 to June 30, 2009. With help from Chris Warren and Amy Johns, I developed a Perl
script to scan through the data and note any missing data (Appendix A). After running this script,
I corrected for missing data, representing about 10% of the total data set (Appendix B).
I used a wind shear formula to estimate wind speeds at typical wind turbine hub heights:
v = vref * ln ( z / zo ) / ln ( zref / zo) (1)
Where: v is the wind speed estimate at a height z meters above ground level.
vref is the known wind speed at a known height zref and zo is the roughness
length in the current wind direction.34,35
For the Berlin Pass site, I used a roughness length of 0.40 meters based on the definition
of rough and uneven terrain provided in the Danish Wind Industry Association’s reference
manual.36
With this formula, I estimated wind speeds (based on the average of both 50 meter
anemometers on the meteorological tower) at the typical turbine heights of 67, 70, 80, 95, 100,
and 105 meters (Appendix C). These are the heights of the various Vestas and GE wind turbines
used to produce power production estimates later in this section.37
34
Roughness and Wind Shear. http://www.windpower.org/en/tour/wres/shear.htm. 35
This method for estimating wind speeds was found to be the most accurate by Sam Arons in his thesis. 36
This is a conservative roughness length, the true roughness length is more likely 0.80 meters or greater. This
would slightly increase wind speed estimates, but I will work with the 0.40 meter length to provide more
conservative estimates throughout this report. 37
Gamesa and Siemens were also contacted but neither company deals with wind projects on such a small scale.

16
0
1
2
3
4
5
6
7
8
9
0 20 40 60 80 100 120
Ave
rage
Win
d S
pe
ed
(m
/s)
Height (meters)
Increasing Wind Speed with Height
Summary of Wind Speeds and Direction
As expected, overall wind speeds increased with height above the ground. Wind speeds
were lowest at the 30 meter anemometer and highest at the 50 meter anemometer. For the
measurement period, the 50 meter anemometers recorded an average wind speed of 7.13 m/s
(Table 1 and Figure 12).
Most of the wind passing over the Taconic Crest came from the northwest and west-northwest
direction with an average direction of 284.5 degree (Figure 13). This direction is corroborated by
wind measurements at the Searsburg wind farm and other measuring stations in the surrounding
area.
Height Average Wind Speed
30 m 4.98 m/s
40 m 5.92 m/s
50 m 7.13 m/s
67 m 7.57 m/s
70 m 7.63 m/s
80 m 7.83 m/s
95 m 8.08 m/s
100 m 8.16 m/s
105 m 8.23 m/s
Table 1. Average wind speeds at various
heights. Note that the 30, 40, and 50 meter
averages are empirical while the other
averages are estimated based on Equation 1.
Figure 13. Wind rose for measurements from the meteorological tower at 50 meters.
Figure 12. Graph of increasing wind speed with heights.
Because I used a conservative roughness length, it is likely
wind speeds would be higher than indicated above 50
meters.

17
Estimated Power Production
After estimating wind speeds at the proper heights, I binned the data for each height
according to the intervals specified in the manufacturers’ power curves.38
For Vestas, binning
was in 1.0 m/s intervals and for GE binning was in 0.50 m/s intervals. Cut-in and cut-out speeds
were factored into the calculations. I then applied the power curves for various turbines supplied
by Vestas and GE. Vestas has a selection of 1.65, 1.8, 2.0, and 3.0 MW turbines and GE has a
selection of 1.5 and 2.5 MW turbines available (Appendix C). GE’s power curves account for
different air densities while Vestas do not.39
Estimated yearly power production numbers were
very promising even when using a conservative roughness length (Tables 2 and 3).
Turbine Capacity Hub Height Rotor Diameter Yearly Energy Production
1.65 MW 70 m 82 m 6.19 GWh
1.65 MW 80 m 82 m 6.43 GWh
1.8 MW 80 m 90 m 7.44 GWh
1.8 MW 95 m 90 m 7.78 GWh
1.8 MW 80 m 100 m 8.19 GWh
1.8 MW 95 m 100 m 8.50 GWh
2.0 MW 67 m 80 m 6.33 GWh
2.0 MW 80 m 80 m 6.73 GWh
3.0 MW 80 m 90 m 9.23 GWh
3.0 MW 105 m 90 m 10.09 GWh
Turbine Capacity Hub Height Rotor Diameter Yearly Energy Production
1.5 MW SLE 65 m 77 m 5.14 GWh
1.5 MW SLE 80 m 77 m 5.51 GWh
1.5 MW SL 65 m 77 m 5.12 GWh
1.5 MW SL 80 m 77 m 5.47 GWh
1.5 MW XLE 80 m 82.5 m 6.12 GWh
2.5 MW XL 75 m 100 m 8.95 GWh
2.5 MW XL 85 m 100 m 9.32 GWh
2.5 MW XL 100 m 100 m 9.75 GWh
In the fiscal year 2008, the College used 27,368,364 kWh of electricity. Of that amount,
5,686,933 kWh were generated at the cogeneration plant on campus.40
Assuming that the College
would like to generate sufficient electricity to power the campus, the production of the wind
project should be on the order of 17,000,000 to 22,000,000 kWh (17 to 22 GWh) annually
depending upon the effects of conservation projects on campus.41
Therefore, approximately three
38
Vestas power curves are restricted under an NDA and were obtained from Andrew Ragland. To review the terms
of the NDA please contact Jeff Jones. GE power curves are not restricted under an NDA, but GE has requested we
do not publicly disclose the curves. GE power curves were provided by Matt Perkins. 39
I used a yearly average of 1.15kg/m3, based on Sam Arons’ calculations for his thesis.
40 Energy Use. http://www.williams.edu/resources/sustainability/energy_use.php.
41 Personal communication with Stephanie Boyd, Director of the Zilkha Center at Williams College.
Table 2. Estimated annual power production for Vestas turbines.
Table 3. Estimated annual power production for GE turbines.

18
0.01.02.03.04.05.06.07.08.09.010.0
Win
d S
pe
ed
(m
/s)
Month
Average Wind Speed at 50 m
wind turbines would be required to satisfy this demand. When picking a wind turbine, more than
just the total electricity production must be considered. For example, a wind turbine should be
selected that best matches the wind speed regimes, updraft characteristics, and turbulence
patterns of the site. As a result, the actual number of turbines required may be more or less than
three.
Production of electricity from wind is generally highest in the winter which is when the
College generates the highest amounts of its own electricity. The Taconic Crest experiences
higher average monthly wind speeds in the winter months which corresponds to higher
electricity production (Figure 14). The main meter electricity use monitors the total electricity
drawn from the electrical grid by the College (Figure 15). The discrepancies in these graphs’
peaks mean that while the project will generate the amount of electricity the College uses in a
year, the generation profile will not necessarily match up with when the electricity is used.
However, on an annual basis the project should result in the College’s net electricity draw from
the electrical grid being essentially zero.
Figure 14. Average
wind speed patterns
over the course of the
year at 50 meters. Data
compiled for June 1,
2008 to June 1, 2009.
Figure 15. College electricity use from the
grid for June 1, 2008 to June 1, 2009.

19
Cost Analysis
Incentives Available
There are several forms of incentives available for large scale wind projects. However,
the dual state nature of this project complicates the application process and reduces eligibility for
some of the state awarded incentives. I will give a brief overview of the applicable available
incentives in both states. In Massachusetts, the Massachusetts Technology Collaborative offers
up to $400,000 grants for feasibility, design and construction of private wind turbine projects.42
In addition, the Mass Energy Consumers Alliance offers to buy renewable energy credits at
$.03/kWh for wind projects in Massachusetts.43
Furthermore, the Massachusetts Department of
Energy Resources allows businesses to deduct from net income, for state excise tax purposes,
any expenses incurred in the installation of a wind turbine. Any system that qualifies for this
deduction is also exempt from taxation under the tangible property measure of Massachusetts’s
corporate excise tax.44
However, all these incentives require that the project be constructed in
Massachusetts, disqualifying a project on Berlin Pass.
In New York, the New York State Energy Research and Development Authority
(NYSERDA) offers grants to clean energy projects of up to 50% of a project’s cost, with a
maximum of $200,000 per project. The Berlin Pass project would likely qualify for this grant.45
In addition, this project would qualify for property tax exemption (which records indicate the
College does pay on the Berlin property) in New York. This tax exemption is a local option
exemption meaning the host town can opt-out of the exemption. However, Berlin is among the
towns that has not decided to opt-out as of yet.46
At the federal level, there is the Renewable Energy Production Tax Credit (PTC) that
provides a tax credit of $.021/kWh (adjusted for inflation annually) for the first ten years of
service for wind energy. Unless this credit is renewed, to qualify a project needs to be in-service
by December 31, 2012.47
Since the College does not pay taxes, the PTC would not be directly
beneficial to the College. In addition, the College could potentially qualify for the Renewable
Energy Production Incentive (REPI). REPI provides a payment of $.021/kWh (adjusted for
inflation annually) for the first ten years of service as long as the project is in service before
October 1, 2016.48
Clean Renewable Energy Bonds (CREBs) may be issued at a 0% interest rate
(bondholder receives federal tax credits instead of interest from the borrower) to help finance a
wind project. This 0% interest rate means the borrower only has to pay back the principal of the
bond allowing the borrower to obtain money at a lower rate than normally available.49
Cost Estimates
Costs presented here are very preliminary and meant to provide an order of magnitude
understanding of the proposed project. I based the following estimates on a combination of
personal communication with Matt Perkins, a GE Energy representative, and information
provided by Hiza’s pro forma financial reports. I have tried to make cost estimates as
42
http://www.dsireusa.org/incentives/incentive.cfm?Incentive_Code=MA82F&re=1&ee=1. 43
http://www.dsireusa.org/incentives/incentive.cfm?Incentive_Code=MA10F&re=1&ee=1. 44
dsireusa.org/incentives/incentive.cfm?Incentive_Code=MA03F&state=MA&CurrentPageID=1&RE=1&EE=1. 45
http://www.dsireusa.org/incentives/incentive.cfm?Incentive_Code=NY40F&re=1&ee=1. 46
http://www.dsireusa.org/incentives/incentive.cfm?Incentive_Code=NY07F&re=1&ee=1. 47
http://www.dsireusa.org/incentives/incentive.cfm?Incentive_Code=US13F&re=1&ee=1. 48
http://www.dsireusa.org/incentives/incentive.cfm?Incentive_Code=US33F&re=1&ee=1. 49
http://www.dsireusa.org/incentives/incentive.cfm?Incentive_Code=US45F&re=1&ee=1.

20
conservative as possible so that true costs will likely be less than what is presented in this report
(Table 4).
Component Cost
Turbines (5.2 MW total) $2,000,000 per MW X 5.2 = $10,400,000
Installation $2,000,000
Project management/contingencies $1,800,000
Road Improvement/Construction $1,000,000
Legal and public relations $1,000,000
Transmission Line Construction $700,000
Permitting and Site Survey $50,000
Interconnection Study $25,000
Easements and Trails $25,000
Total $17,00,000
Financial Analysis
The estimates included in this report will address both the situation of the College
funding the project itself and the possibility of using an outside investor/developer to fund the
project. I have tried to make the estimates as conservative as possible so actual returns will
probably be better than predicted. I based this analysis on a project of three 1.8 MW Vestas
turbines at an 80 meter hub height with 90 meter diameter rotor. Although such a turbine is
expected to produce 7.44 GWh per year, I used a figure of 7.22 GWh per year to account for the
97-98% availability factor (available to produce electricity) of the turbines. Furthermore, I
assumed a maintenance and operations cost of approximately $75,000 per turbine per year.
I also assumed we would not be receiving “behind” the meter pricing on electricity
produced. This means the College does not get the electricity for free because we will still have
to pay approximately $.04/kWh for transmission and distribution of electricity to campus for
electricity generated at Berlin Pass. In the case of our cogenerated electricity, we do not have to
pay National Grid anything for that electricity because it is generated on campus “behind” the
meter. For the price of electricity, I used last year’s average of $.12/kWh. This estimate
essentially assumes there is no net cost of electricity. In other words, we are selling and buying
electricity at the same price. In addition, I adjusted all future revenues and expenses associated
with the project by the long term (1913-2007) United States average inflation rate of 3.42%.50
Finally, I assumed a 25 year life span of the project. I summarized the financial information in
Table 5.
50
Inflation by Decade. http://www.inflationdata.com/inflation/Inflation/DecadeInflation.asp.
Table 4. Estimated costs associated with project of three 1.8 MW Vestas turbines.

21
Owner Simple Payback Net Present
Value (at 10%)
Internal Rate of
Return
College 8.6 years $3,988,756 13%
College
(selling RECs)
6.4 years $11,043,603 18%
Developer 7.0 years $6,880,847 15%
Developer
(selling RECs)
5.5 years $13,935,695 20%
Regardless of who funds the projects and what incentives the project qualifies for,
increasing the capacity or height of the turbines for the project will further enhance the economic
viability of the project. Also, even though the College will probably not sell the Renewable
Energy Credits (RECs) associated with this project, they can be valued at approximately
$.03/kWh. RECs are essentially the “greenness” of the electricity. The College cannot sell the
project’s RECs and then claim the project is helping us achieve our goal of lowering greenhouse
gas emissions. Selling the project’s RECs would allow some other entity to claim the reduction
in greenhouse gas emission associated with this project.
Alternative Ownership/Funding Structures
There are several other types of ownership structures for a project of this scale. First, the
College could solicit alumni to help fund the project. This method has the potential to raise more
money than seeking loans from banks. In addition, it may provide more favorable terms for the
College than private investors would provide. The College could also engage private investors
for the project. This would allow the investors to take advantage of certain tax credits that the
College otherwise could not. Under certain agreements known as the “flip” ownership structure,
private investors own the project to take advantage of tax benefits and then ownership eventually
switches to the College once the tax breaks are exhausted. Finally, the College could allow an
outside firm to develop and market the project. This method allows for the College to be almost
entirely hands-off while still benefiting from receiving clean energy to power the College.51
51
Community Wind Development. April 2006.
Table 5. Financial analysis for a project of three 1.8 MW Vestas turbines.

22
Conclusion
In conclusion, the Berlin Pass is the ideal College-owned property on which to develop a
wind farm. The Pass has consistent high wind speeds and relatively easy access to roads and
major transmission lines. The economics of even the most conservative scenarios are financially
attractive. In all likelihood, the project would pay for itself within five to ten years of completion
and quite possibly faster than that. Once the administration decides to proceed on this project, I
would recommend retaining a developer to help with the engineering and permitting associated
with the project as well as do a more thorough feasibility study (Appendix D and E).
The biggest foreseeable obstacles will be obtaining permitting in the town of Berlin,
transporting the parts of the turbine to the Berlin Pass, and interconnecting with the grid.
However, with the proper incentives the permitting issue can likely be overcome. Similarly, the
transportation and interconnection issues will be surmountable with the proper engineering
experience. I would recommend moving forward with this project as soon as possible.
Completion of this project will go a long way toward achieving the College’s greenhouse gas
emission reduction goals.
Acknowledgements
This project was supported by my summer internship through the Zilkha Center for
Environmental Initiatives. I would like to thank Stephanie Boyd, Amy Johns, David Dethier, and
Jay Racela for their help and advice throughout the summer. In addition, I am grateful for the
help of Jeff Jones, Mimi Roy, and Jason Moran for additional advice and information throughout
the summer. Also, I would like to thank Matt Perkins at GE Energy and Andrew Ragland at
Vestas for providing me with information about their companies’ wind turbines. Finally, I would
like to give a special thanks to Nick Hiza (and all the previous students who have worked on the
Berlin Pass Wind Project) for his suggestions and comments as well as his initial work on the
Berlin Wind Feasibility Study in 2003.

23
Works Cited
“Airspace Issues in Wind Turbine Siting.” Renewable Energy Trust. 26 January 2007.
Massachusetts Technology Collaboration. 9 August 2009.
< http://www.masstech.org/renewableenergy/MTC_FAA.pdf>.
Arons, Samuel. Energy Yield and Visual Impact Studies of the Berlin Wind Project. Williams
College. Thesis, 2004.
Augenbraun, JJ. Small Scale Wind Turbines at Williams College. 19 May 2009.
“Average Bottle Fallacy.” Danish Wind Industry Association. 1 June 2003. Danish Wind
Industry Association. 7 August 2009. <http://www.windpower.org/en/tour/wres/
bottle.htm>.
Berlin Town Board. Town of Berlin: Land Use Regulations, 1988.
Boyd, Stephanie. Direction of the Zilkha Center for Environmental Initiatives at Williams
College. Personal communication. 30 July 2009.
Canada, Collins, Lindi von Mutius, Sarah Wu, Vivian Schoung. Report on the Feasibility of a
Wind Power Project on the Berlin Pass. 15 December 2002.
“Code of Williamstown.” Code of Williamstown. 20 May 2008. Town of Williamstown. 9
August 2009. <http://s230494718.onlinehome.us/wp-content/uploads/2008/03/Code-of-
Williamstown.pdf>.
“Community Wind Development.” Clean Energy State Alliance. April 2006. Columbia
University. 24 June 2009.
DeRose, Joanne. Representative of National Grid. Personal communication. 20 July 2009.
Dethier, David. Professor of Geosciences at Williams College. Personal communication. 6
August 2009.
“Federal Incentives/Policies for Renewables and Efficiency.” Database of State Incentives for
Renewables and Efficiency. 11 August 2009. N.C. State University. 11 August 2009.
<http://www.dsireusa.org/>.
Gagnier, Grant. Representative of Aeronautica. Personal communication. 3 August 2009.
“Guided Tour.” Danish Wind Industry Association. 1 June 2003. Danish Wind Industry
Association. 10 August 2009. < http://www.windpower.org/en/tour.htm>.
Hiza, Nicholas, Chris Warshaw, Frederick Hines, and Stefan Kaczmarek. The Berlin Wind
Project: An Interim Report on Project Feasibility and Potential Environmental Impact.
11 May 2003.

24
“Inflation by Decade.” Inflation Data. 2009. Capital Professional Services. 17 August 2009.
< http://www.inflationdata.com/inflation/Inflation/DecadeInflation.asp>.
“Inflation Calculator.” CPI Inflation Calculator. Bureau of Labor Statistics. 11 August 2009.
<http://data.bls.gov/cgi-bin/cpicalc.pl>.
Johns, Amy. “Energy Use.” Sustainability at Williams. 2008. Williams College. 10 August 2009.
< http://www.williams.edu/resources/sustainability/energy_use.php>.
Jones, Andrew. “History.” Hopkins Memorial Forest. Williams College. 9 August 2009.
< http://www.williams.edu/CES/hopkins/history/historyhome.htm>.
Kuriakose, Alex. Senior Engineer for Distributed Generation Services at National Grid. Personal
communication. 4 August 2009.
Moran, Jason. Project manager for Facilities Department at Williams College. Personal
communication. 17 August 2009.
Patterson, James. “Development of Obstruction Lighting Standards for Wind Turbine Farms.”
Technical Notes. November 2005. Federal Aviation Administration. 10 August 2009.
<http://www.airtech.tc.faa.gov/safety/Downloads/TN05-50.pdf>.
Perkins, Matt. Representative for GE Energy. Personal communication.29 July 2009.
“Plot System.” HMF Permanent Plot System. Williams College. 9 August 2009.
<http://oit.williams.edu/hmfplot/methodology.php?which=plotsystem>.
Ragland, Andrew. Representative for Vestas. Personal communication. 22 July 2009.
Schapiro, Morton. “Letters from the President and Trustees.” Williams College. 24 January
2007. Williams College. 16 May 2009. <http://www.williams.edu/admin/
president/letters/070124_CAC.php>.
Staskus, Martha. Representative of Vermont Environmental Research Associates. Personal
communication. 29 July 2009.
“Wind Turbines.” GE Energy. General Electric. 5 August 2009. <http://www.gepower.com/
prod_serv/products/wind_turbines/en/index.htm>.
“Wind Turbines.” Wind Power Solutions. Vestas. 5 August 2009. <http://www.vestas.com/en
/wind-power-solutions/wind-turbines.aspx>.

25
Image Credits
Figure 1:
Image provided by JJ Augenbraun, Summer Intern at the Zilkha Center.
Figure E1:
Base image obtained from Hiza, Nicholas et al. The Berlin Wind Project: An Interim Report on
Project Feasibility and Potential Environmental Impact. 11 May 2003. Additional editing
of Hopkins Memorial Forest proposed site by JJ Augenbraun.
Figure 2:
Image provided by Jay Racela, Technical Assistant for the Center for Environmental Studies.
Figure 3: Image provided by JJ Augenbraun.
Figure 4:See Figure E1.
Figure 5:
“HMF Map.” HMF Permanent Plot System. Williams College. 9 August 2009.
<http://oit.williams.edu/hmfplot/image/hmfmap.jpg>.
Figures 6 and 7:
Hiza, Nicholas et al. The Berlin Wind Project: An Interim Report on Project Feasibility
and Potential Environmental Impact. 11 May 2003.
Figures 8 and 9:
Images provided by JJ Augenbraun
Figure 10:
Base image obtained from Google Maps. 16 August 2009. Additional editing by JJ Augenbraun.
Figure 11:
Image obtained from Hiza, Nicholas et al. The Berlin Wind Project: An Interim Report on
Project Feasibility and Potential Environmental Impact. 11 May 2003.
Figure 12:
Graph prepared by JJ Augenbraun.
Figure 13:
Imaged provided by Jay Racela.
Figure 14:
Graph prepared by JJ Augenbraun
Figure 15:
Graph taken from Sustainability at Williams website. < http://www.williams.edu/resources/
sustainability/campus_electricity_trends/electricity_trends_advanced.php>.

26
Appendix A: Perl Script for Detecting Missing Data
#!/usr/bin/perl
# by JJ Augenbraun
use strict;
use Time::Local;
open(FILEIN, "VariousHeightsData.txt") #input file
or die("could not open file: $!\n");
open(FILEOUT, ">MissingData.txt") #output file
or die("could not write file: $!\n");
my $line;
my $chan1; #50 m (1)
my $chan2; #50 m (2)
my $missingCounter; #number of missing cells in a row
my $firstMissingDate; #first missing date in a set of missing dates
my $previousTimeStamp; #previous date and time
while($line = <FILEIN>) {
my @token = split /\t/, $line; #splits the line by tab delimiters
my $dateString = $token[0]; #stores the date string 6/13/2005 11:30
$chan1 = $token[1]; #stores 50 m channel 1 data in string
$chan2 = $token[2]; #stores 50 m channel 2 data in string
my $temperature = $token[5]; #stores temperature data in string
if(($chan1 <= 0.4) or ($chan2 <= 0.4)) {
if($firstMissingDate eq("")) {
$firstMissingDate = $dateString;
}
$missingCounter++;
} else {
if($firstMissingDate ne("")) {
print FILEOUT "$firstMissingDate,$missingCounter\n";
$firstMissingDate = "";
$missingCounter = 0;
}
}
$dateString =~ /(\d{1,2})\/(\d{1,2})\/(\d{4})\s(\d{1,2}):(\d{2})/;
my $month = $1-1;
my $day = $2;
my $year = $3;
my $hour = $4;
my $minute = $5;

27
my $currentTimeStamp = timelocal(0, $minute, $hour, $day, $month, $year);
if($previousTimeStamp) {
my $difference = ($currentTimeStamp - $previousTimeStamp)/600;
if($difference > 1) {
print FILEOUT "$dateString,$difference\n";
}
}
$previousTimeStamp = $currentTimeStamp;
}
close(FILEIN);
close(FILEOUT);
exit;
Appendix B: Procedure for Correcting Missing Wind Data
-when one 50 meter channel is missing data, copy in data from other 50 meter channel
-when both channels are missing data, average data cells before and after the missing
chunk in the amount equal to the missing chunk for each channel (only if 144 or
less cells are missing)
-when more than 144 cells are missing data, try to fill in with data from same time in
other years by averaging the data from the other three years for that time period
-fill in large chunks with other year’s data before filling in smaller chunks reliant on
the data missing in the larger chunks
-when 50 meter wind speed is less than 30 meter wind speed and temperature is below
freezing, use 30 meter or 40 meter data

28
Appendix C: GE and Vestas Wind Turbines52
GE 1.5 MW turbines:
http://www.gepower.com/prod_serv/products/wind_turbines/en/15mw/specs.htm
-65 and 80 m hub heights for 1.5 MW SLE
-3.5 m/s cut in speed and 25 m/s cut out speed
-77 m diameter rotor
-65 and 80 m hub height for 1.5 MW SL
-3.5 m/s cut in speed and 20 m/s cut out speed
-77 m diameter rotor
-80 m hub height for 1.5 MW XLE
-3.5 m/s cut in speed and 20 m/s cut out speed
-82.5 m diameter rotor
GE 2.5 MW turbines:
http://www.gepower.com/prod_serv/products/wind_turbines/en/2xmw/index.htm
-75, 85, and 100 m hub heights for 2.5 MW XL
-3.5 m/s cut in speed and 25 m/s cut out speed
-100 m diameter rotor
Vestas 1.65 MW turbines:
http://www.vestas.com/en/wind-power-solutions/wind-turbines/1.65-mw.aspx
-70 and 80 m hub heights for 1.65 MW V82
-3.5 m/s cut in speed and 20 m/s cut out speed
-82 m diameter rotor
Vestas 1.8 and 2.0 MW turbines:
http://www.vestas.com/en/wind-power-solutions/wind-turbines/2.0-mw.aspx
-80 and 95 m hub heights for 1.8 MW V90
-4 m/s cut in speed and 25 m/s cut out speed
-90 m diameter rotor
-80 and 95 m hub heights for 1.8 MW V100
-4 m/s cut in speed and 20 m/s cut out speed
-100 m diameter rotor
-67 and 80 m hub heights for 2.0 MW V80
-4 m/s cut in speed and 25 m/s cut out speed
-80 m diameter rotor
Vestas 3.0 MW turbines:
http://www.vestas.com/en/wind-power-solutions/wind-turbines/3.0-mw.aspx
-80 and 105 m hub heights for 3.0 M V90
-4 m/s cut in speed and 25 m/s cut out speed
-90 m diameter rotor
52
Information on wind turbines obtained from GE (http://www.gepower.com/prod_serv/products/wind_turbines
/en/index.htm) and Vestas (http://www.vestas.com/en/wind-power-solutions/wind-turbines.aspx).

29
Appendix D: List of Potential Developers
Aeronautica Windpower
Website: http://aeronauticawind.com/aw/index.html
Contact Information: [email protected]
800.360.0132
Location: Plymouth, MA
Services: Wind study, permitting/engineering, installation, service, financing
Ownership: Flexible options
Turbines: Manufacture their own or can use outside vendor
EOS Ventures
Website: http://www.eos-ventures.com/
Contact Information: [email protected]
413-738-7007
Location: Hancock, MA
Services: design, installation, commissioning
Ownership: Engineering, procurement, and construction (EPC), Power Purchase Agreement, flip
model
Turbines: Do not manufacture the turbines
Northern Power Systems
Website: http://www.northernpower.com/index.php
Contact Information: 877-90-NORTH or 802.461.2955
Location: Barre, VT
Services: Installation and servicing
Turbines: Manufacture their own
First Wind
Website: http://www.firstwind.com/index.cfm
Contact Information: [email protected]
617-964-3340
Location: Newton, MA
Services: Development, ownership, and operation of wind farms
Vermont Environmental Research Associates
Website: http://www.northeastwind.com/
Contact Information: [email protected]
802-244-7522
Note: Martha Staskus gives tours at Searsburg, her email is [email protected]
Location: Waterbury Center, VT
Services: Project management, wind resource assessment, environmental assessment, economic
analysis, public outreach
Mortenson
Website: http://www.mortenson.com/
Contact Information: [email protected]

30
763-522-2100
Location: Minneapolis, MN
Services: Development, design, construction, and project management
Wanzek
Website: http://www.wanzek.com/
Contact Information: [email protected]
701-282-6171
Location: Fargo, ND
Services: EPC, BOP, general construction services, plant maintenance services
Blattner Energy
Website: http://www.blattnerenergy.com/
Contact Information: http://www.blattnerenergy.com/contact_us.php
320-356-7351
Location: Avon, MN
Services: EPC
RMT – Fowler Ridge
Website: http://www.rmtinc.com/public/index.html
Contact Information: [email protected]
608-831-4444
Location: Madison, WI
Services: EPC
Patriot Renewables
Website: http://www.patriotrenewables.com/index.html
Contact Information: [email protected]
617-890-0600
Location: Quincy, MA
Services: Developer, owner, and operator
Note: Affiliate of Jay Cashman, Inc.

31
Appendix E: Project Information for Potential Developers
Overview of Site:
GPS Location of Met Tower: 42.72824 N, 73.27106 W elev. 716 m
GPS Location of middle of proposed wind site: 42.70620335 N, 73.28935715 W elev. 686 m

32
Description/current land use
-college owned land located on Berlin Pass, between Berlin Mountain and Mount Raimer
-400 acres of steep forested land in a rough rectangular shape
-approximately 5000 feet east to west and 7000 feet north to south
-highest point is 856 m, some of the land extends into MA, but none of the proposed site
Estimated Distance to Power Distribution/Substation
-3.25 miles to Route 7 power lines
-about 7.5 miles to Williams College Heating Plant
-may be closer high voltage lines on NY site, haven’t fully explored this possibility
Average cost per kWh
-12 cents a kWh
College Annual Electricity Use:
-27,368,364 kWh total, 5,686,933 kWh generated in our cogeneration plant
Desired Annual Production of Project:
-17,000,000 to 22,000,000 kWh
More Information about College’s Energy Use:
http://www.williams.edu/resources/sustainability/index.php
Land Restrictions
-land closest to site on MA side is part of an upland conservation zone
Community Opposition/Support for Wind Energy Projects
-according to a survey done in 2002, 87% of local population expressed strong or very strong
support for the Berlin Wind Project

33
Current Zoning of Property
-Rural Use District in NY
-wind turbines would be in excess of height restrictions for rural use of 35’
-special permit required
Wetlands
-according to 2003 Berlin Wind Feasibility Study, no wetlands have been recognized along the
ridgetop of this site
Endangered Species Habitat
-also according to 2003 Berlin Wind Feasibility Study, no endangered species living in site area
Berlin Town Wind Energy Bylaw
-none, Land Use Regulations exist from 1988
-previous attempt in 2003-2004 to erect a meteorological tower on site was blocked by Town
Zoning Board, political climate most likely has changed
Berlin Town Wind Energy Committee
-none