wilson, m. b., sedlacek, w. e., & lowery, b. l. (2014). an...
TRANSCRIPT

022213
1
Wilson, M. B., Sedlacek, W. E., & Lowery, B. L. (2014). An approach to using noncognitive variables in dental school admissions. Journal of Dental Education. 78, 567-574.
Abstract: Dental school admissions committees continue to grapple with challenges associated with recruiting, admitting and enrolling students who best meet the mission of the particular institution. For many students, particularly students of color, and those from non-traditional backgrounds, standardized tests such as the Dental Aptitude Test (DAT) are poor predictors of their potential for success. Sedlacek presents a noncognitive assessment method that can be used in conjunction with traditional cognitive measures in making admissions decisions. His method has been employed by hundreds of higher education institutions, foundations, and scholarship programs, but is relatively new in dental education. This article describes the eight noncognitive variables comprising Sedlacek’s assessment model, discusses one dental school’s implementation of the model, and provides preliminary analysis of the correlations between noncognitive variable scores and admissions recommendations and decisions. Background The East Carolina University (ECU) School of Dental Medicine was established specifically by the North Carolina legislature in 2007 to address the significant need for dentists within the state of North Carolina. North Carolina currently ranks 47th nationally in the number of dentists per capita.1 Against this backdrop of substantial shortages overall, the State faces a number of additional factors further compounding North Carolinians’ access to oral health care: a rural/urban maldistribution of practicing dentists, an aging dental workforce, rapid population growth, and a shift in ethnic composition. The infusion of new dental graduates from the establishment of the ECU School of Dental Medicine, and the expansion of the class size graduating from the University of North Carolina at Chapel Hill School of Dentistry, may not provide sufficient numbers to meet the growing needs of the population. It is therefore even more essential that graduates possess the attributes and skills necessary to meet the needs of our vulnerable populations. In concordance with the compelling rationale for its establishment, the vision of the School focuses on: “Improving the health and quality of life of all North Carolinians by creating leaders with a passion to care for the underserved and by leading the nation in community-based, service learning oral health education.” The School’s mission statement further affirms the institution’s commitment to:
“Prepare leaders with outstanding clinical skills, ethical bearing, sound judgment, and a passion to serve.
Provide educational opportunities for academically qualified individuals from historically underrepresented groups, disadvantaged backgrounds and underserved areas.

022213
2
Provide and enhance oral health services for underserved North Carolinians through implementation of community-oriented service learning and inter-professional collaborations.
Foster an environment where creativity, collaboration, diversity and professionalism are embraced.
Influence future clinical practice and dental education through research, innovation and discovery.”2
The School’s inaugural class of 52 students – all North Carolina residents – matriculated in August 2011; a second cohort of 52 students matriculated in August 2012. The School will continue to admit approximately 50 students, all North Carolinians, per year. The School specifically seeks to educate of dentists from rural, disadvantaged and under-represented minority backgrounds, who articulate a commitment to providing primary care dentistry services in communities of need across the state of North Carolina. Health professionals who come from disadvantaged backgrounds or are members of under-represented minorities are more likely to provide care in communities of need.3 With a more diverse dental workforce that is committed to serving in communities of need, our most vulnerable populations, including those with low incomes, children, older people, and people with disabilities, will have greater access to oral health care.
The American Dental Education Association (ADEA) reports that for the 2010 entering classes, of the 4,947 students enrolled in as first-time enrollees year in US dental schools, Hispanics/Latinos comprised 7.2%, African Americans comprised 5.4% and Native Americans comprised less than one percent of first year enrollees. Under-represented minority students collectively accounted for less than thirteen percent of the total first-year enrollment.4 Total US dental school enrollment followed a similar distribution. 5 US dental schools have undertaken numerous strategies to increase the diversity within their schools in the profession. Examples include: middle school and high school outreach programs, designated scholarships and in private schools tuition waivers, summer programs for college students, mentoring programs, DAT workshops, early admission programs for gifted students, five year programs, and similar efforts. Funded by the Robert Wood Johnson Foundation and the California Endowment, the Pipeline, Profession and Practice: Community-Based Dental Education program outcomes provide evidence of the impact of specifically targeted programs and institutional strategies for increasing the numbers of underrepresented minority and low income students in dental schools. Among the common elements among the fifteen Pipeline schools reported by Brunson et al were mission-drive recruitment and retention practices.6 Price and Grant-Mills further reiterated the critical importance of the alignment between an institution’s mission and its educational objectives, advocating for a comprehensive review of all candidates as key step in ensuring that the institution meets its mission of educating dentists who are prepared to care for an increasingly diverse society.7

022213
3
Mission-Centered Recruitment and Admissions The ECU School of Dental Medicine is committed to its mission of providing educational opportunities for a diverse group of students, and has developed and implemented mission-aligned recruitment and admissions strategies. Traditionally, United States and Canadian dental admissions committees have relied upon academic and cognitive data such as completion of pre-requisite courses, DAT scores and grade point averages to guide admissions decisions,8 although Curtis et al have demonstrated that such factors are not predictive of academic performance in dental school.9 The recognition of the limitations of traditional cognitive measures in predicting dental school outcomes, combined with the compelling need for increased diversity within the dental workforce, has led many admissions committees to move toward a more holistic approach to admissions. Within such a framework, variables such as leadership, community service and shadowing experiences are often included in the admissions deliberation process. Lopez et al describe a systematic process for including non-academic factors in a quantifiable format.10 Admissions committees are increasingly utilizing noncognitive factors in making admissions decisions. In Beyond the Big Test: Noncognitive Assessment in Higher Education, Sedlacek provides evidence that noncognitive variables should play a key role in admissions decisions, asserting that noncognitive variables will predict the success of all students, but particularly those experiencing some form of discrimination. Moreover, noncognitive variables provide information to faculty and staff that is critical to providing effective post matriculation services.11 Utilizing an evidence-based approach, Sedlacek demonstrates the validity of employing noncognitive variables for selecting and developing students in the health professions. 12 Given that there is evidence that traditional cognitive measures such as the DAT may not be accurate predictors of success for individuals from non-traditional, disadvantaged, and minority backgrounds (the very populations we are seeking to admit), the School of Dental Medicine has implemented the use of noncognitive variables as a key part of the admissions process. Noncognitive Variables Sedlacek advocates the use of an assessment method, based on eight noncognitive variables, in making admissions decisions. The eight noncognitive variables in Sedlacek’s system are positive self-concept, realistic self-appraisal, understanding and knowing how to navigate the system, preference for long-range goals, availability of a strong support-person, successful leadership experience, demonstrated community service, and knowledge acquired in or about a field.11 (See Exhibit 1) Exhibit 1 – Description of Noncognitive Variables

022213
4
Variable # Variable Name
1
Positive Self-Concept
Demonstrates confidence, strength of character, determination, and independence.
2
Realistic Self-Appraisal
Recognizes and accepts any strengths and deficiencies, especially academic, and works hard at self-development. Recognizes need to broaden his/her individuality.
3
Understands and Knows How to Navigate the System
Exhibits a realistic view of the system based upon personal experience of racism. Committed to improving the existing system. Takes an assertive approach to dealing with existing wrongs, but is not hostile to society, nor is a "cop-out." Able to handle racist system.
4 Prefers Long-Range to Short-Term or Immediate Needs
Able to respond to deferred gratification, plans ahead and sets goals.
5
Availability of Strong Support Person
Seeks and takes advantage of a strong support network or has someone to turn to in a crisis or for encouragement.
6
Successful Leadership Experience
Demonstrates strong leadership in any area of his/her background (e.g. church, sports, non-educational groups, gang leader, etc.).
7 Demonstrated Community Service
Participates and is involved in his/her community.
8
Knowledge Acquired in or about a Field
Acquires knowledge in a sustained and/or culturally related ways in any field.
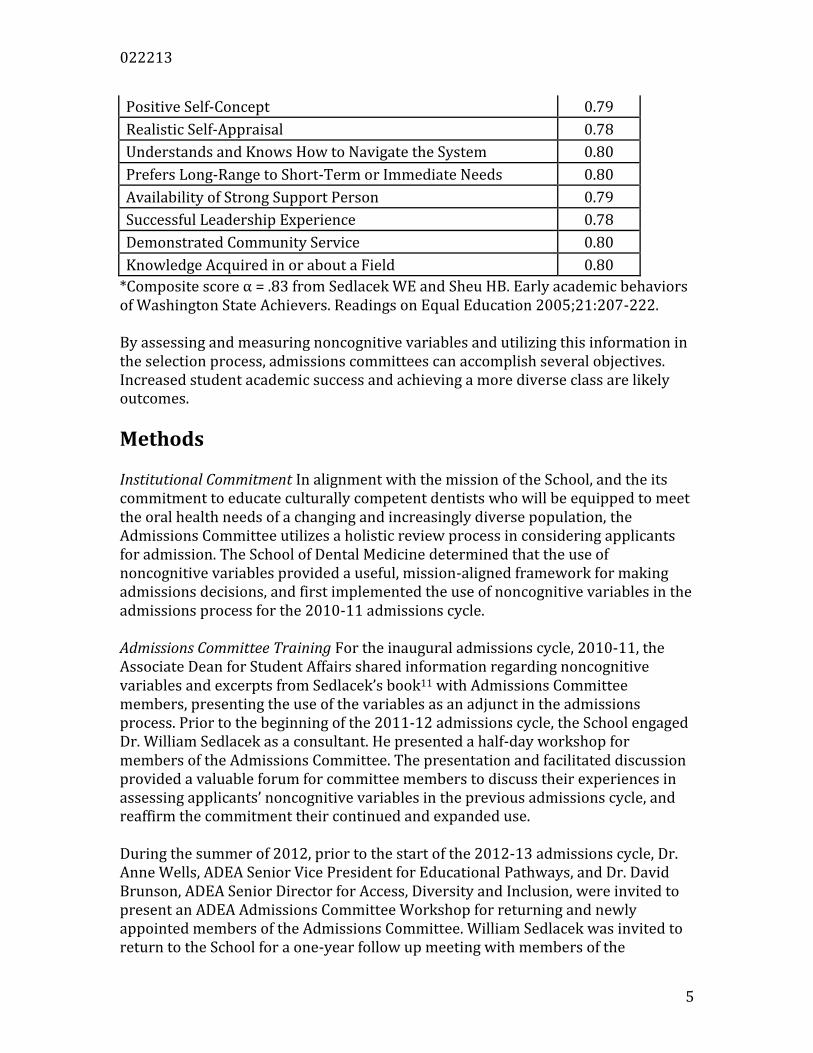
Assessing and Measuring Noncognitive Variables Noncognitive variables can be assessed and measured in a variety of ways using several versions of paper and pencil or online instruments through application reviews for admissions, scholarship programs, financial aid, or support programs. Additional information can also be obtained by reviewing individuals’ essays and verbal or written responses to structured items or short-answer questions. A number of programs, including the Gates Millennium Scholars program13 14, the Washington State Achievers program,15 and Oregon State University16 utilize different methods of measuring the noncognitive variables. In their work with Washington State Achievers, Sedlacek and Sheu provide reliability estimates of scale sores. 15 Exhibit 2 – Reliability Estimates of Scale Scores
Variable α
022213
5
Positive Self-Concept 0.79
Realistic Self-Appraisal 0.78
Understands and Knows How to Navigate the System 0.80
Prefers Long-Range to Short-Term or Immediate Needs 0.80
Availability of Strong Support Person 0.79
Successful Leadership Experience 0.78
Demonstrated Community Service 0.80
Knowledge Acquired in or about a Field 0.80
*Composite score α = .83 from Sedlacek WE and Sheu HB. Early academic behaviors of Washington State Achievers. Readings on Equal Education 2005;21:207-222.
By assessing and measuring noncognitive variables and utilizing this information in the selection process, admissions committees can accomplish several objectives. Increased student academic success and achieving a more diverse class are likely outcomes.
Methods
Institutional Commitment In alignment with the mission of the School, and the its commitment to educate culturally competent dentists who will be equipped to meet the oral health needs of a changing and increasingly diverse population, the Admissions Committee utilizes a holistic review process in considering applicants for admission. The School of Dental Medicine determined that the use of noncognitive variables provided a useful, mission-aligned framework for making admissions decisions, and first implemented the use of noncognitive variables in the admissions process for the 2010-11 admissions cycle. Admissions Committee Training For the inaugural admissions cycle, 2010-11, the Associate Dean for Student Affairs shared information regarding noncognitive variables and excerpts from Sedlacek’s book11 with Admissions Committee members, presenting the use of the variables as an adjunct in the admissions process. Prior to the beginning of the 2011-12 admissions cycle, the School engaged Dr. William Sedlacek as a consultant. He presented a half-day workshop for members of the Admissions Committee. The presentation and facilitated discussion provided a valuable forum for committee members to discuss their experiences in assessing applicants’ noncognitive variables in the previous admissions cycle, and reaffirm the commitment their continued and expanded use.
During the summer of 2012, prior to the start of the 2012-13 admissions cycle, Dr. Anne Wells, ADEA Senior Vice President for Educational Pathways, and Dr. David Brunson, ADEA Senior Director for Access, Diversity and Inclusion, were invited to present an ADEA Admissions Committee Workshop for returning and newly appointed members of the Admissions Committee. William Sedlacek was invited to return to the School for a one-year follow up meeting with members of the

022213
6
Admissions Committee, and to make a presentation to all faculty regarding the use of non-cognitive factors in admissions and in student development. Dr. Sedlacek’s presentations and the ensuing discussions provided further opportunities for Admissions Committee members to reflect on the myriad factors that comprise admissions decisions. Based on a review of applicant data for the 2012 cycle, and further confirmed by information presented by Drs. Wells, Brunson and Sedlacek, the Admissions Committee determined that for the 2013 admissions cycle, consideration of noncognitive variables could be more heavily weighted in making decisions regarding which applicants to invite for interviews. At the same time, cognitive factors (e.g, DAT scores) could receive somewhat less emphasis, particularly for individuals with exceptionally strong noncognitive variable.
Initial Application Review Process Students seeking admission to the School of Dental Medicine complete and submit applications through the Associated American Dental Schools Application Service (AADSAS). Once AADSAS applications are received in the Office of Student Affairs, applicants are invited to complete the ECU School of Dental Medicine supplemental application and submit an application-processing fee. The completed AADSAS and supplemental applications undergo a holistic review. Reviewing each applicant’s AADSAS application, including personal statement, description of community, leadership and extracurricular activities, and letters of recommendation, can facilitate assessment of noncognitive variables. Given the limitations of time available for interviews, the School determined that reviewing students’ written responses to questions could effectively assess some of the noncognitive variables, while the context of personal interviews would provide an appropriate setting for effectively assessing other variables. The School specifically designed questions on its supplemental application to address four of the noncognitive variables:
Exhibit 3 – Supplemental Application Questions
Availability of Strong Support Person
Other than your parents, describe someone who has been a strong support person for you. In what specific ways was that person supportive?
Successful Leadership Experience
Describe a situation where your attempts at leadership were not successful? Why do you think that was?
Demonstrated Community Service
Describe the role you played in a group that worked together toward a common goal. What did you learn from that experience?
Knowledge Acquired in or about a Field
Describe a crisis in your life and what you learned from it.
Based on preliminary application review, applicants whose non-cognitive factors indicate their potential for fitting the mission of the School, and whose academic record and DAT scores meet the minimum criteria for admission are invited to interview with members of the Admissions Committee.

022213
7
Applicant Interviews The School interviews eight applicants per interview day. The interview cycle typically begins in mid-September and concludes in mid- to late February. Each applicant has three one-on-one interviews with members of the Admissions Committee. As part of the interview process, each applicant has a chance to respond to questions aimed at assessing specific noncognitive variables: Exhibit 4 – Standardized Interview Questions
Positive Self-Concept Realistic Self-Appraisal
Do you think that you are good at most things? Why or why not?
In what areas do you anticipate that you will excel in dental school?
Understands and Knows How to Navigate the System
What kinds of things are you not good at? Why?
What challenges do you anticipate facing in dental school?
Positive Self-Concept Realistic Self-Appraisal
Describe a situation where you believe you were not treated fairly. Why do you think that happened?
Do you believe that there are inequities in our dental health care system? Why or why not?
Understands and Knows How to Navigate the System
If it turns out that for some reason, you do not receive an offer of admission to dental school for this application cycle, what are your plans?
Aside from dentistry, what other goals do you have in your life? Each interviewer independently assesses and scores each applicant on scale of 1 to 4 (4=highest) for each of the eight noncognitive variables. Interviewers record their scores and comments into specially designed electronic forms, using iPads. The interviewers’ scores for each variable and total scores for each applicant are calculated and entered into a database. Each interviewer also provides an overall desirability score for each applicant, with 1=highest and 4=reject. Exhibit 5 summarizes the individual interviewers’ assessment method.
Exhibit 5 – Individual Interviewers’ Assessments
Individual Interviewers' Assessments
Noncognitive variable score
4 = highest
1 = lowest
Desirability 1 = most desirable
4 = least desirable Admissions Committee Review and Action At regularly scheduled Admissions Committee meetings, the Committee reviews each interviewed applicant. Each Admissions Committee meeting begins with an affirmation of the mission of the School of Dental Medicine relative to admission of students. The Committee considers the recommendations of the interviewers – including noncognitive variable scores, and all available admissions data and information in making

022213
8
admissions decisions. While the Admissions Committee does not utilize a decision algorithm or rubric in making admission decisions, noncognitive variable scores play a key role in determining an individual’s potential for fulfilling the mission of the School of Dental Medicine, and in admissions decisions. After careful review, discussion and deliberation, the School of Dental Medicine extends offers of admission to the most highly desirable candidates. While many candidates accept the offers of admission at matriculate at the School of Dental Medicine, some candidates decline their offers of admission and attend another dental school. Exhibit 6 delineates the admissions outcome scoring system used for the purposes of data analysis.
Exhibit 6 – Final Admissions Outcome - Class
Final Admissions Outcome (Class)
Offer extended; student matriculated 1
Offer extended; student declined 2
No offer of admission 3
Data Analysis Methods Noncognitive variable scores were calculated and maintained for each interviewed applicant in the 2010-11 and 2011-12 admissions cycles. Exhibit 7 delineates the abbreviations utilized for each of the variables. Exhibit 7 - Variable Abbreviations
Variable Abbreviation
Positive Self-Concept SC
Realistic Self-Appraisal RSA
Understands and Knows How to Navigate the System Nav
Prefers Long-Range to Short-Term or Immediate Needs
LRG
Availability of Strong Support Person SSP
Successful Leadership Experience Lead
Demonstrated Community Service Comm
Knowledge Acquired in or about a Field/Non-Traditional Learning
NT
Total Score TS
Applicants who were not interviewed and scored by three members of the Admissions Committee were eliminated, resulting in an N= 204 for the 2010-11 cycle and N=195 for the 2011-12 cycle. To minimize the impact of cycle-specific variables, data from each cycle were analyzed separately.

022213
9
For each applicant, the mean and standard deviation were calculated for the three interviewers’ scores of the eight noncognitive variable scores and total score. Means and standard deviations of the eight noncognitive variable scores and totals were then calculated for all applicants in each cycle cohort. Within each admissions cycle, Pearson correlation coefficients were calculated for the Noncognitive Variable scores and Total Scores for each applicant, with Desirability and with Final Admissions Actions – Class. Means and standard deviations were also calculated for each interviewers’ ratings of the eight noncognitive variables and total scores for applicants interviewed by the interviewer, for the 2012 cycle. This information was shared as feedback for each individual interviewer at the beginning of the 2013 cycle.
Results Interviewers’ scores of the eight noncognitive variables ranged from 2.33 for Leadership (Lead) to 2.70 for Positive Self-Concept (SC) for the 2011 cohort, and from 3.07 for Non-Traditional Learning (NT) to 3.51 for Strong Support Person (SSP) for the 2012 cohort. Applicants total scores for were 20.10 for the 2011 entering class and 26.15 for the 2012 entering class (Table 1). Mean scores for the 2012 cycle were higher overall than scores for the 2011 cycle. Table 1 – Means and Standard Deviations for Noncognitive Variable Scores and Total Scores
Entering Year
SC RSA Nav LRG SSP Lead Comm NT TS
2011 N=204
Mean 2.70 2.62 2.48 2.53 2.57 2.33 2.44 2.46 20.10 Std. Dev. 0.33 0.35 0.38 0.37 0.36 0.42 0.42 0.36 2.12
2012 N=195
Mean 3.44 3.33 3.12 3.34 3.51 3.12 3.21 3.07 26.15
Std. Dev. 0.35 0.37 0.47 0.46 0.39 0.48 0.53 0.45 2.24 Correlations of Noncognitive Scores with Desirability and Final Admissions Actions (Class) Tables 2 and 3 show the Pearson correlation coefficients for the Noncognitive Variable scores and Total Scores for each applicant, with Desirability (Table 2) and with Final Admissions Actions – Class (Table 3). Note that the Pearson correlation coefficients are negative because of the differences in the directions of the scales; for the Noncognitive Variable scoring, 4 = highest, while for Desirability and Class, 1 = highest. Table 2 – Pearson Correlations* of Noncognitive Variable Scores and Total Score with Desirability

022213
10
Entering Year
SC RSA Nav LRG SSP Lead Comm NT Total
2011 N=204 -.51 -.60 -.63 -.50 -.37 -.53 -.41 -.18 -.70 2012
N=195 -.55 -.53 -.42 -.44 -.28 -.40 -.47 -.26 -.65 * All correlations shown are significant at the .05 level. Not surprisingly, as depicted in Table 2, Total Score showed the highest correlations with Desirability. Among the individual Noncognitive Variable scores, Positive Self Concept (SC), Realistic Self-Appraisal (RSA), Long Range Goals (LRG), and Leadership (Lead) showed higher correlations than the other noncognitive variables, although individual other Noncognitive Variables did generally correlate with Desirability. Table 3 – Pearson Correlations* of Noncognitive Variable Scores with Admissions Decision (Class)
Entering Year
SC RSA Nav LRG SSP Lead Comm NT TS
2011 N=204 -.29 -.32 -.29 -.32 -.13 -.35 -.27 -.19 -.40 2012
N=195 -.30 -.30 -.28 -.39 -.12 -.30 -.35 -.13 -.43 *Correlations above .14 were significant at the .05 level.
As Table 3 indicates, Total Score showed the highest correlation with Class. Among the individual Noncognitive Variable scores, Positive Self Concept (SC), Realistic Self-Appraisal (RSA), Long Range Goals (LRG), and Leadership (Lead) showed higher correlations with Class than the other noncognitive variables. Generally, the correlations with Class were lower than with Desirability. For both admissions cycle samples, the correlations were highest for Total Score (TS) and were significant for Desirability and Class. Four of the Noncognitive Variable scores - Positive Self Concept (SC), Realistic Self-Appraisal (RSA), Long Range Goals (LRG), and Leadership (Lead) – showed the higher correlations for both Desirability and Class.
Discussion and Conclusions
Applicants with higher noncognitive variable scores received higher Desirability scores from their individual interviewers and were more likely to receive offers of admission. Applicants with lower noncognitive variable scores received lower

022213
11
Desirability scores from their individual interviewers and were more likely to be denied admission. The finding that the same four Noncognitive Variable scores showed higher correlation for both Desirability and Class indicates that the individual interviewers and the Admissions Committee seemed more likely to emphasize those variables in making admissions decisions. The correlations for Class may indicate that those students who are the best “fit” for the ECU program are the ones who are more likely to accept offers of admission. This will continue to be monitored closely over the years, as well as evaluated as part of assessing student development on the noncognitive variables for the matriculating students. The upward drift in mean scores from the 2011 cycle to the 2012 cycle is worth further study. It may indicate that the applicants to the 2012 cycle are stronger on noncognitive variables than their predecessors. Word may be out that ECU School of Dental Medicine is emphasizing those dimensions in admissions. An important part of the ECU program is to communicate its unique mission to advisors and prospective applicants. It could also be “Halo Effect” 17in that evaluators may be assigning higher scores in the second year, independent of applicant attributes. This is a problem that can occur in ratings as a program develops and raters feel positive about its mission and their role as evaluators. This underscores the need for continual calibration and training of interviewers, to ensure that the noncognitive variable scoring can be used to effectively differentiate among applicants. Differentiating among the applicants is the desired outcome regardless of the characteristics of the applicant pool. This preliminary data analysis demonstrates that noncognitive variables are related to admissions decisions in ways that are compatible with Sedlacek’s model, as implemented at the East Carolina University School of Dental Medicine. The next stage of data analysis will be to relate the noncognitive scale scores to outcome measures such as grades, retention, graduation, and ultimately variables such as career choices. Doing more comprehensive assessments can move us toward a determination of which persons might be considered nontraditional in our work with individuals or groups. Additionally, post-enrollment counseling, advising, and mentoring programs based on noncognitive variables can be developed. 18 The noncognitive variables were designed to be both predictors of student success in educational programs as well as developmental dimensions. While the noncognitive variables are particularly helpful in working with students from nontraditional backgrounds, they can employed to increase the likelihood of success of all students. Noncognitive profiles of all students are provided to faculty advisors, and faculty and staff have received training in helping students improve on the noncognitive variables, in what will be a continuing program.

022213
12
1 The Henry J. Kaiser Family Foundation. State health facts. Dentists per 10,000 civilian population, 2007: North Carolina. The Pew Center on the State Website. http://www.statehealthfacts.org/comparemaptable.jsp?ind=966&cat=8&sub=104&rgnhl=35 Accessed August 12, 2012. 2 Vision and Mission Statement, East Carolina University School of Dental Medicine http://www.ecu.edu/cs-dhs/dentistry/mission.cfm Accessed February 22, 2013. 3 Butters JM and Winter PA. Professional motivation and career plan differences between African-American and Caucasian dental students: implications for improving workforce diversity. J Natl Med Assoc 2002;94:2492-504. 4 American Dental Education Assocation, Dental School Enrollees by Race/Ethnicity in U.S. Dental Schools, 2000 to 2011. 5 American Dental Association, 2010-11 Survey of Dental Education-Academic Programs, Enrollment and Graduates: Volume 1, p. 44. 6 Brunson WD, Jackson DL, Sinkford JC, Valachovic RW. Components of effective outreach and recruitment programs for underrepresented minority and low-income dental students. J Dent Educ 2010;74:S74-S86. 7 Price SS, Grant-Mills D. Effective admissions practices to achieve greater student diversity in dental schools. J Dent Educ 2010;74:S87-97. 8 Ranney RR, Wilson MB, Bennett RB. Evaluation of applicants to predoctoral dental education programs: review of the literature. J Dent Educ 2005;69:1095–106. 9 Curtis DA, Lind SL, Plesh O, Finzen FC. Correlation of admissions criteria with academic performance in dental students. J Dent Educ 2007;71:1314–21. 10 Lopez N, Self K, Karnitz J. Developing a tool for systematic inclusion of non-academic factors in dental school admissions: Towards building diversity in the dental workforce. J Dent. Educ 2009;73:1347-52. 11 Sedlacek WE. Beyond the big test: Noncognitive assessment in higher education. San Francisco: Jossey-Bass, 2004. 12 Sedlacek WE. Why we should use noncognitive variables with graduate and professional students. The Advisor: J of the Nat Assoc of Advisors for the Health Professions. 2004;24:32-39. 13 Sedlacek WE and Sheu WB. Academic success of Gates Millennium Scholars. Readings on Equal Education 2004;20:181-197. 14 Sedlacek WE and Sheu WB. The academic progress of undergraduate and graduate Gates Millennium Scholars and non-scholars by race and gender. Readings on Equal Education 2008;23:143-177. 15 Sedlacek WE and Sheu WB. Early academic behaviors of Washington State Achievers. Readings on Equal Education 2005;21:207-222. 16 Oregon State University Admissions Website 2008: http://oregonstate.edu/admissions/firstYear/requirements.html 17 Nisbett RE, Wilson TD. The halo effect: Evidence for unconscious
alteration of judgments. J Personality and Social Psych 1977;35:250-256.

022213
13
18 Sedlacek WE et al. Mentoring in academia: Considerations for diverse populations. In Allen TD and Eby LT (Eds.), The Blackwell handbook of mentoring: A multiple perspectives approach (pp. 259-280). Malden, MA:Blackwell.