wilmar 3q18 results highlights - singapore exchange · this presentation does not constitute or...
TRANSCRIPT

November 12, 2018
3Q2018 Results Highlights
WILMAR INTERNATIONAL LIMITED
1
IMPORTANT NOTICE
Information in this presentation may contain projections and forwardlooking statements that reflect the Company’s current views withrespect to future events and financial performance. These views arebased on current assumptions which are subject to various risks andwhich may change over time. No assurance can be given that futureevents will occur, that projections will be achieved, or that theCompany’s assumptions are correct. Actual results may differmaterially from those projected.
This presentation does not constitute or form part of any opinion onany advice to sell, or any solicitation of any offer to purchase orsubscribe for, any shares nor shall it or any part of it nor the fact of itspresentation form the basis of, or be relied upon in connection with,any contract or investment decision.

2
Agenda
1 3Q2018 Financial Performance – Key Takeaways
2 Business Outlook
3 Appendix
3Q2018 Financial Performance – Key Takeaways

4
3Q18
(US$m)
vs 3Q17(1)
9M18
(US$m)
vs 9M17(1)
Revenue 11,606 4% 33,573 4%
EBITDA 908 19% 2,167 22%
Net profit 407 11% 927 21%
Net Profit- excluding discontinued operations
435 18% 955 24%
Core net profit 435 35% 970 49%
Earnings per share in US cents (fully diluted)
6.4 10% 14.7 20%
Earnings per shareIn US cents (fully diluted)
- excluding discontinued operations
6.9 19% 15.1 24%
Earnings Highlights
(1) Prior period figures were restated upon adoption of SFRS (I) 9 Financial Instruments and IFRS Convergence.

5
3Q18 3Q17(1) ∆ 9M18 9M17(1) ∆
Tropical Oils
(Plantation, Manufacturing &
Merchandising)
155.5 80.6 93% 412.0 294.2 40%
Oilseeds and Grains
(Manufacturing &
Consumer Products)
296.9 252.8 17% 759.7 520.8 46%
Sugar
(Milling, Merchandising, Refining &
Consumer Products)
76.4 75.2 2% (8.9) (66.1) 87%
Others (7.4) 56.5 n.m. 2.4 155.5 -98%
Joint Ventures & Associates 66.4 51.3 29% 157.4 116.5 35%
Unallocated expenses# (2.5) (1.9) -32% (8.4) (5.7) -47%
Profit Before Tax 585.3 514.5 14% 1,314.2 1,015.2 29%
Earnings Highlights – Segment Results (PBT US$m)
• (1) Prior period figures were restated upon adoption of SFRS (I) 9 Financial Instruments and IFRS Convergence.
• # Unallocated expenses refer to expenses in relation to the grant of share options to employees.
• n.m. – not meaningful

Cash Flow Highlights
6
US$ million 9M18 9M17(1) FY17(1)
Operating cash flow before working capital changes 1,197 1,674 2,596
Net cash flow generated from operating activities 1,651 1,499 386
Less: Acquisitions of subsidiaries, joint ventures and
associates(404) (96) (132)
Capital expenditure (956) (611) (938)
Net increase from bank borrowings* 3,880 2,540 4,119
Increase in other deposits and financial products
with financial institutions(3,628) (2,799) (2,848)
Dividends (495) (320) (320)
Others 338 158 101
Net cash flow 386 371 368
Free cash flow 773 1,232 (156)
(1) Prior period figures were restated upon adoption of SFRS (I) 9 Financial Instruments and IFRS Convergence.
Note : * Net bank borrowings include proceeds/repayments of loans and borrowings net of fixed deposits pledged with financial institutions for bank facilities and unpledged fixed deposits with maturity more than 3 months.
Free Cash Flow = Cashflows generated from/(used in) operations – Capital expenditure – Acquisitions/disposals of subsidiaries, joint ventures and associates.
Gearing
7
US$ million As at
Sep 30, 2018
As at
Dec 31, 2017 (1)
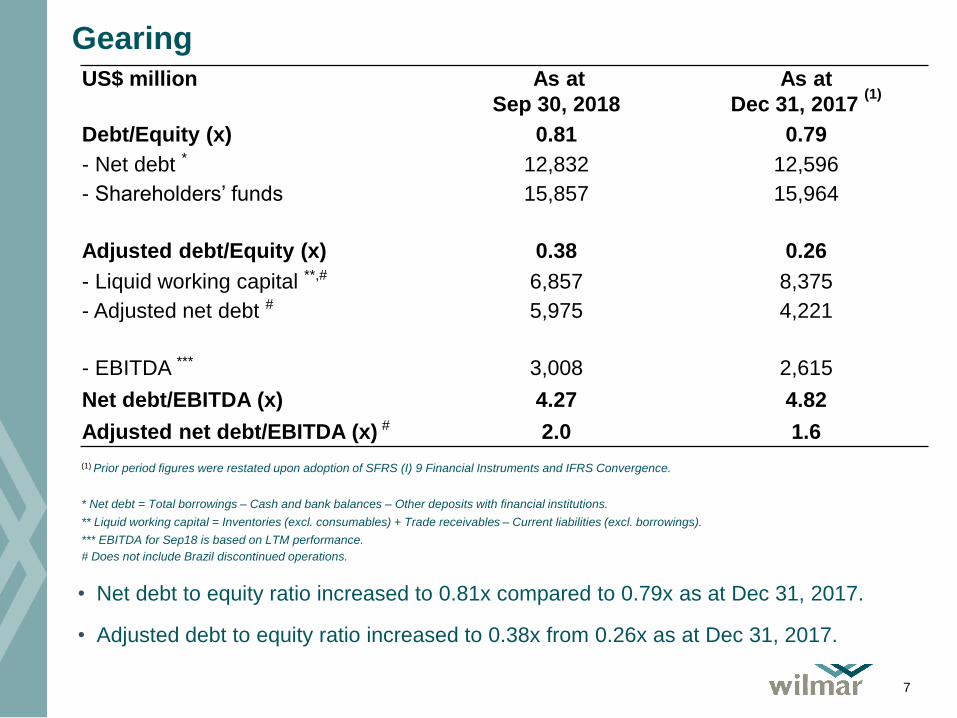
Debt/Equity (x) 0.81 0.79
- Net debt * 12,832 12,596
- Shareholders’ funds 15,857 15,964
Adjusted debt/Equity (x) 0.38 0.26
- Liquid working capital **,# 6,857 8,375
- Adjusted net debt # 5,975 4,221
- EBITDA *** 3,008 2,615
Net debt/EBITDA (x) 4.27 4.82
Adjusted net debt/EBITDA (x) # 2.0 1.6
• Net debt to equity ratio increased to 0.81x compared to 0.79x as at Dec 31, 2017.
• Adjusted debt to equity ratio increased to 0.38x from 0.26x as at Dec 31, 2017.
(1) Prior period figures were restated upon adoption of SFRS (I) 9 Financial Instruments and IFRS Convergence.
* Net debt = Total borrowings – Cash and bank balances – Other deposits with financial institutions.
** Liquid working capital = Inventories (excl. consumables) + Trade receivables – Current liabilities (excl. borrowings).
*** EBITDA for Sep18 is based on LTM performance.
# Does not include Brazil discontinued operations.

Business Outlook
• Performance of the new processing plants we have invested in the past
years, especially in China, Indonesia and India, continues to improve and
this has helped us achieve the current good set of results. We expect most
of our operations to continue to do well in the coming quarter, due to
generally better processing margins.
• Overall, we are cautiously optimistic that performance for the rest of the
year will be satisfactory.
88

Appendix

Business Segment results: Tropical Oils (Plantation, Manufacturing and Merchandising)
10
• Profit before tax increased by 93% in 3Q18, boosted by stronger performance from the
manufacturing and merchandising business. The higher palm oil production volume led to
improvements in downstream margins.
• Production yield improved 10% to 5.7 MT per hectare in 3Q18 and 9% to 16.4 MT per hectare in
9M18 as a result of favourable weather conditions and better yield trend.
• Sales volume increased by 9% in 3Q18, largely aided by higher biodiesel volume and increased
demand for the downstream products. Weaker commodity prices led to lower overall revenues in
3Q18 and 9M18.
3Q18 3Q17(1) ∆ 9M18 9M17(1) ∆
Revenue (US$ million)
➢ Plantation
➢ Manufacturing &
Merchandising
4,250.4
13.7
4,236.7
4,310.2
14.0
4,296.2
-1%
-2%
-1%
12,934.6
41.1
12,893.5
13,417.7
43.3
13,374.4
-4%
-5%
-4%
Sales volume# (‘000 MT)
➢ Manufacturing &
Merchandising
6,257 5,749 9% 17,633 17,149 3%
Profit before tax
(US$ million)155.5 80.6 93% 412.0 294.2 40%
(1) Prior period figures were restated upon adoption of SFRS (I) 9 Financial Instruments and IFRS Convergence.# Excludes plantation volume

Business Segment results: Tropical Oils (Plantation, Manufacturing and Merchandising)
11
3Q18 3Q17 ∆ 9M18 9M17 ∆
Planted area (ha) 228,443 237,212 -4% 228,443 237,212 -4%
Mature area harvested (ha) 194,429 205,848 -6% 194,429 205,848 -6%
FFB production (MT) 1,117,679 1,032,124 8% 3,184,102 3,002,370 6%
FFB Yield (MT/ha) 5.7 5.2 10% 16.4 15.0 9%
Mill Production
➢ Crude Palm Oil (MT) 574,289 486,022 18% 1,432,738 1,288,985 11%
➢ Palm Kernel (MT) 140,254 119,282 18% 348,806 310,767 12%
Extraction Rate
➢ Crude Palm Oil 19.7% 19.7% 0% 19.8% 19.9% -1%
➢ Palm Kernel 4.8% 4.8% 0% 4.8% 4.8% 0%

Plantation Age Profile
12
• Weighted average age of our plantations is approximately 11 years.
in hectares Average Age of Plantation
30 Sep 2018 0 - 3 yrs 4 - 6 yrs 7 - 14 yrs 15 - 18 yrs >18 yrs Total
Indonesia 10,806 12,028 89,545 11,886 27,554 151,819
Malaysia 13,875 9,421 9,749 8,521 15,765 57,331
Africa 5,881 9,258 1,913 1,706 535 19,293
Total planted area 30,562 30,707 101,207 22,113 43,854 228,443
% of total planted area 13.4% 13.4% 44.3% 9.7% 19.2% 100.0%
Included YTD new plantings of : 3,419
Plasma/outgrower Programme 48 142 9,431 3,130 23,054 35,805
% of planted area 0.1% 0.4% 26.3% 8.7% 64.4% 100.0%
31 Dec 2017
Indonesia 11,844 11,181 102,044 11,743 26,618 163,430
Malaysia 12,841 7,669 9,472 8,911 19,098 57,991
Africa 9,721 2,753 4,806 980 254 18,514
Total planted area 34,406 21,603 116,322 21,634 45,970 239,935
% of total planted area 14.3% 9.0% 48.5% 9.0% 19.2% 100.0%
Included YTD new plantings of : 1,819
Plasma/outgrower Programme 208 349 9,687 2,998 21,530 34,772
% of planted area 0.6% 1.0% 27.9% 8.6% 61.9% 100.0%

Business Segment results: Oilseeds and Grains (Manufacturing and Consumer Products)
13
3Q18 3Q17(1) ∆ 9M18 9M17(1) ∆
Revenue (US$ million)
➢ Manufacturing
➢ Consumer Products
5,992.4
4,151.0
1,841.4
5,537.8
3,719.1
1,818.7
8%
12%
1%
16,967.5
11,778.5
5,189.0
14,346.8
9,650.1
4,696.7
18%
22%
10%
Sales volume (‘000 MT)
➢ Manufacturing
➢ Consumer Products
10,155
8,515
1,640
9,160
7,626
1,534
11%
12%
7%
27,743
23,294
4,449
24,099
20,024
4,075
15%
16%
9%
Profit before tax
(US$ million)296.9 252.8 17% 759.7 520.8 46%
• The segment recorded another good quarter, with profit increasing by 17% in 3Q18. Strong crush
margins with higher volume and good performance from the Consumer Products business were
the main drivers for the better performance. Together with the strong set of results recorded
during the first half of the year, overall profit for the segment increased by 46% for 9M18.
(1) Prior period figures were restated upon adoption of SFRS (I) 9 Financial Instruments and IFRS Convergence
Business Segment results: Sugar (Milling, Merchandising, Refining and Consumer Products)
14
3Q18 3Q17 ∆ 9M18 9M17 ∆
Revenue (US$ million)
➢ Milling
➢ Merchandising, Refining & Consumer
Products
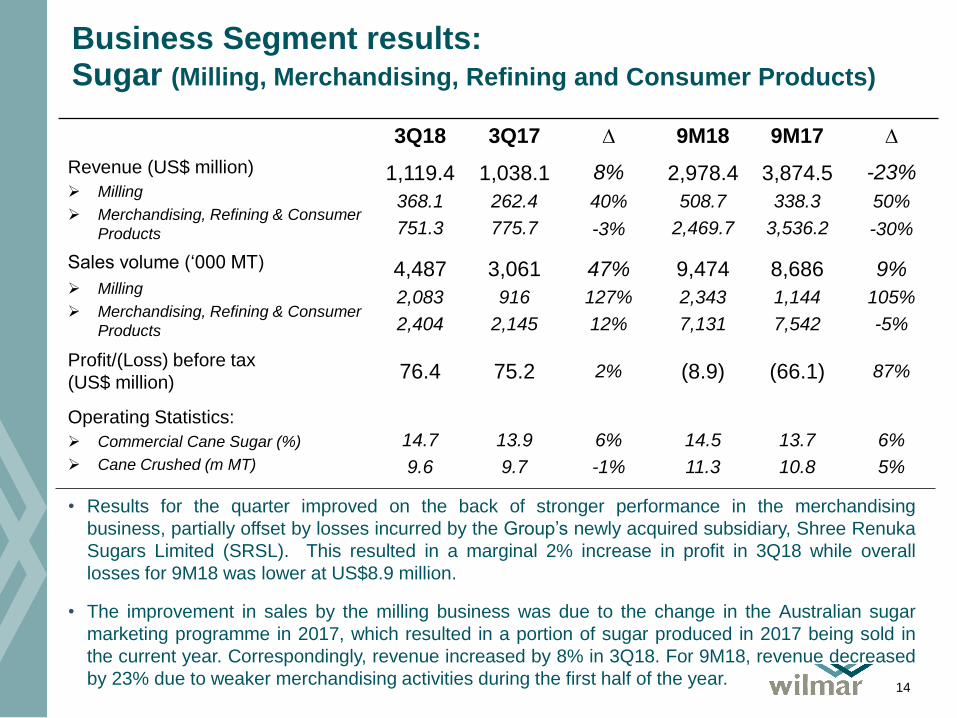
1,119.4
368.1
751.3
1,038.1
262.4
775.7
8%
40%
-3%
2,978.4
508.7
2,469.7
3,874.5
338.3
3,536.2
-23%
50%
-30%
Sales volume (‘000 MT)
➢ Milling
➢ Merchandising, Refining & Consumer
Products
4,487
2,083
2,404
3,061
916
2,145
47%
127%
12%
9,474
2,343
7,131
8,686
1,144
7,542
9%
105%
-5%
Profit/(Loss) before tax
(US$ million)76.4 75.2 2% (8.9) (66.1) 87%
Operating Statistics:
➢ Commercial Cane Sugar (%)
➢ Cane Crushed (m MT)
14.7
9.6
13.9
9.7
6%
-1%
14.5
11.3
13.7
10.8
6%
5%
• Results for the quarter improved on the back of stronger performance in the merchandising
business, partially offset by losses incurred by the Group’s newly acquired subsidiary, Shree Renuka
Sugars Limited (SRSL). This resulted in a marginal 2% increase in profit in 3Q18 while overall
losses for 9M18 was lower at US$8.9 million.
• The improvement in sales by the milling business was due to the change in the Australian sugar
marketing programme in 2017, which resulted in a portion of sugar produced in 2017 being sold in
the current year. Correspondingly, revenue increased by 8% in 3Q18. For 9M18, revenue decreased
by 23% due to weaker merchandising activities during the first half of the year.

Non-Operating Items and Discontinued Operations
15
US$ million 3Q18 3Q17(1) 9M18 9M17(1)
Foreign exchange (loss)/gain in respect of
intercompany loans to subsidiaries(3.7) 0.4 (7.4) 0.3
Net gain/(loss)from investment securities – HFT 11.2 24.9 (37.6) 110.5
Dividend income from investment securities – AFS 6.7 31.8 61.4 36.0
Interest expense directly attributable to the funding
of the Wilmar Sugar Australia acquisition(8.3) (6.0) (22.8) (18.3)
Total non-operating items (excluding
discontinued operations)5.9 51.1 (6.4) 128.5
Loss from discontinued operations (47.1) - (47.1) -
Total non-operating items (including
discontinued operations)(41.2) 51.1 (53.5) 128.5
Net profit (excluding discontinued operations) 434.9 368.1 954.6 769.0
Core net profit 434.7 321.7 970.0 650.8
(1) Prior period figures were restated upon adoption of SFRS (I) 9 Financial Instruments and IFRS Convergence.

Cash Flow
16
US$ million 9M18 9M17(1) FY17(1)
Operating cash flow before working capital changes 1,197 1,674 2,596
Net cash flow from operating activities 1,651 1,499 386
Less : Acquisitions of subsidiaries, joint ventures and
associates (404) (96) (132)
Capital expenditure (956) (611) (938)
Net increase from bank borrowings* 3,880 2,540 4,119
Increase in other deposits and financial products
with financial institutions (3,628) (2,799) (2,848)
Dividends (495) (320) (320)
Others 338 158 101
Net cash flow 386 371 368
Free cash flow 773 1,232 (156)
Turnover days
- Inventories 72 66 67
- Trade Receivables 33 34 33
- Trade Payables 12 12 12(1) Prior period figures were restated upon adoption of SFRS (I) 9 Financial Instruments and IFRS Convergence.
Note :* Net bank borrowings include proceeds/repayments of loans and borrowings net of fixed deposits pledged with financial institutions for bank facilities andunpledged fixed deposits with maturity more than 3 months.Turnover days are calculated by averaging the monthly turnover days to better reflect the true turnover period in view of the seasonality of the Group’s business.Monthly turnover days are computed using revenue and cost of sales for the month.
Free Cash Flow = Cashflows generated from/(used in) operations – Capital expenditure –Acquisitions/disposals of subsidiaries, joint ventures and associates.

Cash Flow – Cont.
17
• Inventories decreased from December 2017 by 10.4% to US$7.4
billion as at 30 September 2018, due to lower stockholding of
consumer products in China which resulted from the post Chinese
Spring Festival seasonal impact. Average turnover days was 72 days
for 9M18.
• Trade receivables increased marginally by US$93.6 million to
US$4.2 billion in 9M18. Average turnover days remained comparable
at 33 days in 9M18.
• Trade payables increased by US$763.2 million to US$1.9 billion in
9M18 mainly as a result of the acquisition of our new subsidiary,
SRSL. Excluding the impact of this acquisition, average turnover
days improved to 10 days in 9M18.

Funding and Liquidity
18
As at Sep 30, 2018
US$ million Available Utilised Balance
Credit facilities :
Committed 10,111 8,125 1,986
Trade finance 27,612 15,552 12,060
Short term 874 263 611
Total credit facilities 38,597 23,940 14,657
• 65% of utilised facilities were trade financing lines as at September 30, 2018.
• 62% of total facilities were utilised as at September 30, 2018.

Key Indicators
19
As at
Sep 30, 2018(1)
As at
Dec 31, 2017(1)
Return on Average Equity*,# 8.5% 7.9%
Return on Average Capital Employed*,# 5.7% 5.1%
Return on Invested Capital*,# 5.6% 5.3%
in US cents
EPS (fully diluted) 14.7 18.9
EPS (fully diluted)- excluding discontinued operations
15.1 18.9
NTA per share 177.9 183.0
NAV per share 250.6 252.4
(1) Prior period figures were restated upon adoption of SFRS (I) 9 Financial Instruments and IFRS Convergence.
* Sep 18 returns based on LTM performances
# Formulas : Return on Average Equity = Net profit ÷ Average equityReturn on Average Capital Employed = EBIT x (1 – tax rate) ÷ (Average equity +Average minority interest + Average net debt)Return on Invested Capital = (Earnings before interest – Fair value of biological assets) ÷ (Average long term assets excl Intangibles &
DTA + Average net working capital excl cash and borrowings)
19