vale’s performance in 3q18 · 3 vale’s performance in 3q18 – delivering in every meaningful...
TRANSCRIPT
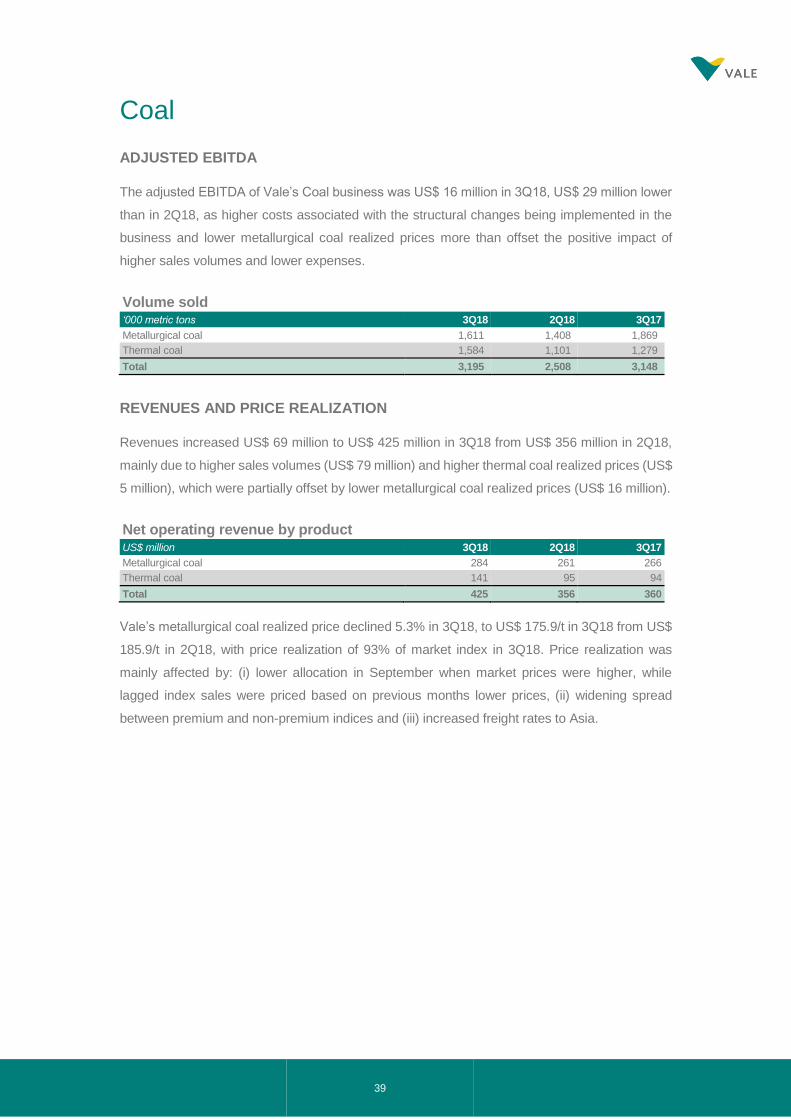
Truckless system – S11D
Vale’s Performance in 3Q18
www.vale.com
Tel.: (55 21) 3485-3900
Investor Relations Department
André Figueiredo
André Werner
Carla Albano Miller
Fernando Mascarenhas
Samir Bassil
Bruno Siqueira
Clarissa Couri
Renata Capanema
Conference call and webcast on Thursday, October 25th
Portuguese (non-translated) at 10:00 a.m. Rio de Janeiro time
Brazil: (55 11) 3193-1001 or (55 11) 2820-4001 USA and Canada: (1 800) 492-3904 Other countries: (1 646) 828-8246 Access code: VALE
English, at 12:00 p.m. Rio de Janeiro time (11:00 a.m. US Eastern Standard Time, 4:00 p.m. British Standard Time).
Brazil: (55 11) 3193-1001 or (55 11) 2820-4001 USA and Canada: (1 866) 262-4553 Other countries: (1 412) 317-6029 Access code: VALE
Except where otherwise indicated the operational and financial information in this release is based on the consolidated figures in accordance with
IFRS. Our quarterly financial statements are reviewed by the company’s independent auditors. The main subsidiaries that are consolidated are the
following: Companhia Portuária da Baía de Sepetiba, Mineração Corumbaense Reunida S.A., Minerações Brasileiras Reunidas S.A. PT Vale
Indonesia Tbk, Salobo Metais S.A, Vale International Holdings GMBH, Vale Canada Limited, Vale International S.A., Vale Manganês S.A., Vale
Malaysia Minerals Sdn. Bhd., Vale Moçambique S.A., Vale Nouvelle-Calédonie SAS, Vale Oman Pelletizing Company LLC and Vale Oman
Distribution Center LLC.
This press release may include statements that present Vale’s expectations about future events or results. All statements, when based upon
expectations about the future, involve various risks and uncertainties. Vale cannot guarantee that such statements will prove correct. These risks and
uncertainties include factors related to the following: (a) the countries where we operate, especially Brazil and Canada; (b) the global economy; (c)
the capital markets; (d) the mining and metals prices and their dependence on global industrial production, which is cyclical by nature; and (e) global
competition in the markets in which Vale operates. To obtain further information on factors that may lead to results different from those forecast by
Vale, please consult the reports Vale files with the U.S. Securities and Exchange Commission (SEC), the Brazilian Comissão de Valores Mobiliários
(CVM) and the French Autorité des Marchés Financiers (AMF), and in particular the factors discussed under “Forward-Looking Statements” and “Risk
Factors” in Vale’s annual report on Form 20-F.
3
Vale’s performance in 3Q18 – delivering in every meaningful way
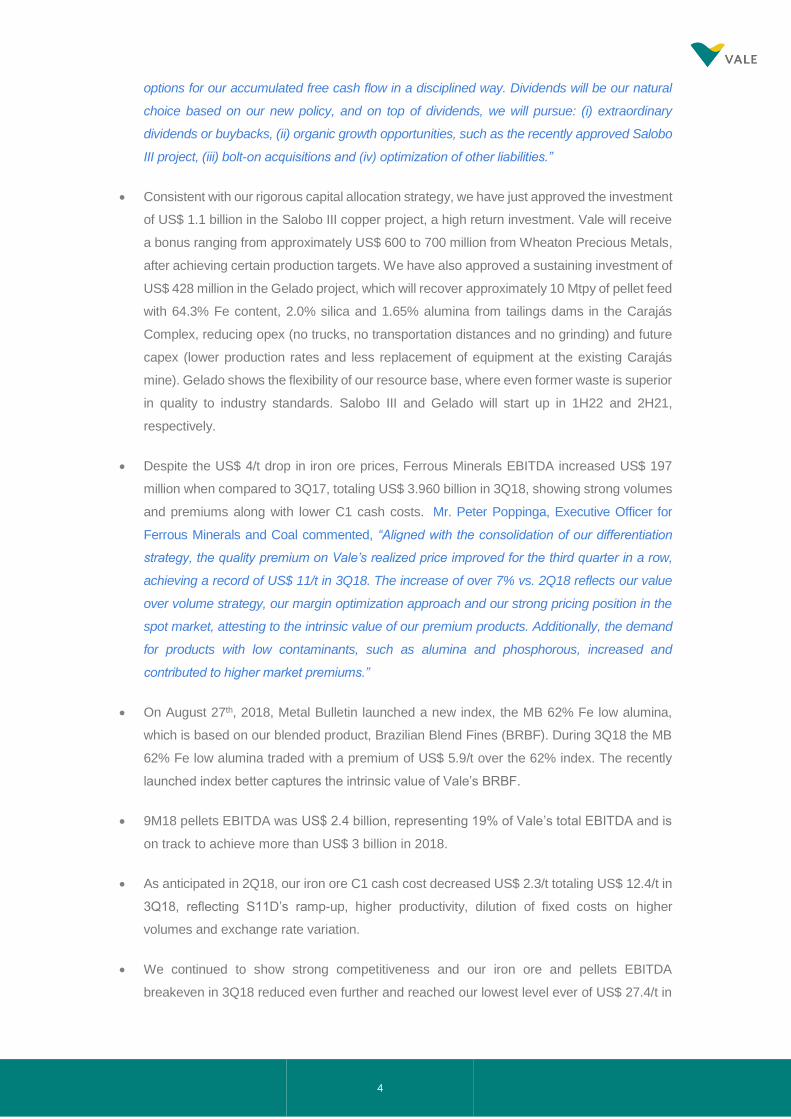
Chief Executive Officer, Mr. Fabio Schvartsman, commented on the 3Q18 results, “The strong 3Q18
results showcase the structural change in the Chinese iron ore and steel markets. We are the mining
company that is best suited to further benefit from the flight to quality given the increasing share of
premium products.” He concluded, “We are turning Vale into a very predictable company by
delivering sound operational performance, higher price realization, lower costs and rigorous capital
allocation.”
• In line with our annual production guidance, we reached a record of 104.9 Mt for iron ore in
3Q18, with an improvement in the overall quality of our products that is a unique combination
of higher volumes and higher quality.
• Our flexible supply chain along with S11D and pellet plants ramp-ups led to another quarterly
sales volume record for iron ore and pellets at 98.2 Mt. 3Q18 was also marked by the increase
in the share of our premium products, which achieved 79% of total sales. Our pellets volumes
reached a record high of 14.3 Mt, supported by our decision to restart the three idle pellet
plants.
• Iron ore fines and pellets quality premiums reached the record of US$ 11.0/t1 , an increase of
US$ 4.2/t, when compared to 3Q17, completely offsetting the decrease in iron ore prices thus
showing our ability to cope with changes in the market trend and adding predictability to our
performance.
• Our strong cash flow generation of US$ 3.1 billion led us to virtually achieve the net debt
target of US$ 10 billion. Net debt reduced further, despite the return of US$ 2.4 billion to our
shareholders, totaling US$ 10.7 billion in 3Q18, the lowest level since the third quarter of
2009.
• 3Q18 results translated into a minimum shareholder remuneration of US$ 1.142 billion. If we
deliver the same results next quarter, our minimum dividend related to the second half,
according to our policy, will be US$ 2.3 billion, against US$ 1.9 billion in the first half. Chief
Financial Officer Mr. Luciano Siani Pires highlighted, “Over the next years we will explore
1 Iron ore premium of US$ 8.6/t and weighted average contribution of pellets of US$ 2.4/t.
4
options for our accumulated free cash flow in a disciplined way. Dividends will be our natural
choice based on our new policy, and on top of dividends, we will pursue: (i) extraordinary
dividends or buybacks, (ii) organic growth opportunities, such as the recently approved Salobo
III project, (iii) bolt-on acquisitions and (iv) optimization of other liabilities.”
• Consistent with our rigorous capital allocation strategy, we have just approved the investment
of US$ 1.1 billion in the Salobo III copper project, a high return investment. Vale will receive
a bonus ranging from approximately US$ 600 to 700 million from Wheaton Precious Metals,
after achieving certain production targets. We have also approved a sustaining investment of
US$ 428 million in the Gelado project, which will recover approximately 10 Mtpy of pellet feed
with 64.3% Fe content, 2.0% silica and 1.65% alumina from tailings dams in the Carajás
Complex, reducing opex (no trucks, no transportation distances and no grinding) and future
capex (lower production rates and less replacement of equipment at the existing Carajás
mine). Gelado shows the flexibility of our resource base, where even former waste is superior
in quality to industry standards. Salobo III and Gelado will start up in 1H22 and 2H21,
respectively.
• Despite the US$ 4/t drop in iron ore prices, Ferrous Minerals EBITDA increased US$ 197
million when compared to 3Q17, totaling US$ 3.960 billion in 3Q18, showing strong volumes
and premiums along with lower C1 cash costs. Mr. Peter Poppinga, Executive Officer for
Ferrous Minerals and Coal commented, “Aligned with the consolidation of our differentiation
strategy, the quality premium on Vale’s realized price improved for the third quarter in a row,
achieving a record of US$ 11/t in 3Q18. The increase of over 7% vs. 2Q18 reflects our value
over volume strategy, our margin optimization approach and our strong pricing position in the
spot market, attesting to the intrinsic value of our premium products. Additionally, the demand
for products with low contaminants, such as alumina and phosphorous, increased and
contributed to higher market premiums.”
• On August 27th, 2018, Metal Bulletin launched a new index, the MB 62% Fe low alumina,
which is based on our blended product, Brazilian Blend Fines (BRBF). During 3Q18 the MB
62% Fe low alumina traded with a premium of US$ 5.9/t over the 62% index. The recently
launched index better captures the intrinsic value of Vale’s BRBF.
• 9M18 pellets EBITDA was US$ 2.4 billion, representing 19% of Vale’s total EBITDA and is
on track to achieve more than US$ 3 billion in 2018.
• As anticipated in 2Q18, our iron ore C1 cash cost decreased US$ 2.3/t totaling US$ 12.4/t in
3Q18, reflecting S11D’s ramp-up, higher productivity, dilution of fixed costs on higher
volumes and exchange rate variation.
• We continued to show strong competitiveness and our iron ore and pellets EBITDA
breakeven in 3Q18 reduced even further and reached our lowest level ever of US$ 27.4/t in
5
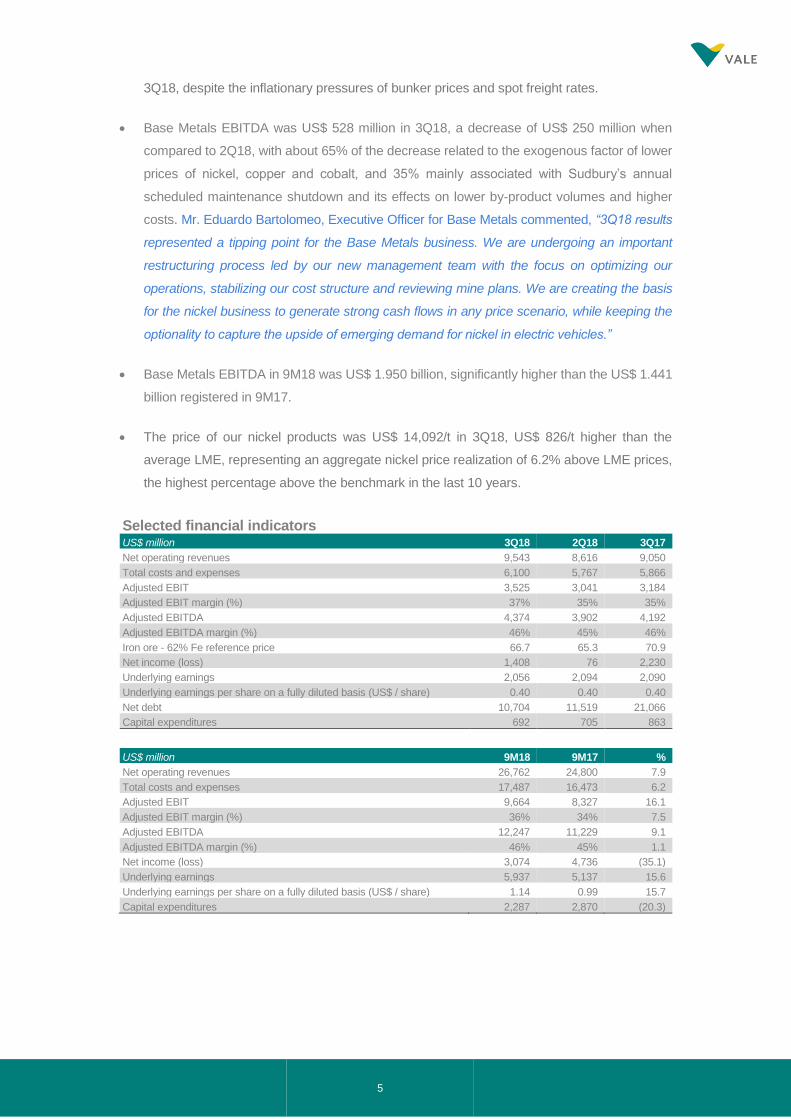
3Q18, despite the inflationary pressures of bunker prices and spot freight rates.
• Base Metals EBITDA was US$ 528 million in 3Q18, a decrease of US$ 250 million when
compared to 2Q18, with about 65% of the decrease related to the exogenous factor of lower
prices of nickel, copper and cobalt, and 35% mainly associated with Sudbury’s annual
scheduled maintenance shutdown and its effects on lower by-product volumes and higher
costs. Mr. Eduardo Bartolomeo, Executive Officer for Base Metals commented, “3Q18 results
represented a tipping point for the Base Metals business. We are undergoing an important
restructuring process led by our new management team with the focus on optimizing our
operations, stabilizing our cost structure and reviewing mine plans. We are creating the basis
for the nickel business to generate strong cash flows in any price scenario, while keeping the
optionality to capture the upside of emerging demand for nickel in electric vehicles.”
• Base Metals EBITDA in 9M18 was US$ 1.950 billion, significantly higher than the US$ 1.441
billion registered in 9M17.
• The price of our nickel products was US$ 14,092/t in 3Q18, US$ 826/t higher than the
average LME, representing an aggregate nickel price realization of 6.2% above LME prices,
the highest percentage above the benchmark in the last 10 years.
Selected financial indicators US$ million 3Q18 2Q18 3Q17
Net operating revenues 9,543 8,616 9,050
Total costs and expenses 6,100 5,767 5,866
Adjusted EBIT 3,525 3,041 3,184
Adjusted EBIT margin (%) 37% 35% 35%
Adjusted EBITDA 4,374 3,902 4,192
Adjusted EBITDA margin (%) 46% 45% 46%
Iron ore - 62% Fe reference price 66.7 65.3 70.9
Net income (loss) 1,408 76 2,230
Underlying earnings 2,056 2,094 2,090
Underlying earnings per share on a fully diluted basis (US$ / share) 0.40 0.40 0.40
Net debt 10,704 11,519 21,066
Capital expenditures 692 705 863
US$ million 9M18 9M17 %
Net operating revenues 26,762 24,800 7.9
Total costs and expenses 17,487 16,473 6.2
Adjusted EBIT 9,664 8,327 16.1
Adjusted EBIT margin (%) 36% 34% 7.5
Adjusted EBITDA 12,247 11,229 9.1
Adjusted EBITDA margin (%) 46% 45% 1.1
Net income (loss) 3,074 4,736 (35.1)
Underlying earnings 5,937 5,137 15.6
Underlying earnings per share on a fully diluted basis (US$ / share) 1.14 0.99 15.7
Capital expenditures 2,287 2,870 (20.3)
6
Market overview
IRON ORE
Iron ore 62% Fe reference price averaged US$ 66.7/dmt in 3Q18, a decrease of 6% YoY,
however it represents an increase of 2% from 2Q18 as steel production continues to respond to
firm steel demand ahead of the winter season in the northern hemisphere.
In China, the combination of steel capacity restrictions and healthy demand enabled steel mills to
enjoy a solid margin. The increase in environmental awareness and controls is leading steel mills
to optimize steel output whilst decreasing CO2 emissions. As a result, the market has recognized
that higher Fe grade ores offer a substantial advantage and this can be seen through the premium
captured by 65% Fe in the market and the resulting US$ 27/dmt in 3Q18. Vale is well positioned as
a major supplier of sinter fines combining high Fe and low alumina, and also as a major supplier of
pellets.
COAL
In 3Q18, seaborne coking coal prices decreased to US$ 188.6/t from US$ 190.2/t in the previous
quarter, influenced by import restrictions in China and seasonally weaker demand from India due
to monsoons. This has slowly improved in September due to restocking demand, logistics
constrains and supply tightness. In the thermal coal market, 3Q18 Richards Bay FOB edged up
to US$ 101.6/t, from US$ 100.3/t in the previous quarter. The quarter started very strong with
prices reaching a 6 ½ year high during July at US$ 109.2/t. This price hike in July was driven by
strong demand in Asia, increased coal-fired power generation in Europe and supply tightness
from Colombia and USA. But the same has been downplayed from August and was impacted by
weaker demand from India due to the monsoon, and arbitrage from Australian coals owing to
weaker demand from China over import restrictions.
NICKEL
LME nickel prices declined during 3Q18 to an average of US$13,266/t, vs. US$ 14,476/t, in 2Q18.
Total exchange inventories (LME and SHFE) continued to decline closing at 245 kt, at the end of
3Q18, down 165 kt since the end of 2017.
Global stainless-steel production increased 2.4% in 3Q18 relative to 3Q17, while sales of EVs
worldwide grew 48% during the same period. Demand for nickel in other applications continues
to be positive. Supply decreased approximately 0.8% in 3Q18 relative to 3Q17, Class II (NPI)
material increased (+5.6%) and Class I material declined (-8.3%) in the same period.
Our near-term outlook for nickel remains cautious as current inventories will act as a buffer to
price recovery. Meanwhile, macroeconomic factors such as the ongoing trade dispute between
major powers introduce volatility to the base metals price complex, nickel included.
Our long-term outlook for nickel continues to be positive. Nickel in electric vehicle batteries will
become an increasingly important source of demand growth particularly as battery chemistry
7
favors higher nickel content due to lower cost and higher energy density. Capital is starting to flow
back into the industry given the recovery in price. However, the timing of investments may
increase the lag and widen future deficits given continued demand growth.
COPPER
LME copper price averaged US$ 6,105/t in 3Q18, a decrease of 11% from 2Q18 (US$ 6,872/t)
impacted by concerns about the trade war. Copper inventories on all exchanges, LME, SHFE
and COMEX, decreased by 294 kt in 3Q18 vs. 2Q18.
Global demand increased approximately 1.8% in 3Q18 vs. 3Q17. In China, demand increased
3.2% in the same period and was driven primarily by increased infrastructure investment. On the
supply side, global refined copper production increased nearly 1% in 3Q18 vs. 3Q17. More labor
negotiations were concluded this quarter, reducing the potential for supply disruption for the year
given that these settlements create precedent for the upcoming negotiations.
Vale’s near-term outlook for copper shifted to a more positive tone, as the market is expected to
remain essentially balanced for the year while maintaining a potential for deficit in 2019.
The long-term outlook for copper is positive. Copper demand is expected to grow, partially driven
by EVs and renewable energy as well as infrastructure investments, while future supply growth
is challenged given declining ore grades and the need for greenfield investment.
COBALT
Cobalt price averaged US$ 65,724/t in 3Q18 a decrease of 25% vs. 2Q18, mainly due to the
strong supply growth in the DRC and the continued drive to reduce cobalt use in EV batteries.
Cobalt is one of the key metals, besides nickel, to produce the highest energy density batteries
for use in electric vehicles. The cobalt market needs to grow significantly to feed into battery
demand – but unlike other metals, cobalt is predominantly a by-product of nickel and copper
mines. This means that it does not have the flexibility to respond to demand pressures as readily
as other metals. Moreover, much of the cobalt comes from the DRC, which introduces ethical
sourcing issues as well as reliance on operations in an unpredictable jurisdiction.
Our near-term outlook for cobalt is mixed. Although demand for cobalt is increasing, supply is
expected to increase as well with the start-up of major cobalt production in the DRC.
Over the long term, although we see demand well supported by the battery market, chemistry
developments are shifting to nickel-rich materials that bring lower cost and higher density. On the
supply side, given the need to grow in nickel we see the nickel industry increase its contribution
of cobalt units into the market, minimizing concerns about the future supply of cobalt for the
electric vehicle battery market.
8
Adjusted EBITDA
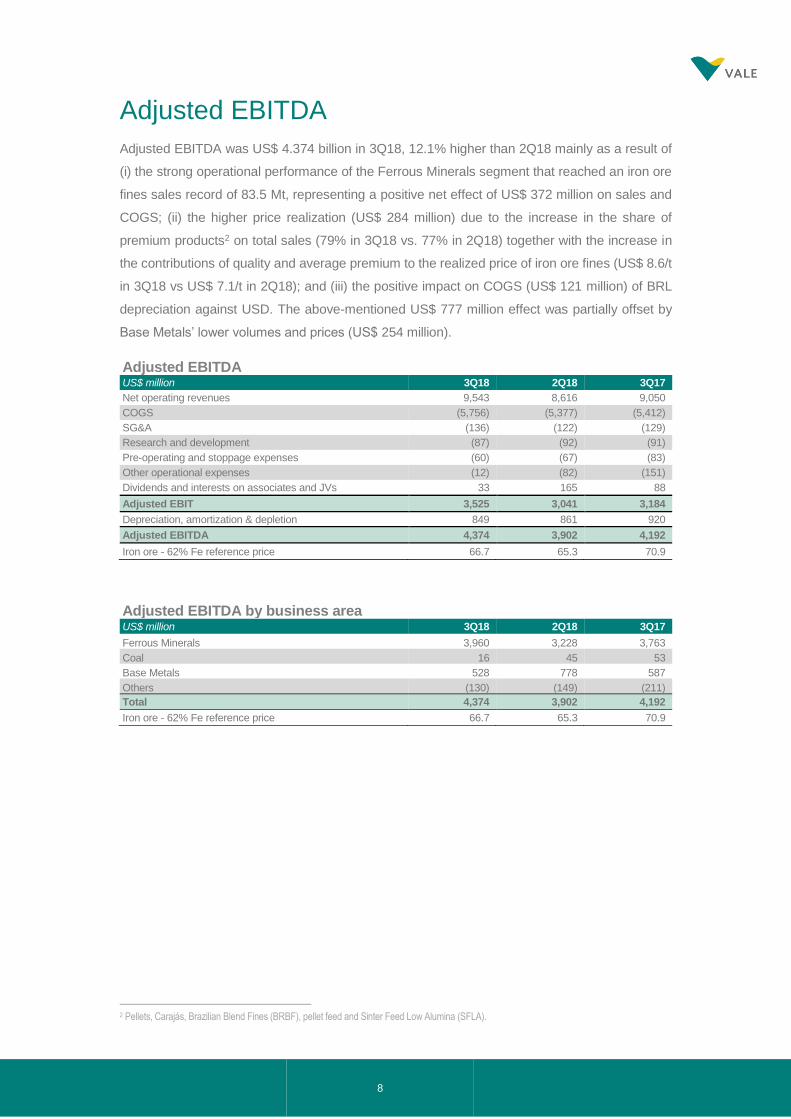
Adjusted EBITDA was US$ 4.374 billion in 3Q18, 12.1% higher than 2Q18 mainly as a result of
(i) the strong operational performance of the Ferrous Minerals segment that reached an iron ore
fines sales record of 83.5 Mt, representing a positive net effect of US$ 372 million on sales and
COGS; (ii) the higher price realization (US$ 284 million) due to the increase in the share of
premium products2 on total sales (79% in 3Q18 vs. 77% in 2Q18) together with the increase in
the contributions of quality and average premium to the realized price of iron ore fines (US$ 8.6/t
in 3Q18 vs US$ 7.1/t in 2Q18); and (iii) the positive impact on COGS (US$ 121 million) of BRL
depreciation against USD. The above-mentioned US$ 777 million effect was partially offset by
Base Metals’ lower volumes and prices (US$ 254 million).
Adjusted EBITDA US$ million 3Q18 2Q18 3Q17
Net operating revenues 9,543 8,616 9,050
COGS (5,756) (5,377) (5,412)
SG&A (136) (122) (129)
Research and development (87) (92) (91)
Pre-operating and stoppage expenses (60) (67) (83)
Other operational expenses (12) (82) (151)
Dividends and interests on associates and JVs 33 165 88
Adjusted EBIT 3,525 3,041 3,184
Depreciation, amortization & depletion 849 861 920
Adjusted EBITDA 4,374 3,902 4,192
Iron ore - 62% Fe reference price 66.7 65.3 70.9
Adjusted EBITDA by business area US$ million 3Q18 2Q18 3Q17
Ferrous Minerals 3,960 3,228 3,763
Coal 16 45 53
Base Metals 528 778 587
Others (130) (149) (211)
Total 4,374 3,902 4,192
Iron ore - 62% Fe reference price 66.7 65.3 70.9
2 Pellets, Carajás, Brazilian Blend Fines (BRBF), pellet feed and Sinter Feed Low Alumina (SFLA).
9
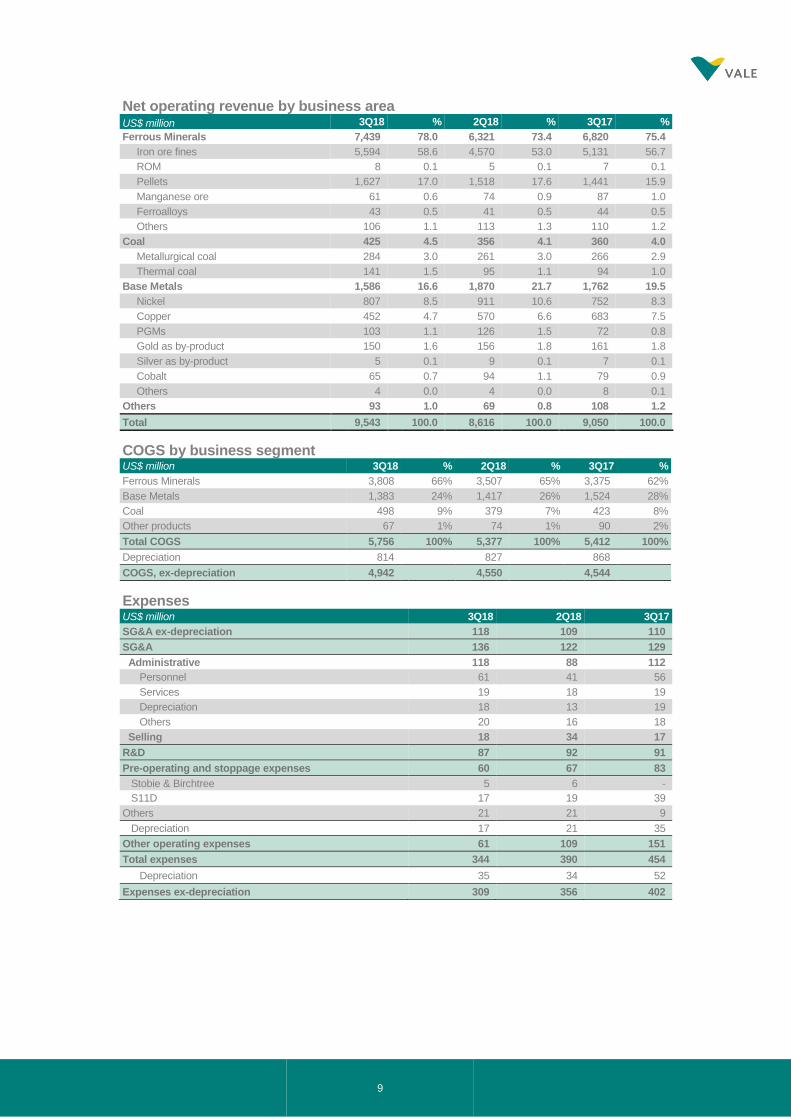
Net operating revenue by business area US$ million 3Q18 % 2Q18 % 3Q17 %
Ferrous Minerals 7,439 78.0 6,321 73.4 6,820 75.4
Iron ore fines 5,594 58.6 4,570 53.0 5,131 56.7
ROM 8 0.1 5 0.1 7 0.1
Pellets 1,627 17.0 1,518 17.6 1,441 15.9
Manganese ore 61 0.6 74 0.9 87 1.0
Ferroalloys 43 0.5 41 0.5 44 0.5
Others 106 1.1 113 1.3 110 1.2
Coal 425 4.5 356 4.1 360 4.0
Metallurgical coal 284 3.0 261 3.0 266 2.9
Thermal coal 141 1.5 95 1.1 94 1.0
Base Metals 1,586 16.6 1,870 21.7 1,762 19.5
Nickel 807 8.5 911 10.6 752 8.3
Copper 452 4.7 570 6.6 683 7.5
PGMs 103 1.1 126 1.5 72 0.8
Gold as by-product 150 1.6 156 1.8 161 1.8
Silver as by-product 5 0.1 9 0.1 7 0.1
Cobalt 65 0.7 94 1.1 79 0.9
Others 4 0.0 4 0.0 8 0.1
Others 93 1.0 69 0.8 108 1.2
Total 9,543 100.0 8,616 100.0 9,050 100.0
COGS by business segment US$ million 3Q18 % 2Q18 % 3Q17 %
Ferrous Minerals 3,808 66% 3,507 65% 3,375 62%
Base Metals 1,383 24% 1,417 26% 1,524 28%
Coal 498 9% 379 7% 423 8%
Other products 67 1% 74 1% 90 2%
Total COGS 5,756 100% 5,377 100% 5,412 100%
Depreciation 814 827 868
COGS, ex-depreciation 4,942 4,550 4,544
Expenses US$ million 3Q18 2Q18 3Q17
SG&A ex-depreciation 118 109 110
SG&A 136 122 129
Administrative 118 88 112
Personnel 61 41 56
Services 19 18 19
Depreciation 18 13 19
Others 20 16 18
Selling 18 34 17
R&D 87 92 91
Pre-operating and stoppage expenses 60 67 83
Stobie & Birchtree 5 6 -
S11D 17 19 39
Others 21 21 9
Depreciation 17 21 35
Other operating expenses 61 109 151
Total expenses 344 390 454
Depreciation 35 34 52
Expenses ex-depreciation 309 356 402
10
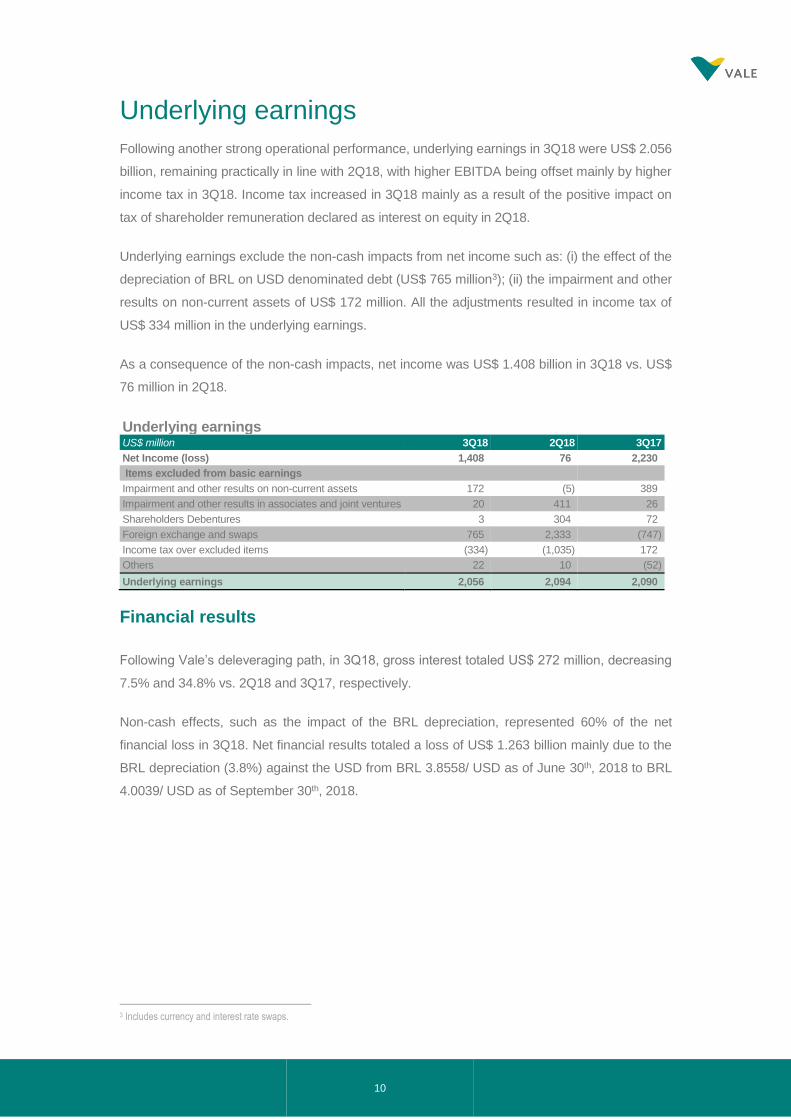
Underlying earnings
Following another strong operational performance, underlying earnings in 3Q18 were US$ 2.056
billion, remaining practically in line with 2Q18, with higher EBITDA being offset mainly by higher
income tax in 3Q18. Income tax increased in 3Q18 mainly as a result of the positive impact on
tax of shareholder remuneration declared as interest on equity in 2Q18.
Underlying earnings exclude the non-cash impacts from net income such as: (i) the effect of the
depreciation of BRL on USD denominated debt (US$ 765 million3); (ii) the impairment and other
results on non-current assets of US$ 172 million. All the adjustments resulted in income tax of
US$ 334 million in the underlying earnings.
As a consequence of the non-cash impacts, net income was US$ 1.408 billion in 3Q18 vs. US$
76 million in 2Q18.
Underlying earnings US$ million 3Q18 2Q18 3Q17
Net Income (loss) 1,408 76 2,230
Items excluded from basic earnings
Impairment and other results on non-current assets 172 (5) 389
Impairment and other results in associates and joint ventures 20 411 26
Shareholders Debentures 3 304 72
Foreign exchange and swaps 765 2,333 (747)
Income tax over excluded items (334) (1,035) 172
Others 22 10 (52)
Underlying earnings 2,056 2,094 2,090
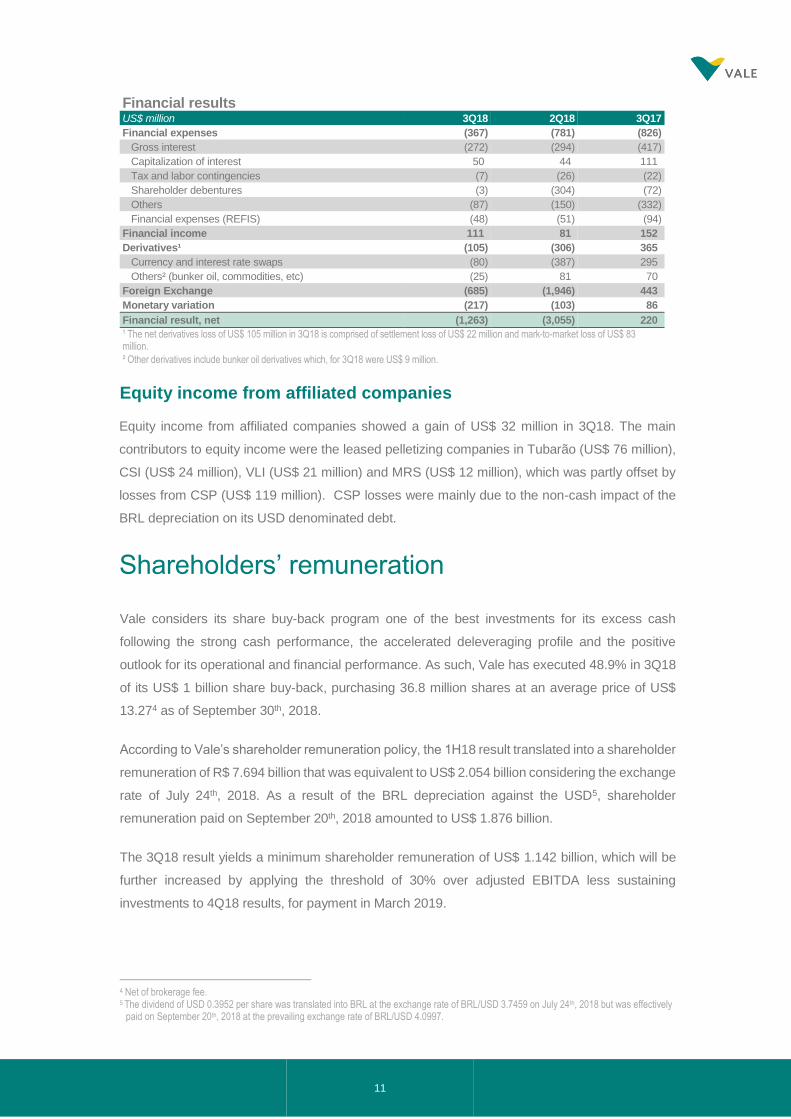
Financial results
Following Vale’s deleveraging path, in 3Q18, gross interest totaled US$ 272 million, decreasing
7.5% and 34.8% vs. 2Q18 and 3Q17, respectively.
Non-cash effects, such as the impact of the BRL depreciation, represented 60% of the net
financial loss in 3Q18. Net financial results totaled a loss of US$ 1.263 billion mainly due to the
BRL depreciation (3.8%) against the USD from BRL 3.8558/ USD as of June 30th, 2018 to BRL
4.0039/ USD as of September 30th, 2018.
3 Includes currency and interest rate swaps.
11
Financial results US$ million 3Q18 2Q18 3Q17
Financial expenses (367) (781) (826)
Gross interest (272) (294) (417)
Capitalization of interest 50 44 111
Tax and labor contingencies (7) (26) (22)
Shareholder debentures (3) (304) (72)
Others (87) (150) (332)
Financial expenses (REFIS) (48) (51) (94)
Financial income 111 81 152
Derivatives¹ (105) (306) 365
Currency and interest rate swaps (80) (387) 295
Others² (bunker oil, commodities, etc) (25) 81 70
Foreign Exchange (685) (1,946) 443
Monetary variation (217) (103) 86
Financial result, net (1,263) (3,055) 220
¹ The net derivatives loss of US$ 105 million in 3Q18 is comprised of settlement loss of US$ 22 million and mark-to-market loss of US$ 83 million.
² Other derivatives include bunker oil derivatives which, for 3Q18 were US$ 9 million.
Equity income from affiliated companies
Equity income from affiliated companies showed a gain of US$ 32 million in 3Q18. The main
contributors to equity income were the leased pelletizing companies in Tubarão (US$ 76 million),
CSI (US$ 24 million), VLI (US$ 21 million) and MRS (US$ 12 million), which was partly offset by
losses from CSP (US$ 119 million). CSP losses were mainly due to the non-cash impact of the
BRL depreciation on its USD denominated debt.
Shareholders’ remuneration
Vale considers its share buy-back program one of the best investments for its excess cash
following the strong cash performance, the accelerated deleveraging profile and the positive
outlook for its operational and financial performance. As such, Vale has executed 48.9% in 3Q18
of its US$ 1 billion share buy-back, purchasing 36.8 million shares at an average price of US$
13.274 as of September 30th, 2018.
According to Vale’s shareholder remuneration policy, the 1H18 result translated into a shareholder
remuneration of R$ 7.694 billion that was equivalent to US$ 2.054 billion considering the exchange
rate of July 24th, 2018. As a result of the BRL depreciation against the USD5, shareholder
remuneration paid on September 20th, 2018 amounted to US$ 1.876 billion.
The 3Q18 result yields a minimum shareholder remuneration of US$ 1.142 billion, which will be
further increased by applying the threshold of 30% over adjusted EBITDA less sustaining
investments to 4Q18 results, for payment in March 2019.
4 Net of brokerage fee. 5 The dividend of USD 0.3952 per share was translated into BRL at the exchange rate of BRL/USD 3.7459 on July 24th, 2018 but was effectively
paid on September 20th, 2018 at the prevailing exchange rate of BRL/USD 4.0997.
12
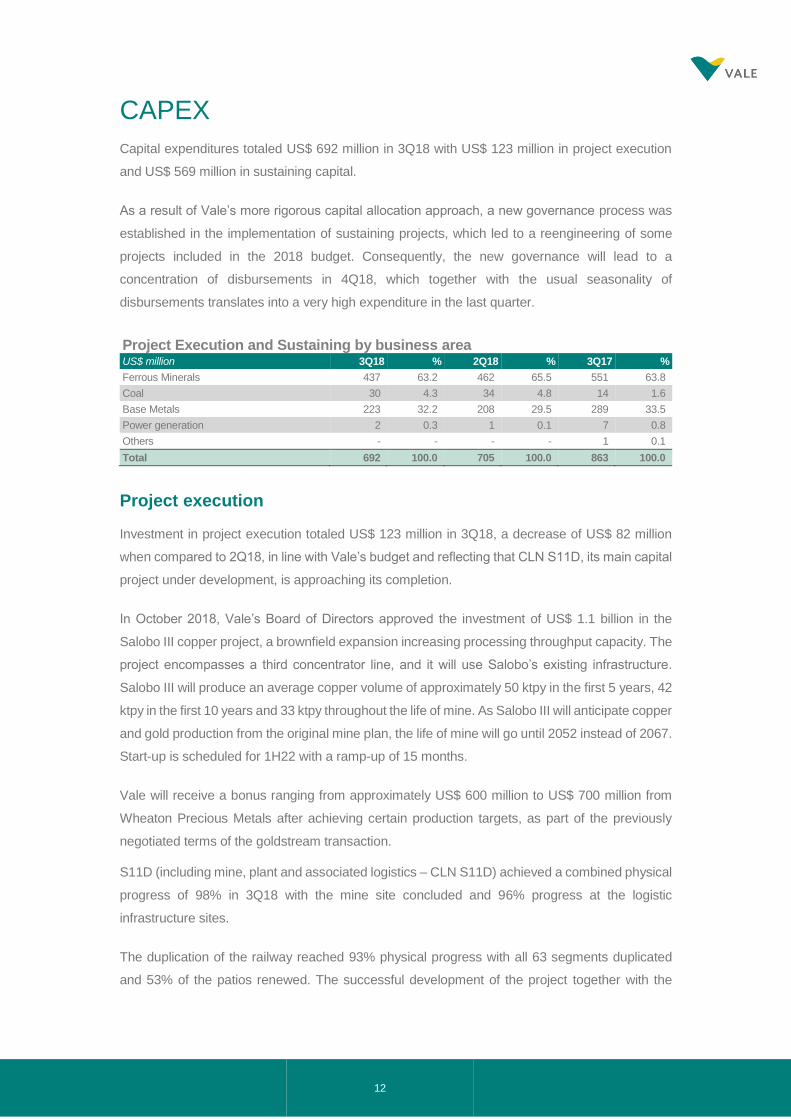
CAPEX
Capital expenditures totaled US$ 692 million in 3Q18 with US$ 123 million in project execution
and US$ 569 million in sustaining capital.
As a result of Vale’s more rigorous capital allocation approach, a new governance process was
established in the implementation of sustaining projects, which led to a reengineering of some
projects included in the 2018 budget. Consequently, the new governance will lead to a
concentration of disbursements in 4Q18, which together with the usual seasonality of
disbursements translates into a very high expenditure in the last quarter.
Project Execution and Sustaining by business area US$ million 3Q18 % 2Q18 % 3Q17 %
Ferrous Minerals 437 63.2 462 65.5 551 63.8
Coal 30 4.3 34 4.8 14 1.6
Base Metals 223 32.2 208 29.5 289 33.5
Power generation 2 0.3 1 0.1 7 0.8
Others - - - - 1 0.1
Total 692 100.0 705 100.0 863 100.0
Project execution
Investment in project execution totaled US$ 123 million in 3Q18, a decrease of US$ 82 million
when compared to 2Q18, in line with Vale’s budget and reflecting that CLN S11D, its main capital
project under development, is approaching its completion.
In October 2018, Vale’s Board of Directors approved the investment of US$ 1.1 billion in the
Salobo III copper project, a brownfield expansion increasing processing throughput capacity. The
project encompasses a third concentrator line, and it will use Salobo’s existing infrastructure.
Salobo III will produce an average copper volume of approximately 50 ktpy in the first 5 years, 42
ktpy in the first 10 years and 33 ktpy throughout the life of mine. As Salobo III will anticipate copper
and gold production from the original mine plan, the life of mine will go until 2052 instead of 2067.
Start-up is scheduled for 1H22 with a ramp-up of 15 months.
Vale will receive a bonus ranging from approximately US$ 600 million to US$ 700 million from
Wheaton Precious Metals after achieving certain production targets, as part of the previously
negotiated terms of the goldstream transaction.
S11D (including mine, plant and associated logistics – CLN S11D) achieved a combined physical
progress of 98% in 3Q18 with the mine site concluded and 96% progress at the logistic
infrastructure sites.
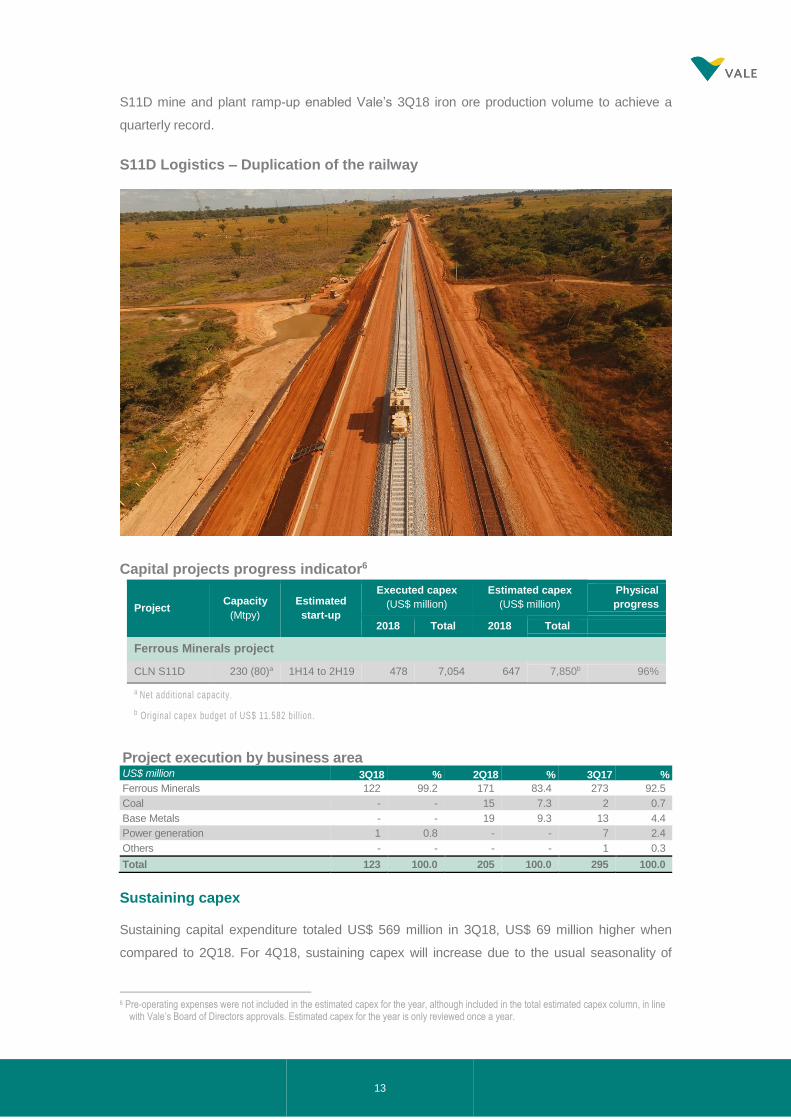
The duplication of the railway reached 93% physical progress with all 63 segments duplicated
and 53% of the patios renewed. The successful development of the project together with the
13
S11D mine and plant ramp-up enabled Vale’s 3Q18 iron ore production volume to achieve a
quarterly record.
S11D Logistics – Duplication of the railway
Capital projects progress indicator6
Project execution by business area US$ million 3Q18 % 2Q18 % 3Q17 %
Ferrous Minerals 122 99.2 171 83.4 273 92.5
Coal - - 15 7.3 2 0.7
Base Metals - - 19 9.3 13 4.4
Power generation 1 0.8 - - 7 2.4
Others - - - - 1 0.3
Total 123 100.0 205 100.0 295 100.0
Sustaining capex
Sustaining capital expenditure totaled US$ 569 million in 3Q18, US$ 69 million higher when
compared to 2Q18. For 4Q18, sustaining capex will increase due to the usual seasonality of
6 Pre-operating expenses were not included in the estimated capex for the year, although included in the total estimated capex column, in line
with Vale’s Board of Directors approvals. Estimated capex for the year is only reviewed once a year.
Project Capacity
(Mtpy)
Estimated
start-up
Executed capex
(US$ million)
Estimated capex
(US$ million)
Physical
progress
2018 Total 2018 Total
Ferrous Minerals project
CLN S11D 230 (80)a 1H14 to 2H19 478 7,054 647 7,850b 96%
a Net additional capacity.
b Original capex budget of US$ 11.582 bi ll ion.
14
disbursements, the above-mentioned new governance process and higher investments in
Ferrous Minerals and in VBME.
In September 2018, Vale’s Board of Directors approved the Gelado project in the Northern System,
for a total of US$ 428 million. The project encompasses the recovery of approximately 10 Mtpy of
iron ore fines from the Gelado tailings dam up to 2031, in order to feed the recently restarted São
Luís pellet plant. The tailings have an average of 64.3% Fe content, 2.0% of silica and 1.65% of
alumina. The economics of the project are robust as it will (i) allow 9.7 Mtpy of iron ore production
with zero transportation distance and no use of trucks, therefore reducing opex and (ii) reduce the
mining rate at the existing Carajás mine, avoiding sustaining capital on the replacement of trucks. It
also depicts the flexibility of Vale’s resource base – where even former waste is better than the
industry’s standard product.
In 3Q18, the Digital Transformation program continued its evolution, Vale’s Executive Board
approved its extension into the Base Metals operations, in Canada. An additional US$ 116 million
of a multiyear sustaining capex will encompass the implementation of 15 suites of projects for
Sudbury operations. The main suites of projects that started to be developed are: (i) integrated
planning and scheduling; (ii) cooling system; (iii) advanced insight center; and, (iv) tagging and
tracking (Radio-Frequency IDentification RFID). The objective of the program in Sudbury is to
unlock capacity for additional feed (~10%) over the first 3 years, aligned with the premium portfolio
and the flexibility that Vale is enhancing in its operations.
The Digital Transformation program encompasses more than 120 projects throughout the Ferrous
Minerals and Base Metals segments totaling US$ 467 million approved up to 3Q18 to be spent by
2023.
The Ferrous Minerals and Base Metals business segments accounted for 55% and 39%,
respectively, of total sustaining capex in 3Q18, remaining in line with 2Q18.
Sustaining capex in the Base Metals business segment was mainly for: (i) operational
improvements (US$ 146 million); (ii) enhancements in the current standards of health and safety,
social and environmental protection (US$ 64 million); and (iii) maintenance improvements and
expansion of tailings dams (US$ 6 million).
Sustaining capital for the Ferrous Minerals business segment included, among others: (i)
enhancements and replacements in operations (US$ 219 million); (ii) improvements in the current
standards of health and safety, social and environmental protection (US$ 44 million); and (iii)
maintenance, improvement and expansion of tailings dams (US$ 31 million). Maintenance of
railways and ports in Brazil and Malaysia accounted for US$ 76 million.
15
Replacement projects progress indicator7
Sustaining capex by type - 3Q18
US$ million Ferrous Minerals
Coal Base Metals TOTAL
Operations 219 24 146 389
Waste dumps and tailing dams 31 - 6 37
Health and Safety 35 0 8 43
Social investments and environmental protection 10 3 56 69
Administrative & Others 22 2 7 31
Total 317 29 223 569
Sustaining capex by business area US$ million 3Q18 % 2Q18 % 3Q17 %
Ferrous Minerals 315 55.3 291 58.2 278 48.9
Coal 30 5.3 19 3.8 12 2.1
Base Metals 223 39.2 188 37.7 276 48.6
Nickel 194 34.1 159 31.8 250 44.0
Copper 29 5.1 29 5.9 26 4.6
Power generation 1 0.2 1 0.3 1 0.2
Others - - - - - -
Total 569 100.0 500 100.0 568 100.0
Corporate social responsibility
Investments in corporate social responsibility totaled US$ 123 million in 3Q18, of which US$ 110
million dedicated to environmental protection and conservation and US$ 13 million to social
projects.
Vale aims to transform natural resources into prosperity and sustainable development. The main
driver of Fundação Vale, with its 50 years of experience, is to support positive social legacies for
the territories where it operates. Fundação Vale develops social projects related to work and
income generation, health, and education. From its inception, the projects establish a relationship
with the communities, based on open dialogue, respecting the local culture, their values, initiatives
and desires.
The following results can be highlighted:
• Work and income generation: promotion of sustainable labor alternatives in 24
municipalities, benefiting more than 2,000 social entrepreneurs and more than 400 rural
producers of family agriculture since 2014.
7 Pre-operating expenses were not included in the estimated capex for the year, although included in the total estimated capex column, in line
with Vale’s Board of Directors approvals. Estimated capex for the year is only reviewed once a year.
Project Capacity
(Ktpy)
Estimated start-up
Executed capex (US$ million)
Estimated capex (US$ million)
Physical
progress
2018 Total 2018 Total
Voisey’s Bay Mine Extension
40 1H21 54 113 141 1,694 12%
Gelado 9,700 2H21 0 0 3 428 0%
16
• Health: improving primary care in 28 municipalities, benefiting more than 4,100 health
professionals and community leaders, and providing around 5,000 pieces of equipment
to 126 basic health units since 2014.
• Education: promoting reading habits and access to books in 40 municipalities, benefiting
more than 60,000 people, providing more than 30,000 books since 2012 and 21 reading
locations in 2017.
In order to obtain effective results, Fundação Vale understands that development only becomes
sustainable when there is an alignment between companies, the state and civil society. In this
regard, Fundação Vale fosters a network amongst its suppliers and clients to integrate and
leverage voluntary corporate social responsibility investments, and uses voluntary social
investments for the implementation and strengthening of public policies.
Portfolio Management
In 3Q18, Vale concluded the sale of its 50% interest in the Eagle Downs hard coking coal project
in Queensland, Australia, to a subsidiary of China BaoWu Steel Group Corporation Limited
(Baosteel) for US$ 117 million in cash8, aligned with Vale’s strategy to simplify its asset portfolio
and divest non-core assets.
8 Out of which US$ 90 million were a cash inflow in 3Q18 and US$ 27 million will be paid once operational preconditions are met.
17
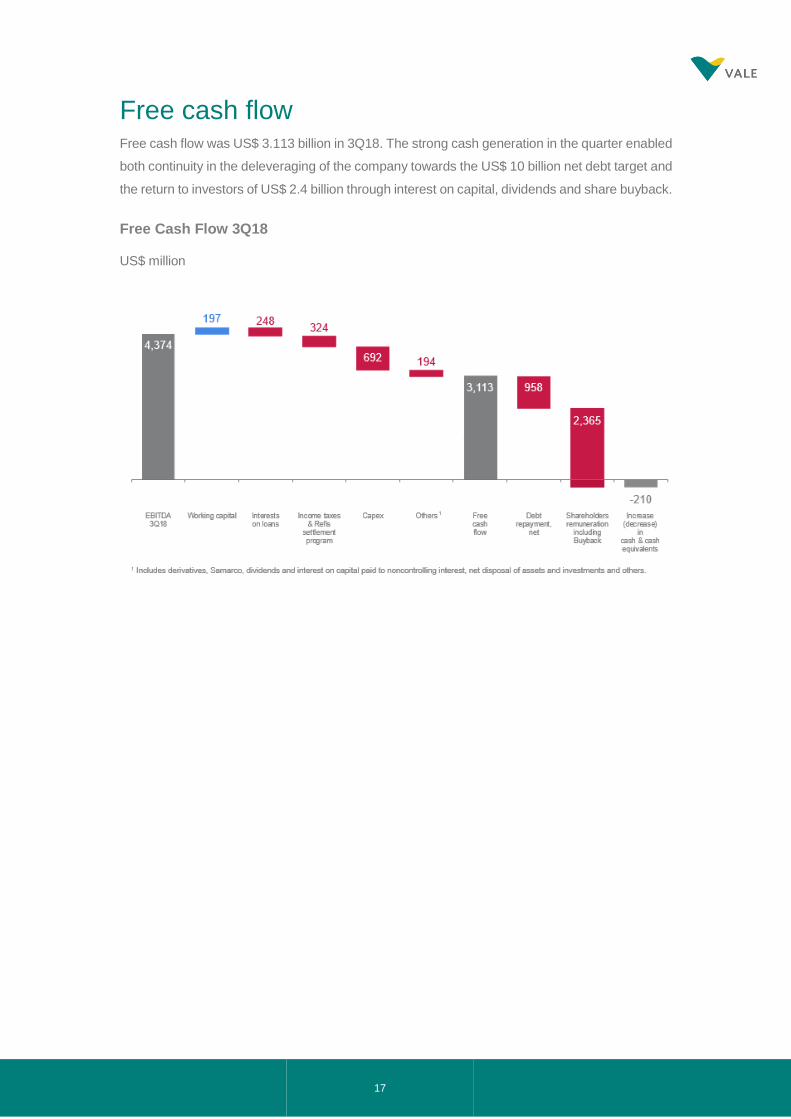
Free cash flow Free cash flow was US$ 3.113 billion in 3Q18. The strong cash generation in the quarter enabled
both continuity in the deleveraging of the company towards the US$ 10 billion net debt target and
the return to investors of US$ 2.4 billion through interest on capital, dividends and share buyback.
Free Cash Flow 3Q18
US$ million
18
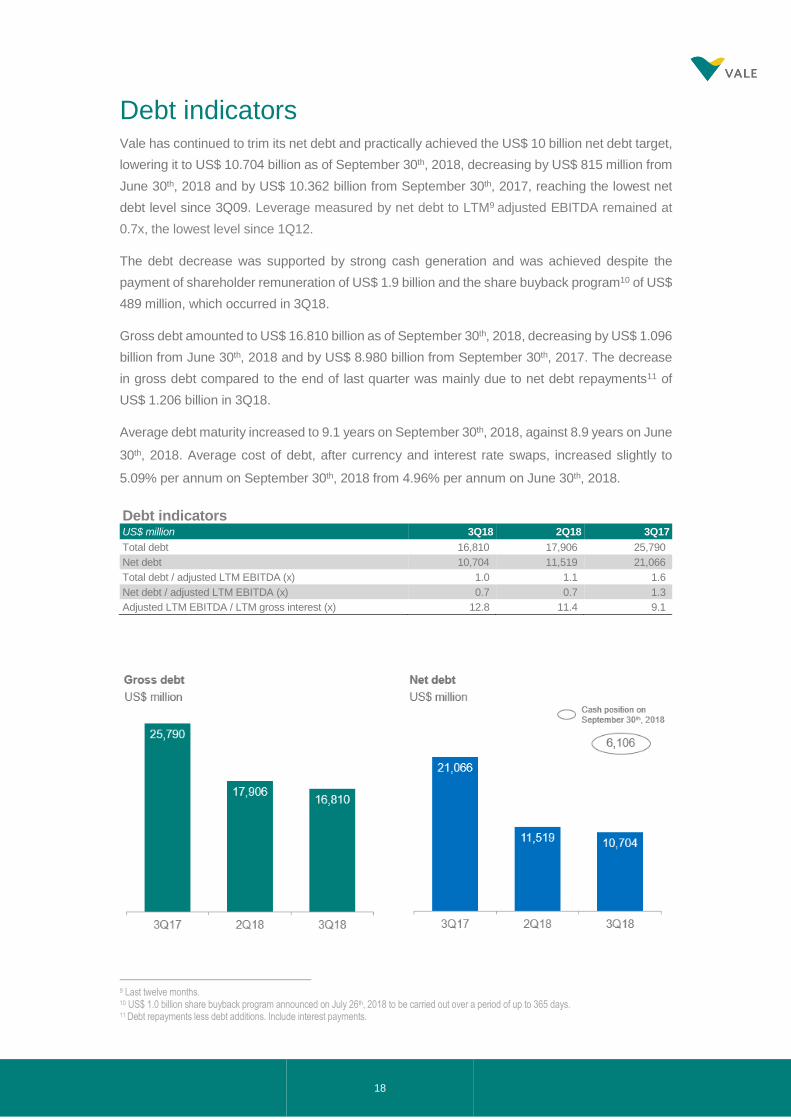
Debt indicators Vale has continued to trim its net debt and practically achieved the US$ 10 billion net debt target,
lowering it to US$ 10.704 billion as of September 30th, 2018, decreasing by US$ 815 million from
June 30th, 2018 and by US$ 10.362 billion from September 30th, 2017, reaching the lowest net
debt level since 3Q09. Leverage measured by net debt to LTM9 adjusted EBITDA remained at
0.7x, the lowest level since 1Q12.
The debt decrease was supported by strong cash generation and was achieved despite the
payment of shareholder remuneration of US$ 1.9 billion and the share buyback program10 of US$
489 million, which occurred in 3Q18.
Gross debt amounted to US$ 16.810 billion as of September 30th, 2018, decreasing by US$ 1.096
billion from June 30th, 2018 and by US$ 8.980 billion from September 30th, 2017. The decrease
in gross debt compared to the end of last quarter was mainly due to net debt repayments11 of
US$ 1.206 billion in 3Q18.
Average debt maturity increased to 9.1 years on September 30th, 2018, against 8.9 years on June
30th, 2018. Average cost of debt, after currency and interest rate swaps, increased slightly to
5.09% per annum on September 30th, 2018 from 4.96% per annum on June 30th, 2018.
Debt indicators US$ million 3Q18 2Q18 3Q17
Total debt 16,810 17,906 25,790
Net debt 10,704 11,519 21,066
Total debt / adjusted LTM EBITDA (x) 1.0 1.1 1.6
Net debt / adjusted LTM EBITDA (x) 0.7 0.7 1.3
Adjusted LTM EBITDA / LTM gross interest (x) 12.8 11.4 9.1
9 Last twelve months. 10 US$ 1.0 billion share buyback program announced on July 26th, 2018 to be carried out over a period of up to 365 days. 11 Debt repayments less debt additions. Include interest payments.
19
20
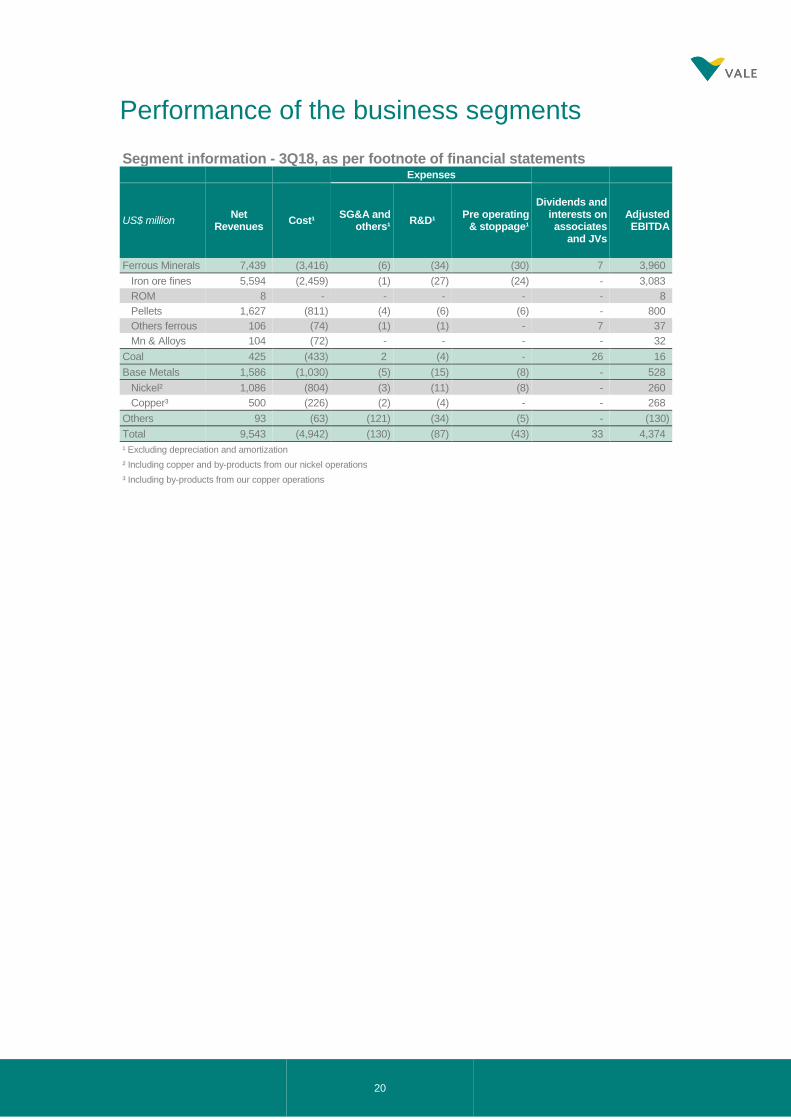
Performance of the business segments
Segment information - 3Q18, as per footnote of financial statements Expenses
US$ million Net
Revenues Cost¹
SG&A and others¹
R&D¹ Pre operating
& stoppage¹
Dividends and interests on associates
and JVs
Adjusted EBITDA
Ferrous Minerals 7,439 (3,416) (6) (34) (30) 7 3,960
Iron ore fines 5,594 (2,459) (1) (27) (24) - 3,083
ROM 8 - - - - - 8
Pellets 1,627 (811) (4) (6) (6) - 800
Others ferrous 106 (74) (1) (1) - 7 37
Mn & Alloys 104 (72) - - - - 32
Coal 425 (433) 2 (4) - 26 16
Base Metals 1,586 (1,030) (5) (15) (8) - 528
Nickel² 1,086 (804) (3) (11) (8) - 260
Copper³ 500 (226) (2) (4) - - 268
Others 93 (63) (121) (34) (5) - (130)
Total 9,543 (4,942) (130) (87) (43) 33 4,374
¹ Excluding depreciation and amortization
² Including copper and by-products from our nickel operations
³ Including by-products from our copper operations
21
Ferrous Minerals
ADJUSTED EBITDA
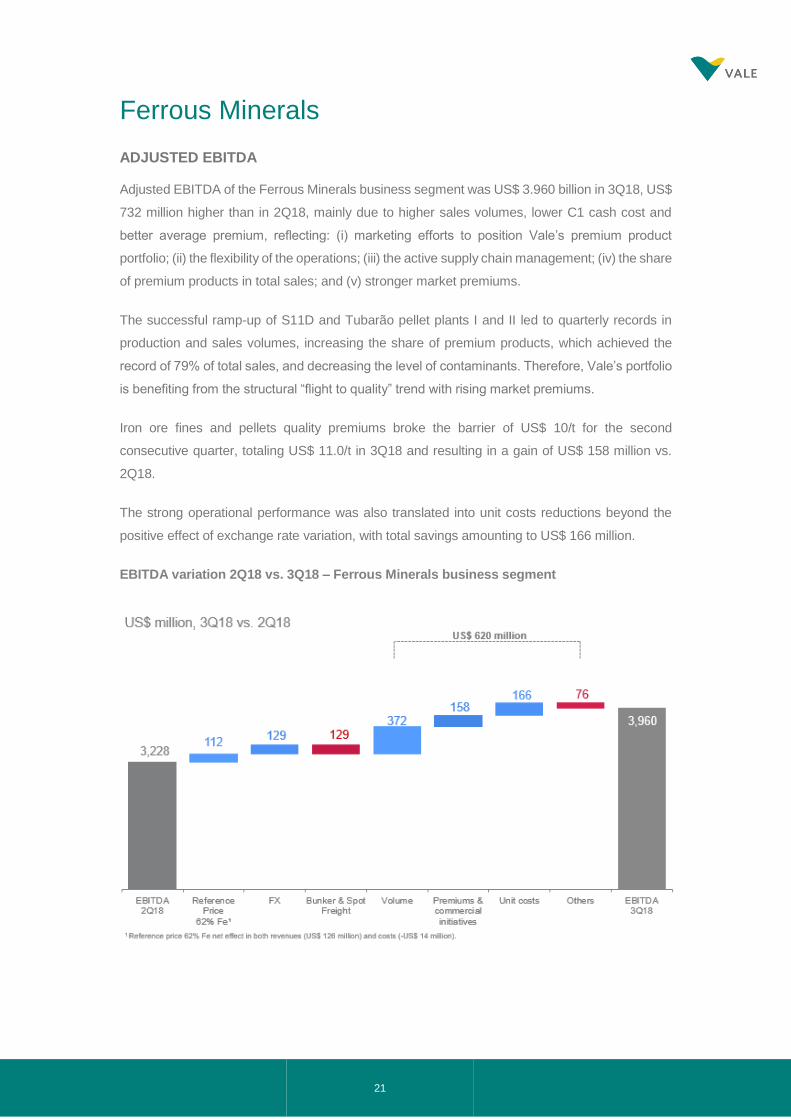
Adjusted EBITDA of the Ferrous Minerals business segment was US$ 3.960 billion in 3Q18, US$
732 million higher than in 2Q18, mainly due to higher sales volumes, lower C1 cash cost and
better average premium, reflecting: (i) marketing efforts to position Vale’s premium product
portfolio; (ii) the flexibility of the operations; (iii) the active supply chain management; (iv) the share
of premium products in total sales; and (v) stronger market premiums.
The successful ramp-up of S11D and Tubarão pellet plants I and II led to quarterly records in
production and sales volumes, increasing the share of premium products, which achieved the
record of 79% of total sales, and decreasing the level of contaminants. Therefore, Vale’s portfolio
is benefiting from the structural “flight to quality” trend with rising market premiums.
Iron ore fines and pellets quality premiums broke the barrier of US$ 10/t for the second
consecutive quarter, totaling US$ 11.0/t in 3Q18 and resulting in a gain of US$ 158 million vs.
2Q18.
The strong operational performance was also translated into unit costs reductions beyond the
positive effect of exchange rate variation, with total savings amounting to US$ 166 million.
EBITDA variation 2Q18 vs. 3Q18 – Ferrous Minerals business segment
22
FERROUS MINERALS ADJUSTED EBITDA MARGIN12
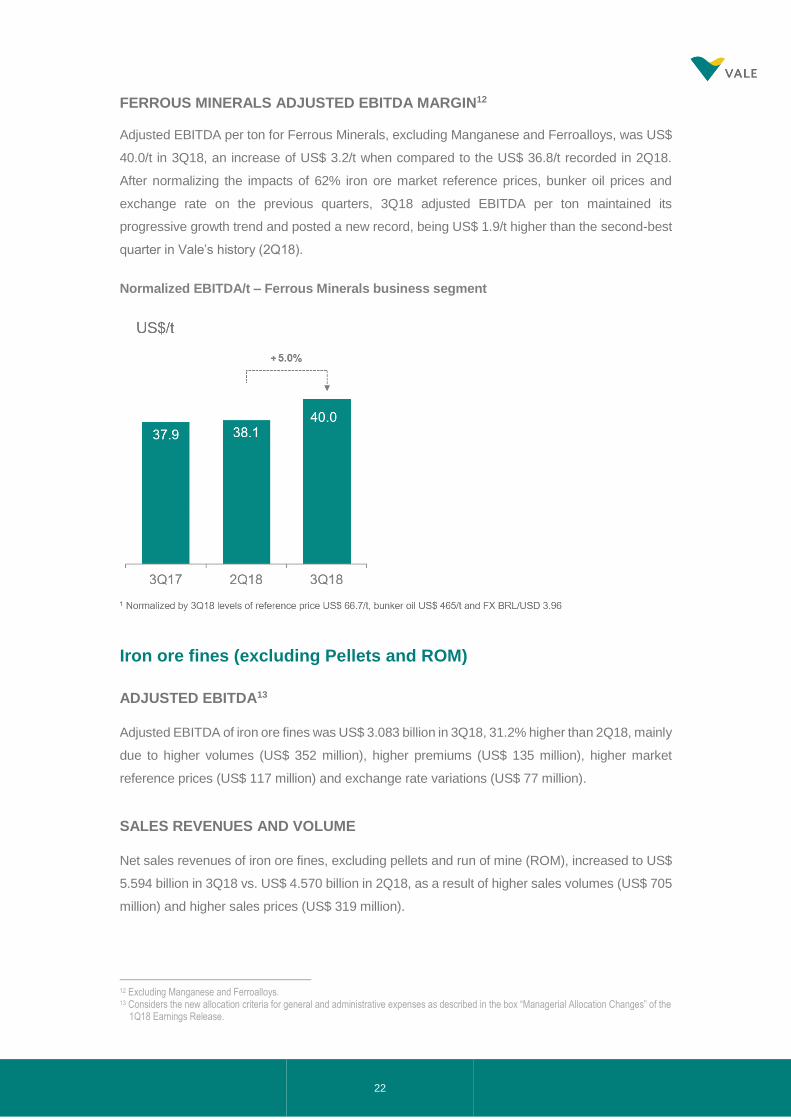
Adjusted EBITDA per ton for Ferrous Minerals, excluding Manganese and Ferroalloys, was US$
40.0/t in 3Q18, an increase of US$ 3.2/t when compared to the US$ 36.8/t recorded in 2Q18.
After normalizing the impacts of 62% iron ore market reference prices, bunker oil prices and
exchange rate on the previous quarters, 3Q18 adjusted EBITDA per ton maintained its
progressive growth trend and posted a new record, being US$ 1.9/t higher than the second-best
quarter in Vale’s history (2Q18).
Normalized EBITDA/t – Ferrous Minerals business segment
Iron ore fines (excluding Pellets and ROM)
ADJUSTED EBITDA13
Adjusted EBITDA of iron ore fines was US$ 3.083 billion in 3Q18, 31.2% higher than 2Q18, mainly
due to higher volumes (US$ 352 million), higher premiums (US$ 135 million), higher market
reference prices (US$ 117 million) and exchange rate variations (US$ 77 million).
SALES REVENUES AND VOLUME
Net sales revenues of iron ore fines, excluding pellets and run of mine (ROM), increased to US$
5.594 billion in 3Q18 vs. US$ 4.570 billion in 2Q18, as a result of higher sales volumes (US$ 705
million) and higher sales prices (US$ 319 million).
12 Excluding Manganese and Ferroalloys. 13 Considers the new allocation criteria for general and administrative expenses as described in the box “Managerial Allocation Changes” of the
1Q18 Earnings Release.
23
Sales volumes of iron ore fines achieved a quarterly record of 83.5 Mt in 3Q18, despite the
increase in offshore stocks to support the ongoing blending activities.
CFR sales of iron ore fines totaled 61.0 Mt in 3Q18, representing 73% of all iron ore fines sales
volumes in 3Q18, 4.4 p.p. higher than in 2Q18.
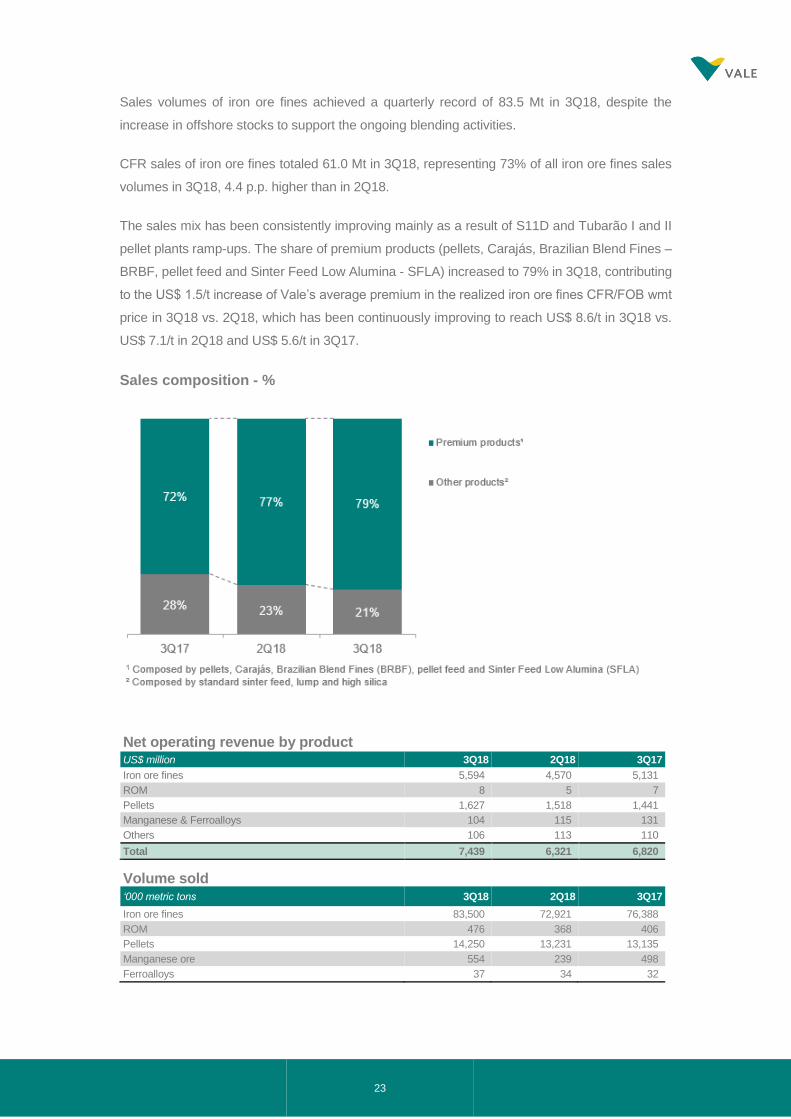
The sales mix has been consistently improving mainly as a result of S11D and Tubarão I and II
pellet plants ramp-ups. The share of premium products (pellets, Carajás, Brazilian Blend Fines –
BRBF, pellet feed and Sinter Feed Low Alumina - SFLA) increased to 79% in 3Q18, contributing
to the US$ 1.5/t increase of Vale’s average premium in the realized iron ore fines CFR/FOB wmt
price in 3Q18 vs. 2Q18, which has been continuously improving to reach US$ 8.6/t in 3Q18 vs.
US$ 7.1/t in 2Q18 and US$ 5.6/t in 3Q17.
Sales composition - %
Net operating revenue by product US$ million 3Q18 2Q18 3Q17
Iron ore fines 5,594 4,570 5,131
ROM 8 5 7
Pellets 1,627 1,518 1,441
Manganese & Ferroalloys 104 115 131
Others 106 113 110
Total 7,439 6,321 6,820
Volume sold
‘000 metric tons 3Q18 2Q18 3Q17
Iron ore fines 83,500 72,921 76,388
ROM 476 368 406
Pellets 14,250 13,231 13,135
Manganese ore 554 239 498
Ferroalloys 37 34 32
24
The percentage of sales recorded under the
provisional pricing system in relation to total sales
in 3Q18 was in line with 2Q18, after having
decreased in the previous quarters. This new level
reflects Vale’s reduced time to market, following
the increased number of distribution centers
offshore, and therefore being closer to the end
customer. The reduction of the share of provisional
pricing system sales also improves the
predictability of Vale’s results, as it decreases the
price adjustments.
REALIZED PRICES
Pricing system breakdown - %
Price realization – iron ore fines
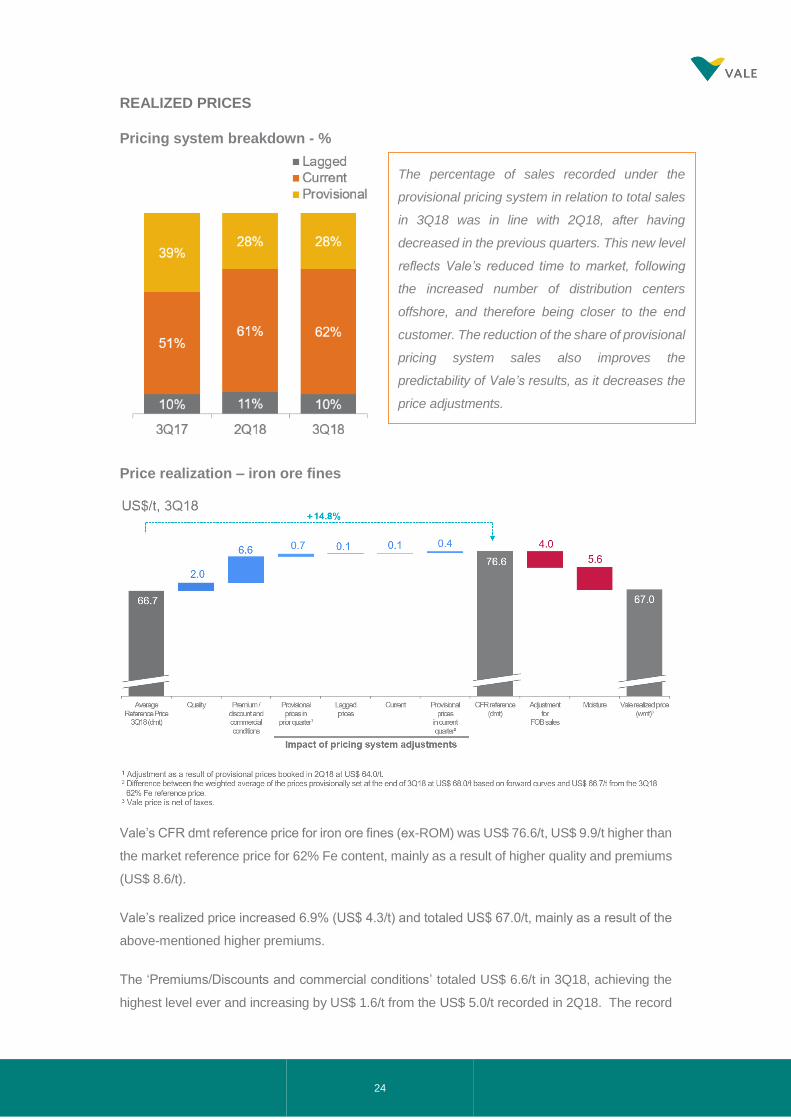
Vale’s CFR dmt reference price for iron ore fines (ex-ROM) was US$ 76.6/t, US$ 9.9/t higher than
the market reference price for 62% Fe content, mainly as a result of higher quality and premiums
(US$ 8.6/t).
Vale’s realized price increased 6.9% (US$ 4.3/t) and totaled US$ 67.0/t, mainly as a result of the
above-mentioned higher premiums.
The ‘Premiums/Discounts and commercial conditions’ totaled US$ 6.6/t in 3Q18, achieving the
highest level ever and increasing by US$ 1.6/t from the US$ 5.0/t recorded in 2Q18. The record
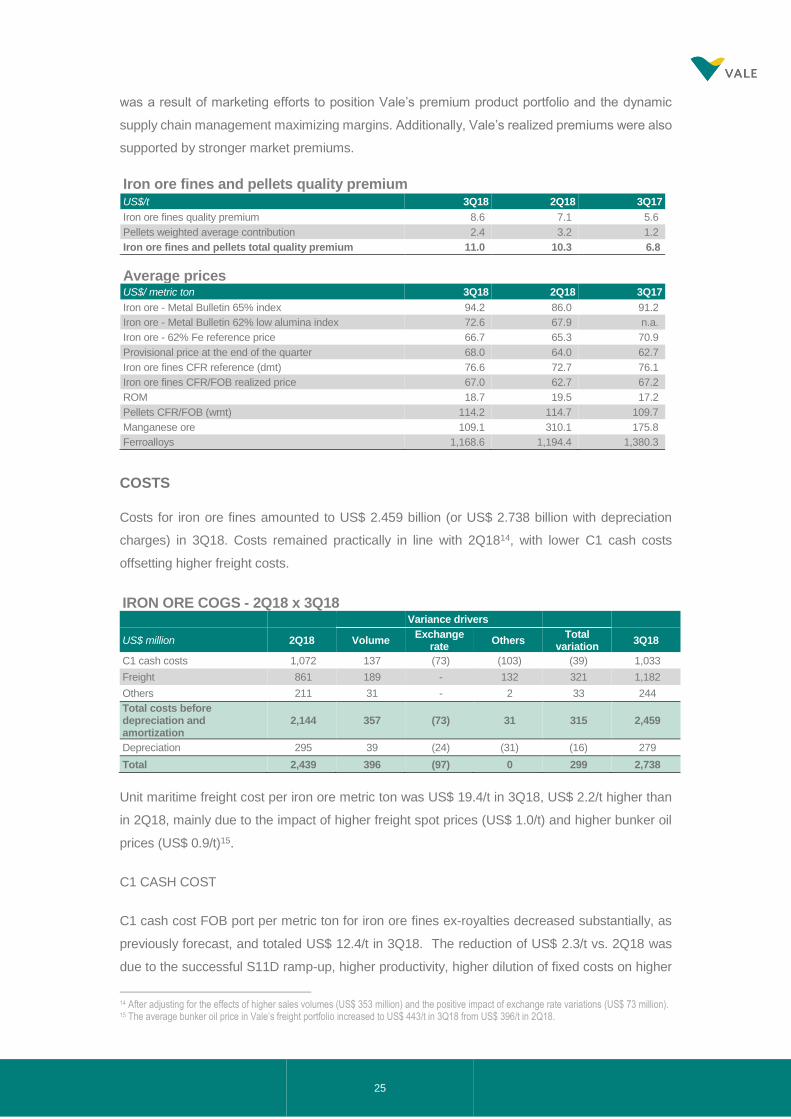
25
was a result of marketing efforts to position Vale’s premium product portfolio and the dynamic
supply chain management maximizing margins. Additionally, Vale’s realized premiums were also
supported by stronger market premiums.
Iron ore fines and pellets quality premium US$/t 3Q18 2Q18 3Q17
Iron ore fines quality premium 8.6 7.1 5.6
Pellets weighted average contribution 2.4 3.2 1.2
Iron ore fines and pellets total quality premium 11.0 10.3 6.8
Average prices US$/ metric ton 3Q18 2Q18 3Q17
Iron ore - Metal Bulletin 65% index 94.2 86.0 91.2
Iron ore - Metal Bulletin 62% low alumina index 72.6 67.9 n.a.
Iron ore - 62% Fe reference price 66.7 65.3 70.9
Provisional price at the end of the quarter 68.0 64.0 62.7
Iron ore fines CFR reference (dmt) 76.6 72.7 76.1
Iron ore fines CFR/FOB realized price 67.0 62.7 67.2
ROM 18.7 19.5 17.2
Pellets CFR/FOB (wmt) 114.2 114.7 109.7
Manganese ore 109.1 310.1 175.8
Ferroalloys 1,168.6 1,194.4 1,380.3
COSTS
Costs for iron ore fines amounted to US$ 2.459 billion (or US$ 2.738 billion with depreciation
charges) in 3Q18. Costs remained practically in line with 2Q1814, with lower C1 cash costs
offsetting higher freight costs.
IRON ORE COGS - 2Q18 x 3Q18 Variance drivers
US$ million 2Q18 Volume Exchange
rate Others
Total variation
3Q18
C1 cash costs 1,072 137 (73) (103) (39) 1,033
Freight 861 189 - 132 321 1,182
Others 211 31 - 2 33 244
Total costs before depreciation and amortization
2,144 357 (73) 31 315 2,459
Depreciation 295 39 (24) (31) (16) 279
Total 2,439 396 (97) 0 299 2,738
Unit maritime freight cost per iron ore metric ton was US$ 19.4/t in 3Q18, US$ 2.2/t higher than
in 2Q18, mainly due to the impact of higher freight spot prices (US$ 1.0/t) and higher bunker oil
prices (US$ 0.9/t)15.
C1 CASH COST
C1 cash cost FOB port per metric ton for iron ore fines ex-royalties decreased substantially, as
previously forecast, and totaled US$ 12.4/t in 3Q18. The reduction of US$ 2.3/t vs. 2Q18 was
due to the successful S11D ramp-up, higher productivity, higher dilution of fixed costs on higher
14 After adjusting for the effects of higher sales volumes (US$ 353 million) and the positive impact of exchange rate variations (US$ 73 million). 15 The average bunker oil price in Vale’s freight portfolio increased to US$ 443/t in 3Q18 from US$ 396/t in 2Q18.
26
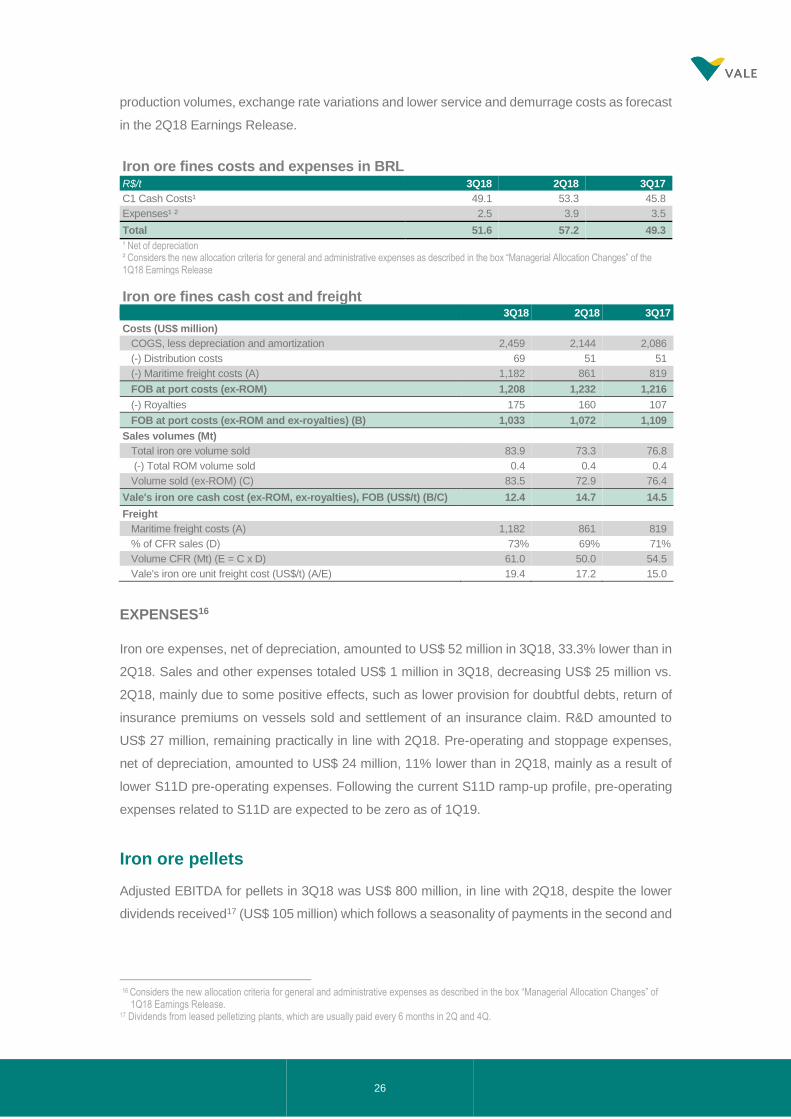
production volumes, exchange rate variations and lower service and demurrage costs as forecast
in the 2Q18 Earnings Release.
Iron ore fines costs and expenses in BRL R$/t 3Q18 2Q18 3Q17
C1 Cash Costs¹ 49.1 53.3 45.8
Expenses¹ ² 2.5 3.9 3.5
Total 51.6 57.2 49.3
¹ Net of depreciation ² Considers the new allocation criteria for general and administrative expenses as described in the box “Managerial Allocation Changes” of the 1Q18 Earnings Release
Iron ore fines cash cost and freight 3Q18 2Q18 3Q17
Costs (US$ million)
COGS, less depreciation and amortization 2,459 2,144 2,086
(-) Distribution costs 69 51 51
(-) Maritime freight costs (A) 1,182 861 819
FOB at port costs (ex-ROM) 1,208 1,232 1,216
(-) Royalties 175 160 107
FOB at port costs (ex-ROM and ex-royalties) (B) 1,033 1,072 1,109
Sales volumes (Mt)
Total iron ore volume sold 83.9 73.3 76.8
(-) Total ROM volume sold 0.4 0.4 0.4
Volume sold (ex-ROM) (C) 83.5 72.9 76.4
Vale's iron ore cash cost (ex-ROM, ex-royalties), FOB (US$/t) (B/C) 12.4 14.7 14.5
Freight
Maritime freight costs (A) 1,182 861 819
% of CFR sales (D) 73% 69% 71%
Volume CFR (Mt) (E = C x D) 61.0 50.0 54.5
Vale's iron ore unit freight cost (US$/t) (A/E) 19.4 17.2 15.0
EXPENSES16
Iron ore expenses, net of depreciation, amounted to US$ 52 million in 3Q18, 33.3% lower than in
2Q18. Sales and other expenses totaled US$ 1 million in 3Q18, decreasing US$ 25 million vs.
2Q18, mainly due to some positive effects, such as lower provision for doubtful debts, return of
insurance premiums on vessels sold and settlement of an insurance claim. R&D amounted to
US$ 27 million, remaining practically in line with 2Q18. Pre-operating and stoppage expenses,
net of depreciation, amounted to US$ 24 million, 11% lower than in 2Q18, mainly as a result of
lower S11D pre-operating expenses. Following the current S11D ramp-up profile, pre-operating
expenses related to S11D are expected to be zero as of 1Q19.
Iron ore pellets
Adjusted EBITDA for pellets in 3Q18 was US$ 800 million, in line with 2Q18, despite the lower
dividends received17 (US$ 105 million) which follows a seasonality of payments in the second and
16 Considers the new allocation criteria for general and administrative expenses as described in the box “Managerial Allocation Changes” of
1Q18 Earnings Release. 17 Dividends from leased pelletizing plants, which are usually paid every 6 months in 2Q and 4Q.
27
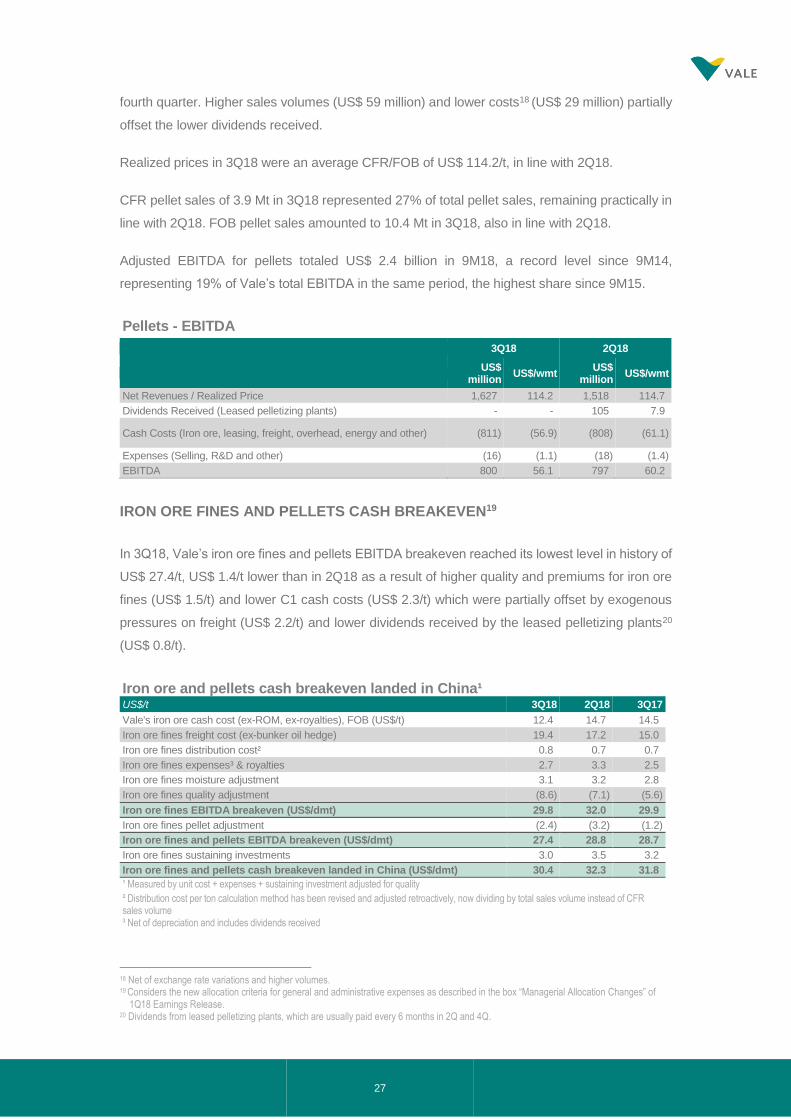
fourth quarter. Higher sales volumes (US$ 59 million) and lower costs18 (US$ 29 million) partially
offset the lower dividends received.
Realized prices in 3Q18 were an average CFR/FOB of US$ 114.2/t, in line with 2Q18.
CFR pellet sales of 3.9 Mt in 3Q18 represented 27% of total pellet sales, remaining practically in
line with 2Q18. FOB pellet sales amounted to 10.4 Mt in 3Q18, also in line with 2Q18.
Adjusted EBITDA for pellets totaled US$ 2.4 billion in 9M18, a record level since 9M14,
representing 19% of Vale’s total EBITDA in the same period, the highest share since 9M15.
Pellets - EBITDA
3Q18 2Q18
US$
million US$/wmt
US$ million
US$/wmt
Net Revenues / Realized Price 1,627 114.2 1,518 114.7
Dividends Received (Leased pelletizing plants) - - 105 7.9
Cash Costs (Iron ore, leasing, freight, overhead, energy and other) (811) (56.9) (808) (61.1)
Expenses (Selling, R&D and other) (16) (1.1) (18) (1.4)
EBITDA 800 56.1 797 60.2
IRON ORE FINES AND PELLETS CASH BREAKEVEN19
In 3Q18, Vale’s iron ore fines and pellets EBITDA breakeven reached its lowest level in history of
US$ 27.4/t, US$ 1.4/t lower than in 2Q18 as a result of higher quality and premiums for iron ore
fines (US$ 1.5/t) and lower C1 cash costs (US$ 2.3/t) which were partially offset by exogenous
pressures on freight (US$ 2.2/t) and lower dividends received by the leased pelletizing plants20
(US$ 0.8/t).
Iron ore and pellets cash breakeven landed in China¹ US$/t 3Q18 2Q18 3Q17
Vale's iron ore cash cost (ex-ROM, ex-royalties), FOB (US$/t) 12.4 14.7 14.5
Iron ore fines freight cost (ex-bunker oil hedge) 19.4 17.2 15.0
Iron ore fines distribution cost² 0.8 0.7 0.7
Iron ore fines expenses³ & royalties 2.7 3.3 2.5
Iron ore fines moisture adjustment 3.1 3.2 2.8
Iron ore fines quality adjustment (8.6) (7.1) (5.6)
Iron ore fines EBITDA breakeven (US$/dmt) 29.8 32.0 29.9
Iron ore fines pellet adjustment (2.4) (3.2) (1.2)
Iron ore fines and pellets EBITDA breakeven (US$/dmt) 27.4 28.8 28.7
Iron ore fines sustaining investments 3.0 3.5 3.2
Iron ore fines and pellets cash breakeven landed in China (US$/dmt) 30.4 32.3 31.8
¹ Measured by unit cost + expenses + sustaining investment adjusted for quality
² Distribution cost per ton calculation method has been revised and adjusted retroactively, now dividing by total sales volume instead of CFR sales volume ³ Net of depreciation and includes dividends received
18 Net of exchange rate variations and higher volumes. 19 Considers the new allocation criteria for general and administrative expenses as described in the box “Managerial Allocation Changes” of
1Q18 Earnings Release. 20 Dividends from leased pelletizing plants, which are usually paid every 6 months in 2Q and 4Q.
28
Manganese and ferroalloys
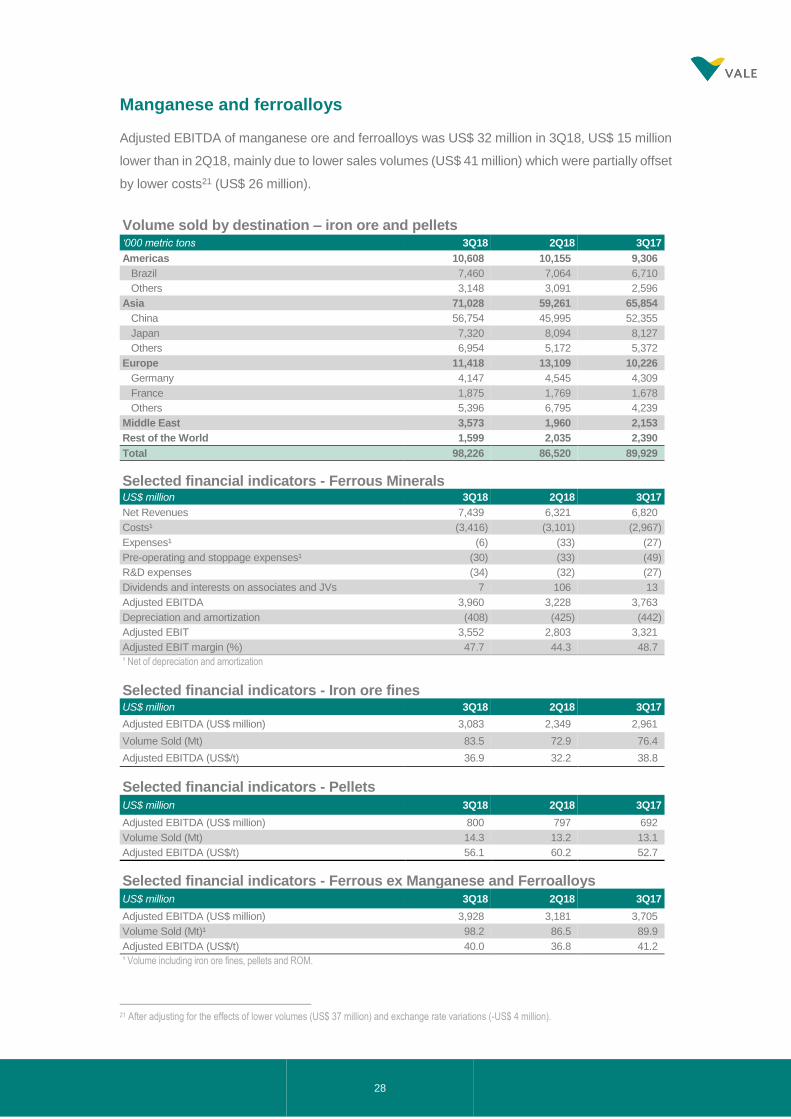
Adjusted EBITDA of manganese ore and ferroalloys was US$ 32 million in 3Q18, US$ 15 million
lower than in 2Q18, mainly due to lower sales volumes (US$ 41 million) which were partially offset
by lower costs21 (US$ 26 million).
Volume sold by destination – iron ore and pellets ‘000 metric tons 3Q18 2Q18 3Q17
Americas 10,608 10,155 9,306
Brazil 7,460 7,064 6,710
Others 3,148 3,091 2,596
Asia 71,028 59,261 65,854
China 56,754 45,995 52,355
Japan 7,320 8,094 8,127
Others 6,954 5,172 5,372
Europe 11,418 13,109 10,226
Germany 4,147 4,545 4,309
France 1,875 1,769 1,678
Others 5,396 6,795 4,239
Middle East 3,573 1,960 2,153
Rest of the World 1,599 2,035 2,390
Total 98,226 86,520 89,929
Selected financial indicators - Ferrous Minerals US$ million 3Q18 2Q18 3Q17
Net Revenues 7,439 6,321 6,820
Costs¹ (3,416) (3,101) (2,967)
Expenses¹ (6) (33) (27)
Pre-operating and stoppage expenses¹ (30) (33) (49)
R&D expenses (34) (32) (27)
Dividends and interests on associates and JVs 7 106 13
Adjusted EBITDA 3,960 3,228 3,763
Depreciation and amortization (408) (425) (442)
Adjusted EBIT 3,552 2,803 3,321
Adjusted EBIT margin (%) 47.7 44.3 48.7
¹ Net of depreciation and amortization
Selected financial indicators - Iron ore fines US$ million 3Q18 2Q18 3Q17
Adjusted EBITDA (US$ million) 3,083 2,349 2,961
Volume Sold (Mt) 83.5 72.9 76.4
Adjusted EBITDA (US$/t) 36.9 32.2 38.8
Selected financial indicators - Pellets US$ million 3Q18 2Q18 3Q17
Adjusted EBITDA (US$ million) 800 797 692
Volume Sold (Mt) 14.3 13.2 13.1
Adjusted EBITDA (US$/t) 56.1 60.2 52.7
Selected financial indicators - Ferrous ex Manganese and Ferroalloys US$ million 3Q18 2Q18 3Q17
Adjusted EBITDA (US$ million) 3,928 3,181 3,705
Volume Sold (Mt)¹ 98.2 86.5 89.9
Adjusted EBITDA (US$/t) 40.0 36.8 41.2
¹ Volume including iron ore fines, pellets and ROM.
21 After adjusting for the effects of lower volumes (US$ 37 million) and exchange rate variations (-US$ 4 million).
29
Base Metals
ADJUSTED EBITDA
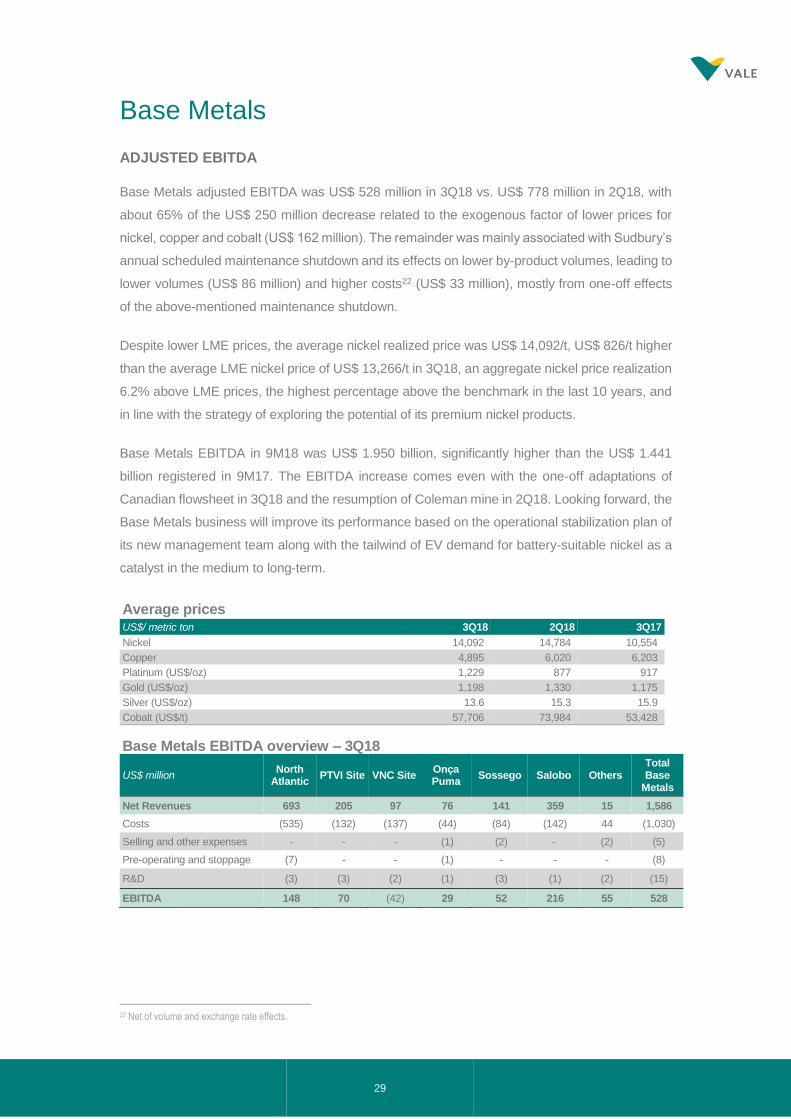
Base Metals adjusted EBITDA was US$ 528 million in 3Q18 vs. US$ 778 million in 2Q18, with
about 65% of the US$ 250 million decrease related to the exogenous factor of lower prices for
nickel, copper and cobalt (US$ 162 million). The remainder was mainly associated with Sudbury’s
annual scheduled maintenance shutdown and its effects on lower by-product volumes, leading to
lower volumes (US$ 86 million) and higher costs22 (US$ 33 million), mostly from one-off effects
of the above-mentioned maintenance shutdown.
Despite lower LME prices, the average nickel realized price was US$ 14,092/t, US$ 826/t higher
than the average LME nickel price of US$ 13,266/t in 3Q18, an aggregate nickel price realization
6.2% above LME prices, the highest percentage above the benchmark in the last 10 years, and
in line with the strategy of exploring the potential of its premium nickel products.
Base Metals EBITDA in 9M18 was US$ 1.950 billion, significantly higher than the US$ 1.441
billion registered in 9M17. The EBITDA increase comes even with the one-off adaptations of
Canadian flowsheet in 3Q18 and the resumption of Coleman mine in 2Q18. Looking forward, the
Base Metals business will improve its performance based on the operational stabilization plan of
its new management team along with the tailwind of EV demand for battery-suitable nickel as a
catalyst in the medium to long-term.
Average prices US$/ metric ton 3Q18 2Q18 3Q17
Nickel 14,092 14,784 10,554
Copper 4,895 6,020 6,203
Platinum (US$/oz) 1,229 877 917
Gold (US$/oz) 1,198 1,330 1,175
Silver (US$/oz) 13.6 15.3 15.9
Cobalt (US$/t) 57,706 73,984 53,428
Base Metals EBITDA overview – 3Q18
US$ million North
Atlantic PTVI Site VNC Site
Onça Puma
Sossego Salobo Others Total Base
Metals
Net Revenues 693 205 97 76 141 359 15 1,586
Costs (535) (132) (137) (44) (84) (142) 44 (1,030)
Selling and other expenses - - - (1) (2) - (2) (5)
Pre-operating and stoppage (7) - - (1) - - - (8)
R&D (3) (3) (2) (1) (3) (1) (2) (15)
EBITDA 148 70 (42) 29 52 216 55 528
22 Net of volume and exchange rate effects.
30
Nickel operations
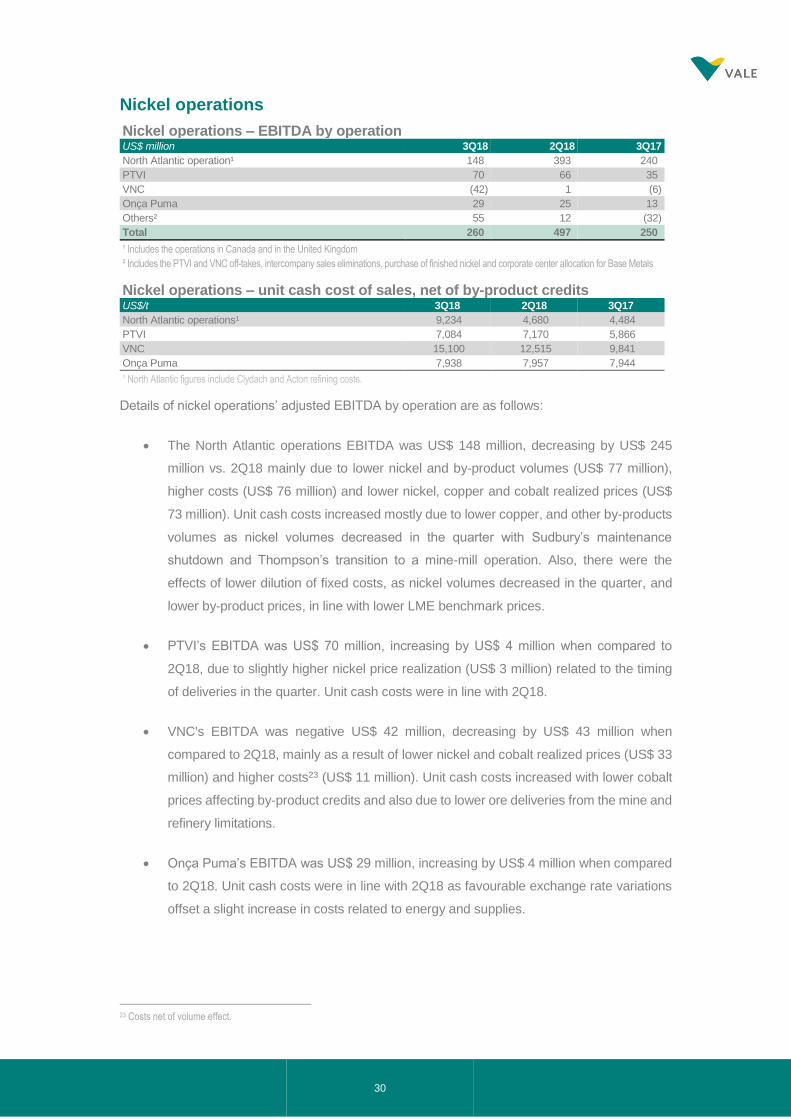
Nickel operations – EBITDA by operation US$ million 3Q18 2Q18 3Q17
North Atlantic operation¹ 148 393 240
PTVI 70 66 35
VNC (42) 1 (6)
Onça Puma 29 25 13
Others² 55 12 (32)
Total 260 497 250
¹ Includes the operations in Canada and in the United Kingdom
² Includes the PTVI and VNC off-takes, intercompany sales eliminations, purchase of finished nickel and corporate center allocation for Base Metals
Nickel operations – unit cash cost of sales, net of by-product credits US$/t 3Q18 2Q18 3Q17
North Atlantic operations¹ 9,234 4,680 4,484
PTVI 7,084 7,170 5,866
VNC 15,100 12,515 9,841
Onça Puma 7,938 7,957 7,944
¹ North Atlantic figures include Clydach and Acton refining costs.
Details of nickel operations’ adjusted EBITDA by operation are as follows:
• The North Atlantic operations EBITDA was US$ 148 million, decreasing by US$ 245
million vs. 2Q18 mainly due to lower nickel and by-product volumes (US$ 77 million),
higher costs (US$ 76 million) and lower nickel, copper and cobalt realized prices (US$
73 million). Unit cash costs increased mostly due to lower copper, and other by-products
volumes as nickel volumes decreased in the quarter with Sudbury’s maintenance
shutdown and Thompson’s transition to a mine-mill operation. Also, there were the
effects of lower dilution of fixed costs, as nickel volumes decreased in the quarter, and
lower by-product prices, in line with lower LME benchmark prices.
• PTVI’s EBITDA was US$ 70 million, increasing by US$ 4 million when compared to
2Q18, due to slightly higher nickel price realization (US$ 3 million) related to the timing
of deliveries in the quarter. Unit cash costs were in line with 2Q18.
• VNC's EBITDA was negative US$ 42 million, decreasing by US$ 43 million when
compared to 2Q18, mainly as a result of lower nickel and cobalt realized prices (US$ 33
million) and higher costs23 (US$ 11 million). Unit cash costs increased with lower cobalt
prices affecting by-product credits and also due to lower ore deliveries from the mine and
refinery limitations.
• Onça Puma’s EBITDA was US$ 29 million, increasing by US$ 4 million when compared
to 2Q18. Unit cash costs were in line with 2Q18 as favourable exchange rate variations
offset a slight increase in costs related to energy and supplies.
23 Costs net of volume effect.
31
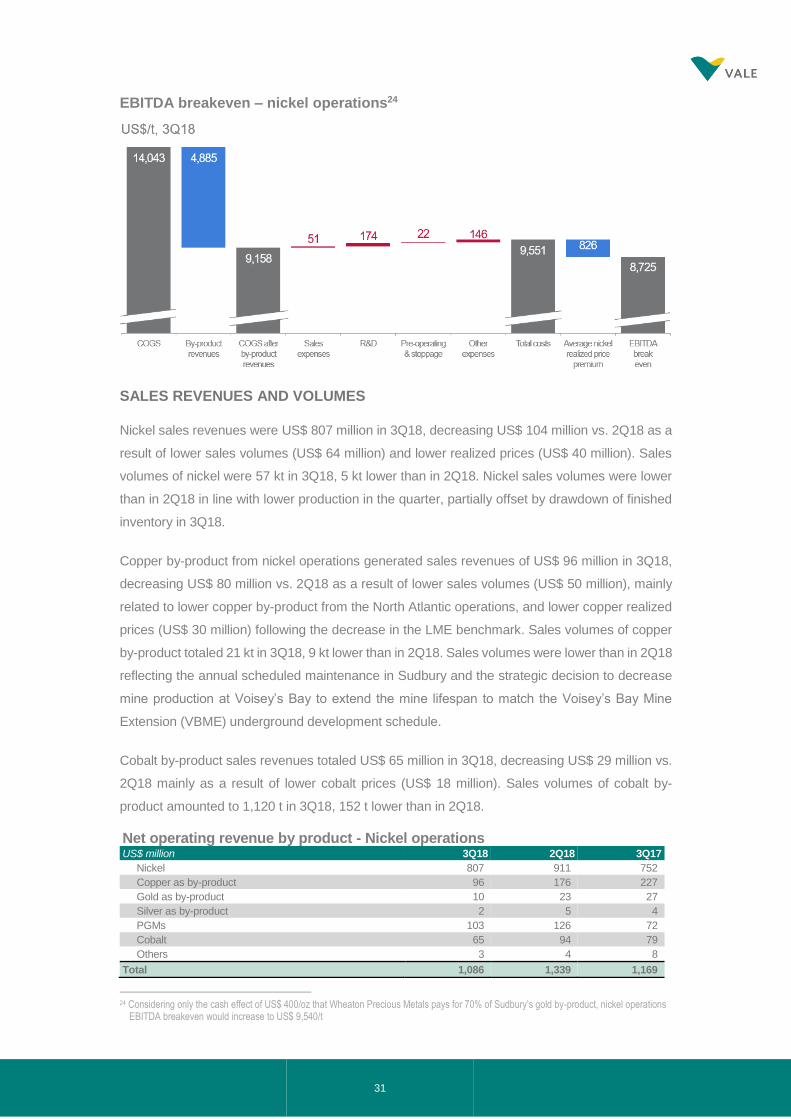
EBITDA breakeven – nickel operations24
SALES REVENUES AND VOLUMES
Nickel sales revenues were US$ 807 million in 3Q18, decreasing US$ 104 million vs. 2Q18 as a
result of lower sales volumes (US$ 64 million) and lower realized prices (US$ 40 million). Sales
volumes of nickel were 57 kt in 3Q18, 5 kt lower than in 2Q18. Nickel sales volumes were lower
than in 2Q18 in line with lower production in the quarter, partially offset by drawdown of finished
inventory in 3Q18.
Copper by-product from nickel operations generated sales revenues of US$ 96 million in 3Q18,
decreasing US$ 80 million vs. 2Q18 as a result of lower sales volumes (US$ 50 million), mainly
related to lower copper by-product from the North Atlantic operations, and lower copper realized
prices (US$ 30 million) following the decrease in the LME benchmark. Sales volumes of copper
by-product totaled 21 kt in 3Q18, 9 kt lower than in 2Q18. Sales volumes were lower than in 2Q18
reflecting the annual scheduled maintenance in Sudbury and the strategic decision to decrease
mine production at Voisey’s Bay to extend the mine lifespan to match the Voisey’s Bay Mine
Extension (VBME) underground development schedule.
Cobalt by-product sales revenues totaled US$ 65 million in 3Q18, decreasing US$ 29 million vs.
2Q18 mainly as a result of lower cobalt prices (US$ 18 million). Sales volumes of cobalt by-
product amounted to 1,120 t in 3Q18, 152 t lower than in 2Q18.
Net operating revenue by product - Nickel operations US$ million 3Q18 2Q18 3Q17
Nickel 807 911 752
Copper as by-product 96 176 227
Gold as by-product 10 23 27
Silver as by-product 2 5 4
PGMs 103 126 72
Cobalt 65 94 79
Others 3 4 8
Total 1,086 1,339 1,169
24 Considering only the cash effect of US$ 400/oz that Wheaton Precious Metals pays for 70% of Sudbury’s gold by-product, nickel operations
EBITDA breakeven would increase to US$ 9,540/t
32
Volume sold - Nickel operations ‘000 metric tons 3Q18 2Q18 3Q17
Nickel 57 62 71
Class I nickel 32 37 37
Class II Battery-suitable nickel 15 16 17
Class II nickel 6 4 6
Intermediates 4 4 11
Copper as by-product 21 30 37
Gold as by-product ('000 oz) 11 18 34
Silver as by-product ('000 oz) 185 329 242
PGMs ('000 oz) 90 138 85
Cobalt (metric ton) 1,120 1,272 1,482
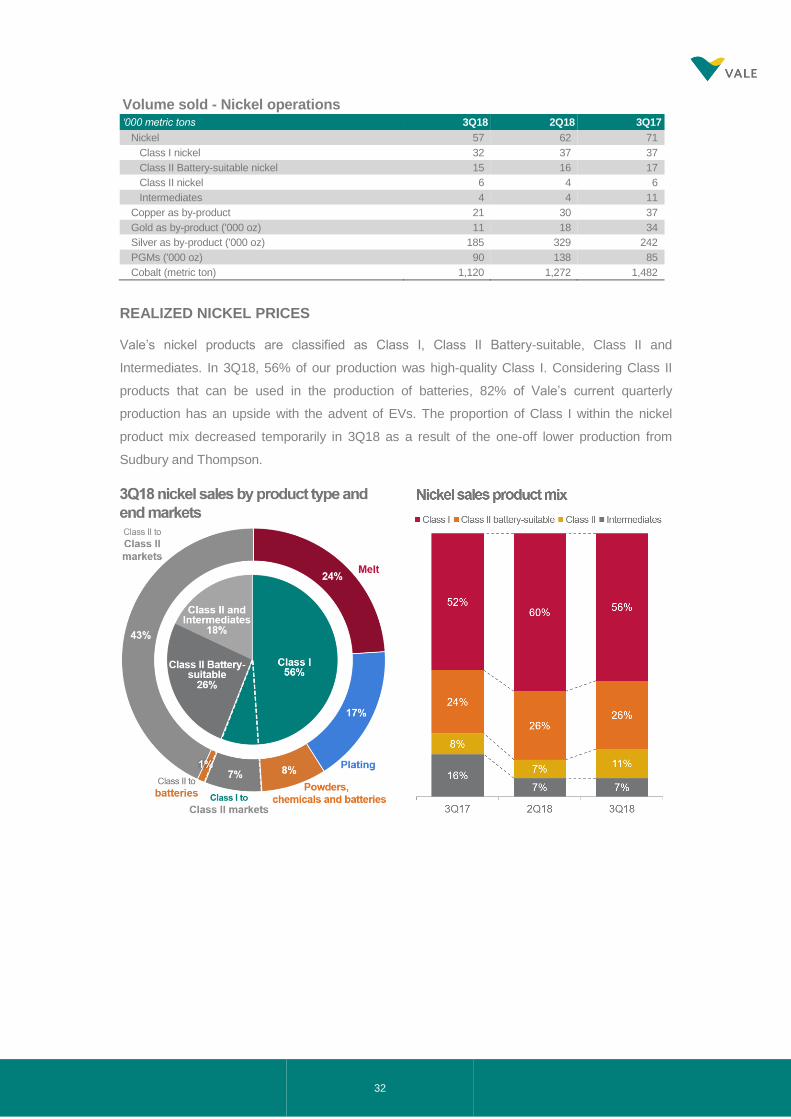
REALIZED NICKEL PRICES
Vale’s nickel products are classified as Class I, Class II Battery-suitable, Class II and
Intermediates. In 3Q18, 56% of our production was high-quality Class I. Considering Class II
products that can be used in the production of batteries, 82% of Vale’s current quarterly
production has an upside with the advent of EVs. The proportion of Class I within the nickel
product mix decreased temporarily in 3Q18 as a result of the one-off lower production from
Sudbury and Thompson.
33
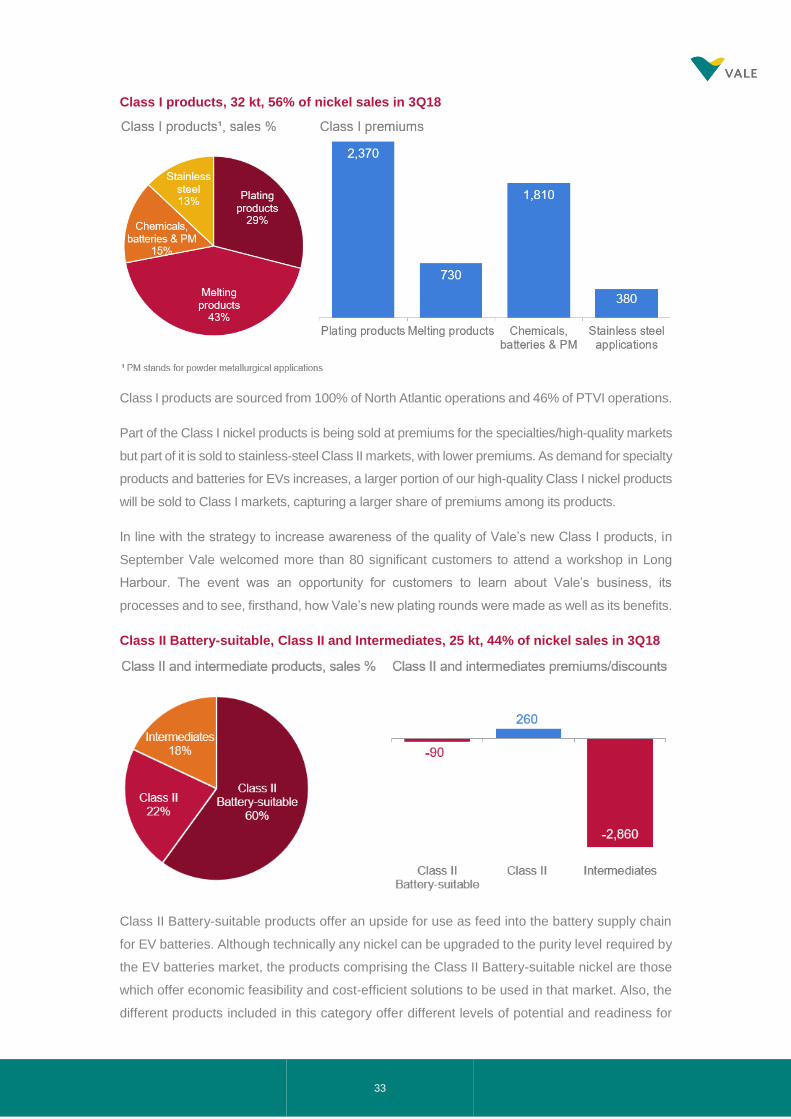
Class I products, 32 kt, 56% of nickel sales in 3Q18
Class I products are sourced from 100% of North Atlantic operations and 46% of PTVI operations.
Part of the Class I nickel products is being sold at premiums for the specialties/high-quality markets
but part of it is sold to stainless-steel Class II markets, with lower premiums. As demand for specialty
products and batteries for EVs increases, a larger portion of our high-quality Class I nickel products
will be sold to Class I markets, capturing a larger share of premiums among its products.
In line with the strategy to increase awareness of the quality of Vale’s new Class I products, in
September Vale welcomed more than 80 significant customers to attend a workshop in Long
Harbour. The event was an opportunity for customers to learn about Vale’s business, its
processes and to see, firsthand, how Vale’s new plating rounds were made as well as its benefits.
Class II Battery-suitable, Class II and Intermediates, 25 kt, 44% of nickel sales in 3Q18
Class II Battery-suitable products offer an upside for use as feed into the battery supply chain
for EV batteries. Although technically any nickel can be upgraded to the purity level required by
the EV batteries market, the products comprising the Class II Battery-suitable nickel are those
which offer economic feasibility and cost-efficient solutions to be used in that market. Also, the
different products included in this category offer different levels of potential and readiness for
34
utilization in EVs. The Class II Battery-suitable products are sourced from 100% of VNC
operations and 35% of PTVI operations.
It is economically challenging to use Class II products such as ferro-nickel in electric vehicle battery
applications, mainly due to impurities, operational costs and capital costs associated with the
conversion process. Vale’s Class II products are sourced from 100% of Onça Puma operations.
Intermediate products are sourced from 19% of PTVI production. These products do not
represent finished nickel production and are generally sold at a discount given that they still need
to be processed before being sold to end customers.
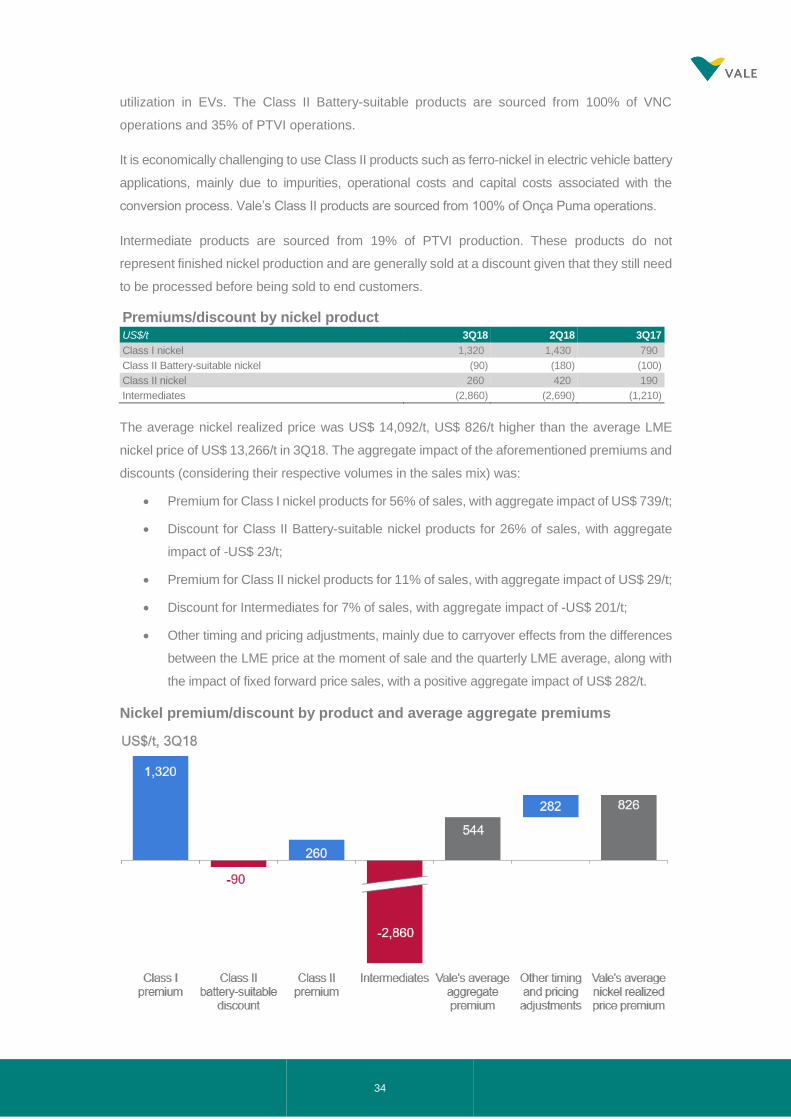
Premiums/discount by nickel product US$/t 3Q18 2Q18 3Q17
Class I nickel 1,320 1,430 790
Class II Battery-suitable nickel (90) (180) (100)
Class II nickel 260 420 190
Intermediates (2,860) (2,690) (1,210)
The average nickel realized price was US$ 14,092/t, US$ 826/t higher than the average LME
nickel price of US$ 13,266/t in 3Q18. The aggregate impact of the aforementioned premiums and
discounts (considering their respective volumes in the sales mix) was:
• Premium for Class I nickel products for 56% of sales, with aggregate impact of US$ 739/t;
• Discount for Class II Battery-suitable nickel products for 26% of sales, with aggregate
impact of -US$ 23/t;
• Premium for Class II nickel products for 11% of sales, with aggregate impact of US$ 29/t;
• Discount for Intermediates for 7% of sales, with aggregate impact of -US$ 201/t;
• Other timing and pricing adjustments, mainly due to carryover effects from the differences
between the LME price at the moment of sale and the quarterly LME average, along with
the impact of fixed forward price sales, with a positive aggregate impact of US$ 282/t.
Nickel premium/discount by product and average aggregate premiums
35
Nickel COGS - 2Q18 x 3Q18
Variance drivers
US$ million 2Q18 Volume Exchange
rate Others Total variation 3Q18
Nickel operations 810 (54) (11) 59 (6) 804
Depreciation 309 (45) 5 45 5 314
Total 1,119 (99) (6) 104 (1) 1,118
EXPENSES25
Selling expenses and other expenses totaled US$ 3 million in 3Q18, lower than the US$ 18 million
registered last quarter as, in 2Q18, part of the G&A expenses was still in transition from the Base
Metals business segment to “Others”, along with other general and corporate expenses that are
not directly related to the performance of the nickel segment.
R&D expenses were US$ 11 million in 3Q18, higher than the US$ 8 million registered in 2Q18.
These expenses encompass R&D initiatives for further operational improvements, with North
Atlantic, PTVI and VNC corresponding to US$ 5 million, US$ 3 million and US$ 2 million,
respectively, in the quarter.
Pre-operating and stoppage expenses were US$ 8 million in 3Q18, mainly due to care and
maintenance expenses for Stobie and Birchtree in the North Atlantic operations (US$ 5 million)
and expenses associated with the closure of Acton PGM refinery in the U.K. (US$ 2 million).
Selected financial indicators - Nickel operations
US$ million 3Q18 2Q18 3Q17
Net revenues 1,086 1,340 1,168
Costs¹ (804) (810) (883)
Expenses¹ (3) (18) (21)
Pre-operating and stoppage expenses¹ (8) (7) -
R&D expenses (11) (8) (14)
Dividends and interests on associates and JVs - - -
Adjusted EBITDA 260 497 250
Depreciation and amortization (316) (313) (340)
Adjusted EBIT (56) 184 (90)
Adjusted EBIT margin (%) (5.2) 13.7 (7.7)
¹ Net of depreciation and amortization
Copper operations – Salobo and Sossego
Copper operations – unit cash cost of sales, net of by-product credits US$/t 3Q18 2Q18 3Q17
Sossego 2,822 3,212 2,951
Salobo 351 937 792
Copper – EBITDA by operation US$ million 3Q18 2Q18 3Q17
Sossego 52 61 77
Salobo 216 220 260
Total 268 281 337
25 Considers the new allocation criteria for general and administrative expenses as described in the box “Managerial Allocation Changes” of the
1Q18 Earnings Release.
36
Details of copper operations’ adjusted EBITDA by operation are as follows:
• Sossego’s EBITDA was US$ 52 million, decreasing by US$ 9 million vs. 2Q18, mainly
as a result of lower copper realized prices (US$ 24 million) that were partially offset by
positive exchange rate variations (US$ 7 million) and higher volumes (US$ 6 million).
Unit cash costs decreased mainly due to dilution of costs on higher by-product volumes
along with the positive effect of exchange rate variations.
• Salobo’s EBITDA was US$ 216 million, in line with 2Q18. Unit cash costs decreased to
US$ 351/t, reaching close to negative cost levels, mainly due to higher by-product credits,
the impact of higher volumes on fixed cost dilution and the positive effect of exchange
rate variations.
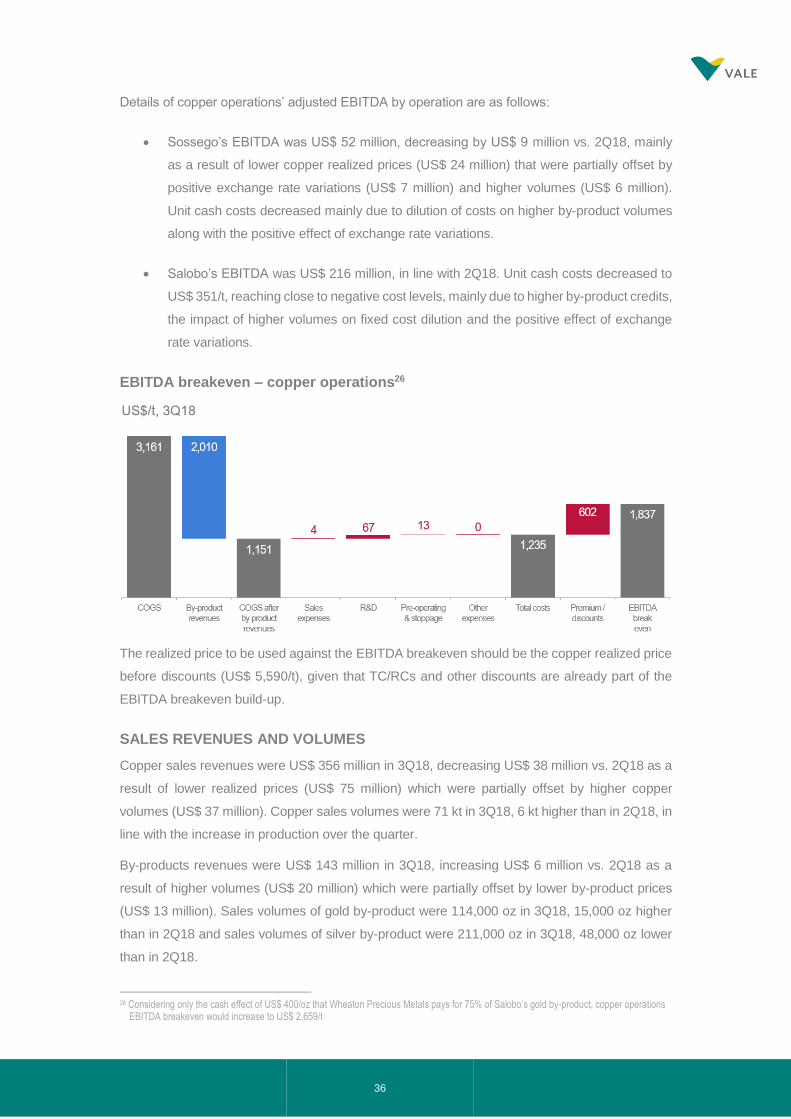
EBITDA breakeven – copper operations26
The realized price to be used against the EBITDA breakeven should be the copper realized price
before discounts (US$ 5,590/t), given that TC/RCs and other discounts are already part of the
EBITDA breakeven build-up.
SALES REVENUES AND VOLUMES
Copper sales revenues were US$ 356 million in 3Q18, decreasing US$ 38 million vs. 2Q18 as a
result of lower realized prices (US$ 75 million) which were partially offset by higher copper
volumes (US$ 37 million). Copper sales volumes were 71 kt in 3Q18, 6 kt higher than in 2Q18, in
line with the increase in production over the quarter.
By-products revenues were US$ 143 million in 3Q18, increasing US$ 6 million vs. 2Q18 as a
result of higher volumes (US$ 20 million) which were partially offset by lower by-product prices
(US$ 13 million). Sales volumes of gold by-product were 114,000 oz in 3Q18, 15,000 oz higher
than in 2Q18 and sales volumes of silver by-product were 211,000 oz in 3Q18, 48,000 oz lower
than in 2Q18.
26 Considering only the cash effect of US$ 400/oz that Wheaton Precious Metals pays for 75% of Salobo’s gold by-product, copper operations
EBITDA breakeven would increase to US$ 2,659/t
37
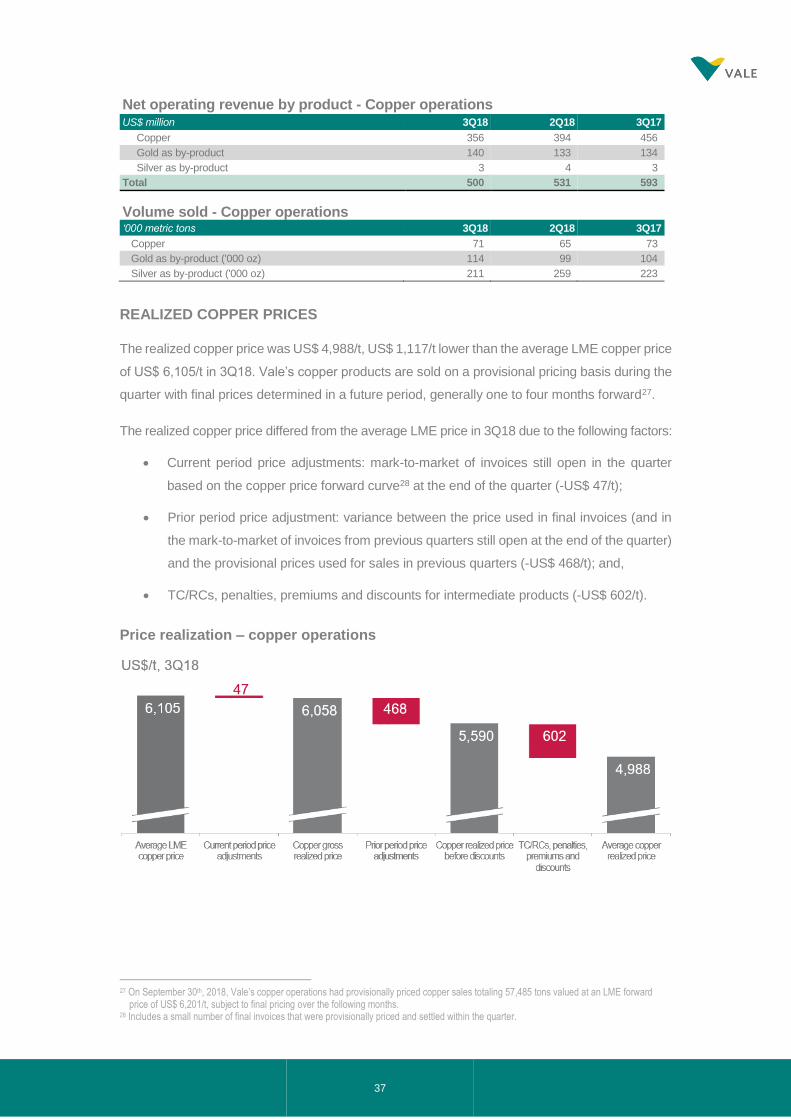
Net operating revenue by product - Copper operations US$ million 3Q18 2Q18 3Q17
Copper 356 394 456
Gold as by-product 140 133 134
Silver as by-product 3 4 3
Total 500 531 593
Volume sold - Copper operations ‘000 metric tons 3Q18 2Q18 3Q17
Copper 71 65 73
Gold as by-product ('000 oz) 114 99 104
Silver as by-product ('000 oz) 211 259 223
REALIZED COPPER PRICES
The realized copper price was US$ 4,988/t, US$ 1,117/t lower than the average LME copper price
of US$ 6,105/t in 3Q18. Vale’s copper products are sold on a provisional pricing basis during the
quarter with final prices determined in a future period, generally one to four months forward27.
The realized copper price differed from the average LME price in 3Q18 due to the following factors:
• Current period price adjustments: mark-to-market of invoices still open in the quarter
based on the copper price forward curve28 at the end of the quarter (-US$ 47/t);
• Prior period price adjustment: variance between the price used in final invoices (and in
the mark-to-market of invoices from previous quarters still open at the end of the quarter)
and the provisional prices used for sales in previous quarters (-US$ 468/t); and,
• TC/RCs, penalties, premiums and discounts for intermediate products (-US$ 602/t).
Price realization – copper operations
27 On September 30th, 2018, Vale’s copper operations had provisionally priced copper sales totaling 57,485 tons valued at an LME forward
price of US$ 6,201/t, subject to final pricing over the following months. 28 Includes a small number of final invoices that were provisionally priced and settled within the quarter.
38
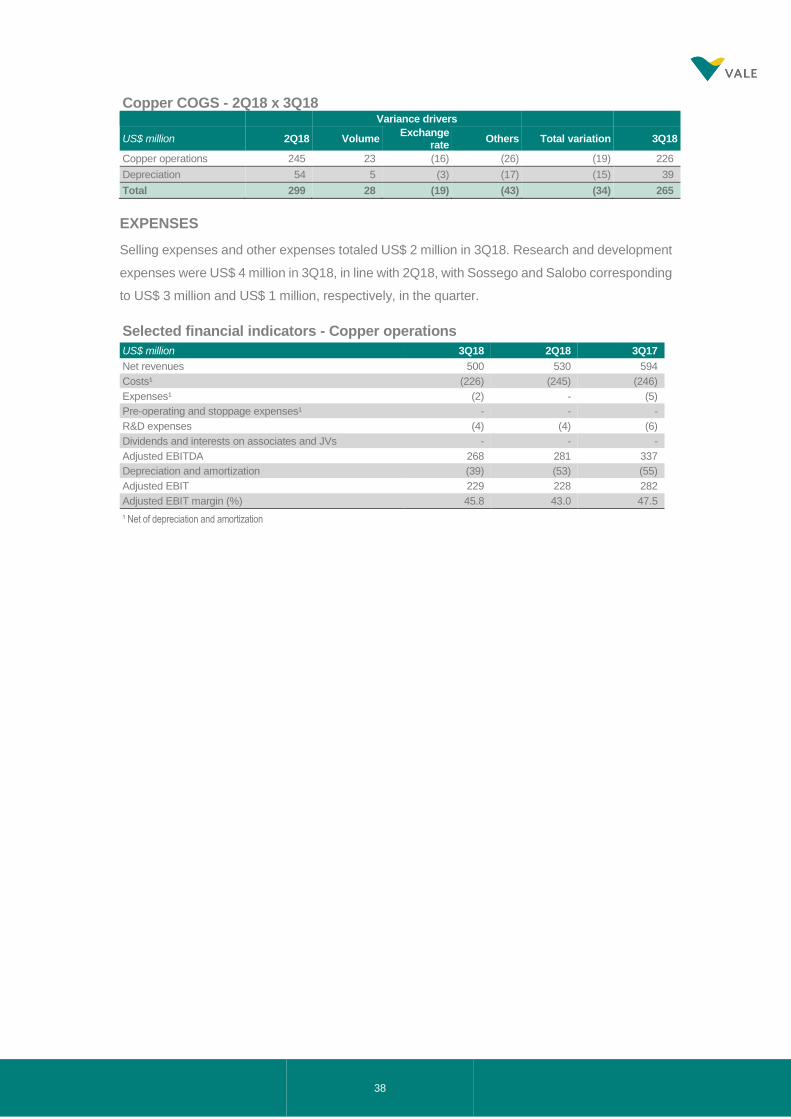
Copper COGS - 2Q18 x 3Q18 Variance drivers
US$ million 2Q18 Volume Exchange
rate Others Total variation 3Q18
Copper operations 245 23 (16) (26) (19) 226
Depreciation 54 5 (3) (17) (15) 39
Total 299 28 (19) (43) (34) 265
EXPENSES
Selling expenses and other expenses totaled US$ 2 million in 3Q18. Research and development
expenses were US$ 4 million in 3Q18, in line with 2Q18, with Sossego and Salobo corresponding
to US$ 3 million and US$ 1 million, respectively, in the quarter.
Selected financial indicators - Copper operations
US$ million 3Q18 2Q18 3Q17
Net revenues 500 530 594
Costs¹ (226) (245) (246)
Expenses¹ (2) - (5)
Pre-operating and stoppage expenses¹ - - -
R&D expenses (4) (4) (6)
Dividends and interests on associates and JVs - - -
Adjusted EBITDA 268 281 337
Depreciation and amortization (39) (53) (55)
Adjusted EBIT 229 228 282
Adjusted EBIT margin (%) 45.8 43.0 47.5
¹ Net of depreciation and amortization
39
Coal
ADJUSTED EBITDA
The adjusted EBITDA of Vale’s Coal business was US$ 16 million in 3Q18, US$ 29 million lower
than in 2Q18, as higher costs associated with the structural changes being implemented in the
business and lower metallurgical coal realized prices more than offset the positive impact of
higher sales volumes and lower expenses.
Volume sold ‘000 metric tons 3Q18 2Q18 3Q17
Metallurgical coal 1,611 1,408 1,869
Thermal coal 1,584 1,101 1,279
Total 3,195 2,508 3,148
REVENUES AND PRICE REALIZATION
Revenues increased US$ 69 million to US$ 425 million in 3Q18 from US$ 356 million in 2Q18,
mainly due to higher sales volumes (US$ 79 million) and higher thermal coal realized prices (US$
5 million), which were partially offset by lower metallurgical coal realized prices (US$ 16 million).
Net operating revenue by product US$ million 3Q18 2Q18 3Q17
Metallurgical coal 284 261 266
Thermal coal 141 95 94
Total 425 356 360
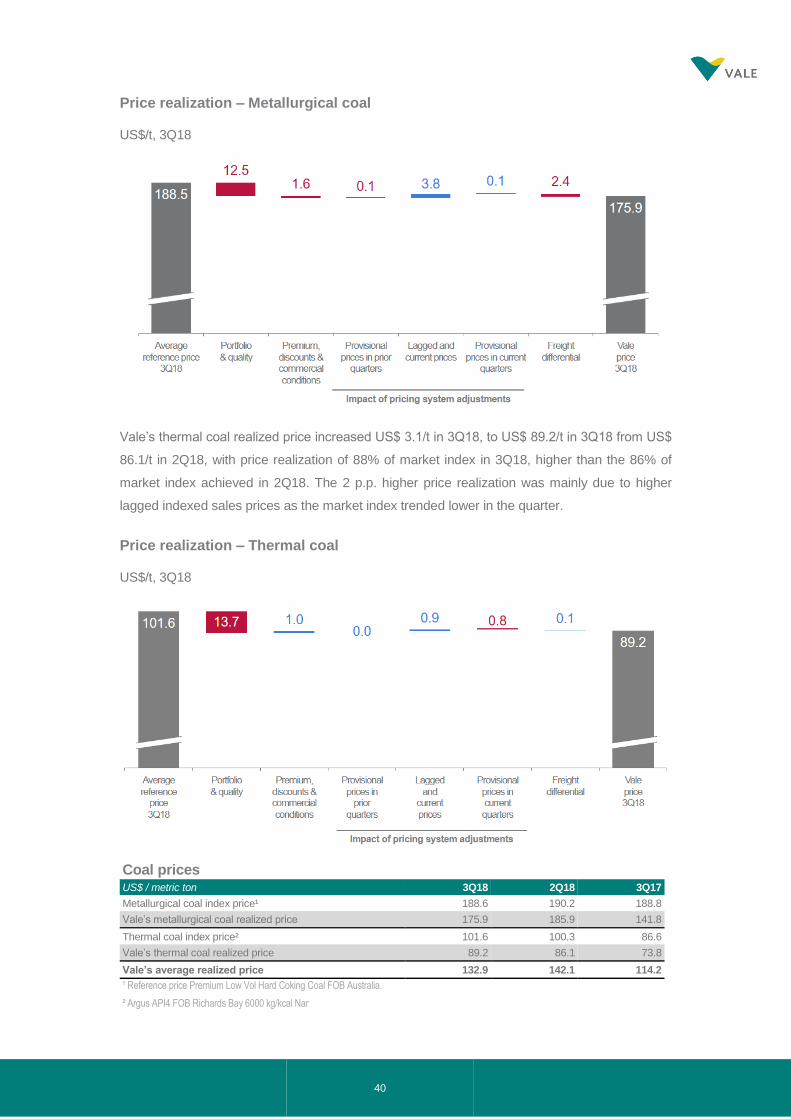
Vale’s metallurgical coal realized price declined 5.3% in 3Q18, to US$ 175.9/t in 3Q18 from US$
185.9/t in 2Q18, with price realization of 93% of market index in 3Q18. Price realization was
mainly affected by: (i) lower allocation in September when market prices were higher, while
lagged index sales were priced based on previous months lower prices, (ii) widening spread
between premium and non-premium indices and (iii) increased freight rates to Asia.
40
Price realization – Metallurgical coal
US$/t, 3Q18
Vale’s thermal coal realized price increased US$ 3.1/t in 3Q18, to US$ 89.2/t in 3Q18 from US$
86.1/t in 2Q18, with price realization of 88% of market index in 3Q18, higher than the 86% of
market index achieved in 2Q18. The 2 p.p. higher price realization was mainly due to higher
lagged indexed sales prices as the market index trended lower in the quarter.
Price realization – Thermal coal
US$/t, 3Q18
Coal prices US$ / metric ton 3Q18 2Q18 3Q17
Metallurgical coal index price¹ 188.6 190.2 188.8
Vale’s metallurgical coal realized price 175.9 185.9 141.8
Thermal coal index price² 101.6 100.3 86.6
Vale’s thermal coal realized price 89.2 86.1 73.8
Vale’s average realized price 132.9 142.1 114.2
¹ Reference price Premium Low Vol Hard Coking Coal FOB Australia. ² Argus API4 FOB Richards Bay 6000 kg/kcal Nar
41
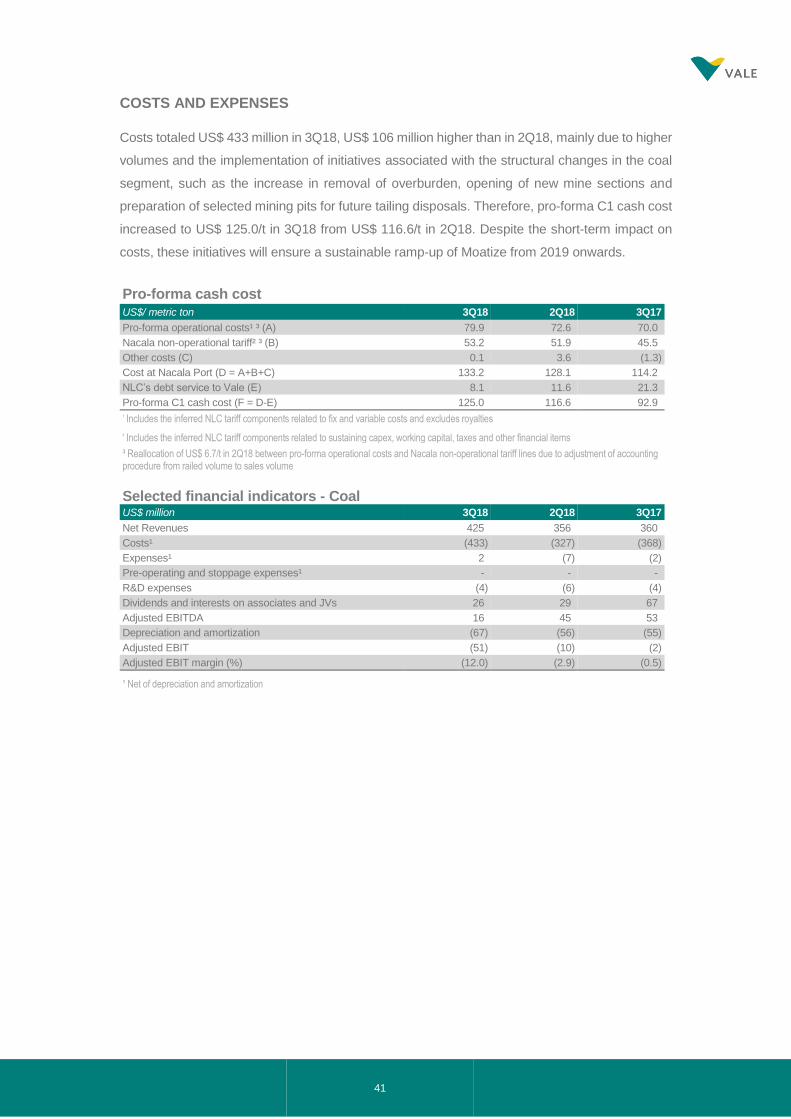
COSTS AND EXPENSES
Costs totaled US$ 433 million in 3Q18, US$ 106 million higher than in 2Q18, mainly due to higher
volumes and the implementation of initiatives associated with the structural changes in the coal
segment, such as the increase in removal of overburden, opening of new mine sections and
preparation of selected mining pits for future tailing disposals. Therefore, pro-forma C1 cash cost
increased to US$ 125.0/t in 3Q18 from US$ 116.6/t in 2Q18. Despite the short-term impact on
costs, these initiatives will ensure a sustainable ramp-up of Moatize from 2019 onwards.
Pro-forma cash cost US$/ metric ton 3Q18 2Q18 3Q17
Pro-forma operational costs¹ ³ (A) 79.9 72.6 70.0
Nacala non-operational tariff² ³ (B) 53.2 51.9 45.5
Other costs (C) 0.1 3.6 (1.3)
Cost at Nacala Port (D = A+B+C) 133.2 128.1 114.2
NLC’s debt service to Vale (E) 8.1 11.6 21.3
Pro-forma C1 cash cost (F = D-E) 125.0 116.6 92.9
¹ Includes the inferred NLC tariff components related to fix and variable costs and excludes royalties
² Includes the inferred NLC tariff components related to sustaining capex, working capital, taxes and other financial items
³ Reallocation of US$ 6.7/t in 2Q18 between pro-forma operational costs and Nacala non-operational tariff lines due to adjustment of accounting procedure from railed volume to sales volume
Selected financial indicators - Coal US$ million 3Q18 2Q18 3Q17
Net Revenues 425 356 360
Costs¹ (433) (327) (368)
Expenses¹ 2 (7) (2)
Pre-operating and stoppage expenses¹ - - -
R&D expenses (4) (6) (4)
Dividends and interests on associates and JVs 26 29 67
Adjusted EBITDA 16 45 53
Depreciation and amortization (67) (56) (55)
Adjusted EBIT (51) (10) (2)
Adjusted EBIT margin (%) (12.0) (2.9) (0.5)
¹ Net of depreciation and amortization
42
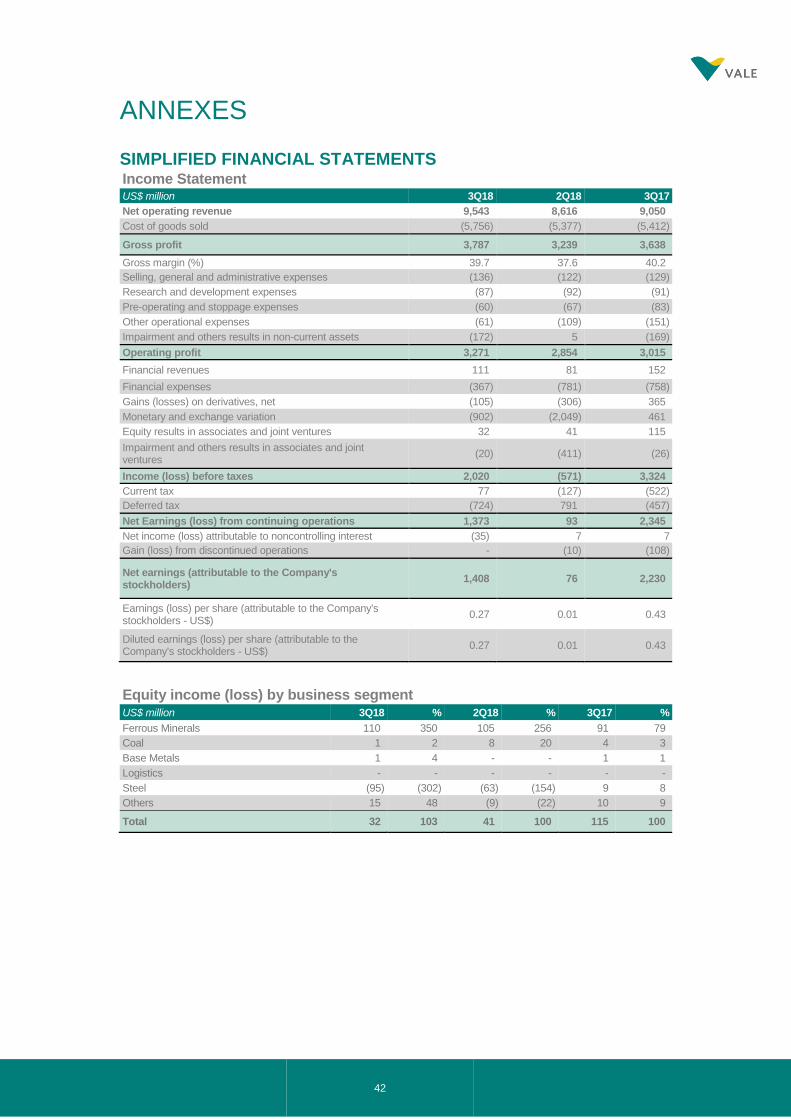
ANNEXES
SIMPLIFIED FINANCIAL STATEMENTS Income Statement US$ million 3Q18 2Q18 3Q17
Net operating revenue 9,543 8,616 9,050
Cost of goods sold (5,756) (5,377) (5,412)
Gross profit 3,787 3,239 3,638
Gross margin (%) 39.7 37.6 40.2
Selling, general and administrative expenses (136) (122) (129)
Research and development expenses (87) (92) (91)
Pre-operating and stoppage expenses (60) (67) (83)
Other operational expenses (61) (109) (151)
Impairment and others results in non-current assets (172) 5 (169)
Operating profit 3,271 2,854 3,015
Financial revenues 111 81 152
Financial expenses (367) (781) (758)
Gains (losses) on derivatives, net (105) (306) 365
Monetary and exchange variation (902) (2,049) 461
Equity results in associates and joint ventures 32 41 115
Impairment and others results in associates and joint ventures
(20) (411) (26)
Income (loss) before taxes 2,020 (571) 3,324
Current tax 77 (127) (522)
Deferred tax (724) 791 (457)
Net Earnings (loss) from continuing operations 1,373 93 2,345
Net income (loss) attributable to noncontrolling interest (35) 7 7
Gain (loss) from discontinued operations - (10) (108)
Net earnings (attributable to the Company's stockholders)
1,408 76 2,230
Earnings (loss) per share (attributable to the Company's stockholders - US$)
0.27 0.01 0.43
Diluted earnings (loss) per share (attributable to the Company's stockholders - US$)
0.27 0.01 0.43
Equity income (loss) by business segment US$ million 3Q18 % 2Q18 % 3Q17 %
Ferrous Minerals 110 350 105 256 91 79
Coal 1 2 8 20 4 3
Base Metals 1 4 - - 1 1
Logistics - - - - - -
Steel (95) (302) (63) (154) 9 8
Others 15 48 (9) (22) 10 9
Total 32 103 41 100 115 100
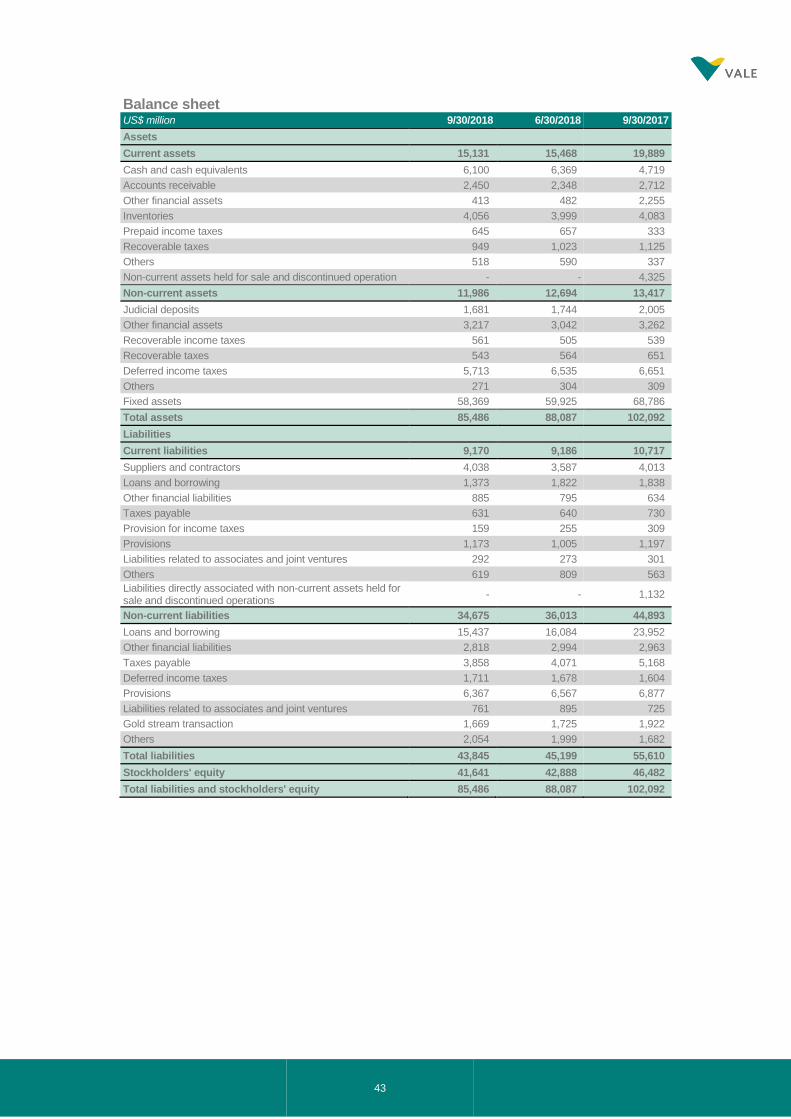
43
Balance sheet US$ million 9/30/2018 6/30/2018 9/30/2017
Assets
Current assets 15,131 15,468 19,889
Cash and cash equivalents 6,100 6,369 4,719
Accounts receivable 2,450 2,348 2,712
Other financial assets 413 482 2,255
Inventories 4,056 3,999 4,083
Prepaid income taxes 645 657 333
Recoverable taxes 949 1,023 1,125
Others 518 590 337
Non-current assets held for sale and discontinued operation - - 4,325
Non-current assets 11,986 12,694 13,417
Judicial deposits 1,681 1,744 2,005
Other financial assets 3,217 3,042 3,262
Recoverable income taxes 561 505 539
Recoverable taxes 543 564 651
Deferred income taxes 5,713 6,535 6,651
Others 271 304 309
Fixed assets 58,369 59,925 68,786
Total assets 85,486 88,087 102,092
Liabilities
Current liabilities 9,170 9,186 10,717
Suppliers and contractors 4,038 3,587 4,013
Loans and borrowing 1,373 1,822 1,838
Other financial liabilities 885 795 634
Taxes payable 631 640 730
Provision for income taxes 159 255 309
Provisions 1,173 1,005 1,197
Liabilities related to associates and joint ventures 292 273 301
Others 619 809 563
Liabilities directly associated with non-current assets held for sale and discontinued operations
- - 1,132
Non-current liabilities 34,675 36,013 44,893
Loans and borrowing 15,437 16,084 23,952
Other financial liabilities 2,818 2,994 2,963
Taxes payable 3,858 4,071 5,168
Deferred income taxes 1,711 1,678 1,604
Provisions 6,367 6,567 6,877
Liabilities related to associates and joint ventures 761 895 725
Gold stream transaction 1,669 1,725 1,922
Others 2,054 1,999 1,682
Total liabilities 43,845 45,199 55,610
Stockholders' equity 41,641 42,888 46,482
Total liabilities and stockholders' equity 85,486 88,087 102,092
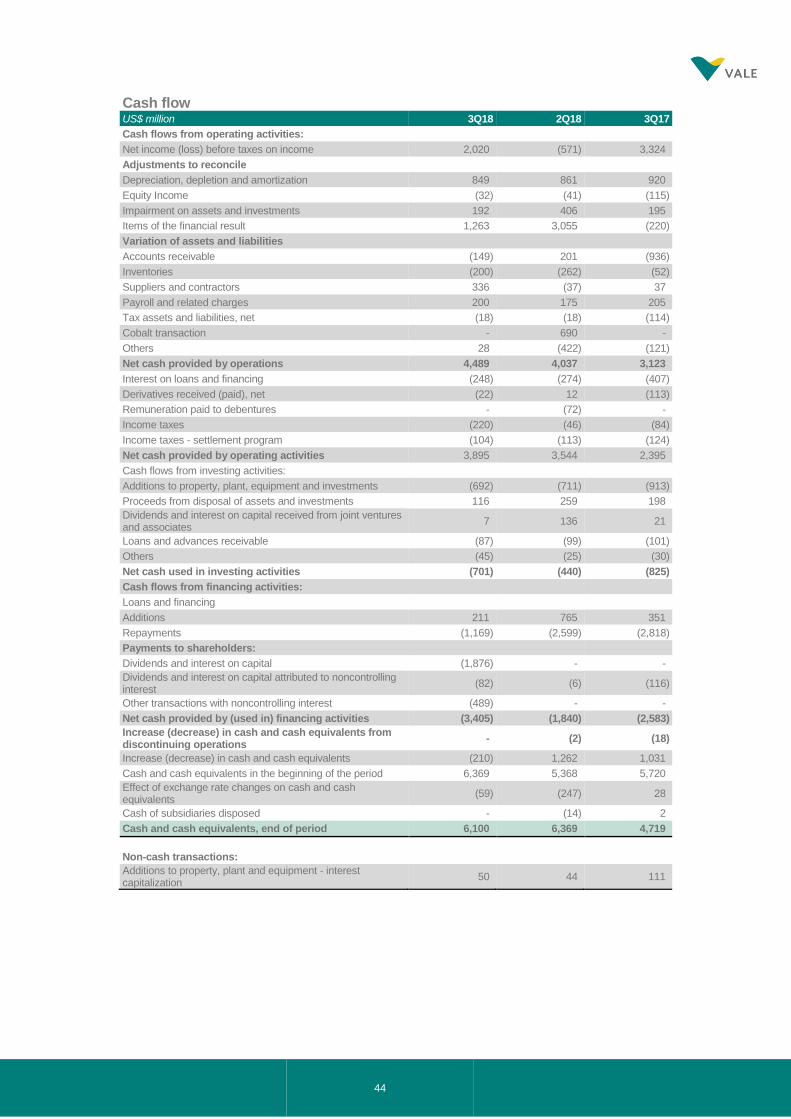
44
Cash flow US$ million 3Q18 2Q18 3Q17
Cash flows from operating activities:
Net income (loss) before taxes on income 2,020 (571) 3,324
Adjustments to reconcile
Depreciation, depletion and amortization 849 861 920
Equity Income (32) (41) (115)
Impairment on assets and investments 192 406 195
Items of the financial result 1,263 3,055 (220)
Variation of assets and liabilities
Accounts receivable (149) 201 (936)
Inventories (200) (262) (52)
Suppliers and contractors 336 (37) 37
Payroll and related charges 200 175 205
Tax assets and liabilities, net (18) (18) (114)
Cobalt transaction - 690 -
Others 28 (422) (121)
Net cash provided by operations 4,489 4,037 3,123
Interest on loans and financing (248) (274) (407)
Derivatives received (paid), net (22) 12 (113)
Remuneration paid to debentures - (72) -
Income taxes (220) (46) (84)
Income taxes - settlement program (104) (113) (124)
Net cash provided by operating activities 3,895 3,544 2,395
Cash flows from investing activities:
Additions to property, plant, equipment and investments (692) (711) (913)
Proceeds from disposal of assets and investments 116 259 198
Dividends and interest on capital received from joint ventures and associates
7 136 21
Loans and advances receivable (87) (99) (101)
Others (45) (25) (30)
Net cash used in investing activities (701) (440) (825)
Cash flows from financing activities:
Loans and financing
Additions 211 765 351
Repayments (1,169) (2,599) (2,818)
Payments to shareholders:
Dividends and interest on capital (1,876) - -
Dividends and interest on capital attributed to noncontrolling interest
(82) (6) (116)
Other transactions with noncontrolling interest (489) - -
Net cash provided by (used in) financing activities (3,405) (1,840) (2,583)
Increase (decrease) in cash and cash equivalents from discontinuing operations
- (2) (18)
Increase (decrease) in cash and cash equivalents (210) 1,262 1,031
Cash and cash equivalents in the beginning of the period 6,369 5,368 5,720
Effect of exchange rate changes on cash and cash equivalents
(59) (247) 28
Cash of subsidiaries disposed - (14) 2
Cash and cash equivalents, end of period 6,100 6,369 4,719
Non-cash transactions:
Additions to property, plant and equipment - interest capitalization
50 44 111
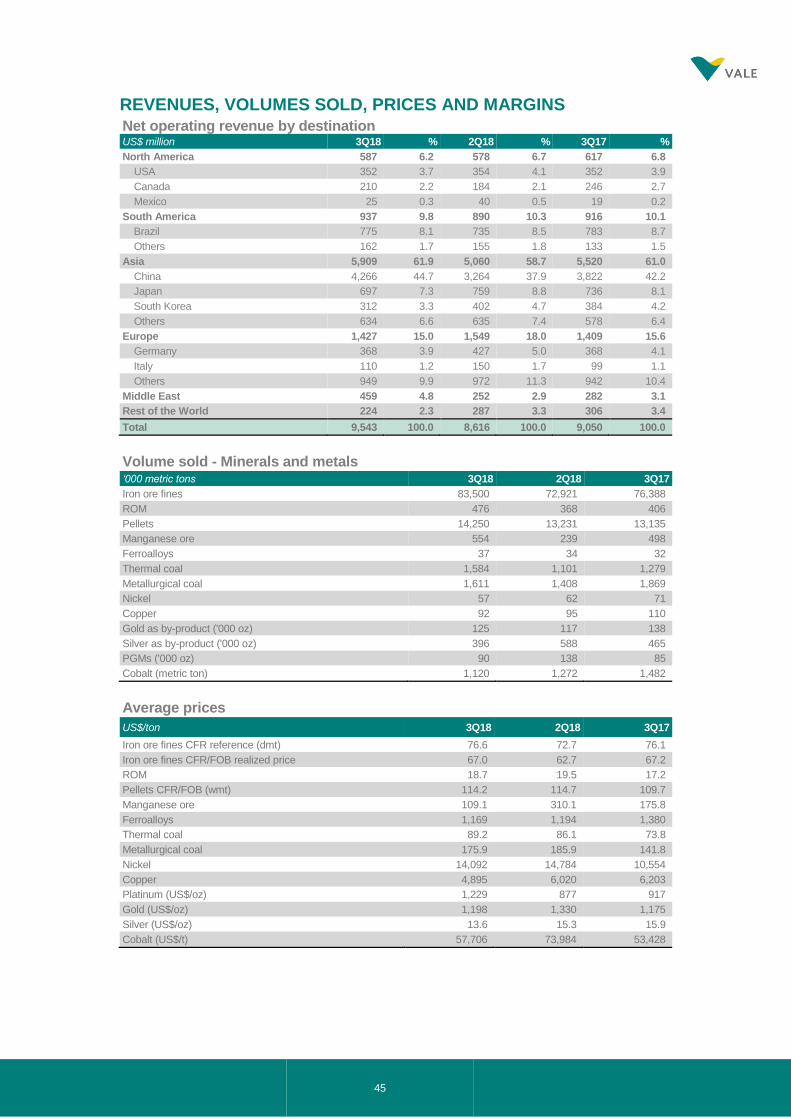
45
REVENUES, VOLUMES SOLD, PRICES AND MARGINS
Net operating revenue by destination US$ million 3Q18 % 2Q18 % 3Q17 %
North America 587 6.2 578 6.7 617 6.8
USA 352 3.7 354 4.1 352 3.9
Canada 210 2.2 184 2.1 246 2.7
Mexico 25 0.3 40 0.5 19 0.2
South America 937 9.8 890 10.3 916 10.1
Brazil 775 8.1 735 8.5 783 8.7
Others 162 1.7 155 1.8 133 1.5
Asia 5,909 61.9 5,060 58.7 5,520 61.0
China 4,266 44.7 3,264 37.9 3,822 42.2
Japan 697 7.3 759 8.8 736 8.1
South Korea 312 3.3 402 4.7 384 4.2
Others 634 6.6 635 7.4 578 6.4
Europe 1,427 15.0 1,549 18.0 1,409 15.6
Germany 368 3.9 427 5.0 368 4.1
Italy 110 1.2 150 1.7 99 1.1
Others 949 9.9 972 11.3 942 10.4
Middle East 459 4.8 252 2.9 282 3.1
Rest of the World 224 2.3 287 3.3 306 3.4
Total 9,543 100.0 8,616 100.0 9,050 100.0
Volume sold - Minerals and metals ‘000 metric tons 3Q18 2Q18 3Q17
Iron ore fines 83,500 72,921 76,388
ROM 476 368 406
Pellets 14,250 13,231 13,135
Manganese ore 554 239 498
Ferroalloys 37 34 32
Thermal coal 1,584 1,101 1,279
Metallurgical coal 1,611 1,408 1,869
Nickel 57 62 71
Copper 92 95 110
Gold as by-product ('000 oz) 125 117 138
Silver as by-product ('000 oz) 396 588 465
PGMs ('000 oz) 90 138 85
Cobalt (metric ton) 1,120 1,272 1,482
Average prices
US$/ton 3Q18 2Q18 3Q17
Iron ore fines CFR reference (dmt) 76.6 72.7 76.1
Iron ore fines CFR/FOB realized price 67.0 62.7 67.2
ROM 18.7 19.5 17.2
Pellets CFR/FOB (wmt) 114.2 114.7 109.7
Manganese ore 109.1 310.1 175.8
Ferroalloys 1,169 1,194 1,380
Thermal coal 89.2 86.1 73.8
Metallurgical coal 175.9 185.9 141.8
Nickel 14,092 14,784 10,554
Copper 4,895 6,020 6,203
Platinum (US$/oz) 1,229 877 917
Gold (US$/oz) 1,198 1,330 1,175
Silver (US$/oz) 13.6 15.3 15.9
Cobalt (US$/t) 57,706 73,984 53,428
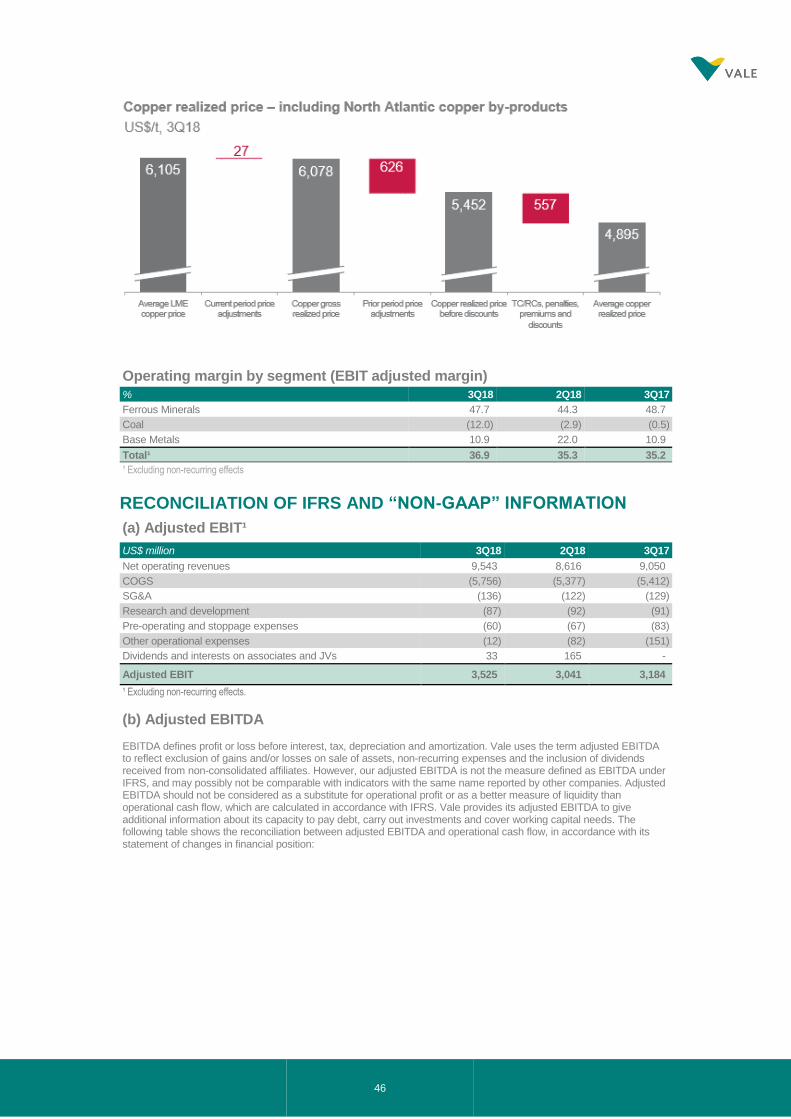
46
Operating margin by segment (EBIT adjusted margin)
% 3Q18 2Q18 3Q17
Ferrous Minerals 47.7 44.3 48.7
Coal (12.0) (2.9) (0.5)
Base Metals 10.9 22.0 10.9
Total¹ 36.9 35.3 35.2
¹ Excluding non-recurring effects
RECONCILIATION OF IFRS AND “NON-GAAP” INFORMATION
(a) Adjusted EBIT¹
US$ million 3Q18 2Q18 3Q17
Net operating revenues 9,543 8,616 9,050
COGS (5,756) (5,377) (5,412)
SG&A (136) (122) (129)
Research and development (87) (92) (91)
Pre-operating and stoppage expenses (60) (67) (83)
Other operational expenses (12) (82) (151)
Dividends and interests on associates and JVs 33 165 -
Adjusted EBIT 3,525 3,041 3,184
¹ Excluding non-recurring effects.
(b) Adjusted EBITDA
EBITDA defines profit or loss before interest, tax, depreciation and amortization. Vale uses the term adjusted EBITDA to reflect exclusion of gains and/or losses on sale of assets, non-recurring expenses and the inclusion of dividends received from non-consolidated affiliates. However, our adjusted EBITDA is not the measure defined as EBITDA under IFRS, and may possibly not be comparable with indicators with the same name reported by other companies. Adjusted EBITDA should not be considered as a substitute for operational profit or as a better measure of liquidity than operational cash flow, which are calculated in accordance with IFRS. Vale provides its adjusted EBITDA to give additional information about its capacity to pay debt, carry out investments and cover working capital needs. The following table shows the reconciliation between adjusted EBITDA and operational cash flow, in accordance with its statement of changes in financial position:
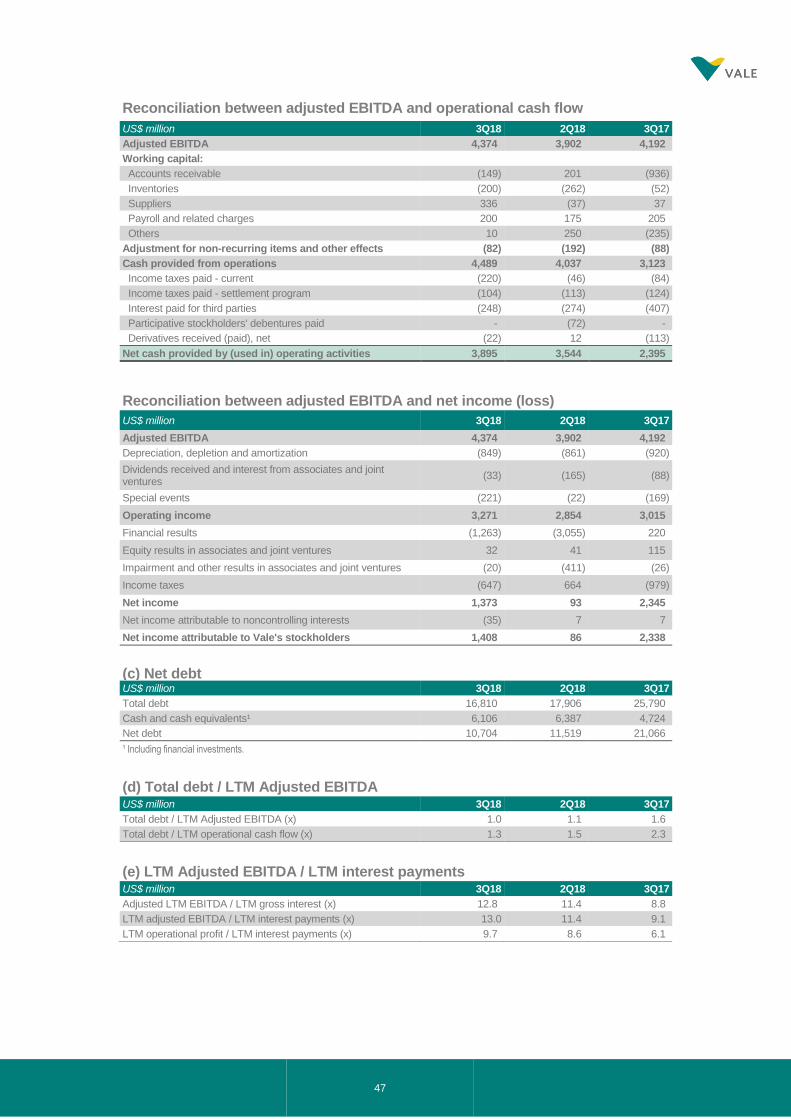
47
Reconciliation between adjusted EBITDA and operational cash flow
US$ million 3Q18 2Q18 3Q17
Adjusted EBITDA 4,374 3,902 4,192
Working capital:
Accounts receivable (149) 201 (936)
Inventories (200) (262) (52)
Suppliers 336 (37) 37
Payroll and related charges 200 175 205
Others 10 250 (235)
Adjustment for non-recurring items and other effects (82) (192) (88)
Cash provided from operations 4,489 4,037 3,123
Income taxes paid - current (220) (46) (84)
Income taxes paid - settlement program (104) (113) (124)
Interest paid for third parties (248) (274) (407)
Participative stockholders' debentures paid - (72) -
Derivatives received (paid), net (22) 12 (113)
Net cash provided by (used in) operating activities 3,895 3,544 2,395
Reconciliation between adjusted EBITDA and net income (loss)
US$ million 3Q18 2Q18 3Q17
Adjusted EBITDA 4,374 3,902 4,192
Depreciation, depletion and amortization (849) (861) (920)
Dividends received and interest from associates and joint ventures
(33) (165) (88)
Special events (221) (22) (169)
Operating income 3,271 2,854 3,015
Financial results (1,263) (3,055) 220
Equity results in associates and joint ventures 32 41 115
Impairment and other results in associates and joint ventures (20) (411) (26)
Income taxes (647) 664 (979)
Net income 1,373 93 2,345
Net income attributable to noncontrolling interests (35) 7 7
Net income attributable to Vale's stockholders 1,408 86 2,338
(c) Net debt US$ million 3Q18 2Q18 3Q17
Total debt 16,810 17,906 25,790
Cash and cash equivalents¹ 6,106 6,387 4,724
Net debt 10,704 11,519 21,066
¹ Including financial investments.
(d) Total debt / LTM Adjusted EBITDA
US$ million 3Q18 2Q18 3Q17
Total debt / LTM Adjusted EBITDA (x) 1.0 1.1 1.6
Total debt / LTM operational cash flow (x) 1.3 1.5 2.3
(e) LTM Adjusted EBITDA / LTM interest payments US$ million 3Q18 2Q18 3Q17
Adjusted LTM EBITDA / LTM gross interest (x) 12.8 11.4 8.8
LTM adjusted EBITDA / LTM interest payments (x) 13.0 11.4 9.1
LTM operational profit / LTM interest payments (x) 9.7 8.6 6.1