willingness to pay for locally grown, organic and …
TRANSCRIPT

WILLINGNESS TO PAY FOR LOCALLY GROWN, ORGANIC
AND NATURAL FOODS: IMPLICATIONS FOR PRODUCERS
AND STATE-SPONSORED AGRICULTURAL MARKETING
PROGRAMS
by
Kathryn A. Onken
A thesis submitted to the Faculty of the University of Delaware in partial
fulfillment of the requirements for the degree of Master of Science in Agricultural and
Resource Economics
Fall 2010
Copyright 2010 Kathryn A. Onken
All Rights Reserved

WILLINGNESS TO PAY FOR LOCALLY GROWN, ORGANIC
AND NATURAL FOODS: IMPLICATIONS FOR PRODUCERS
AND STATE-SPONSORED AGRICULTURAL MARKETING
PROGRAMS
by
Kathryn A. Onken
Approved: __________________________________________________________
John C. Bernard, Ph.D.
Professor in charge of thesis on behalf of the Advisory Committee
Approved: __________________________________________________________
John D. Pesek, Ph.D.
Professor in charge of thesis on behalf of the Advisory Committee
Approved: __________________________________________________________
Thomas W. Ilvento, Ph.D.
Chair of the Department of Food and Resource Economics
Approved: __________________________________________________________
Robin W. Morgan, Ph.D.
Dean of the College of Agriculture and Natural Resources
Approved: __________________________________________________________
Charles G. Riordan, Ph.D.
Vice Provost for Graduate and Professional Education

iii
ACKNOWLEDGMENTS
Thank you first and foremost to my family, who have encouraged my
educational pursuits every step of the way. I am especially grateful to my mother,
Claudia, and my aunt, Margaret, who helped with the survey mailing. Thank you also
to my fiancé, Andy, for your unfailing support throughout.
Much gratitude is extended to my co-advisors, Dr. John Bernard and Dr.
John Pesek. Dr. Bernard, thank you for all of your guidance and direction during this
process. You have helped give me the tools and confidence I needed to pursue a
career in this field. Dr. Pesek, thank you for all of your technical assistance, and for
helping answer many a statistical question. You both have been great mentors, and I
leave a better student because of it.
Thank you also to Dr. Titus Awokuse, for serving on the thesis committee
and for providing helpful advice throughout the program. Finally, I would like to
thank Dr. Thomas Ilvento for all of the departmental support that enabled this thesis.

iv
TABLE OF CONTENTS
LIST OF TABLES ....................................................................................................... vii
LIST OF FIGURES ....................................................................................................... ix
ABSTRACT ................................................................................................................... x
CHAPTER:
1 INTRODUCTION .................................................................................... 1
1.1 Recent Trends in the Food Sector .................................................. 1
1.2 Objectives ....................................................................................... 5
1.3 Organization of Thesis ................................................................... 6
2 BACKGROUND ...................................................................................... 7
2.1 Organic and Natural Background ................................................... 7
2.2 Locally Grown Background ........................................................... 8
2.3 Mid-Atlantic State Marketing Programs ........................................ 8
3 LITERATURE REVIEW ....................................................................... 14
3.1 Introduction .................................................................................. 14
3.2 The Trend Towards Locally Grown ............................................. 14
3.2.1 Consumer Interest in Local ............................................ 14
3.2.2 Defining Locally Grown ................................................. 18
3.3 State Marketing Programs ............................................................ 19
3.4 Consumer Preferences and WTP for Organic .............................. 20
3.5 Summary ...................................................................................... 22
4 SURVEY DESIGN ................................................................................ 23
4.1 Survey Choice Experiment .......................................................... 23
4.2 Other Survey Components ........................................................... 26
4.3 Survey Piloting ............................................................................. 26
4.4 Survey Sample and Mailing ......................................................... 27
4.5 Sample Population ....................................................................... 28

v
5 METHODS ............................................................................................ 33
5.1 The CLM Model .......................................................................... 33
5.2 CLM Model, Strawberry Preserves ............................................. 34
5.3 The Nested Logit Model .............................................................. 36
5.4 Nested Logit Model, Strawberry Preserves ................................. 38
5.5 Hypotheses ................................................................................... 38
6 RESULTS .............................................................................................. 41
6.1 CLM and Nested Logit Results, Strawberry Preserves ............... 41
6.2 Determining mWTP ..................................................................... 51
6.3 mWTP Estimates, Grocery Store vs. Farmers' Market ................ 53
6.4 mWTP Estimates, Organic vs. Natural ........................................ 54
6.5 mWTP Estimates, Local, Non-Local, and State Program
Promoted ....................................................................................... 57
6.6 Other Survey Question Results ..................................................... 61
6.6.1 Purchasing Frequency of Food Products ......................... 61
6.6.2 State Marketing Program Awareness and Opinion
Rating .............................................................................. 66
6.6.3 Comparing State Program, Organic, and Local Foods .... 70
6.6.4 Defining Local ................................................................. 74
6.6.5 Health and Diet ................................................................ 80
7 DISCUSSION AND CONCLUSIONS ................................................. 82
7.1 Conclusions and Implications ...................................................... 82
7.2 Limitations ................................................................................... 85
7.3 Suggestions for Future Research ................................................. 86
REFERENCES ................................................................................................................ 88
APPENDIX:
I SURVEY COVER LETTER .......................................................................................... 95
II SURVEY QUESTIONS AND INFORMATION SHEET ............................................. 96
III SURVEY COMMENTS .............................................................................................. 109
IV SAS CODE USED TO GENERATE CHOICE EXPERIMENT ................................. 129
V SAS CODE USED IN CLM ANALYSIS .................................................................... 132

vi
LIST OF TABLES
Table 4.1 Choice Experiment Attributes .................................................................. 24
Table 4.2 Response Rates by State ........................................................................... 28
Table 4.3 Demographics of Respondents in the Survey Sample .............................. 29
Table 4.4 2000 Census, Source: U.S. Census Bureau .............................................. 31
Table 5.1 Variables Names and Descriptions, CLM Model .................................... 36
Table 6.1 CLM Results, Strawberry Preserves ........................................................ 42
Table 6.2 Nested Logit Results, Strawberry Preserves (RU2) ................................. 43
Table 6.3 Marginal WTP by State and Price Level .................................................. 56
Table 6.4 Primary Purchaser of Food Products, by State ......................................... 61
Table 6.5 Purchasing Frequency of Food Products by Venue ................................. 62
Table 6.6 Purchasing Frequency of Food Products in an Average Month ............... 65
Table 6.7 Percentage Not Aware of State Marketing Programs, by State................ 68
Table 6.8 Opinion Rating of State Marketing Programs .......................................... 69
Table 6.9 “Compared with State Program Foods, Organic Foods are...” ................. 72
Table 6.10 “Compared with Organic Foods, Local Foods are…” ............................. 73
Table 6.11 “For you to consider a food product to be „local‟, what percentage
of that product needs to be produced and/or grown locally?” ................. 75
Table 6.12 “I consider a food product to be local if it is ____miles away.” ............. 75

vii
Table 6.13 “I consider a food product produced and/or grown within this area
to be „local‟…..” ..................................................................................... 78
Table 6.14 “How healthy do you consider your diet?” .............................................. 80
Table 6.15 “How healthy do you consider your diet?” (Breakdown of
responses) ................................................................................................ 81

viii
LIST OF FIGURES
Figure 4.1 Sample Choice Set ........................................................................ 25
Figures 6.1a-6.1e Probability of Choice by Price; Natural and Farmers‟ Market
Attributes (by State) ...................................................................... 47
Figures 6.2a-6.2e Probability of Choice by Price; Natural and Grocery Store
Attributes (by State) ...................................................................... 48
Figures 6.3a-6.3e Probability of Choice by Price; Organic and Farmers‟
Market Attributes (by State) ........................................................... 49
Figures 6.4a-6.4e Probability of Choice by Price; Organic and Grocery Store
Attributes (by State) ....................................................................... 50

ix
ABSTRACT
A survey of Mid-Atlantic consumers in five states was conducted to
determine consumer preference and marginal willingness to pay for the attributes
organic, natural, locally grown and state program promoted. The influence of
purchasing venue on willingness to pay was examined as well. A key part of this
survey was a choice experiment featuring strawberry preserves. The survey also
included a variety of questions concerning shopping behavior, awareness and opinion
of state marketing programs, and the geographical area that the respondent considered
to be local.
The results of the choice experiment portion of the survey were analyzed
using a conditional logit model and a nested logit model. Marginal willingness to pay
figures were calculated from the results of the nested logit model. These results
indicated a price premium for preserves purchased at a farmers‟ market across five
Mid-Atlantic states. The organic attribute was only preferred over natural in one state.
In addition, the attributes local and state program promoted were preferred over non-
local across all states. The preference ordering between local and state program did
vary. Consumers in Maryland and Pennsylvania clearly preferred local, while those in
New Jersey seemed to prefer the state program version.
Overall, findings from this study suggest programs in several states should
consider focusing on more generic “buy local” promotions, instead of statewide
promotional programs. Additional results indicate that consumers from states other
than Delaware consider areas smaller than the borders of their state as being local,
such as a county or regional area. The results of this study would be of use to state
marketing agencies, producers and processors targeting the Mid-Atlantic region.

1
Chapter 1
INTRODUCTION
1.1 Recent Trends in the Food Sector
Increases in the organic and natural food sectors, as well as an increased
interest in locally grown and state marketing program promoted foods, are four current
trends in the U.S. food system. The organic food sector is the largest growing and
most promoted of these. Since 2002, the USDA‟s National Organic Program (NOP)
has been certifying organic products, providing labels and standardization. Evidence
of organic growth is evident in the amount of farmland set aside for certified organic
production, which doubled from 2002 to 2005, and in 2008 alone grew 15% (USDA,
ERS, 2010). From 1990 to 2009, sales of organic food products grew $23.8 billion,
growing an average of 5.1% in 2009 (Organic Trade Association, 2010). In addition,
organic food sales more than doubled from 2004 to 2008, growing 132% (The Nielsen
Company, 2009).
Unlike organic products, products designated as natural are not subject to
a certification process and bear no standardized label. The USDA does have a formal
definition for the term though, which includes no artificial ingredients, no added color
and minimal processing. According to research conducted by The Nielsen Company
(2009) food products designated as natural experienced a 37% increase in sales from
2004 to 2008. They also reported 55,000 food products currently feature labeling
identifying them as „natural‟. While products bearing the term natural may lack the

2
standardized label present on their organic counterparts, they certainly are not lacking
in growth.
Additionally, from 1994 to 2009, the United States witnessed a 201%
increase in the number of operating farmers markets, which mostly sell products that
are locally grown and/or locally made (USDA, AMS, 2009). Sales of locally grown
foods are projected to reach $7 billion by 2011 (Packaged Facts, 2007). Unlike
products designated as organic or natural, there is no set USDA definition for locally
grown. The term‟s definition is still undefined, often with a different meaning for
each person. One‟s definition for locally grown may be interpreted as a small area,
such as a city and its surroundings, or the borders of their state of residence and/or
region. In addition, products designated as locally grown are somewhat similar to
those labeled as natural in that there is also no formal certification process.
As interest in locally grown foods continues to rise, state-sponsored
marketing campaigns have responded by increasing in number. Not surprisingly,
many states are attempting to take advantage of this increased interest in locally grown
by marketing products from within their own borders. Every state now has in place
some type of marketing campaign, which includes logos, slogans and a variety of
promotional activities (Onken and Bernard, 2010). Some initial evidence shows such
programs have been successful at increasing the sales of local products.
Well established programs such as Jersey Fresh have been shown to
increase state agricultural sales (Govindasamy et al., 2004) as have some newer
programs established after 2000, such as South Carolina‟s SC Grown (Carpio and
Isengildina-Massa, 2009). However state marketing programs vary drastically by state

3
in terms of product eligibility, certification, and the minimum percentage of product
ingredients that must come from within that state.
There has also been some evidence that consumers show little preference
difference between products identified as locally grown and those identified as grown
in-state. A study conducted in Ohio showed consumers showing little preference
difference for fresh strawberries identified as grown “in-state” and those identified as
grown “nearby” (Darby et al., 2008). However the authors also note that while
consumers in larger states like Ohio may see state boundaries as natural demarcations
for “local”, individuals from smaller states may not. This brings up an interesting
question for regions such as the Mid-Atlantic, where large states such as Pennsylvania
border much smaller states such as Delaware. Will Pennsylvanians consider Delaware
products to be „local‟? More likely Delawareans will consider Pennsylvania products
to be „local‟, due to Delaware‟s small size and its geographic location to Philadelphia,
one of Pennsylvania‟s major cities. However such questions, particularly across
states, are in need of further research. The geographical extent of „local‟ in the minds
of consumers in regions such as the Mid-Atlantic still needs to be determined.
Understanding these growing trends of organic, natural, locally grown,
and state marketing program promoted, as well as how they interact are all areas in
need of further exploration. As the trend towards locally grown continues to rise,
many state agencies instead might turn towards more generic local promotions, such
as the current national Buy Local, Buy Fresh program sponsored by FoodRoutes
(FoodRoutes Network, 2009). For state marketing programs, current evidence of their
effectiveness, and continued justification for their existence and funding will be
needed.

4
Comprehending consumer attitudes towards and preferences between
these four trends, as well as determining marginal willingness to pay (mWTP) would
be of importance to producers, marketers and state marketing agencies. It would also
be important to determine how these preferences and mWTP might differ across states
in the same region. While all four trends vary greatly in terms of certification and
formal definition, they are all currently present in the food industry and gaining in
popularity.
Producers could use this information to help strategically plan what areas
of the food industry they need to be producing product(s) for, and whether or not the
attributes of their particular product(s) are meeting the needs of consumers in the Mid-
Atlantic region. This information could also be extended towards consumers in the
New England region, which likewise is a region with states of varying size. Marketers
in the food industry could gain useful information that would effectively help them
better reach and promote to their targeted audience. Knowing whether or not to
market a product at a grocery store versus a farmers‟ market would be especially
helpful information. It would be useful then to determine whether preference and
mWTP for these attributes vary by purchasing venue. It would also be helpful to both
producers and marketers to identify expectations consumers have for the attributes of
locally grown and organic foods.
Lastly, state marketing agencies perhaps have the most to gain. The
results of such research could help them determine whether or not their programs are
effective in terms of consumer preference and/or awareness. It would be useful to
determine the effect the length of a state marketing campaign has on consumer
awareness, especially in a region such as the Mid-Atlantic, where programs vary
5
greatly in length of establishment. It may also be useful in helping state agencies in
determining whether or not their state marketing program should be continued, and if
so, how they could better promote their program as to better meet the preferences of
consumers in not just their particular state, but adjacent states as well.
1.2 Objectives
The primary and secondary goals of this research then are to determine:
1. consumer preference and mWTP for the attributes of locally
grown, organic, natural, and promoted by a state marketing
campaign,
2. how these preferences and mWTP may be different across states
in the same region, and also depending on whether these
products were to be purchased at a grocery store or a farmers‟
market,
3. the expectations consumers have for the attributes of locally
grown and organic foods,
4. the geographical extent of „local‟ in the minds of consumers,
and
5. the effect of the length of the state marketing campaigns on
consumer awareness.
To accomplish these goals a large scale mail survey was targeted at
consumers from five states in the Mid-Atlantic region: Delaware, Maryland, Virginia,
New Jersey, and Pennsylvania. The key part of this survey was a choice-based
conjoint analysis, or choice experiment (CE), containing a value-added product,
strawberry preserves. CEs have become prominent in marketing studies, especially
those examining consumer demand and WTP, such as Lusk and Hudson (2004) and
6
Carlsson, Frykblom, and Lagerkvist (2007). Mailing lists of 1,000 from each state
were purchased for a total potential sample of 5,000. To maximize the response rate,
the guidelines of Salant and Dillman (1994) were followed, yielding a response rate of
39.6% at the close of the survey.
1.3 Organization of Thesis
Immediately following this introduction, Chapter 2 provides background
information concerning the attributes natural, organic, and local. This chapter also
discusses the state marketing programs of each state included in the survey. Chapter 3
next provides the critical literature review discussion, exposing areas in need of further
exploration in which this study hopes to fill. Chapter 4 discusses the design of the
survey, including the experimental design of the CE, and the mailing process. Also
explored are the demographics of the respondents in the survey sample. Next Chapter
5 covers the methods used in analyzing the CE data, in particular the conditional logit
model (CLM) and the nested logit model. Hypotheses are also specified at this stage.
Chapter 6 presents the results of both models, marginal willingness to pay (mWTP)
estimates, and other survey question results. Lastly, Chapter 7 concludes the thesis
with a discussion of the findings, as well as implications for future research.

7
Chapter 2
BACKGROUND
2.1 Organic and Natural Background
With the passing of the Organic Foods Production Act in 1990, the USDA
began developing national standards for organic certification through the creation of
the National Organic Program (NOP) (USDA, NOP, 2008). The NOP established a
certification program for organic products, along with production and labeling
standards. Concerning the meaning behind the term organic, the NOP specifies that
crops must have been grown without the use of conventional pesticides, petroleum-
based fertilizers, or sewage sludge-based fertilizers. For animals, it means that they
must have been fed organic feed, given access to the outdoors, and given no
antibiotics or growth hormones. In addition, the NOP states that organic also means
no genetically modified ingredients and no irradiation.
A product may bear the organic label if it consists of at least 95% organic
ingredients. Products containing at least 70% organic ingredients may display the
phrase „made with organic ingredients‟, but cannot display the USDA organic logo. In
addition, anyone who knowingly uses the organic logo on a non-organic product is
subject to a fine of up to $11,000 per offense (USDA, NOP, 2010).
Unlike the term organic, products bearing the term natural do not undergo
any formal certification process. However, the USDA‟s Food Safety and Inspection
Service do have a formal definition for the term under their food labeling guidelines
governing meat and poultry. Under these guidelines, natural is defined to mean a
8
product with no artificial ingredients, no added coloring, and minimal processing
(USDA, FSIS, 2010). Although there is a formal definition in place for this term, the
USDA does not inspect and certify such products. Therefore, the term natural often
can often be found on a variety of food products. There has been some evidence that
consumers lack a basic understanding as to the meanings behind the terms organic and
natural (Gifford and Bernard, forthcoming). The NOP is concerned enough to state on
their program webpage that the two terms are not the same.
2.2 Locally Grown Background
The recent consumer trend towards purchasing local food, referred to by
some as the „local food movement‟ has many attempting to define what consumers
consider to be „local‟. Evidence of this trend towards local can even be seen in the
term „locavore‟ which according to Merriam-Webster means „one who eats foods
grown locally whenever possible‟ (Merriam-Webster Inc., 2010). The term‟s first
known use is cited as 2005. The term local has a different meaning for each
individual, and to date has no formal USDA definition or certification. Products
labeled as local therefore may be from within the consumer‟s state, county, or a
nearby state. As previously mentioned, the trend toward local has also spawned
numerous buy local promotions across the country.
2.3 Mid-Atlantic State Marketing Programs
As of early 2010 all 50 states had in place some type of state agricultural
marketing program. Although discontinued in early 2010, the Delaware Department
9
of Agriculture‟s Grown Fresh with Care in Delaware marketing program was
officially launched in 2007. While the Delaware Department of Agriculture‟s
Marketing Section promoted the Grown Fresh with Care in Delaware program as “the
first „branded program‟ in Delaware history” (State of Delaware, DDA, 2009) it was
not their first logo program. In the mid-1990‟s, the department attempted to launch
and promote a logo identifying Delaware agricultural products. However, this initial
effort was also short lived. The Grown Fresh with Care logo was allowed to be used
on products with ingredients that originated from within the State of Delaware,
although an actual percentage of ingredients were not defined.
According to the mission statement for the Delaware program, a product
bearing the logo provided “a guarantee of freshness since products are supplied to
supermarkets within 48 hours of being picked from the farm” (State of Delaware,
DDA, 2009). At the time of the program‟s discontinuation though, there was no
certification process in place to assure this deadline was met. In addition to the Grown
Fresh with Care in Delaware logo, a Made Fresh with Care in Delaware logo was
briefly used in 2007 for products produced within the state.
The Maryland’s Best marketing program was created by the Maryland
Department of Agriculture‟s Marketing and Agribusiness Development Section in
2002. The program‟s stated mission is to “link Maryland farmers with consumers
through….promotions and advertising” (State of Maryland, MDA, 2009). One of the
main program venues of the Maryland’s Best program remains their promotional
website. Visitors to the website can search by commodity for local products and
farmers‟ markets. The website also features a wholesale search designed specifically

10
for retailers, as well as listings for agri-tourism sites and community supported
agriculture.
Those interested in joining the Maryland’s Best program must register
online, and are only eligible if they are a grower or processor in Maryland. Once
registered, information about their farm will appear on the Maryland’s Best website.
In addition, program members may purchase promotional materials online such as
banners and signage. There is little evidence of any type of promotion beyond this.
Similar to Delaware‟s former program, there is no certification process in place, nor is
there any minimum percentage requirement in place for products bearing the
Maryland’s Best logo.
In contrast, one of the most well known state marketing programs
currently in use, the New Jersey Department of Agriculture‟s Jersey Fresh program
has expanded since its initial establishment in 1983 to encompass three additional
logos: Jersey Seafood, Jersey Grown and Jersey Bred. Prompting many other states to
spearhead their own marketing programs, Jersey Fresh began as a radio advertising
campaign and was established “to promote and market New Jersey agricultural
products” (State of New Jersey, NJDA, 2009). Agricultural products such as fresh
fruits and vegetables, shell eggs and egg products, turkey, and chicken are items
eligible to bear the Jersey Fresh logo.
In order to be permitted to use the logo, interested parties must first
register with the Department of Agriculture‟s Quality Grading Program to ensure their
products meet Jersey Fresh quality standards. In addition to submitting an application
for the Jersey Fresh Quality Grading Program, a $30 fee is assessed as well (State of
New Jersey, NJDA, 2009). Jersey Fresh program members moreover are eligible to

11
apply for grants and matching funds, to be used for promotional purposes. The Jersey
Bred logo was created to allow farmers in the state to market both 4-H market lambs,
and horses residing in New Jersey. The Jersey Seafood logo program is for use by fish
farmers and fishermen based in New Jersey. Lastly, the Jersey Grown logo program
was created to recognize nursery products such as trees, shrubs, flowers and plants
grown within the State of New Jersey. Both the design and construction of the Jersey
Seafood and Jersey Grown programs mimic the state‟s Jersey Fresh program.
Each separate logo has its own website, which contains information for
consumers, retailers, and other industry members. Point-of-purchase materials for the
various logos are available for purchase, to program members, through the New Jersey
Department of Agriculture. Unlike the programs established in Maryland and
Delaware, the Jersey Fresh program does have in place a formal certification process,
and requires that 100 percent of a product‟s ingredients must be from within the state.
PA Preferred, the Pennsylvania Department of Agriculture‟s marketing
logo established in 2004, is currently in use on both processed and unprocessed
products. Qualifications in order for fresh, unprocessed food products, nursery and
other various agricultural items to carry the logo include that they must be either 100%
Pennsylvanian, or grown at least 75% of the time in Pennsylvania. Processed products
must receive their final packaging and processing in Pennsylvania, and if the primary
ingredients of the product are grown in Pennsylvania, the processor must agree to buy
as many Pennsylvania grown ingredients as possible, subject to availability
(Commonwealth of Pennsylvania, PDA, 2009). In order to obtain a license to use the
PA Preferred logo, as well as become a program member, interested parties must
complete an online contact form, and then be personally contacted by a PA Preferred

12
representative. Industry associates such as retailers, distributors, restaurants and food
service operators may become licensed program members as well. Although there is a
minimum percentage requirement in place, there is no formal certification process.
The PA Preferred program appears to be more active than programs in both Delaware
and Maryland.
Lastly the Virginia Department of Agriculture and Consumer Services‟
Virginia’s Finest trademark program was introduced in 1989 as a way for the state to
“differentiate and promote top quality Virginia-produced and processed agricultural
products” (Commonwealth of Virginia, VDACS, 2009). In order for interested parties
to use the logo, they must first be a Virginia agricultural producer, or food processor,
with a product that meets the program‟s quality standards. While there is no
associated fee involved with participating in the Virginia’s Finest program, potential
participants must first meet their specific industry‟s standards, as well as receive
certification from the Virginia Department of Agriculture and Consumer Services.
Processed food products wishing to utilize the logo must also be approved by a special
review committee. Once certified to use the Virginia’s Finest logo, participants are
then listed in the searchable Virginia‟s Finest Directory, which is available online and
appears to be the program‟s primary vehicle of promotion. There is no set minimum
percentage requirement for a product to be able to bear the program logo.
All five of these state marketing programs vary greatly in terms of
program length, level of establishment and promotion, as well as certification and
percentage requirements. With such drastic variation evident among programs, it
would be interesting to see if consumer preference differs for locally grown compared
to state program promoted foods by state. Halloran and Martin (1989) witnessed an

13
earlier rise in state promotional programs during the 1980‟s, and discussed how states
were unlikely to witness long-term benefits from a state sponsored marketing program
unless that state held a substantial share of the market for a particular product. As
New Jersey is particularly well known for their fresh produce, it would be interesting
to see if consumer preference for Jersey Fresh foods was higher when compared to
consumer preference for state program promoted foods in neighboring states.
Perhaps length of program establishment though is an important factor, or
perhaps consumers have little preference difference between locally grown and state
program promoted foods. Whether or not state marketing programs are in fact
important in helping shape consumer preference would be a key piece of information
for these state marketing agencies.
14
Chapter 3
LITERATURE REVIEW
3.1 Introduction
Once the general topic area of interest was defined, a thorough literature
review was conducted to help identify opportunities for further research. The first
section of the literature review discusses previous research related to consumer interest
in locally grown, as well as consumer preference and WTP for the local attribute. The
next section of the literature review concerns past research attempting to define locally
grown, only one of which was conducted within the Mid-Atlantic region over a decade
earlier. Subsequent literature review sections include previous studies concerning the
effectiveness of state marketing programs at increasing consumer demand, as well as
consumer preference and WTP for the attributes organic and natural.
3.2 The Trend Towards Locally Grown
3.2.1 Consumer Interest in Local
Evidence of consumer demand for locally grown products continues to
grow. The trend towards local can even be witnessed in the marketing activities of
snack-food giant Frito-Lay, who in 2009 made “Lay‟s Local” their primary
promotional campaign (Horovitz, 2009). First Lady Michelle Obama has been cited
advocating “the need for fresh, unprocessed, locally grown food…” (Martin, 2009).
In July 2009, 60 Minutes star Andy Rooney filmed a segment while produce

15
shopping, declaring throughout that fresh produce should be local (CBS Videos
Online, 2009).
Several studies have been conducted concerning consumer preference for
locally grown foods as well. Darby et al. (2008) conducted a study featuring a choice
experiment of Ohio residents, and found consumers preferred locally grown foods
over those grown in the United States, with farm and farmers market shoppers
exhibiting almost twice the willingness to pay (WTP) for local products. They also
suggested that for larger states, such as Ohio, state boundaries may serve as natural
borders in the minds of consumers when it comes to defining what is „local‟. The
authors however stressed that this might not be the case for smaller states, such as
those in New England. It would be beneficial then to conduct a study across states in
the Mid-Atlantic region, which is comprised of both small and large states, and see if
state size does matter when defining local, or if perhaps it varies by region.
In an earlier study conducted in Arizona, Patterson et al. (1999) similarly
concluded that a majority of consumers prefer to purchase local products, in particular
those identified under the Arizona Grown logo, compared to those products identified
as being from other regions. However, they found little prior consumer awareness of
the Arizona Grown marketing program. In addition the authors focused on only the
grocery store purchasing venue. Both of these studies were one-state studies in rather
large states, as opposed to a regional study investigating consumer preference for local
across states.
A study by Thilmany, Bond and Bond (2008) surveyed U.S. consumers
and concluded a greater value was often placed on local production over organic
production. They also found consumers who mainly purchased local foods because
16
they viewed their purchase as economically supporting agriculture, exhibited a WTP
of 7.3% more for local products. This study though examined data from a prior
national survey effort that used Likert-scale responses, and did not investigate
preference for state marketing program promoted foods. It is realistic to assume that
consumers in different regions would have different definitions for what they consider
to be „local‟. Therefore a regional study as opposed to a national study might be more
accurate in terms of uncovering preference and WTP for local foods.
Hu, Woods, and Bastin (2009) investigated Kentucky consumer‟s WTP
for processed blueberry products, and found consumer preference strongest for
products identified as local, as opposed to products identified as organic and products
identified as sugar free. The authors employed the use of a choice experiment that
featured six different value-added food products. Although they were interested in
determining consumer preference for the attributes of local and organic, they were also
interested in determining how consumer preference differed among the different
blueberry value-added products. They found the attribute organic was not as valued
for two of the more value-added products included: blueberry muffin mix and
blueberry fruit rollups.
Loureiro and Hine (2002) surveyed Colorado consumers and concluded
consumers were willing to pay a higher premium for potatoes designated as Colorado
Grown compared to potatoes identified as organic or GMO-free. Instead of using a
choice experiment, the authors employed the use of a payment card format, where
respondents could place „bids‟ by choosing a price listed in order to determine WTP.
Schneider and Francis (2005) conducted a survey in Nebraska and found 36% of
respondents willing to pay at least a 10% price premium for local products from

17
within their state county. It is important to note that this particular study was
conducted in only one county in Nebraska, and therefore only limited conclusions can
be made.
A survey of Indiana consumers by Jekanowski, Williams, and Schiek
(2000) found the perceived quality of a local product had the strongest impact on
one‟s purchasing likelihood. They also reported that their results suggested a demand
for local products that a well planned state marketing program could capture.
However they emphasized that if state programs allowed their quality standards to fall
below those of competing states, ultimately such a state would quintessentially be
branding their products as “lower quality”. With such evidence that state programs
could be successful at capturing the local consumer, it would be important to include
both state sponsored and local food products when investigating consumer
preferences.
Additionally Giraud, Bond, and Bond (2005) surveyed consumers from
Maine, Vermont and New Hampshire. They found consumers from all three states
willing to pay a price premium for local specialty food products from within their
state. Specific specialty food products were not identified. Instead respondents were
told their „specialty food product‟ was either valued at $5 a unit or $20 a unit.
While all of these previous studies have investigated consumer preference
for local, none have conducted a regional study examining both local and state
marketing program promoted foods across states, and none have attempted to define
what is „local‟. In addition, only two studies mentioned employed the use of a choice
experiment, noted to be particularly useful as they imitate the actual choices
consumers face while shopping (Lusk and Hudson, 2004).

18
3.2.2 Defining Locally Grown
Vermont is currently the only known state to have in place a state-specific
local logo. Their Buy Local program even includes a state definition for local: “a
product grown within 30 miles of the place of sale, or within the State of Vermont”
(Vermont Agency of Agriculture, 2009). As previously mentioned, a study by Darby
et al. (2008) suggested for larger states that consumers may consider the natural
geographical borders of their state to be a boundary for defining what is local. Gallons
et al. (1997) surveyed Delaware households and found that for fresh produce, when
asked what areas defined “locally grown fresh produce” an average of 83% of
respondents considered Delaware to be local, with 48% considering Delmarva to be
local, 42% Southern New Jersey and 34% Southern Pennsylvania respectfully. Some
time has passed since this study was conducted, and the need for more updated
research and analysis is evident.
Brown (2003) conducted a survey of households in Missouri, and
concluded that when it came to defining locally grown, consumers considered local to
be a region smaller than within state borders. She found that the distance a product
traveled mattered more than whether it was from within one‟s state, and that local can
cross state lines. She similarly found a lack of consumer awareness for Missouri‟s
state marketing program AgriMissouri. Households surveyed were limited to the
southeastern region of Missouri.
Hand and Martinez (2010) discussed how actual definitions for local can
help illuminate consumer demand for local products, but that no one definition would
suffice. Should definitions for local foods then be state specific, such as currently is
seen in Vermont, or should they be region specific? Such a regional study would be
important in helping determine this.

19
Hu, Batte, Woods, and Ernst (2010) also attempted to determine a
definition for local by conducting an online survey of Ohio and Kentucky residents.
They found that 73% of consumers in their sample considered food products to be
local if they were from a distance of less than 100 miles. The authors similarly
concluded that consumers seem to place a higher importance on the local production
attribute for fresh food products. It would be interesting to conduct a study across
several states of varying size, yet also in the same region.
3.3 State Marketing Programs
With studies showing consumer preference for local, there is increasing
evidence that state-sponsored marketing programs are successful in increasing demand
and sales for local products. Carpio and Isengildina-Massa (2009) evaluated South
Carolina‟s agricultural marketing program SC Grown in which they found consumer
demand for South Carolina grown produce had risen 3.4% one year after the
program‟s inception. They further estimated producer surplus from this increase to be
around $2.9 million.
Research conducted by the California Department of Agriculture and the
Buy California Marketing Agreement found sales of California agricultural products
had increased 7.1% since the start of the CA Grown program in 2002, amounting to
almost $900 million (State of California, BCMA, 2009). Govindasamy et al. (2004)
estimated that for the year 2000, the Jersey Fresh program had increased the sales of
fresh produce alone by $36.6 million. They calculated that for every dollar that year
allocated towards the promotion of Jersey Fresh, $54.49 in total economic output was
gained for the State of New Jersey. Hanagriff, Lau, and Rogers (2009) conducted a
study of the Texas wine industry, mainly supported and promoted under the Go Texan

20
program. They found in 2007, for each dollar spent on promoting Texas wine, total
sales increased by $2.16.
It is important to note that the figures for New Jersey seem especially high
in comparison to the other mentioned state marketing programs. These preliminary
findings seem to show a promising return for efforts though involved with state
marketing programs, and their accompanying local food products. With three of the
five state programs targeted in this survey created after 2000, this study provides a
unique opportunity to compare previously established programs with newer less
established programs. It also provides the opportunity to compare consumer
preference for and knowledge of state marketing promoted foods on a regional level.
Conducting similar surveys across all five states affords the opportunity to accurately
compare and contrast consumer preferences in this region.
3.4 Consumer Preferences and WTP for Organic
Since the labeling and certification of organic products through the
National Organic Program (NOP) in 2002, interest in organic foods has prompted
numerous studies concerning consumer preference and WTP. Yiridoe, Bonti-
Ankomah, and Martin (2005) conducted a review of the current literature, and
concluded consumer WTP for organic products appears to decrease with premium
level. Hughner et al. (2007) performed a similar compilation, and argued consumer
interest in organic products varied much in part to a lack of basic understanding for
what „organic‟ means.
Batte et al. (2007) conducted a survey of Ohio residents in seven different
grocery stores, and concluded consumers were willing to pay a price premium for

21
organic products, even those with less than 100% organic ingredients. The farmers‟
market purchasing venue was not investigated in this study.
Bond, Thilmany and Bond (2008) surveyed U.S. consumers, and
concluded consumers placed a value on organic production, and may even view
organic products as being of higher quality. It would be interesting to see if such a
result is the case for a more regional study. Organic products were found by Stegelin
(2008) to also make up a significant portion of „local‟ products purchased by
consumers, although the study was a limited first attempt with a small sample size. It
would be interesting to determine if consumer preference for products identified as
both local and organic differs from products identified as both local and natural.
However does consumer preference for the organic attribute differ by purchasing
venue?
Using a similar region as this study, Shuzzler, Govindasamy, and Adelaja
(2003) compared the profiles of organic consumers in New Jersey to those in New
York and Pennsylvania. Govindasamy and Italia (1999) surveyed New Jersey
consumers at several grocery store locations, and found their results suggested
consumers were willing to pay a price premium in order to obtain organic fresh
produce. Organic value-added products were not included in this particular study. It
would be useful to investigate consumer preference for the organic production
attribute across purchasing venues (grocery store vs. farmers‟ market) on a regional
level.
Existing literature looking at consumer preference and WTP for natural
food is not as prevalent as studies addressing organic, with much room for
contribution. A study conducted by Gifford and Bernard (forthcoming), in which

22
experimental auctions were conducted, found that many consumers have little
knowledge as to what the term natural actually means. They also found many
consumers believed the terms natural and organic had the same requirements, until
presented with the actual standards for each.
3.5 Summary
The literature review conducted above exposed several areas of
opportunity for further research, as relates to this project. It was discovered that only a
few previous studies employed the use of a CE. In addition, there is also a need for a
more recent study examining how Mid-Atlantic consumers define local. The majority
of previous studies addressing a definition for local were conducted in primarily large
states. Investigating previous studies looking at the effectiveness of state marketing
programs found evidence that they increase consumer demand, but the majority of
these studies did not address consumer awareness and preference for such programs in
nearby states. Lastly, while there is a wide array of available literature concerning
preference and WTP for the organic attribute, previous studies investigating the
natural attribute have been few.

23
Chapter 4
SURVEY DESIGN
4.1 Survey Choice Experiment
As previously noted, a key part of the survey was a choice experiment
designed to determine consumer preference and WTP. Prominently used in marketing
research, Lusk and Hudson (2004) noted choice experiments are particularly useful
because they closely mimic actual consumer shopping behavior. Examples of
previous studies using choice experiments includes earlier work by Lusk, Roosen, and
Fox (2003), Alfnes et al. (2006), and Carlsson, Frykblom, and Lagerkvist (2007).
The choice experiment here was constructed using SAS software (SAS
Institute Inc., 2010) and methods developed by Kuhfeld (2009), and featured the
value-added food product strawberry preserves. This product was chosen for several
reasons. First, given the five state scope of the survey, strawberry preserves are
available locally in each state, as well as under each state‟s promotional slogan. They
are also a familiar product that a majority of consumers should recognize, and is
neither considered region-specific or state-specific.
The experimental design used featured four product attributes. They
included purchase venue, production method, price and location. The attribute price
had three levels ($2.99, $3.99, and $4.99) for strawberry preserves, while purchase
venue contained two levels: grocery store and farmers‟ market. Prices were
determined using current market prices from a wide range of purchasing venues.

24
Production method also had two levels, organic and natural. As the
majority of strawberry preserves available on the market are identified as “natural”,
the attribute conventional was not included. Lastly location had three levels, which
included local, non-local and depending on the state, either the slogan Jersey Fresh,
PA Preferred, Maryland’s Best, Virginia’s Finest, or Grown Fresh with Care in
Delaware. The attributes that appeared in the experimental design can be viewed
below in Table 4.1:
Table 4.1. Choice Experiment Attributes
Note: The level “State Marketing Program” featured the program slogan
of the respondent‟s state.
Following examples and macros created by Kuhfeld (2009), the choice
experiment was constructed as a branded study, allowing for the labeling of each
alternative per set, as well as the ability to add a constant „none of these‟ or no
purchase option. The „labeling‟ used in this design was the attribute location. By
specifying the number and level of attributes to be included, a reasonable size for the
experimental design, minimizing violations of balance and orthogonality was first
generated. From this suggested number of choice sets, an efficient design was next
Attribute Levels
Location
Local, Non-Local, State Marketing Program
(Grown Fresh with Care in Delaware,
Maryland’s Best, Jersey Fresh,
PA Preferred, Virginia’s Finest)
Production Method Natural, Organic
Purchasing Venue Grocery Store, Farmers‟ Market
Price $2.99, $3.99, $4.99

25
constructed. This design attempts to optimize D-efficiency, the standard measure of
the goodness of the experimental design, by searching for a candidate design in part by
using the OPTEX procedure of SAS. At this stage of construction, a balanced and
orthogonal design with 100% D-efficiency was identified and the variance matrix for a
linear model was optimized.
The linear design was next converted to a choice design by specifying the
number of alternatives per set, and the number of attributes to be displayed per
alternative. The choice design was evaluated again, but this time to optimize the
variance matrix for a multinomial logit model, and the design was restricted to 12
choice sets. At this stage parameters were also specified: price2 is added, and
interactions between price and purchase venue, price and production method, and
purchase venue and production method are added. Lastly, the 12 choice sets were
blocked into two blocks of 6 sets each, with blocks checked for duplicate choice sets.
The SAS code used to create the choice experiment can be found in Appendix IV.
The final experimental design contained four choices per set, with one
being the constant "none" alternative. Each respondent was presented with six sets of
strawberry preserves to avoid respondent fatigue, with two different choice experiment
versions mailed per state. A sample choice set can be viewed below in Figure 4.1:
Figure 4.1. Sample Choice Set
26
4.2 Other Survey Components
In addition to the choice experiment, the survey contained several other
questions to gain a better understanding of consumer preferences. These included
questions regarding their knowledge and opinion of the five state marketing programs,
as well as how often they purchase food products from a grocery store and/or farmers‟
market. In addition, questions on how they rated local, organic and state program
promoted foods in term of factors such as taste, safety and the environment, and the
area they considered to be „local‟ were also included. Lastly, the survey contained
standard demographic questions to use in modeling, and a section where respondents
could write comments if they chose. Survey comments and the respondent‟s state
were recorded, and can be viewed in Appendix III.
Accompanying the survey form was an information sheet respondents
were asked to read prior to completing the survey. This sheet contained definitions
and explanations for five terms appearing throughout the survey. Definitions for the
terms organic, natural and conventional were adapted from formal USDA definitions
and included. A brief discussion of the terms local and state marketing program were
also incorporated. Since exact definitions for these two terms are not available, it was
mentioned that the term local is flexible, often with a different meaning for each
person, as well as how state marketing program components frequently vary by state.
4.3 Survey Piloting
The survey was initially piloted in September 2009 on about 20 junior and
senior undergraduate students over two days in Dr. John Bernard‟s FREC 404 Food
and Fiber Marketing course, as well as on 30 sophomore undergraduate students in

27
Andrew Carroll‟s PSYC 200 Research Methods course. Initial feedback was taken
into consideration and the choice experiment portion of the survey was then piloted a
second time on students in Dr. Bernard‟s same class. The survey was also piloted on
several graduate students in the Department of Food and Resource Economics, as well
as various volunteers.
4.4 Survey Sample and Mailing
Mailing lists of 1,000 households from five states: Delaware, Maryland,
Virginia, New Jersey, and Pennsylvania, were purchased through USAData in
September 2009, for a total potential sample of 5,000. Following the guidelines of
Salant and Dillman (1994) to maximize our response rate, an advance pre-notice
postcard was mailed the third week in October announcing the survey. A first mailing
of the survey was then sent the first of November. This first mailing included a cover
letter explaining the importance of the survey, the survey and accompanying
information sheet, a stamped return envelope and a $1 token of appreciation. A copy
of the cover letter can be found in Appendix I. A reminder postcard was next mailed,
followed by a second full survey mailing to all who had not yet responded. At the
close of the survey the overall response rate was 39.6%. The total sample was 4,661
after bad addresses were removed. Response rates by individual state can be viewed
below in Table 4.2:

28
Table 4.2. Response Rates by State
4.5 Sample Population
Demographics of the respondents in the survey sample were compared to
the population of each state according to the 2000 Census1, and can be viewed in
Table 4.3. Demographics by state, from the 2000 Census, can be viewed in Table 4.4.
Although the population of each state is fairly represented by the survey sample,
possible bias include less racial diversity, slightly higher education levels and slightly
higher income levels for the survey respondents.
1 2000 Census figures can be viewed online at http://www.census.gov/.
State Response Rate (%)
(No. of Surveys)
Sample
Delaware 45.5
(424)
933
Maryland 39.1
(358)
915
New Jersey 36.7
(343)
934
Pennsylvania 40.5
(382)
944
Virginia 36.3
(339)
935
Total 39.6
(1846)
4661

29
Table 4.3. Demographics of Respondents in the Survey Sample
Delaware Maryland New Jersey Pennsylvania Virginia
Number % Number % Number % Number % Number %
Gender:
Male 164 43.16 172 51.50 142 46.71 162 46.96 155 51.33
Female 216 56.84 162 48.50 162 53.29 183 53.04 147 48.67
Age (in years):
Under 25 5 1.32 10 3.00 2 0.66 6 1.74 4 1.32
25-34 34 8.97 36 10.81 30 9.84 25 7.27 31 10.23
35-44 63 16.62 41 12.31 60 19.67 66 19.19 56 18.48
45-54 89 23.48 78 23.42 78 25.57 82 23.84 77 25.41
55-59 45 11.87 53 15.92 33 10.82 46 13.37 28 9.24
60-64 43 11.35 33 9.91 25 8.20 35 10.17 36 11.88
65-69 40 10.55 32 9.61 24 7.87 21 6.10 24 7.93
70-74 31 8.18 15 4.50 20 6.56 20 5.81 16 5.28
75-79 12 3.17 18 5.41 12 3.93 19 5.52 12 3.96
80 or above 17 4.49 17 5.11 21 6.88 24 6.99 19 6.27
Education:
< High school graduate 13 3.45 4 1.21 10 3.28 6 1.73 20 6.60
High school graduate 76 20.16 47 14.15 63 20.66 99 28.61 39 12.87
Some college, no degree 98 25.99 63 18.97 53 17.38 64 18.51 60 19.80
Associate degree 37 9.81 31 9.34 27 8.85 29 8.38 24 7.92
Bachelor degree 79 20.96 82 24.70 73 23.93 88 25.43 92 30.37
Graduate or professional
degree
74 19.63 105 31.63 79 25.90 60 17.34 68 22.44
29

30
Delaware
Number %
Maryland
Number %
New Jersey
Number %
Pennsylvania
Number %
Virginia
Number %
Children under the age of
18 in household?:
Yes 120 32.34 85 25.76 110 36.55 101 29.28 97 32.33
No 251 67.66 245 74.24 191 63.45 244 70.72 203 67.67
Race:
White 335 85.24 254 77.44 254 80.13 330 90.66 258 81.65
Black, African American 28 7.13 48 14.63 24 7.57 11 3.02 39 12.34
Hispanic or Latino 7 1.78 4 1.22 21 6.62 4 1.10 3 0.95
American Indian/Alaskan 4 1.02 0 0.00 1 0.31 0 0.00 0 0.00
Asian 12 3.05 14 4.27 13 4.10 13 3.57 10 3.16
Native Hawaiian/Other
Pacific Islander
1 0.25 2 0.61 1 0.32 0 0.00 0 0.00
Other 6 1.53 6 1.83 3 0.95 6 1.65 6 1.90
Income:
Less than $10,000 14 3.86 5 1.63 8 2.67 8 2.44 17 5.70
$10,000 to $14,999 10 2.75 8 2.61 7 2.33 23 7.01 15 5.03
$15,000 to $24,999 22 6.06 20 6.54 22 7.33 30 9.15 14 4.71
$25,000 to $34,999 37 10.19 15 4.90 18 6.01 40 12.21 24 8.05
$35,000 to $49,999 58 15.98 39 12.75 34 11.33 52 15.85 24 8.05
$50,000 to $74,999 92 25.34 59 19.28 53 17.67 54 16.46 66 22.15
$75,000 to $99,999 56 15.43 44 14.38 49 16.33 43 13.11 52 17.45
$100,000 to $124,999 18 4.96 42 13.72 37 12.33 39 11.89 24 8.05
$125,000 to $149,999 17 4.68 25 8.17 20 6.67 11 3.35 18 6.05
$150,000 to $199,999 24 6.62 19 6.21 25 8.33 17 5.18 22 7.38
$200,000 to $249,999 6 1.65 16 5.23 16 5.33 9 2.74 13 4.36
$250,000 or more 9 2.48 14 4.58 11 3.67 2 0.61 9 3.02
30

31
Table 4.4. 2000 Census, Source: U.S. Census Bureau
Delaware
%
Maryland
%
New Jersey
%
Pennsylvania
%
Virginia
%
Gender:
Male 48.6 48.3 48.5 48.3 49.0
Female 51.4 51.7 51.5 51.7 51.0
Age (in years):
15-19 7.1 6.7 6.2 6.9 6.8
20-24 6.6 5.9 5.7 6.1 6.8
25-34 13.9 14.1 14.1 12.7 14.6
35-44 16.3 17.3 17.1 15.9 17.0
45-54 13.3 14.3 13.8 13.9 14.1
55-59 5.0 5.1 5.0 5.0 5.1
60-64 4.1 3.8 3.9 4.2 3.9
65-74 7.2 6.1 6.8 7.9 6.1
75 or above 5.7 5.3 6.4 7.7 5.1
Education:
< High school graduate 17.4 16.2 17.9 18.0 18.5
High school graduate 31.4 26.7 29.4 38.1 26.0
Some college, no degree 19.5 20.3 17.6 15.6 20.4
Associate degree 6.6 5.3 5.3 5.9 5.6
Bachelor degree 15.6 18.0 18.8 14.0 17.9
Graduate or professional
degree 9.4 13.5 11.0 8.4 11.6
31

32
Delaware
%
Maryland
%
New Jersey
%
Pennsylvania
%
Virginia
%
Children under the age of 18 in
household?:
Yes 24.2 25.0 24.3 23.2 24.1
No 75.8 75.0 75.7 76.8 75.9
Race:
White 74.6 64.0 72.6 85.4 72.3
Black, African American 19.2 27.9 13.6 10.0 19.6
Hispanic or Latino 4.8 4.3 13.3 3.2 4.7
American
Indian/Alaskan 0.3 0.3 0.2 0.1 0.3
Asian 2.1 4.0 5.7 1.8 3.7
Native Hawaiian/Other
Pacific Islander 0.0 0.0 0.0 0.0 0.1
Other 2.0 1.8 5.4 1.5 2.0
Income:
Less than $10,000 7.1 6.9 7.0 9.7 7.9
$10,000 to $14,999 5.1 4.2 4.7 7.0 5.3
$15,000 to $24,999 11.3 9.5 9.3 13.7 11.4
$25,000 to $34,999 12.2 10.7 10.0 13.3 12.1
$35,000 to $49,999 16.9 15.4 14.3 16.9 16.5
$50,000 to $74,999 21.3 21.5 19.8 19.5 20.3
$75,000 to $99,999 12.0 13.5 13.5 9.6 11.4
$100,000 to $124,999 6.4 7.6 8.2 4.6 6.2
$125,000 to $149,999 3.0 4.0 4.5 2.1 3.3
$150,000 to $199,999 2.5 3.5 4.2 1.8 2.9
$200,000 or more 2.1 3.0 4.3 1.9 2.7
32

33
Chapter 5
METHODS
5.1 The CLM Model
The collected data for all five states was first analyzed in SAS Version 9.2
(SAS Institute Inc., 2010) using a conditional logit model (CLM). The CLM uses the
characteristics of the outcomes to predict the selected choice and to fit the data (Long,
1997, So and Kuhfeld, 2009). The predicted probability of the choices in the CLM is
defined as:
4
1)exp(
)exp()|Pr(
c ic
idii
z
zzdy
(1)
where iy is the choice for respondent i coded 1, 2, 3 or 4 to refer to state program,
local, non local or none respectively, idz is the vector of covariates for the d-th choice
and is the common coefficient vector for all choices.
Conditional logit models are often the first approach when analyzing data
collected from a CE. Examples of this can be seen in previous CE studies examining
cottonseed choice (Banerjee, Hudson, and Martin, 2007), blueberry products (Hu,
Woods, and Bastin, 2009), and incentive framing (Mazur and Bennett, 2010).

34
5.2 CLM Model, Strawberry Preserves
An overall joint-test was performed on the effect of state to determine if
all five states should remain in the model, which was significant. Next likelihood ratio
tests were performed on the overall effect of Organic, overall effect of Price, and
overall effect of Market. As these three tests were significant, individual interactions
were next tested. Likelihood ratio tests for Price2, the interaction Price*Market, the
interaction Price*Organic, and the interaction Organic*Market were next performed.
The effect of the interaction between Price*Organic and the interaction
Organic*Market was not significant, and these two terms were removed from the
model. Next overall joint-tests were performed for the effect of each of the choice
variables, which were Local, NonLocal, and NoPurchase, which were all significant.
Overall joint-tests were next performed for the effect of state by each of
the eight variables still present in the model at this point. State interaction terms with
the variables Price2, NoPurchase, Market, and the interaction Price*Market were
removed. Demographic covariates were at first included in the model, but later
removed due to issues with their ability to accurately represent the analyzed data. The
SAS code used to generate the CLM model, as well as perform the likelihood ratio
tests mentioned above, can be viewed in Appendix V.
The final CLM model for strawberry preserves includes 20 variables, and
the predicted probability for each choice, )|Pr( ii zdy , is more clearly interpreted
by instead stating the CLM in terms of the utilities of each choice. The utilities for the
final CLM model are given by:

35
(2-5)
where the variables are as defined in Table 5.1 below. Reference coding is used
throughout.
It is important to note that a concern with the CLM involves handling the
independence from irrelevant alternatives (IIA), which can be tested for in the CLM
but not addressed, as the model assumes IIA is not an issue. A perhaps superior model
in that IIA can be addressed is the Nested Logit Model, where choices in the choice
experiment are viewed as a decision tree, and the structure of the tree is specified as a
sort of hierarchy. The Nested Logit Model therefore is a natural extension from the
CLM, and is explored next.
None)Purchase No(
OrganicVA
OrganicPAOrganicNJOrganicM D Organic
PricePriceM arketPriceM arketNonLocalVA
NonLocalPANonLocalNJNonLocalM DNonLocalLocal)(Non
OrganicVAOrganicPAOrganicNJOrganicM D
OrganicPricePriceM arketPriceM arket
LocalVALocalPALocalNJLocalM DLocal(Local)
OrganicVAOrganicPAOrganicNJOrganicM D
OrganicPricePriceM arketPriceM arketProgram) (State
11
20
19181716
2
1514131210
9887
20191817
16
2
15141312
54321
20191817
16
2
15141312
ii
iii
iiiiiii
iiiiiii
iiiiiii
iiiiiiiii
iiiiii
iiiiiiiii
iiiiiiiii
iiiiii
U
U
U
U

36
Table 5.1. Variable Names and Descriptions, CLM Model
1Dummy variable where value is zero otherwise
5.3 The Nested Logit Model
While the simplest approach to modeling a choice experiment is to use a
CLM, this model assumes the independence of irrelevant alternatives (IIA). However,
the no purchase option is very different from the options where preserves are
purchased, and therefore it seems unlikely that IIA would hold. A natural extension
beyond the CLM described above would be a two-level nested logit with state
program, local and non-local in one nest, and no purchase in the other. This allows
choices within nests to be correlated and is a partial relaxation of the IIA assumption.
Nested logit models of similar form have been used to model CE data in a variety of
closely related fields. Examples include green energy electricity (Borchers, Duke, and
Variable
Name Description
Local 1 if the respondent selected the Local choice option1
NonLocal 1 if the respondent selected the Non-Local choice option1
NoPurchase 1 if the respondent selected the No Purchase choice option1
Market 1 if the respondent chose the farmers‟ market venue1
Price Price for an 18 oz. jar of strawberry preserves
Organic 1 if the respondent chose the organic attribute1
MD 1 if the respondent is from Maryland1
NJ 1 if the respondent is from New Jersey1
PA 1 if the respondent is from Pennsylvania1
VA 1 if the respondent is from Virginia1

37
Parsons, 2007), ethnic food (Camarena and Sanjuan, 2009), and public vs. private
dentists (Kiiskinen, Suominen-Taipale, and Cairns, 2010).
According to Hensher and Greene (2002) care must be taken in
normalizing such a nested model. The authors present three possible normalizations
entitled RU1, RU2 and RU3. They additionally argue that the RU2 approach is
generally the best, especially when the nested logit has a degenerate branch, meaning a
branch in which there is only one choice. Therefore, a nested logit model with an
RU2 normalization was next fitted.
Again referring back to Hensher and Greene, the choices themselves are
called elemental alternatives. The choices State Program, Local, Non-Local and No
Purchase are represented by k=1, 2, 3 and 4 respectively. The elemental alternatives-
level probabilities are given by:
))exp(IV(
)()(exp
)()(exp
)()(exp)|P(
1i
kUi
kUi
kUiik
iK
(6)
where )(i is the normalization constant for branch i and,
iK
kUiiIV1
)()(expln)(
(7)
is the inclusive value for branch i. The branch level probabilities are given by:
2
1)(/)IV(exp
))(/)exp(IV()(
ii
iiip
.
(8)

38
The probabilities of choices 4,3,2,1k are given by )()|P()Pr( ipikk .
5.4 Nested Logit Model, Strawberry Preserves
As dictated by the experimental design discussed earlier, the original
model included a quadratic functional form for Price as well as the interactions
Price*Market, Price*Organic, and Organic*Market. Additionally, state interactions
with each of the variables Price, Price2, Market and Organic were also included. A
series of likelihood ratio tests showed that a number of these terms were insignificant,
and therefore were excluded from the model. If an interaction with state and an effect
was significant, then all states were kept, even if individual state terms themselves
were not significant. Since regionally the area of interest consisted of all five states, it
seemed rational to include either all of the states or none at all. The series of
likelihood ratio tests performed were similar to those discussed for the CLM earlier
above. The utilities for the final Nested Logit Model are also the same as those
previously stated for the CLM, with the variables as defined in Table 5.1.
Computations for the nested logit model were performed using NLOGIT
3.0 (Greene 2003). In order to gain convergence, price was scaled by dividing by 5 so
that it varied between 0 and 1 like the dummy variables present in the model. It is
important to note that in the forthcoming table of results, scaling was restored to the
original.
5.5 Hypotheses
Prior to the modeling discussed above, hypotheses for both models were
made and are discussed below. It is hypothesized that the estimates of the CLM and

39
nested logit will differ, since it is assumed that IIA is a concern with the CLM that the
nested logit addresses. Both local and state program versions were expected to be
preferred over non-local versions, although the ranking between these two was
uncertain, and could possibly vary by state. Some earlier studies discussed suggested
state borders may serve as a definition of local for consumers. However, a state
marketing program may need to do more than just state identification to match
consumer preference for local. State size might also matter, since the larger the state,
the greater the chance consumers may view only a portion of the state as being local.
Therefore, it is expected that differences between states will be observed across
choices.
It is also hypothesized that consumers will be willing to pay a higher price
premium for strawberry preserves purchased at a farmers‟ market versus purchased at
a grocery store. The ambiance and experience of visiting a farmers‟ market, as well as
the feeling of a connection with area farmers could help explain this outcome.
Onianwa, Mojica, and Wheelock (2006) identified several areas where consumers had
a preference for farmers‟ markets over grocery stores, including the atmosphere.
Zepeda and Leviten-Reid (2004) noted similar advantages for farmers‟ markets, such
as being seen as a form of entertainment or chance to interact with area farmers.
It is likewise expected that consumers will exhibit preference and higher
mWTP for organic preserve versions versus natural preserve versions. This would
make sense given the extra, and generally favorably viewed, requirements organic
certification imposes on production. However, while information was included on an
information sheet accompanying the survey, it may still be that consumer
understanding of the differences between these two attributes is limited, as seen in

40
Gifford and Bernard (forthcoming). If full understanding is lacking, it could be that
no significant difference between organic and natural appears.
Since it can be difficult to understand the relationships between the
choices and attributes by examining the coefficients alone, a table of hypotheses on
individual coefficients is omitted from this section. Rather probabilities will be
computed from the estimated coefficients, which will be discussed further in the
following chapter.

41
Chapter 6
RESULTS
6.1 CLM and Nested Logit Results, Strawberry Preserves
Table 6.1 shows the results of the CLM, and the variables in bold are
statistically significant at the 5% level. The variable Local was significant when
interacted with both Maryland and Pennsylvania. The variable NonLocal was
significant both by itself and when interacted with both Maryland and Pennsylvania.
The variables Market, Price2, and the interaction between Price*Market were also
significant, as was the variable NoPurchase. Lastly the variable Organic was
significant both by itself and when interacted with Maryland.
Table 6.2 shows the results of the subsequent nested logit model, and the
variables in bold are statistically significant at the 10% level. In terms of significance,
all of the variables significant in the CLM were also significant in the nested logit, as
well as the interaction between NonLocal and Virginia and Organic and Virginia. The
normalization constants for the two branches of the nested logit can also be viewed in
Table 6.2. Since not all of the normalization constants are equal to 1, the nested logit
model as opposed to the CLM was overall a better fit, as it relaxes the IIA assumption.
The nested logit model therefore will be examined from here forward.

42
Table 6.1. CLM Results, Strawberry Preserves
Note: Variables in bold are significant at the 5% level
Variable Estimated
Coefficient
Standard
Error Pr > ChiSq
Local -0.00653 0.05577 0.9068
MD*Local 0.37054 0.07980 <.0001
NJ*Local -0.13139 0.08142 0.1066
PA*Local 0.20941 0.07861 0.0077
VA*Local 0.06784 0.08158 0.4057
NonLocal -1.28961 0.07421 <.0001
MD*NonLocal 0.44309 0.10420 <.0001
NJ*NonLocal -0.09288 0.11066 0.4013
PA*NonLocal 0.27456 0.10357 0.0080
VA*NonLocal 0.20127 0.10739 0.0609
NoPurchase -2.66418 0.53194 <.0001
Market -0.45756 0.13667 0.0008
Price*Market 0.09046 0.03749 0.0158
Price 0.04969 0.28034 0.8593
Price2 -0.13577 0.03575 0.0001
Organic -0.11226 0.05423 0.0384
MD*Organic 0.24377 0.07735 0.0016
NJ*Organic 0.04432 0.07967 0.5780
PA*Organic -0.09850 0.07681 0.1997
VA*Organic -0.08495 0.07943 0.2849

43
Table 6.2. Nested Logit Results, Strawberry Preserves (RU2)
1
Normalization constants for a branch with one choice are fixed at 1.
Note: Variables in bold are significant at the 10% level
Variable Estimated
Coefficient
Standard
Error Pr > ChiSq
Local -0.0088 0.0414 0.8318
MD*Local 0.2478 0.0697 0.0004
NJ*Local -0.0946 0.0611 0.1212
PA*Local 0.1293 0.0670 0.0536
VA*Local 0.0563 0.0666 0.3980
NonLocal -0.9030 0.1246 <.0001
MD*NonLocal 0.3063 0.0875 0.0005
NJ*NonLocal -0.0456 0.0794 0.5661
PA*NonLocal 0.2107 0.0867 0.0151
VA*NonLocal 0.1979 0.0864 0.0219
NoPurchase -2.5286 0.4109 <.0001
Market -0.2886 0.1133 0.0108
Price*Market 0.0579 0.0301 0.0543
Price -0.0608 0.2168 0.7794
Price2 -0.0840 0.0312 0.0072
Organic -0.0808 0.0408 0.0474
MD*Organic 0.1259 0.0618 0.0418
NJ*Organic 0.0356 0.0584 0.5423
PA*Organic -0.0012 0.0626 0.9853
VA*Organic -0.1345 0.0644 0.0368
Normalization Constants (i):
Purchase 0.6877 0.0882 <.0001
NoPurchase1
1.0000 ………. ………
44
It can be difficult to understand all the relationships between the choices
by examining the coefficients. Graphical representations can make these more
apparent. Using the probabilities for the choices calculated from the coefficients in
Table 6.2, graphs were created by state for the probability of each choice by price, for
both purchasing venues and both production methods.
Figures 6.1a-1e show the probabilities of each choice by price for the
natural attribute and farmers‟ market purchasing venue, for all five states respectively.
As will be seen, the natural, farmers‟ market combination held the highest value for
consumers across all five states. Figures 6.2a-2e show the probabilities of each choice
by price for the natural attribute and grocery store purchasing venue, for each state.
Figures 6.3a-3e show the probabilities of each choice by price for the organic attribute,
farmers‟ market venue, and Figures 6.4a-4e similarly shows choice by price for the
organic attribute, grocery store venue, again by state. As can be seen, the graphs
across combinations did not show any unique differences. However, there were some
apparent differences between states.
As hypothesized, local and state program preserves were clearly preferred
over non-local preserves across all five states. The two former choices were typically
the preference of over 35% of consumers for each, with non-local the choice of only
around 20% of consumers, across most price levels. Differences between states
include the probability ranking between local and state program. As can be seen in
Figures 6.1c, 6.2c, 6.3c, and 6.4c, New Jersey was the only state with respondents
exhibiting a stronger preference for preserves identified under a state program over
those identified as local. This preference order was consistent across purchasing
venues and production methods. While not quite significantly different at the 10%
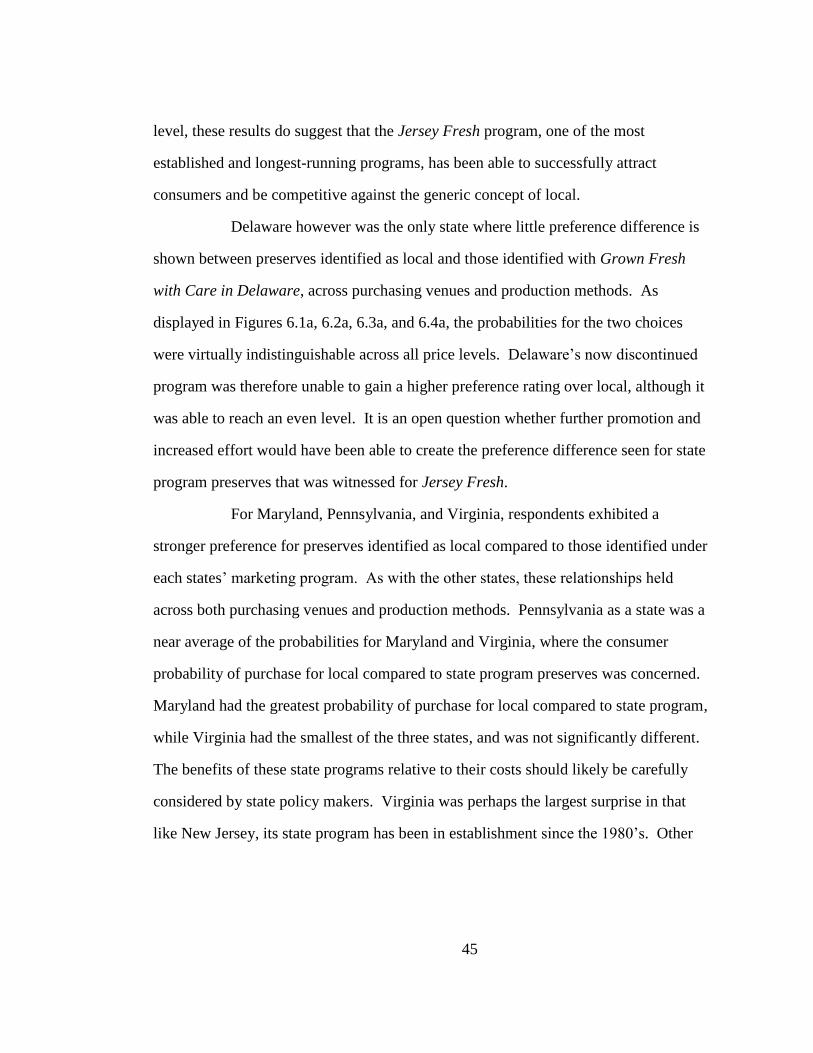
45
level, these results do suggest that the Jersey Fresh program, one of the most
established and longest-running programs, has been able to successfully attract
consumers and be competitive against the generic concept of local.
Delaware however was the only state where little preference difference is
shown between preserves identified as local and those identified with Grown Fresh
with Care in Delaware, across purchasing venues and production methods. As
displayed in Figures 6.1a, 6.2a, 6.3a, and 6.4a, the probabilities for the two choices
were virtually indistinguishable across all price levels. Delaware‟s now discontinued
program was therefore unable to gain a higher preference rating over local, although it
was able to reach an even level. It is an open question whether further promotion and
increased effort would have been able to create the preference difference seen for state
program preserves that was witnessed for Jersey Fresh.
For Maryland, Pennsylvania, and Virginia, respondents exhibited a
stronger preference for preserves identified as local compared to those identified under
each states‟ marketing program. As with the other states, these relationships held
across both purchasing venues and production methods. Pennsylvania as a state was a
near average of the probabilities for Maryland and Virginia, where the consumer
probability of purchase for local compared to state program preserves was concerned.
Maryland had the greatest probability of purchase for local compared to state program,
while Virginia had the smallest of the three states, and was not significantly different.
The benefits of these state programs relative to their costs should likely be carefully
considered by state policy makers. Virginia was perhaps the largest surprise in that
like New Jersey, its state program has been in establishment since the 1980‟s. Other
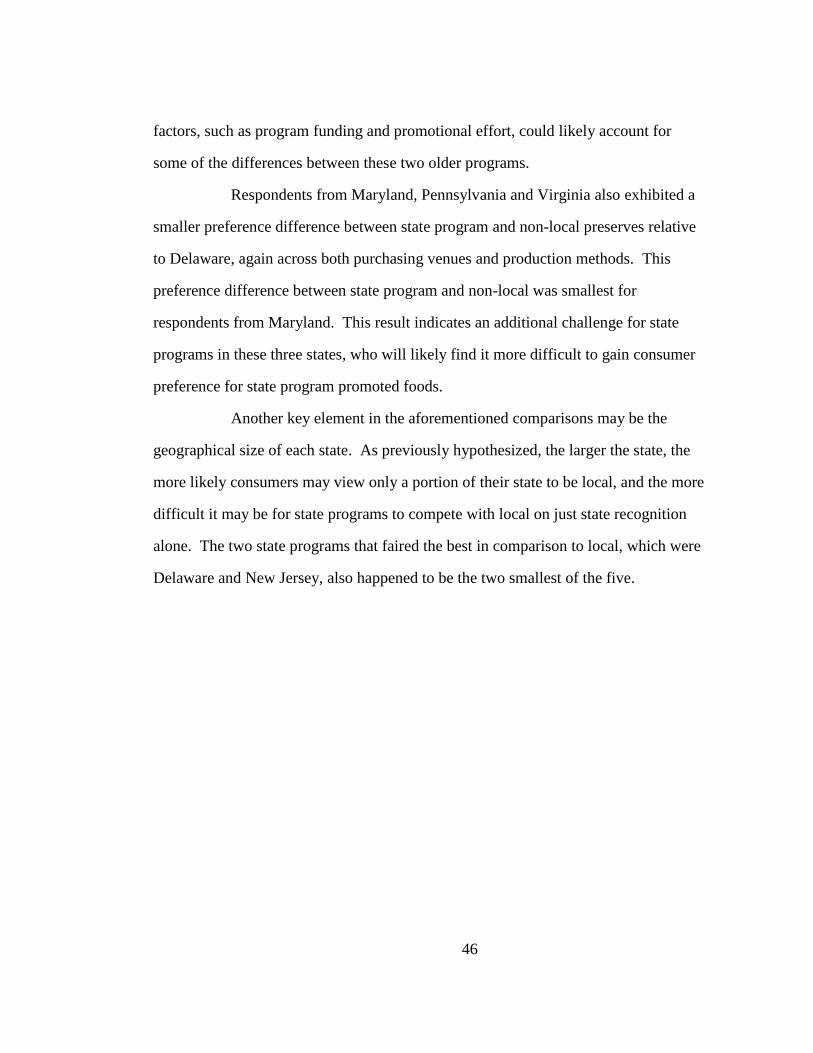
46
factors, such as program funding and promotional effort, could likely account for
some of the differences between these two older programs.
Respondents from Maryland, Pennsylvania and Virginia also exhibited a
smaller preference difference between state program and non-local preserves relative
to Delaware, again across both purchasing venues and production methods. This
preference difference between state program and non-local was smallest for
respondents from Maryland. This result indicates an additional challenge for state
programs in these three states, who will likely find it more difficult to gain consumer
preference for state program promoted foods.
Another key element in the aforementioned comparisons may be the
geographical size of each state. As previously hypothesized, the larger the state, the
more likely consumers may view only a portion of their state to be local, and the more
difficult it may be for state programs to compete with local on just state recognition
alone. The two state programs that faired the best in comparison to local, which were
Delaware and New Jersey, also happened to be the two smallest of the five.
47
Figures 6.1a.-6.1e. Probability of Choice by Price; Natural and Farmers’ Market Attributes
Figure 6.la. Delaware Figure 6.1b. Maryland Figure 6.1c. New Jersey
Figure 6.1d. Pennsylvania Figure 6.1e. Virginia
47
48
Figures 6.2a-6.2e. Probability of Choice by Price; Natural and Grocery Store Attributes
Figure 6.2a. Delaware Figure 6.2b. Maryland Figure 6.2c. New Jersey
Figure 6.2d. Pennsylvania Figure 6.2e. Virginia
48
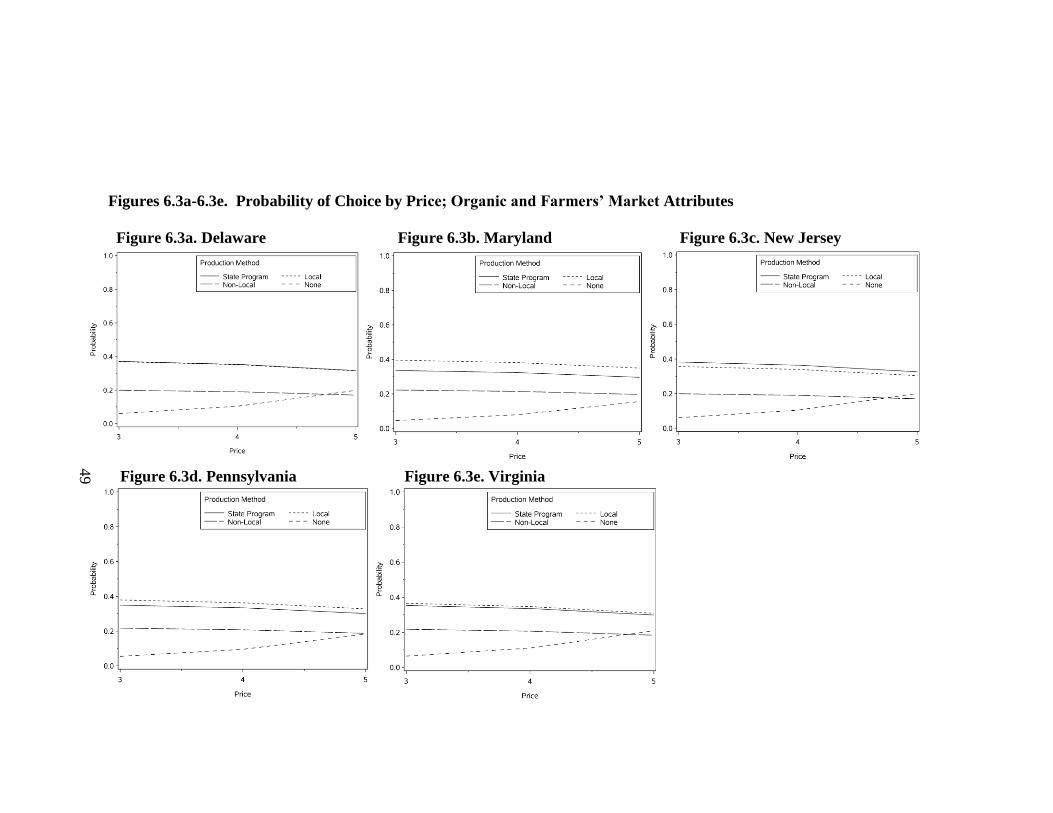
49
Figures 6.3a-6.3e. Probability of Choice by Price; Organic and Farmers’ Market Attributes
Figure 6.3a. Delaware Figure 6.3b. Maryland Figure 6.3c. New Jersey
Figure 6.3d. Pennsylvania Figure 6.3e. Virginia
49

50
Figures 6.4a-6.4e. Probability of Choice by Price; Organic and Grocery Store Attributes
Figure 6.4a. Delaware Figure 6.4b. Maryland Figure 6.4c. New Jersey
Figure 6.4d. Pennsylvania Figure 6.4e. Virginia
50

51
There has been some evidence that consumers may consider local to be an
area smaller than just within a state‟s borders, such as a state county for example. Hu,
Batte, Woods, and Ernst (2010) suggested many consumers may define local to mean
within less than 100 miles, and Brown (2003) found in Missouri that local was often
viewed as a region smaller than within a state‟s border. Local may come across as
more supportive of a consumer‟s area than a state-wide promotion for larger states
would. Therefore, it may take additional effort for promotional programs in
Maryland, Pennsylvania, and Virginia to effectively capture the local consumer.
The remaining elements of the probability graphs were more consistent.
The probability of choosing the No Purchase option was less than 5% at the lowest
price level for all cases shown. As expected, the probability of a no purchase did
increase as price increases. By the time the upper price limit of five dollars was
reached, the percentage of respondents selecting no purchase was consistently near
20%. For New Jersey and Delaware, the no purchase option even surpassed the option
of purchasing non-local preserves. One reason for this occurrence may be that at those
price levels, consumers in those states are expecting something extra from the product,
such as being local.
6.2 Determining mWTP
When price and the effect for which willingness to pay is desired both
have linear functional forms, the marginal willingness to pay (mWTP) is:
priceeffec / t.
(9)
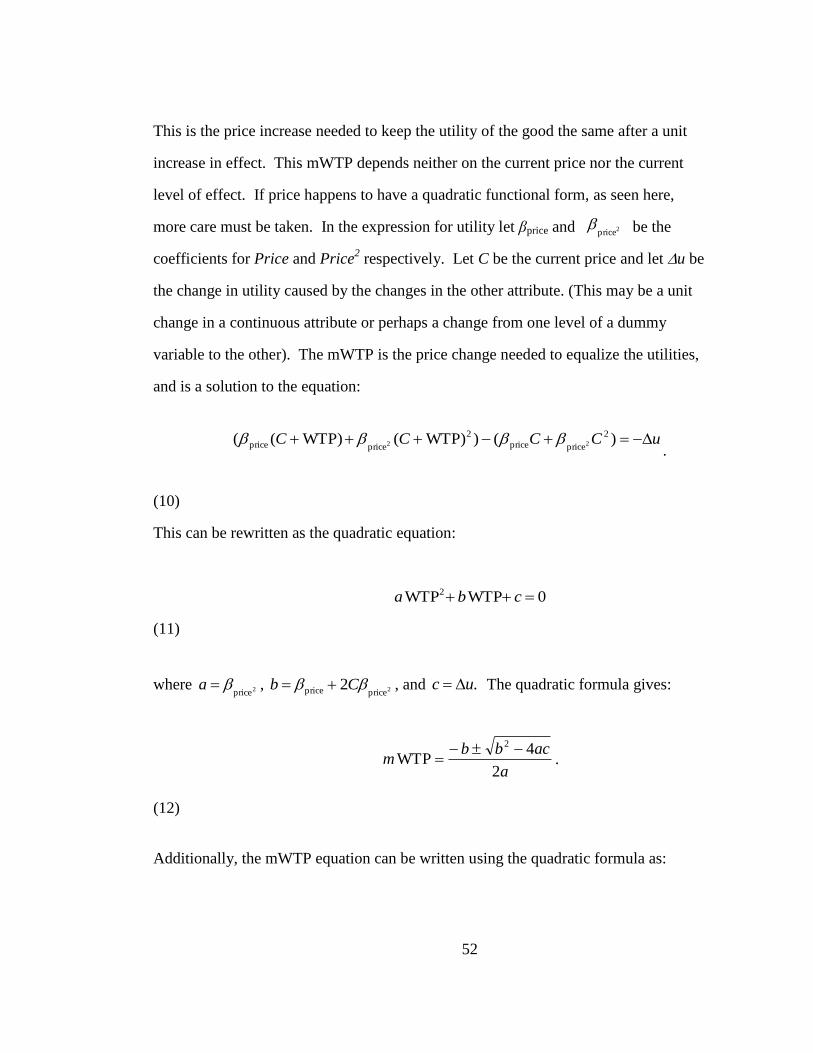
52
2price
This is the price increase needed to keep the utility of the good the same after a unit
increase in effect. This mWTP depends neither on the current price nor the current
level of effect. If price happens to have a quadratic functional form, as seen here,
more care must be taken. In the expression for utility let βprice and be the
coefficients for Price and Price2 respectively. Let C be the current price and let u be
the change in utility caused by the changes in the other attribute. (This may be a unit
change in a continuous attribute or perhaps a change from one level of a dummy
variable to the other). The mWTP is the price change needed to equalize the utilities,
and is a solution to the equation:
uCCCC )()WTP)(WTP)(( 2
priceprice
2
priceprice 22 .
(10)
This can be rewritten as the quadratic equation:
0WTPWTP2 cba
(11)
where 2pricea , 2priceprice 2 Cb , and .uc The quadratic formula gives:
a
acbbm
2
4WTP
2 .
(12)
Additionally, the mWTP equation can be written using the quadratic formula as:

53
2price
2
422
15
15
2
151413151413UPP
mWTPjj
.
(13)
where Pj is the price per jar of strawberry preserves, j= $3.00, $4.00 or $5.00, and U is
the calculated gain in utility determined by the coefficient estimates.
In the nested logit model, both βprice and are negative. This
implies that the desired solution is the one with the minus sign, as solutions with the
positive sign before the terms are infeasible and therefore ignored. A table of
computed mWTP values can be seen in Table 6.3. Quadratic functional forms such as
this and mWTP have been considered before (see Roe et al, 2004).
The mWTP estimates in Table 6.3 show the different price amount a
consumer would be willing to pay from the base price for the change in the given
attribute. As expected, these mWTP estimates decline as the base price increases. For
example, consider the mWTP to switch from non-local preserves to state program
preserves, grocery store purchasing venue, for Delaware. At a base price of $3, the
Delaware consumer would be willing to pay $1.33 more for this change, but is only
willing to pay $0.90 more if the base price is $5. The proceedings below discuss these
mWTP estimates in more detail.
6.3 mWTP Estimates, Grocery Store vs. Farmers’ Market
Overall, the calculated mWTP estimates indicate a higher willingness-to-
pay across all five states for preserves from the farmers‟ market purchasing venue,

54
compared to the grocery store purchasing venue. Consumers appear willing to pay a
price premium for preserves from a farmers‟ market location, as was earlier
hypothesized. Possible explanations for this higher mWTP could be the ambiance of
the farmers‟ market, as well as the ability to personally interact with local farmers. As
previously discussed, prior research involving farmers‟ markets uncovered some
intangible benefits to shopping at farmers‟ market venues (See Onianwa, Mojica, and
Wheelock, 2006, and Zepeda and Leviten-Reid, 2004).
6.4 mWTP Estimates, Organic vs. Natural
With the exception of Maryland, all of the states surveyed failed to exhibit
a higher mWTP for organic preserves compared to natural preserves. This finding
was unexpected, as the opposite was earlier hypothesized. For the organic attribute,
grocery store purchasing venue, Maryland respondents exhibited a mWTP of 2.7%
more for preserves priced at $3.00, a mWTP of 1.5% more for preserves priced at
$4.00, and a mWTP of 1% more for preserves priced at $5.00. For the organic
attribute, farmers‟ market purchasing venue, Maryland respondents exhibited a mWTP
of 3% more for preserves priced at $3.00, a mWTP of 1.8% more for preserves priced
at $4.00, and a mWTP of 1% more for preserves priced at $5.00. While the price
premium for organic was evident in Maryland, even here it was not especially high.
For Delaware, the attributes of natural and organic appear to be viewed
about the same by consumers. This result seems to follow the earlier findings of
Gifford and Bernard (forthcoming), in that consumers cannot distinguish differences
between these two. For Pennsylvania and Virginia respondents, the results of why

55
natural was preferred over organic are more difficult to explain. Perhaps consumers
simply prefer the more familiar natural product, or fail to see the advantage of buying
an organic processed product. Or, even though an information sheet was included
with the survey, they may still be confused as to the meanings of these two terms.
Further investigation comparing these two attributes is needed, especially a study that
included both fresh and processed products.

56
Table 6.3. Marginal WTP by State and Price Level
Delaware Maryland New Jersey
Price Price Price
$3.00 $4.00 $5.00 $3.00 $4.00 $5.00 $3.00 $4.00 $5.00
Grocery Store Purchasing Venue:
Non-Local to State Program 1.33 1.10 0.90 0.93 0.75 0.63 1.39 1.15 0.97
Non-Local to Local 1.32 1.09 0.92 1.25 1.02 0.86 1.26 1.03 0.87
Local to State Program 0.02 0.02 0.01 -0.45 -0.34 -0.27 0.18 0.14 0.11
Natural to Organic -0.02 -0.01 -0.01 0.08 0.06 0.05 -0.08 -0.06 -0.05
Farmers’ Market Purchasing Venue:
Non-Local to State Program 1.44 1.17 0.98 1.01 0.80 0.66 1.50 1.22 1.02
Non-Local to Local 1.43 1.16 0.97 1.35 1.09 0.91 1.36 1.10 0.92
Local to State Program 0.02 0.01 0.01 -0.52 -0.37 -0.29 0.20 0.15 0.12
Natural to Organic -0.02 -0.01 -0.01 0.09 0.07 0.05 -0.09 -0.07 -0.05
Pennsylvania Virginia Price Price
$3.00 $4.00 $5.00 $3.00 $4.00 $5.00
1.06 0.86 0.72 1.08 0.88 0.73
1.22 1.00 0.84 1.14 0.93 0.78
-0.22 -0.17 -0.14 -0.09 -0.07 -0.05
-0.15 -0.11 -0.09 -0.41 -0.31 -0.25
1.15 0.92 0.76 1.17 0.94 0.78
1.32 1.06 0.89 1.23 0.99 0.83
-0.25 -0.18 -0.15 -0.10 -0.07 -0.06
-0.17 -0.12 -0.10 -0.46 -0.33 -0.26
56

57
6.5 mWTP Estimates, Local, Non-Local, and State Program Promoted
The mWTP estimates comparing local, non-local and state program
promoted followed the earlier results examining the probabilities for these choices.
Across all states, there was clearly a higher mWTP for the attributes local and state
program over non-local, as was earlier hypothesized.
In Delaware, only negligibly higher mWTP estimates of $0.02, $0.01 and
$0.01 are exhibited for preserves identified with the Grown Fresh with Care in
Delaware slogan over preserves identified as local, for both purchasing venues. With
Delaware respondents exhibiting a mWTP of only 0.67% more for state program
preserves over local preserves priced at $3.00, for both purchasing venues, evidence in
support of the program is not found. As Delaware‟s state marketing program was
discontinued in early 2010, this decision would have been more than feasible looking
at these estimates.
For the local attribute, grocery store purchasing venue, Delaware
respondents exhibited a mWTP of 44% more for preserves priced at $3.00, a mWTP
of 27.3% more for preserves priced at $4.00, and a mWTP of 18.4% more for
preserves price at $5.00, compared to non-local preserves. For the local attribute,
farmers‟ market purchasing venue, Delaware respondents exhibited a mWTP of 47.7%
more for preserves priced at $3.00, a mWTP of 29% more for preserves priced at
$4.00, and a mWTP of 19.4% more for preserves priced at $5.00, compared to non-
local preserves.
Respondents in Maryland, Pennsylvania and Virginia all exhibited a
higher mWTP for preserves identified as local compared to their state‟s marketing
slogan, as well as compared to non-local preserves. As hypothesized, perhaps

58
consumers in larger states such as these three fail to define local as within the borders
of their state.
For the local attribute, grocery store purchasing venue, Maryland
respondents exhibited a mWTP of 41.7% more for preserves priced at $3.00, a mWTP
of 25.5% more for preserves priced at $4.00, and a mWTP of 17.2% more for
preserves price at $5.00, compared to non-local preserves. For the local attribute,
farmers‟ market purchasing venue, Maryland respondents exhibited a mWTP of 45%
more for preserves priced at $3.00, a mWTP of 27.3% more for preserves priced at
$4.00, and a mWTP of 18.2% more for preserves priced at $5.00, compared to non-
local preserves. Even though Maryland exhibited the lowest mWTP to move from
local to non-local preserves, consumers were still willing to pay a premium of over
40% for preserves priced at $3.00.
Compared to local, for state program promoted, Maryland respondents
exhibited a mWTP of 15% less for preserves priced at $3.00, a mWTP of 8.5% less for
preserves priced at $4.00 and a mWTP of 5.4% less for preserves priced at $5.00, for
the grocery store purchasing venue. For the farmers‟ market purchasing venue,
Maryland respondents exhibited a mWTP of 17.3% less for preserves priced at $3.00,
a mWTP of 9.3% less for preserves priced at $4.00 and a mWTP of 5.8% less for
preserves priced at $5.00, for state program over local.
For the local attribute, grocery store purchasing venue, Pennsylvania
respondents exhibited a mWTP of 40.7% more for preserves priced at $3.00, a mWTP
of 25% more for preserves priced at $4.00, and a mWTP of 16.8% more for preserves
price at $5.00, compared to non-local preserves. For the local attribute, farmers‟
market purchasing venue, Pennsylvania respondents exhibited a mWTP of 44% more

59
for preserves priced at $3.00, a mWTP of 26.5% more for preserves priced at $4.00,
and a mWTP of 22.3% more for preserves priced at $5.00, compared to non-local
preserves.
Comparing state program to local, Pennsylvania respondents exhibited a
mWTP of 7.3% less for preserves priced at $3.00, a mWTP of 4.3% less for preserves
priced at $4.00 and a mWTP of 2.8% less for preserves priced at $5.00, for the grocery
store purchasing venue. For the farmers‟ market purchasing venue, Pennsylvania
respondents exhibited a mWTP of 8.3% less for preserves priced at $3.00, a mWTP of
4.5% less for preserves priced at $4.00 and a mWTP of 3% less for preserves priced at
$5.00, again for state program over local.
For the local attribute, grocery store purchasing venue, Virginia
respondents exhibited a mWTP of 38% more for preserves priced at $3.00, a mWTP
of 23.3% more for preserves priced at $4.00, and a mWTP of 15.6% more for
preserves price at $5.00, compared to non-local preserves. For the local attribute,
farmers‟ market purchasing venue, Virginia respondents exhibited a mWTP of 41%
more for preserves priced at $3.00, a mWTP of 24.8% more for preserves priced at
$4.00, and a mWTP of 16.6% more for preserves priced at $5.00, compared to non-
local preserves.
Lastly comparing mWTP for state program over local for Virginia,
respondents exhibited a mWTP of 3% less for preserves priced at $3.00, a mWTP of
1.8% less for preserves priced at $4.00 and a mWTP of 1% less for preserves priced at
$5.00, for the grocery store purchasing venue. For the farmers‟ market purchasing
venue, Virginia respondents exhibited a mWTP of 3.3% less for preserves priced at
$3.00, a mWTP of 1.8% less for preserves priced at $4.00 and a mWTP of 1.2% less

60
for preserves priced at $5.00 for state program over local. Considering that Virginia‟s
state marketing program Virginia’s Finest has been in existence since the late 1980‟s,
it was somewhat surprising to see that local was preferred over state program.
New Jersey was the only state with respondents clearly exhibiting a higher
mWTP for preserves identified with the Jersey Fresh slogan compared to preserves
identified as local or non-local, for both purchasing venues. In New Jersey, mWTP
estimates of $0.18, $0.14 and $0.11 were exhibited for Jersey Fresh preserves over
local preserves for the grocery store purchasing venue, with slightly higher estimates
of $0.20, $0.15 and $0.12 for the farmers‟ market venue. In other words, for state
program over local, New Jersey respondents exhibited a mWTP of 6% more for
preserves priced at $3.00, a mWTP of 3.5% more for preserves priced at $4.00, and a
mWTP of 2.2% more for preserves priced at $5.00, grocery store purchasing venue.
For the farmers‟ market purchasing venue, New Jersey respondents
exhibited a mWTP of 6.7% more for preserves priced at $3.00, a mWTP of 3.8% more
for preserves priced at $4.00 and a mWTP of 2.4% more for preserves priced at $5.00
for state program over local. For the state program promoted attribute, grocery store
purchasing venue, New Jersey respondents exhibited a mWTP of 46.3% more for
preserves priced at $3.00, a mWTP of 28.8% more for preserves priced at $4.00, and a
mWTP of 19.4% more for preserves price at $5.00, compared to non-local preserves.
For the local attribute, farmers‟ market purchasing venue, New Jersey respondents
exhibited a mWTP of 50% more for preserves priced at $3.00, a mWTP of 30.5%
more for preserves priced at $4.00, and a mWTP of 20.4% more for preserves priced
at $5.00, compared to non-local preserves. Considering that Jersey Fresh is one of the

61
most well known state programs in the country, that state program was preferred over
local was not a surprising result.
6.6 Other Survey Question Results
6.6.1. Purchasing Frequency of Food Products
The percentage of survey respondents who identified themselves as the
primary purchaser of food products for their household can be viewed below in Table
6.4. Overall, about 78% of survey respondents were primary purchasers, with
Delaware having the highest percentage of primary purchaser respondents averaging
around 81%, and New Jersey the lowest at around 76%.
Table 6.4. Primary Purchaser of Food Products, by State
Yes
No
State Number % Number %
Delaware 325 80.85 77 19.15
Maryland 259 77.08 77 22.92
New Jersey 242 75.63 78 24.37
Pennsylvania 283 78.18 79 21.82
Virginia 241 76.02 76 23.98
Overall 1350 77.72 387 22.28
Respondents from each state additionally were asked how often in an
average month they purchased food products from the following locations: grocery
store and farmers‟ market, on a scale from 1 to 5 with 1 meaning never and 5 meaning
very often. Across all five states, respondents on average purchased from a grocery

62
store location „often‟ or „very often‟ and from a farmers‟ market location „seldom‟ or
„occasionally‟, the results of which can be viewed in Table 6.5.
Table 6.5 Purchasing Frequency of Food Products by Venue1
11 meaning never and 5 meaning very often
Expanding upon the purchasing frequency by venue question, respondents
were next asked how often in an average month they purchased food products labeled
or advertised as locally grown, organic, natural, and under each of the five states‟
promotional program slogan. Results from this question, by state and overall, can be
viewed in Table 6.6. Respondents were asked again to respond on a scale from 1 to 5,
with 1 meaning never and 5 meaning very often. Purchasing frequency of food
products labeled or advertised as locally grown, organic, and natural were very similar
across all five states. For locally grown and natural food products, respondents from
all five states indicated in an average month that they purchased these products
„occasionally‟. Organic food products were purchased slightly less frequent, with
respondents from all five states indicating they purchased organic food products
„seldom‟ or „occasionally‟ in an average month.
Grocery Store Farmers’ Market
State Mean Standard
Deviation Number
Mean
Standard
Deviation Number
Delaware 4.45 0.77 405 2.53 1.13 383
Maryland 4.56 0.73 337 2.23 1.01 323
New Jersey 4.43 0.86 321 2.57 1.10 300
Pennsylvania 4.47 0.82 365 2.41 1.01 337
Virginia 4.52 0.75 320 2.21 0.97 284
Overall 4.49 0.79 1748 2.40 1.06 1627

63
While the purchasing frequency of locally grown, organic and natural
food products were consistent across all five states, this was not the case for food
products identified under each state‟s promotional program slogan. Not surprisingly,
purchasing frequency was highest for program promoted foods in the program‟s home
state. Jersey Fresh food products had the highest purchasing frequency across all five
states, with respondents indicating that products were purchased „seldom‟. New
Jersey respondents though indicated purchasing Jersey Fresh food products
„occasionally‟. It is important to note that this was also the highest purchasing
frequency indicated for promotional program foods within a program‟s home state.
Delaware respondents indicated purchasing Jersey Fresh „seldom‟, with Pennsylvania
respondents indicating „never‟ or „seldom‟, and Maryland and Virginia respondents
indicating a purchasing frequency of „never‟. Considering that Maryland and Virginia
are the two states that do not border New Jersey, this could help explain the above
mentioned results.
Virginia’s Finest was the promotional program with the next highest
overall purchasing frequency indicated at „seldom‟ or „occasionally‟. Perhaps since
programs in both New Jersey and Virginia were established back in the 1980‟s, they
are more familiar and better known across this five state area. Virginia respondents
indicated a purchasing frequency of „seldom‟ or „occasionally‟, with Delaware and
Maryland respondents indicating „never‟ or „seldom‟, and New Jersey and
Pennsylvania respondents indicating „never‟.
For Delaware, Maryland, and Pennsylvania promotional programs, within
each program‟s home state, respondents on average purchased these food products
„seldom‟. For Grown Fresh with Care in Delaware, respondents that were not from

64
Delaware on average indicated a purchasing frequency of „never‟. Similarly for PA
Preferred, respondents not from Pennsylvania also indicated a „never‟ purchasing
frequency. Lastly for Maryland’s Best food products, respondents from New Jersey,
Pennsylvania, and Virginia indicated a purchasing frequency of „never‟, with
respondents from Delaware indicating „never‟ or „seldom‟. Additional results not
mentioned here can be viewed in Table 6.6.

65
Table 6.6. Purchasing Frequency of Food Products in an Average Month1
Delaware
Maryland
New Jersey
Labeled or
Advertised as…. Mean
Standard
Deviation Number Mean
Standard
Deviation Number Mean
Standard
Deviation Number
Locally Grown 3.24 0.98 373 3.13 1.03 327 3.08 1.03 304
Organic 2.47 1.13 365 2.56 1.17 326 2.57 1.24 300
Natural 2.98 1.09 365 2.89 1.16 322 3.00 1.13 297
Grown Fresh with
Care in Delaware 2.16 1.24 349 1.21 0.64 305 1.21 0.59 288
Maryland's Best 1.54 0.91 350 2.10 1.25 320 1.18 0.51 290
Jersey Fresh 2.04 1.14 353 1.29 0.75 306 3.16 1.09 302
PA Preferred 1.39 0.77 348 1.21 0.62 303 1.20 0.53 290
Virginia's Finest 1.42 0.80 348 1.39 0.83 305 1.18 0.51 290
11 meaning never and 5 meaning very often
Pennsylvania
Virginia
Overall
Mean Standard
Deviation Number
Mean
Standard
Deviation Number
Mean
Standard
Deviation Number
3.19 0.95 340 2.96 1.04 285 3.13 1.01 1629
2.39 1.11 339 2.53 1.17 284 2.50 1.16 1614
2.86 1.09 334 2.92 1.07 282 2.93 1.11 1600
1.23 0.64 325
1.16 0.54 272
1.42 0.89 1539
1.29 0.68 328 1.34 0.76 274 1.50 0.93 1562
1.65 1.04 329 1.17 0.50 271 1.88 1.18 1561
2.08 1.26 327 1.23 0.61 275 1.44 0.88 1543
1.25 0.63 328 2.56 1.20 283 1.54 0.96 1554
65

66
6.6.2. State Marketing Program Awareness and Opinion Rating
In order to determine consumer awareness of each promotional program,
respondents were asked first if they were aware of each program, and if they were
their opinion of that promotional program. The percentage of respondents not aware
of each program, by state and overall can be viewed in Table 6.7. Overall, the
percentage of respondents not aware of the Grown Fresh with Care in Delaware
program was greatest averaging 77%. Jersey Fresh was the program with the highest
overall consumer awareness, with respondents not aware averaging 58%.
Interestingly Delaware was the only state surveyed where respondents
from that state were more aware of another program, Jersey Fresh, than their own
state‟s program. This could be because the Grown Fresh with Care in Delaware
program was the youngest program out of the five. In Maryland, New Jersey,
Pennsylvania, and Virginia, each state‟s home program had the most consumer
awareness, across all five programs.
Respondents who had awareness of a state program were asked to rate
their opinion of that program on a scale from 1 to 5, with 1 meaning „very poor‟ and 5
meaning „excellent‟. The results of this question, by state and overall, can be viewed
in Table 6.8. Excluding Virginia, in each state consumers indicated their opinion
rating was highest for the Jersey Fresh program, with a rating of „fair‟ or „good‟. In
Virginia, the program with the highest opinion rating was their own Virginia’s Finest,
also with a rating of „fair‟ or „good‟. Overall respondents had the highest opinion of
the Jersey Fresh program, with the Virginia’s Finest program receiving the second
highest overall opinion rating, both with a rating of „fair‟ or „good'.

67
Delaware respondents indicated an opinion rating of their own state‟s
program of „fair‟ or „good‟. They also indicated an average opinion rating of „fair‟ for
Maryland, Pennsylvania, and Virginia‟s promotional programs. Maryland respondents
indicated on average an opinion rating of „fair‟ for all five programs. New Jersey
respondents on average rated their opinion of Jersey Fresh to be „fair‟ or „good‟, with
an opinion rating on average of „fair‟ for the remaining four programs. Pennsylvania
respondents had an average opinion of „fair‟ for every program but Jersey Fresh,
which as previous mentioned received a rating of „fair‟ or „good‟. Lastly, Virginia
respondents similarly rated every program excluding Virginia‟s Finest as „fair‟, and
rated their own Virginia’s Finest as „fair‟ or „good‟.

68
Table 6.7. Percentage Not Aware of State Marketing Programs, by State
Delaware Maryland New Jersey Pennsylvania
State Marketing
Program Number %
Number % Number %
Number %
Grown Fresh with
Care in Delaware 196 49.62
271 86.86 246 82.55
289 85.25
Maryland’s Best 263 67.78 162 49.09 245 82.21 273 80.77
Jersey Fresh 180 45.92 255 81.73 51 15.94 231 66.96
PA Preferred 285 73.64 271 87.42 245 82.49 183 51.40
Virginia’s Finest 285 73.64 234 75.24 247 83.16 279 82.54
Virginia Overall
Number % Number %
263 89.15
1265 77.18
216 73.47 1159 70.33
254 85.52 971 58.28
257 86.24 1241 75.30
97 31.60 1142 69.63
68

69
Table 6.8. Opinion Rating of State Marketing Programs1
11 meaning very poor and 5 meaning excellent
Pennsylvania Virginia Overall
Mean Standard
Deviation Number
Mean
Standard
Deviation Number Mean
Standard
Deviation Number
3.18 1.02 50 3.16 0.85 32 3.25 1.10 374
3.15 1.00 65 3.22 0.98 78 3.17 1.05 489
3.57 0.98 114 3.09 1.13 43 3.63 0.98 695
3.33 1.11 173 3.02 0.65 41 3.06 1.08 407
2.86 0.96 59 3.77 0.95 210 3.35 1.07 498
Delaware Maryland New Jersey
State Marketing
Program Mean
Standard
Deviation Number
Mean
Standard
Deviation Number Mean
Standard
Deviation Number
Grown Fresh with
Care in Delaware 3.43 1.10 199
3.19 1.05 41 2.75 1.17 52
Maryland’s Best 3.15 1.02 125 3.27 1.10 168 2.89 1.09 53
Jersey Fresh 3.59 0.96 212 3.33 1.08 57 3.83 0.91 269
PA Preferred 2.84 1.07 102 2.90 1.05 39 2.73 1.12 52
Virginia’s Finest 3.09 1.05 102 3.26 1.01 77 2.78 1.09 50
69

70
6.6.3 Comparing State Program, Organic, and Local Foods
Respondents were asked on a scale from 1 to 5, with 1 meaning strongly
disagree and 5 meaning strongly agree, to rate their agreement with several statements
comparing organic foods with state program foods using their state‟s program slogan.
Results from this question can be viewed in Table 6.9. These statements included
more nutritious, safer to consume, better tasting, of higher quality, and more
environmentally friendly. Using these same statements, respondents were also asked
to similarly compare local foods with organic foods, the results of which can be
viewed in Table 6.10.
When asked to compare organic foods with their state‟s promotional
program foods, respondents in all five states agreed most with the statement that
organic foods are more environmentally friendly than state program foods, with an
average rating between „neutral‟ and „agree‟. After more environmentally friendly,
respondents from each state next agreed strongest with the statement that organic
foods are safer to consume than state program foods, again with an average rating
between „neutral‟ and „agree‟. For the remaining statements, respondents from each
state averaged a rating slightly above „neutral‟, suggesting that across this five state
region, consumers compare organic with state program foods in a similar manner.
Perhaps perceived safety and environmental friendliness are two additional attributes
needing to be explored further when attempting to target this Mid-Atlantic region.
Comparing local foods with organic foods, using the same set of
statements mentioned above, respondents from each state agreed strongest with the
statement that local foods are better tasting than organic foods with a rating between
„neutral‟ to „agree‟. Respondents from each state next agreed strongest with the

71
statements that local foods were of higher quality, and more environmentally friendly
than organic foods, with ties for these two statements in the case of two states. Similar
to the results from comparing organic foods to state program foods, respondents across
all states averaged a rating of „neutral‟ for the remaining statements. Overall, the two
statements that received the highest agreement when comparing local foods to organic
were better tasting and of higher quality. Stakeholders marketing and promoting local
food products within this region no doubt could use these two characteristics to their
advantage when targeting the local foods consumer.

72
Table 6.9. Compared with State Program Foods1, Organic Foods
2 are…..
Delaware
Maryland New Jersey
Mean
Standard
Deviation Number
Mean
Standard
Deviation Number
Mean
Standard
Deviation Number
More nutritious 3.10 0.94 349 3.18 0.83 301 3.10 0.95 301
Safer to consume 3.36 0.95 349 3.32 0.86 302 3.33 1.01 302
Better tasting 3.10 0.93 348 3.11 0.82 303 3.01 0.94 300
Of higher quality 3.18 0.93 349 3.24 0.82 303 3.20 0.97 300
More
environmentally
friendly
3.50 0.95 349
3.49 0.88 302
3.58 1.00 298
Pennsylvania
Virginia
Overall
Mean Standard
Deviation Number Mean
Standard
Deviation Number Mean
Standard
Deviation Number
3.16 0.93 318 3.03 0.88 279 3.11 0.91 1548
3.28 0.93 317 3.26 0.90 279 3.31 0.93 1549
3.10 0.92 318 3.07 0.88 280 3.08 0.91 1549
3.25 0.93 317 3.13 0.86 280 3.20 0.91 1549
3.53 0.98 317 3.47 0.91 278 3.51 0.94 1544
1State program foods referring to each state‟s individual state marketing program
21 meaning strongly disagree and 5 meaning strongly agree
72

73
Table 6.10. Compared with Organic Foods, Local Foods are1….
Delaware
Maryland
New Jersey
Mean
Standard
Deviation Number
Mean
Standard
Deviation Number
Mean
Standard
Deviation Number
More nutritious 3.02 0.86 364 3.05 0.85 313 2.96 0.83 301
Safer to consume 3.00 0.86 364 3.03 0.88 315 2.91 0.86 299
Better tasting 3.28 0.87 361 3.35 0.86 312 3.18 0.92 301
Of higher quality 3.12 0.82 362 3.17 0.85 310 3.08 0.91 301
More
environmentally
friendly
3.15 0.93 360
3.17 0.96 310
3.04 0.91 300
11 meaning strongly disagree and 5 meaning strongly agree
Pennsylvania
Virginia
Overall
Mean Standard
Deviation Number
Mean
Standard
Deviation Number
Mean
Standard
Deviation Number
3.14 0.90 336 2.94 0.86 286 3.03 0.86 1600
3.14 0.91 338 2.98 0.91 283 3.01 0.89 1599
3.41 0.87 337 3.21 0.92 286 3.29 0.89 1597
3.24 0.90 337 3.11 0.93 280 3.15 0.88 1590
3.24 0.94 334
3.03 0.90 281
3.13 0.93 1585
73

74
6.6.4 Defining Local
Another area of considerable interest was how Mid-Atlantic consumers
defined local, in terms of distance and geographical location, as well as what
percentage of product ingredients need to be local for the product itself to be consider
local. Respondents were asked to identify the percentage that a product needs to be
produced and/or grown locally for them to consider it to be a local food product, the
results of which can be viewed in Table 6.11.
Across all five states, the majority of consumers identified that 81-100%
of a product must be locally produced and/or grown for it to be local. An average of
77% of Delaware respondents identified the 81-100% percentage for local, making up
the largest percentage of respondents across states within this category. Pennsylvania
respondents made up the smallest percentage of respondents within this 81-100% local
percentage averaging 67%. Overall an average of 72% of respondents identified the
81-100% category for a product to be considered local, with 15% of respondents
identifying the 61-80% category for local ingredients.
Also of interest was determining from how many miles away a food
product could originate from for it still to be considered local. Results from this
question can be viewed in Table 6.12. Maryland and Virginia respondents provided
the largest mileage distance averaging 84 miles, with Delaware respondents having the
next largest mileage distance averaging 78 miles. As Pennsylvania respondents
reported a mileage averaging 75 miles, it is difficult to make a generalization between
mileage and state size from these results. New Jersey respondents reported the
smallest mileage distance averaging 68 miles. Overall, across all five states the
average mileage distance reported was around 78 miles.

75
Table 6.11. “For you to consider a food product to be "local", what percentage of that product needs to be produced
and/or grown locally?”
Table 6.12. “I consider a food product to be local if it is ____ miles away.”
1 1Outlier with a value of 3,000 removed
0-20%
21-40%
41-60%
61-80%
81-100%
State Number % Number % Number % Number % Number %
Delaware 6 1.49 12 2.99 20 4.99 55 13.72 308 76.81
Maryland 0 0.00 8 2.42 25 7.58 47 14.24 250 75.76
New Jersey 3 0.96 11 3.53 23 7.37 53 16.99 222 71.15
Pennsylvania 6 1.68 10 2.8 40 11.2 61 17.09 240 67.23
Virginia 7 2.27 8 2.6 36 11.69 48 15.58 209 67.86
Overall 22 1.29 49 2.87 144 8.43 264 15.45 1229 71.96
Respondents
Mean
Standard
Deviation Number
Delaware1
78.10 74.45 376
Maryland 83.83 57.35 308
New Jersey 67.71 50.08 285
Pennsylvania 75.10 78.38 344
Virginia 83.72 66.34 301
Overall1
77.76 67.27 1614
75

76
In addition to defining what is local from a mileage standpoint, it was of
importance to determine whether other geographical boundaries such as state, county
and nearby states could be used to help define local. Respondents were asked to rate
their agreement with a series of statements on a scale from 1 to 5, with 1 meaning
strongly agree and 5 meaning strongly disagree, for the question “I consider a food
product produced and/or grown within this area to be „local‟”. These statements, as
well as results by state and overall, can be found in Table 6.13.
For each state, respondents exhibited the strongest agreement for a food
product from „in my county‟ as being local with an average response of „agree‟. For
every state but Delaware, respondents next agreed strongest with the statement „up to
100 miles away in my state‟ for a food product to be considered local, again with an
average rating of „agree‟. Delaware respondents, however, agreed the next strongest
with the statement „anywhere in my state regardless of distance‟ with a rating of
„agree‟. As Delaware is the smallest state out of the five surveyed, it makes sense that
respondents from this state might consider a food product from anywhere in the state
as local. For every state but Pennsylvania, respondents gave the statements „in my
county‟, „up to 100 miles away in my state‟, and „anywhere in my state regardless of
distance‟ an average rating between „neutral‟ and „agree‟.
For the statement „up to 100 miles away in a surrounding state‟,
respondents across all five states on average were neutral as to whether food products
from this geographical location were local. Respondents from each state additionally
gave a rating of „disagree‟ to „neutral‟ for the statement „anywhere in a surrounding
state regardless of distance‟.

77
An additional component to this question was whether or not respondents
considered a food product to be local if it came from any of the other four individual
states included. Delaware respondents gave the highest agreement rating for „in
Maryland‟ with an average agreement of „neutral‟ for food products from in Maryland.
As Maryland is the state which primarily borders the largest geographical area of
Delaware, this result is not surprising. Delaware respondents also gave an average
rating of „neutral‟ to food products being considered local from New Jersey and
Pennsylvania, which are Delaware‟s other two neighboring states, and an average
rating of „disagree‟ for food products from Virginia being local.
Respondents from the four remaining states exhibited a slightly lower
agreement for each state than was seen in Delaware. Maryland, New Jersey, and
Pennsylvania respondents on average rated their agreement with food products being
local from each of the listed states between „disagree‟ to „neutral‟. Virginia
respondents exhibited some of the lowest agreement ratings for each state, averaging
around „disagree‟ when asked to consider whether food products from within these
states were local.

78
Table 6.13. "I consider a food product produced and/or grown within this area to be 'local'…."1
Delaware
Maryland
New Jersey
Mean
Standard
Deviation Number
Mean
Standard
Deviation Number
Mean
Standard
Deviation Number
In my county 3.85 1.32 368 3.90 1.41 322 3.75 1.38 299
Up to 100 miles
away, in my state 3.62 1.08 361
3.63 1.20 318
3.65 1.09 298
Anywhere in my
state, regardless of
distance
3.75 1.06 370
3.26 1.24 324
3.46 1.16 299
Up to 100 miles
away, in a
surrounding state
3.13 1.19 363
3.12 1.28 322
2.91 1.13 295
Anywhere in a
surrounding state,
regardless of
distance
2.50 1.02 365
2.50 1.14 319
2.44 1.00 295
In Delaware …… ……. …… 2.47 1.24 319 2.20 1.02 294
In Maryland 2.90 1.11 365 …… …… …… 2.00 0.89 293
In New Jersey 2.83 1.16 364 2.13 1.06 318 …… …… ……
In Pennsylvania 2.79 1.12 365 2.40 1.18 319 2.34 1.02 293
In Virginia 2.40 1.03 365 2.60 1.24 319 1.99 0.89 293
78

79
11 meaning strongly disagree and 5 meaning strongly agree
Pennsylvania
Virginia
Overall
Mean
Standard
Deviation Number
Mean
Standard
Deviation Number
Mean
Standard
Deviation Number
3.83 1.33 341 3.95 1.33 287 3.85 1.35 1617
3.63 1.07 338
3.75 1.10 286
3.65 1.11 1601
2.83 1.09 339
3.06 1.12 290
3.28 1.18 1622
2.99 1.18 337
2.85 1.22 284
3.01 1.21 1601
2.36 1.05 335
2.27 1.00 289
2.42 1.05 1603
2.28 1.11 334 1.85 0.95 282 2.21 1.11 1229
2.22 1.06 336 2.21 1.14 285 2.36 1.11 1279
2.38 1.16 337 1.80 0.93 283 2.32 1.15 1302
…… …… …… 1.88 0.98 283 2.38 1.13 1260
2.10 1.01 336 …… …… …… 2.28 1.08 1313
79

80
6.6.5 Health and Diet
Lastly, it was of interest to determine how healthy consumers in this
region considered their diet. The results of this question can be viewed in Table 6.14,
as well as broken down by percentages in Table 6.15. Respondents were asked to rate
how healthy they considered their diet on a scale from 1 to 4, with 1 meaning poor and
4 meaning excellent. Respondents from each state were very similar in that on
average they rated their diet as being „good‟. While the majority of respondents from
each state rated their diet within the „good‟ category, the next largest percentage of
respondents for each state rated their diets to be within the „poor‟ category.
Looking at individual differences between states, Virginia was the state
with the highest percentage of respondents within the „poor‟ category, as well as the
largest percentage within the „excellent‟ category. It appears Virginia consumers
display the widest variation when it comes to the health of their diet. Additionally,
New Jersey respondents had the highest percentage of ratings within the „good‟
category.
Table 6.14. “How healthy do you consider your diet?”1
Respondents Mean Standard
Deviation Number
Delaware 2.88 0.63 381
Maryland 2.90 0.68 334
New Jersey 2.88 0.61 305
Pennsylvania 2.88 0.63 348
Virginia 2.88 0.70 304
Overall 2.88 0.65 672
11 meaning poor and 4 meaning excellent

81
Table 6.15. “How healthy do you consider your diet?” (Breakdown of responses)
Poor
Fair
Good
State Number % Number % Number %
Delaware 4 1.05 88 23.10 239 62.73
Maryland 6 1.80 78 23.35 193 57.78
New Jersey 6 1.97 59 19.34 205 67.21
Pennsylvania 2 0.58 85 24.42 213 61.21
Virginia 8 2.63 73 24.01 171 56.25
Overall 26 1.56 383 22.91 1021 61.06
Excellent
Number %
50 13.12
57 17.07
35 11.48
48 13.79
52 17.10
242 14.47
82
Chapter 7
DISCUSSION AND CONCLUSIONS
7.1 Conclusions and Implications
Undoubtedly consumer preference for local exists in the Mid-Atlantic
region. The CE results of this study indicate more generalized buy local promotions
would be more effective than state specific promotions, and could be targeted by
county and/or state region. Other survey question results suggest that the Mid-Atlantic
consumer considers an area in their county, as well as up to 100 miles away in their
state, to be local. This supports earlier findings by Hu et al. (2010) who found
consumers considered local to be an area less than 100 miles, as well as previous work
by Brown (2003) who also uncovered that consumers consider an area smaller than the
borders of their state to be local.
This study suggests that especially for larger states, consumers‟ definition
of what they consider to be local is likely a region smaller than just the borders of their
state. Delaware, the smallest state surveyed (and second smallest in the country) had a
higher agreement rating with anything in their state being local, regardless of distance.
This suggests that for many larger states, state promotional promotions may not be
effectively capturing the local foods consumer. It would be more beneficial for these
state marketing agencies then to focus on local promotions on a county and regional
level rather than just statewide. Perhaps in the future more county promotional
programs will be seen than statewide promotional programs.

83
Additional findings from this study suggest programs in Delaware,
Maryland, and Pennsylvania would need to focus on consumer awareness if their
programs were to succeed. There is an additional opportunity for state promotional
programs in all five states to improve Mid-Atlantic consumers‟ opinion of them.
Delaware‟s state marketing agency is likely headed in the right direction by choosing
to discontinue their program, as the results of this study would have supported their
earlier decision. State marketing agencies in these three states then may decide their
programs are not worth continuing, as was the case in Delaware.
The results of this study also suggest an additional challenge for programs
in Maryland, Pennsylvania, and Virginia. With respondents from these states
exhibiting a smaller preference difference between state program and non-local than
was seen in the other two states, it will be difficult for these programs to succeed. As
consumer interest in local continues, it will be interesting to follow whether these state
marketing programs do as well.
As New Jersey‟s program Jersey Fresh is well established and more
heavily promoted than programs in other states, New Jersey will likely continue
building off of their program‟s current success. The results of this study suggest New
Jersey is presently the only Mid-Atlantic state with a marketing program that is
successfully capturing the local foods consumer. Producers and marketers eligible to
use the Jersey Fresh slogan on their food products would be wise to do so when
targeting the New Jersey consumer. Whether or not consumers in other Mid-Atlantic
states would be willing to pay a price premium for Jersey Fresh products would be
useful information for producers and marketers both.

84
Only one state in this study exhibited a higher consumer preference for
organic over natural, indicating consumers in the Mid-Atlantic region likely lack a full
understanding as to the meaning behind these terms. Consumer preference for organic
over natural could be seen in the future as interest in organic continues to grow,
however, consumers would first need to be better educated as to the definitions of
these terms. In this study, consumers did agree the most with organic foods being
more environmentally friendly and safer to consume than state program foods. These
two product attributes could be important when marketing organic products to the
Mid-Atlantic consumer. Producers and marketers looking to gain a price premium for
their organic products would need to incorporate some type of educational component
into their promotional activities.
Additionally, this study suggests that there is an opportunity for farmers‟
markets to capture more shoppers than they are presently. The results of this survey
indicate that consumers across all five states consider their diet to be of „good‟ health.
Therefore, the Mid-Atlantic consumer might be particularly drawn to the types of
fresh, unprocessed products that farmers‟ market venues typically purvey. Similarly,
the findings here indicate higher price premiums for products identified as local at
farmers‟ market venues, compared to grocery store venues. Producers and marketers
then should be actively targeting farmers‟ market venues in the Mid-Atlantic region.
State marketing agencies likewise should also be promoting local products at these
venues, as well as actively encouraging the establishment of such farmers‟ markets
within their state borders. It would also be wise for state marketing agencies to focus
on the promotion and consumer awareness of farmers‟ markets within their state.
85
If the intangible benefits consumers associate with the farmers‟ market
venue can be uncovered, perhaps grocery stores could better appeal to these same
consumers. For example, if consumers are attracted to farmers‟ markets because of
the opportunity to meet area farmers, grocery stores in this same area could similarly
host local producers whose products they carry in-store. Farmers‟ markets in many
areas of the country are often seasonal venues with limited hours and/or days of
operation. It would be helpful information then for grocery store venues, which are
open to consumers year round and with more extended hours, to be able to take
advance of this increased price premium. It is also quite possible that consumers in
this region associate an aspect of health with products from a farmers‟ market venue.
Knowing whether or not similar price premiums exist for fresh products at
a farmers‟ market venue, as compared to value-added products would be helpful
information for marketers, producers and processers. The results of this study indicate
a price premium is present for value-added products purchased at a farmers‟ market
venue. Perhaps an even higher price premium would be uncovered for fresh products,
which are traditionally associated with a farmers‟ market.
7.2 Limitations
Possible limitations of this study include the use of only a processed food
product in the design of the choice experiment. It would be useful to see if differences
in the results arise from the inclusion of both a fresh and value-added food product. In
attempting to define locally grown, a more detailed study focusing on just this might
yield additional results. Although a definition for the term „state marketing program‟
was included on the information sheet accompanying the survey, it could have been
more helpful for respondents if the logo for each state program had been included as

86
well. Unfortunately, approval from each state agency for including such logos was not
able to be obtained.
7.3 Suggestions for Future Research
Whether or not state marketing programs in larger states, such as
Maryland, Pennsylvania, and Virginia should be continued is a topic open for debate.
Certainly Jersey Fresh has been the most successful Mid-Atlantic program in terms of
both consumer awareness and preference. However, they seem to be the exception
rather than the norm. It would be wise for states to explore whether their own
promotional program should be continued, or if a county and/or regionally specific
local program would be more effective. In addition, whether or not consumers in
other Mid-Atlantic states are willing to pay a price premium for Jersey Fresh products
is an area in need of current exploration.
As previously mentioned, a study including both a fresh and value-added
product would be a natural extension from the research conducted here. The results of
this study indicate that a majority of consumers consider a product to be local if it is
between 81-100% locally grown and/or processed. Whether or not consumers are
more stringent or lenient with this percentage, based on whether the product in
question is fresh or value-added, is an area requiring further research.
Investigating whether consumers are more interested in locally grown, as
opposed to organic and/or natural could also be a natural extension of this study and
potentially useful contribution. In the future, as consumers become more educated as
to the meaning behind organic, a price premium for a product both local and organic
could be seen. If such a finding was evident in the future, it would be of importance to
a variety of stakeholders in the Mid-Atlantic region.

87
While previous research has been conducted on the advantages of
farmers‟ markets (Zepeda and Leviten-Reed, 2004), uncovering exactly what benefits
consumers are responding to would be an area in need of further investigation. Once
uncovered, the door opens for a multitude of research opportunities, one of which is
whether these same benefits can be captured in a grocery store setting.

88
REFERENCES
Alfnes, F., A. Guttormsen, G. Steine, and K. Kolstad. 2006. “Consumers' Willingness
to Pay for the Color of Salmon: A Choice Experiment with Real Economic
Incentives.” American Journal of Agricultural Economics 88(4): 1050-1061.
Banerjee, S.B., D. Hudson, and S.W. Martin. 2007. “Effects of Seed and Farm
Characteristics on Cottonseed Choice: A Choice-Based Conjoint Experiment
in the Mississippi Delta.” Journal of Agricultural and Applied Economics
39(3): 657-669.
Batte, M., N. Hooker, T. Haab, and J. Beaverson. 2007. “Putting Their Money Where
Their Mouths Are: Consumer Willingness to Pay for Multi-ingredient,
Processed Organic Food Products.” Food Policy 32(2): 145-159.
Bond, C.A., D. D. Thilmany, and J. K. Bond. 2008. “What to Choose? The Value of
Label Claims to Fresh Produce Consumers.” Journal of Agricultural and
Resource Economics 33(3): 402-427.
Borchers, A.M., J.M. Duke, and G.R. Parsons. 2007. “Does willingness to pay for
green energy differ by source?” Energy Policy 35: 3327-3334.
Brown, C. 2003. “Consumers‟ Preferences for Locally Produced Food: A Study in
Southeastern Missouri.” American Journal of Alternative Agriculture 18(4):
213-224.
Camarena, D.M., and A.I. Sanjuan. 2009. “The influence of psychographic variables
on consumer preferences. The case of ethnic food in Spain.” Presented at the
113th
EAAE Seminar, Chania, Crete, Greece (September 3-6).
Carlsson, F., P. Frykblom, and C. Lagerkvist. 2007. “Consumer Benefits of Labels and
Bans on GM Foods--Choice Experiments with Swedish Consumers.”
American Journal of Agricultural Economics 89(1): 152-161.
Carpio, C.E., and O. Isengildina-Massa. 2009. “Measuring the Potential Impact of a
Regional Agricultural Promotion Campaign: The Case of South Carolina.”
Presented at the 2009 Southern Agricultural Economics Association Annual
Meeting, Atlanta, GA. (January 31-February 3).
89
CBS Videos Online. 2009. “Andy Rooney Goes Fruit Shopping, Talks Local Food.”
(July) Available online at http://www.cbs.com/video/.
Commonwealth of Pennsylvania. 2009. “PA Preferred-Description.” Department of
Agriculture (PDA), Commonwealth of Pennsylvania, Harrisburg. PA.
Available online at
http://www.agriculture.state.pa.us/portal/server.pt/gateway/PTARGS_0_2_244
76_10297_0_43/http%3B/10.41.0.36/AgWebsite/ProgramDetail.aspx?name=P
A-Preferred%c2%ae&navid=12&parentnavid=0&palid=80&. (accessed July
2009).
Commonwealth of Virginia. 2009. “What is Virginia‟s Finest?” Department of
Agriculture and Consumer Services (VDACS), Commonwealth of Virginia,
Richmond, VA. Available online at http://www.vdacs.virginia.gov/vafinest/.
(accessed July 2009).
Darby, K., M. Batte, S. Ernst, and B. Roe. 2008. “Decomposing Local: A Conjoint
Analysis of Locally Produced Foods.” American Journal of Agricultural
Economics 90(2): 476-486.
FoodRoutes Network. 2009. “About the „Buy Fresh, Buy Local’ Chapter Program.”
Available online at http://www.foodroutes.org/bfbltoolbox_1.jsp. (accessed
January 2010).
Gallons, J., U. Toensmeyer, J.R. Bacon, and C.L. German. 1997. “An Analysis of
Consumer Characteristics Concerning Direct Marketing of Fresh Produce in
Delaware: A Case Study.” Journal of Food Distribution Research 28: 98-106.
Gifford, K., and J.C. Bernard. “The Effect of Information on Consumers‟ WTP for
Natural and Organic Chicken.” International Journal of Consumer Studies,
forthcoming.
Giraud, K., C. Bond, and J. Bond. 2005. “Consumer Preferences for Locally Made
Specialty Food Products across Northern New England.” Agricultural and
Resource Economics Review 34(2): 204-216.
Govindasamy, R., and J. Italia. 1999. “Predicting Willingness-to-Pay a Premium for
Organically Grown Fresh Produce.” Journal of Food Distribution Research
30: 44-53.
90
Govindasamy, R., B. Schilling, K. Sullivan, C. Turvey, L. Brown, and V. Puduri.
2004. “Returns to the Jersey Fresh Promotional Program: The Impacts of
Promotional Expenditures on Farm Cash Receipts in New Jersey.” Rutgers
University: Department of Agricultural, Food and Resource Economics, Food
Policy Institute Publication Number: RR-0404-006.
Greene, W.H. 2003. NLogit Version 3.0. Plainview, NY: Econometric Software Inc.
Haaijer, R., W. Kamakura, and M. Wedel. 2001. “The „no-choice‟ alternative in
conjoint choice experiments.” International Journal of Market Research 43(1):
93-106.
Halloran, J.M., and M.V. Martin. 1989. “Should States be in the Agricultural
Promotion Business?” Agribusiness 5: 65-75.
Hanagriff, R., M. Lau, and S. Rogers. 2009. “State Funded Marketing and
Promotional Activities to Support a State‟s Winery Business; Are There
Economics Returns?: A Case Study Using Texas Senate Bill 1370‟s support of
the Texas Wine Industry.” Presented at the Southern Agricultural Economics
Association Annual Meeting, Atlanta, GA. (January 31-February 3).
Hand, M.S., and S. Martinez. 2010. “Just What Does Local Mean?” Choices 25(1).
Hensher, D.A., and W.H. Greene. 2002. “Specification and Estimation of the Nested
Logit Model: Alternative Normalisations.” Transportation Research Part B
36: 1-17.
Horovitz, B. 2009. “Frito-Lay Pitches its Lay‟s Potato Chips as Locally Made.” USA
Today (May 12).
Hu, W., Batte, M., Woods, T. and S. Ernst. 2010. “What is Local and for What Foods
Does it Matter?” Presented at the 2010 Southern Agricultural Economics
Association Annual Meeting, Orlando, FL (February 6-9).
Hu, W., T. Woods, and S. Bastin. 2009. “Consumer Acceptance and Willingness to
Pay for Blueberry Products with Nonconventional Attributes.” Journal of
Agricultural and Applied Economics 41(1): 47-60.
Hughner, R. S., P. McDonagh, A. Prothero, C.J. Shultz II, and J. Stanton. 2007. “Who
are Organic Food Consumers? A Compilation and Review of Why People
Purchase Organic Food.” Journal of Consumer Behaviour 6(2-3): 94-110.
91
Jekanowski, M.D., D.R. Williams, and W.A. Schiek. 2000. “Consumers‟ Willingness
to Purchase Locally Produced Agricultural Products: An Analysis of an
Indiana Survey.”Agricultural and Resource Economics Review 29(1): 43-53.
Kiiskinen, U., A.L. Suominen-Taipale, and J. Cairns. 2010. “Think twice before you
book? Modelling the Choice of Public vs. Private Dentist in a Choice
Experiment.” Health Economics 19: 670-683.
Kuhfeld, W. F. 2009. “Marketing Research Methods in SAS.” SAS Institute Inc.,
Technical Papers. Available online at
http://support.sas.com/techsup/technote/mr2009.pdf.
Long, J. 1997. Regression Models for Categorical and Limited Dependent Variables.
Advanced Quantitative Techniques in the Social Sciences Series, vol. 7.
Loureiro, M.L. and S. Hine. 2002. “Discovering Niche Markets: A Comparison of
Consumer Willingness to Pay for Local (Colorado Grown), Organic, and
GMO-Free Products.” Journal of Agricultural and Applied Economics 34(3):
477-487.
Lusk, J., and D. Hudson. 2004. “Willingness-to-Pay Estimates and Their Relevance
to Agribusiness Decision Making.” Review of Agricultural Economics 26(2):
152-169.
Lusk, J., J. Roosen, and J. Fox. 2003. “Demand for Beef from Cattle Administered
Growth Hormones or Fed Genetically Modified Corn: A Comparison of
Consumers in France, Germany, the United Kingdom, and the United States.”
American Journal of Agricultural Economics 85(1): 16-29.
Martin, A. 2009. “Is a Food Revolution Now in Season?” The New York Times
(March 22).
Mazur, K., and J. Bennett. 2010. “Framing incentive compatibility in choice
modeling.” Presented at the 54th
Annual Conference of the Australian
Agricultural and Resource Economics Society, Adelaide, Australia (February
10-12).
Merriam-Webster Inc. 2010. Merriam-Webster Dictionary.com. Available online at
http://www.merriam-webster.com/.
Onianwa, O., M. Mojica, and G. Wheelock. 2006. “Consumer Characteristics and
Views Regarding Farmers Markets.” Journal of Food Distribution Research
37(1): 119.

92
Onken, K.A., and J.C. Bernard. 2010. “Catching the “Local” Bug: A Look at State
Agricultural Marketing Programs.” Choices 25(1).
Organic Trade Association (OTA) 2010. “Industry Statistics and Projected Growth”
Available online at http://www.ota.com/organic/mt/business.html. (accessed
July 2010).
Packaged Facts. 2007. “Locally Grown Foods Niche Cooks Up at $5 Billion as
America Chows Down on Fresh!” (June 20). Available online at
http://www.packagedfacts.com/about/release.asp?id=918.
Patterson, P.M., H. Olofsson, T.J. Richards, and S. Sass. 1999. “An Empirical
Analysis of State Agricultural Product Promotions: A Case Study on Arizona
Grown.”Agri-business: An International Journal 15(2): 179-196.
Roe, B., E.G. Irwin, and H.A. Morrow-Jones. 2004. “The Effects of Farmland,
Farmland Preservation, and Other Neighborhood Amenities on Housing
Values and Residential Growth.” Land Economics 80(1): 55-75.
Salant, P., and D.A. Dillman. 1994. How to Conduct Your Own Survey. New York:
John Wiley & Sons, Inc.
SAS Institute Inc. 2010. SAS OnlineDoc® 9.2. Cary, N.C: SAS Institute Inc.
Schneider, M.L., and C.A. Francis. 2005. “Marketing Locally Produced Foods:
Consumer and Farmer Opinions in Washington County, Nebraska.” Renewable
Agriculture and Food Systems 20(4): 252-260.
Shuzzler, A., R. Govindasamy, and A. Adelaja. 2003. “A Comparative Evaluation of
Organic Produce Consumers in New Jersey to New York and Pennsylvania.”
Journal of Food Distribution Research 34(1):153-162.
So, Y., and W.F. Kuhfeld. 2009. “Multinomial Logit Models.” SAS Institute Inc.,
Technical Papers. Available online at
http://support.sas.com/techsup/technote/ts722g.pdf.
State of California. 2009. “Research.” Buy California Marketing Agreement (BCMA),
State of California, Sacramento, CA. Available online at
http://www.californiagrown.org/licensing/research.asp (accessed July 2009).
State of Delaware. 2009. “Marketing-Our Services.” Department of Agriculture
(DDA), State of Delaware, Dover, DE. Available online at
http://www.delawarefresh.com. (accessed July 2009).

93
State of Maryland. 2009. “Maryland‟s Best.” Department of Agriculture (MDA),
State of Maryland, Annapolis, MD. Available online at
http://www.marylandsbest.net. (accessed July 2009).
State of New Jersey. 2009. “Jersey Fresh Quality Grading Program.” Department of
Agriculture (NJDA), State of New Jersey, Trenton, NJ. Available online at
http://www.state.nj.us/agriculture/divisions/md/prog/jfqgp.html. (accessed July
2009).
Stegelin, F. 2008. “Consumer Understanding of Buying Local, Fresh, and Safe.”
Presented at the 2008 Conference of the Food Distribution Society, Dublin,
OH. (October 11-15).
The Nielsen Company. 2009. “Natural” Beats “Organic” in Food Sales According to
Nielsen‟s Healthy Eating Report.” NielsenWire (January 21). Available online
at
http://blog.nielsen.com/nielsenwire/consumer/%e2%80%9cnatural%e2%80%9
d-beats-%e2%80%9corganic%e2%80%9d-in-food-sales-according-to-
nielsen%e2%80%99s-healthy-eating-report/.
Thilmany, D., C.A. Bond, and J. K. Bond. 2008. “Going Local: Exploring Consumer
Behavior and Motivations for Direct Food Purchases.” American Journal of
Agricultural Economics 90(5):1303-1309.
U.S. Department of Agriculture. 2008. “National Organic Program Background
Information.” National Organic Program (NOP), U.S. Department of
Agriculture, Washington, D.C. Available online at
http://www.ams.usda.gov/nop.
U.S. Department of Agriculture. 2009. “Farmers Market Growth: 1994-2009.”
Agricultural Marketing Service (AMS), U.S. Department of Agriculture,
Washington, D.C. Available online at http://www.ams.usda.gov/.
U.S. Department of Agriculture. 2010. “Data Sets-Organic Production Overview.”
Economic Research Service (ERS), U.S. Department of Agriculture,
Washington, D.C. Available online at http://www.ers.usda.gov/data/organic/.
U.S. Department of Agriculture. 2010. “Meat and Poultry Labeling Terms.” Food
Safety and Inspection Service (FSIS), U.S. Department of Agriculture,
Washington, D.C. Available online at http://www.fsis.usda.gov/.
94
Vermont Agency of Agriculture. 2009. “Overview of „Local‟ Labels and their
Meanings.” Buy Local Buy Vermont, Vermont Agency of Agriculture,
Montpelier, VT. Available online at
http://www.vermontagriculture.com/buylocal/marketing/buylocal.html.
Yiridoe, E.K., S. Bonti-Ankomah, and R.C. Martin. 2005. “Comparison of Consumer
Perceptions and Preferences toward Organic versus Conventionally-Produced
Foods: A Review and Update of the Literature.” Renewable Agriculture and
Food Systems 20(4): 193-205.
Zepeda, L., and C. Leviten-Reid. 2004. “Consumers‟ Views on Local Food.” Journal
of Food Distribution Research 35(3): 1-6.
95
Appendix I
SURVEY COVER LETTER

96
Appendix II
SURVEY QUESTIONS AND INFORMATION SHEET

97
SURVEY BLOCK 1

98

99

100
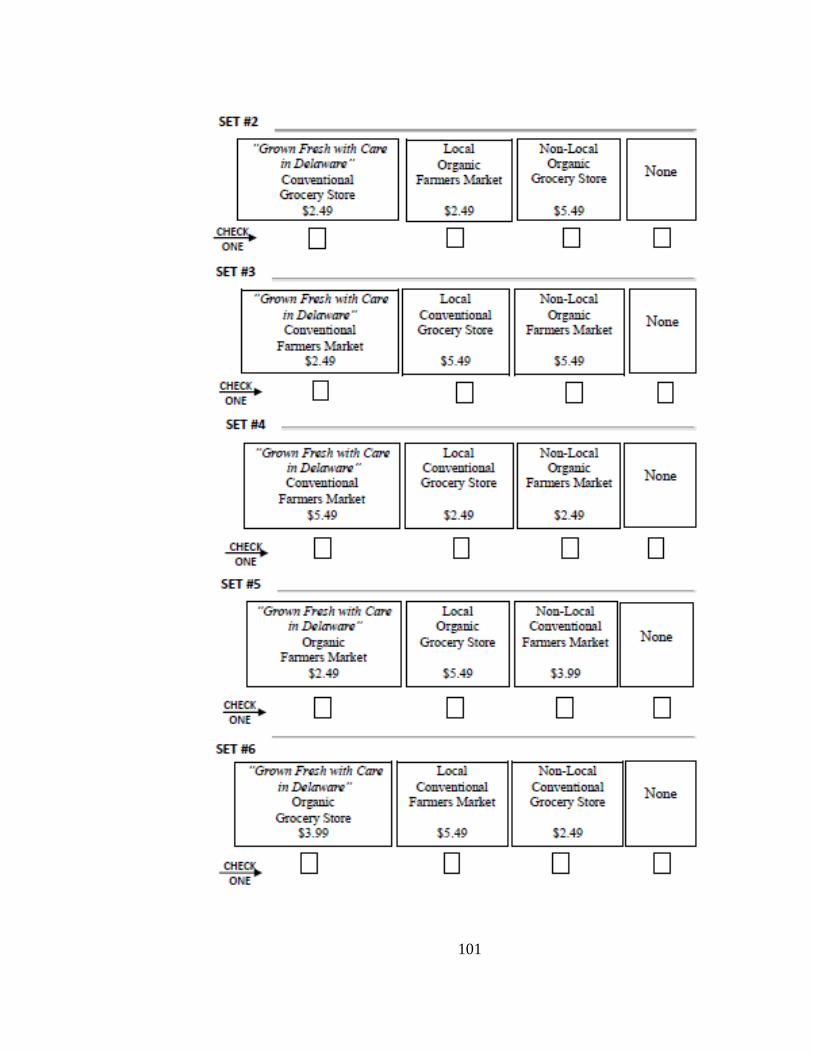
101
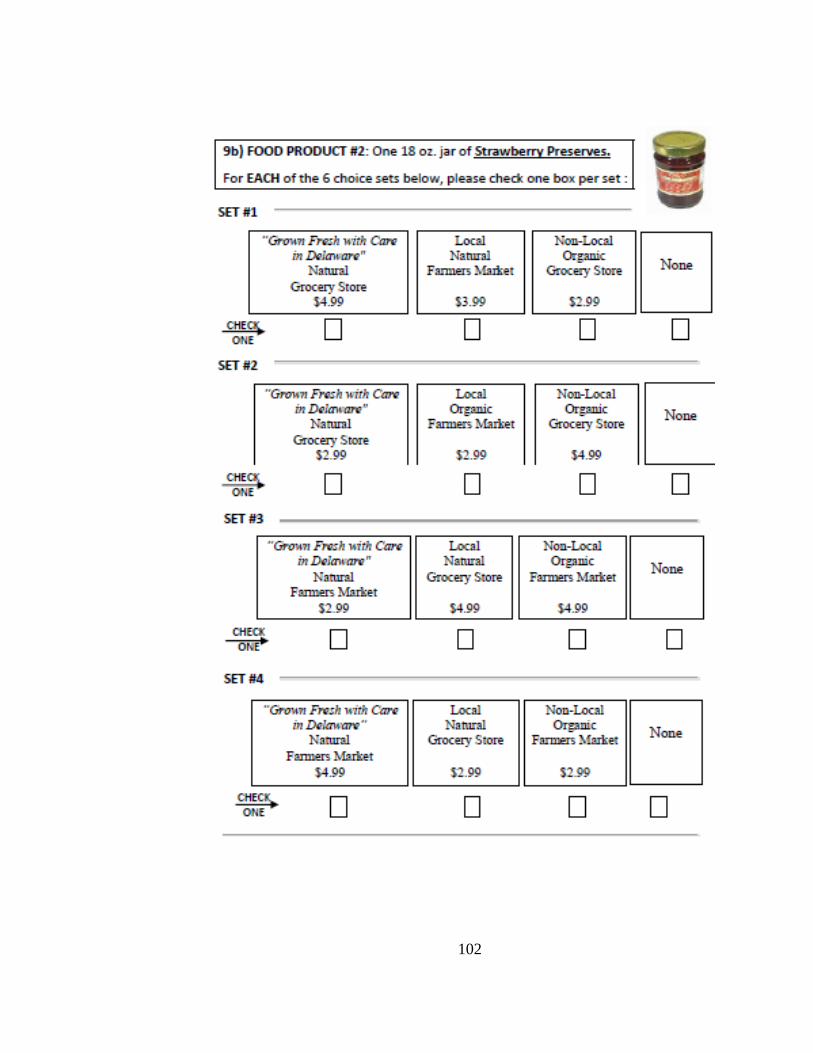
102

103

104

105
SURVEY BLOCK 2

106

107

108

109
Appendix III
SURVEY COMMENTS
State Comments
PA #17 That's not anyone's business. What does that have to do with a food
survey?
MD #4 is impossible to answer if you don't know what "Maryland's Best
Foods" is. I wasn't aware of that program. Good luck! Buena suerte!
PA
98% of food purchases are at the local grocery store. Natural-organic etc.
mean nothing to me. I eat one meal a day usually dinner. But thanks for
asking good luck.
PA Age, education and income do not matter. Since questions were not
answered, did not pertain to our purchasing practices.
VA
All of this seems very silly, but I've answered the survey because the
University of Delaware was kind enough to admit me twice -
undergraduate and graduate - although I didn't attend.
DE All the best in your research. Hope it's not too late. Sorry!!
MD Answered to the best of my ability. Good luck on thesis paper, or survey.
Sorry this is late.
PA Are you posting the completed thesis on the web? These days food price
is very important. I would never pay $5.49 for ANY tomatoes…
MD As I am handicapped, I don't think my answers are really fair as I have to
make a list for someone else to shop.
DE As much as I would prefer to purchase organic products, the cost of the
items casue me to make alternative choices.
MD
As much as I'd like to eat healthier, the cost for local, natural, and organic
food deters me. In my opinion, people who have lower incomes will
purchase foods that are more affordable. I strongly believe more people
would purchase organic , natural and local foods if it was more
comparable in price to products in grocery store.
VA
At first, questions 9a and 9b were confusing, but I think it all depends on
how important some foods are to you. But I might still be confused.
Otherwise, hope I could be of some help to you.
NJ At least give 2-5 dollars. $1.00 is a bit cheap.
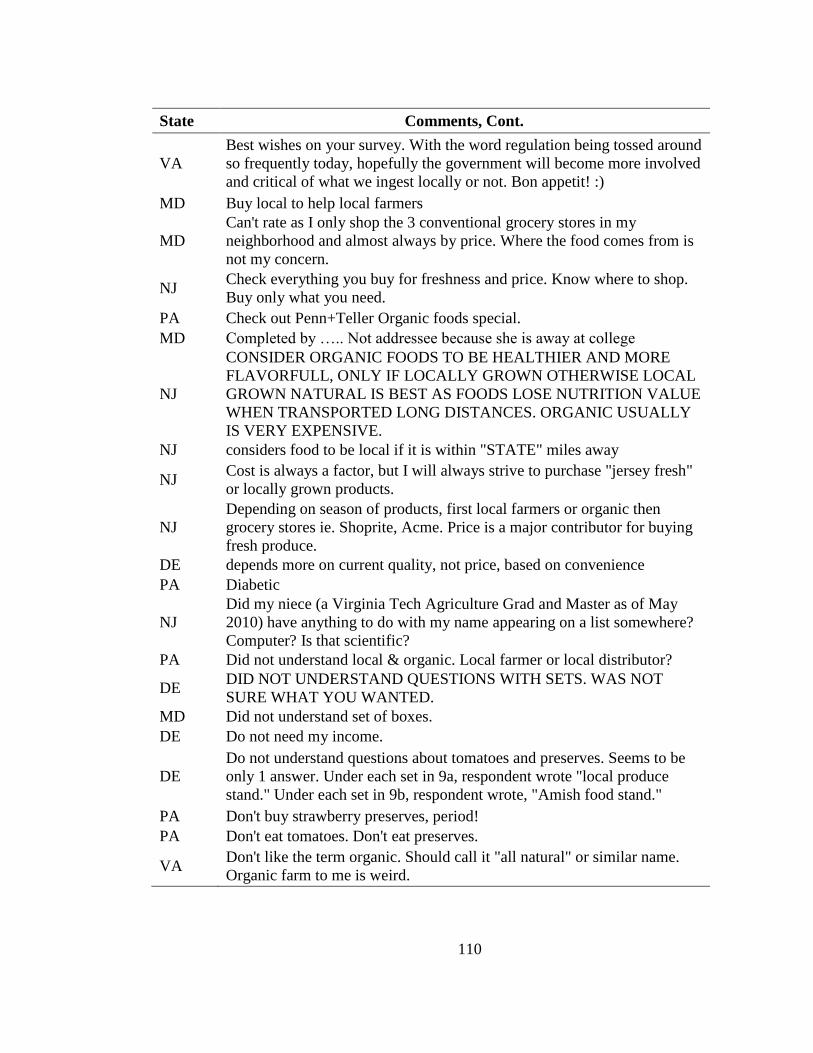
110
State Comments, Cont.
VA
Best wishes on your survey. With the word regulation being tossed around
so frequently today, hopefully the government will become more involved
and critical of what we ingest locally or not. Bon appetit! :)
MD Buy local to help local farmers
MD
Can't rate as I only shop the 3 conventional grocery stores in my
neighborhood and almost always by price. Where the food comes from is
not my concern.
NJ Check everything you buy for freshness and price. Know where to shop.
Buy only what you need.
PA Check out Penn+Teller Organic foods special.
MD Completed by ….. Not addressee because she is away at college
NJ
CONSIDER ORGANIC FOODS TO BE HEALTHIER AND MORE
FLAVORFULL, ONLY IF LOCALLY GROWN OTHERWISE LOCAL
GROWN NATURAL IS BEST AS FOODS LOSE NUTRITION VALUE
WHEN TRANSPORTED LONG DISTANCES. ORGANIC USUALLY
IS VERY EXPENSIVE.
NJ considers food to be local if it is within "STATE" miles away
NJ Cost is always a factor, but I will always strive to purchase "jersey fresh"
or locally grown products.
NJ
Depending on season of products, first local farmers or organic then
grocery stores ie. Shoprite, Acme. Price is a major contributor for buying
fresh produce.
DE depends more on current quality, not price, based on convenience
PA Diabetic
NJ
Did my niece (a Virginia Tech Agriculture Grad and Master as of May
2010) have anything to do with my name appearing on a list somewhere?
Computer? Is that scientific?
PA Did not understand local & organic. Local farmer or local distributor?
DE DID NOT UNDERSTAND QUESTIONS WITH SETS. WAS NOT
SURE WHAT YOU WANTED.
MD Did not understand set of boxes.
DE Do not need my income.
DE
Do not understand questions about tomatoes and preserves. Seems to be
only 1 answer. Under each set in 9a, respondent wrote "local produce
stand." Under each set in 9b, respondent wrote, "Amish food stand."
PA Don't buy strawberry preserves, period!
PA Don't eat tomatoes. Don't eat preserves.
VA Don't like the term organic. Should call it "all natural" or similar name.
Organic farm to me is weird.

111
State Comments, Cont.
VA
Dr. Bernard or Ms. Onken: Please send a copy of the study once
completed to me if you can. You can send an electronic copy to me
at……..
DE
During the summer months, I often purchase fresh produce from the local
market (Marini's Produce) and it is quite good. I am hoping to support
local farmers. My only concern is trying to avoid chemically treated
food/soils. I'm not sure how much pesticide spraying local farmers are
using. I'll gladly pay more knowing the food is organic.
MD
During the summer we grow our own tomatoes etc. I only buy them at the
store during the off season. It's difficult to find a farmer's market at that
time. Price determines a lot of my choices. I'll do without before I'll pay
too much for fresh or organic.
PA Excellent survey - want better labeling on foods with clear definitions.
PA Fresh food prices are way to high for average family to purchase.
Therefore gardening is my hobby source of food.
DE Fresh, locally grown produce is important to me. Unfortunately right now
price is a big factor. If it's too expensive, I buy something else.
NJ Glad to help
PA Good choice of a topic! :)
PA Good luck - I remember research for my master's thesis! If you are like I
was, you need the $1 more :)!
NJ Good luck on your research. It brings back memories for me. Quantitative
research methods in graduate school :)
NJ Good luck on your study and thesis.
MD Good luck on your thesis Kathryn!
PA Good luck with the study. Only too happy to help - price point is very
important. I like Trader Joe's/Whole Foods/Produce Junction
DE Good luck with your project!
MD Good luck with your research.
MD Good luck with your survey. Have never heard of Maryland's Best.Not
too observant! Lol.
PA Good luck with your thesis. I'd like to read it based on survey results!Most
produce we consume is grown in our own "organic" garden!
NJ
Good luck with your work. With nearly a billion people starving
worldwide and 100 species going extinct per day we absolutely need
better agricultural practices.
DE GOOD LUCK!
VA Good luck!

112
State Comments, Cont.
DE Good luck.
MD
Great job doing this research! Sadly, I need to focus on price, but if that
wasn't an issue, I would always choose to support local, organic foods
bought at a farmers or organic market.
VA Great survey - We eat no beef, pork, chicken or turkey for we know not
what they are fed. Fish, oysters and shrimp are the near perfect diet.
PA Guess I am "cheap." Bargains are what we look for when shopping.
Cheers!
DE
Had been unaware of GF in DE until this - but will watch for it in future.
For question 4 I used my Jersey Fresh standard figuring Grown with Care
in DE being equivalent. Being unaware of their program gives their state
marketing a very poor grade.
PA Hard to make some choices because we do not have a definite choice of
organic foods in our area.
VA
Having been raised on a farm in South Dakota, I am fully aware of what
organic fertilizer is. I also have served in Korea and Japan where organic
fertilizer was the norm. Organic banvos?? Yes, organic root crops no!!
You may want to throw out my responses as being biased. P.S. I lived in
Hawaii for some 25 years and I used?? farmer's market a lot.
MD Healthy food should be available to everyone, not just the rich.
DE Hope I helped with this. Thank you.
DE Hope this helps. Merry Christmas!
MD Hope we get to hear the results.
MD How come the envelope isn't big enough?
DE
However, this is only the case since moving to Delaware. In San Jose, CA
we bought at farmer's mkt every Sunday. Here the Farmer's Mkt is
terrible…more like a flea market. Again, it was easy to buy fresh local
produce in California. Here, I know mushrooms are local but not much
else...I am picturing the reality of Hockessin: Acme, Harvest, and Greg's
are the choices...(and apples and bananas at Wawa)
PA
Husband 90 I'm 87. On a fixed income. No longer shop the way we used
to. Etc. etc. goes on despite having not filled out the strong majority of the
questionnaire.
DE
I always buy healthy foods from local conventional grocery stores or local
organic farmers market when available. Jersey corn, Del or Jersey organic
tomatoes and eggs - free roaming hens/organic only. I am a type II
diabetes on dialysis. I have access to my dietary requirements with assoc.
NJ I always buy locally when possible. I assume it is freshest and tastes
better. Stop genetic testing with vegetables.
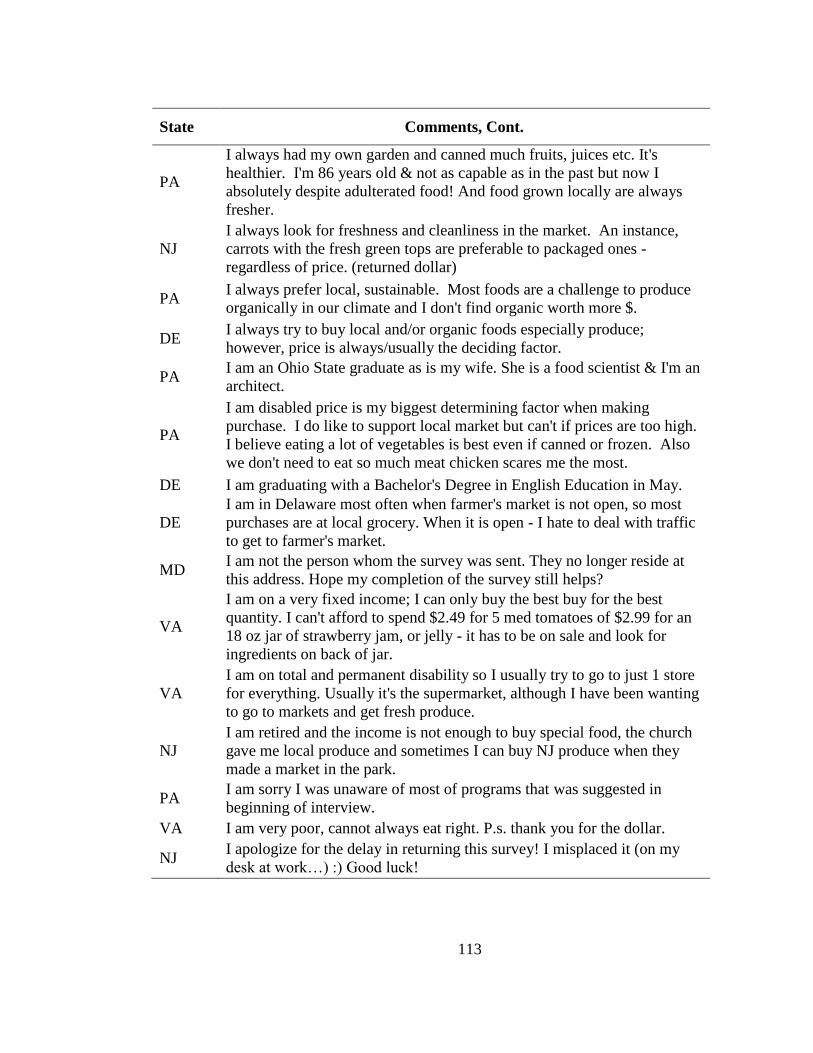
113
State Comments, Cont.
PA
I always had my own garden and canned much fruits, juices etc. It's
healthier. I'm 86 years old & not as capable as in the past but now I
absolutely despite adulterated food! And food grown locally are always
fresher.
NJ
I always look for freshness and cleanliness in the market. An instance,
carrots with the fresh green tops are preferable to packaged ones -
regardless of price. (returned dollar)
PA I always prefer local, sustainable. Most foods are a challenge to produce
organically in our climate and I don't find organic worth more $.
DE I always try to buy local and/or organic foods especially produce;
however, price is always/usually the deciding factor.
PA I am an Ohio State graduate as is my wife. She is a food scientist & I'm an
architect.
PA
I am disabled price is my biggest determining factor when making
purchase. I do like to support local market but can't if prices are too high.
I believe eating a lot of vegetables is best even if canned or frozen. Also
we don't need to eat so much meat chicken scares me the most.
DE I am graduating with a Bachelor's Degree in English Education in May.
DE
I am in Delaware most often when farmer's market is not open, so most
purchases are at local grocery. When it is open - I hate to deal with traffic
to get to farmer's market.
MD I am not the person whom the survey was sent. They no longer reside at
this address. Hope my completion of the survey still helps?
VA
I am on a very fixed income; I can only buy the best buy for the best
quantity. I can't afford to spend $2.49 for 5 med tomatoes of $2.99 for an
18 oz jar of strawberry jam, or jelly - it has to be on sale and look for
ingredients on back of jar.
VA
I am on total and permanent disability so I usually try to go to just 1 store
for everything. Usually it's the supermarket, although I have been wanting
to go to markets and get fresh produce.
NJ
I am retired and the income is not enough to buy special food, the church
gave me local produce and sometimes I can buy NJ produce when they
made a market in the park.
PA I am sorry I was unaware of most of programs that was suggested in
beginning of interview.
VA I am very poor, cannot always eat right. P.s. thank you for the dollar.
NJ I apologize for the delay in returning this survey! I misplaced it (on my
desk at work…) :) Good luck!

114
State Comments, Cont.
DE I believe strongly organic is always best but cannot afford it sometimes. I
wish better didn't mean more cost.
DE I buy when and wherever the product looks fresh and is seasonably priced.
I do not pay attention to marketing programs. (returned dollar)
NJ I can‟t eat tomatoes, I don't like strawberry preserves, I am on a special
diet.
DE I consider a food product produced/grown within 50 miles away from
food stores/food stands to be "local".
NJ
I did not know how to complete 9a and 9b as it made no sense to me. This
is a very poorly prepared survey. You have too many assumptions in these
questions.
VA I did not understand part of this test.
PA I didn't answer the last 7 ?'s as I don't think you have to have personal
information on this questionnaire
VA
I didn't feel I could fully answer some questions about natural organic
foods. Despite your helpful definitions, I was under the impression that
the regulation for labeling foods was still thin. Also, I'd shop more at local
farmer markets, but the hours are limited.
DE
I disregard a "natural" label as meaningless. I consider "organic" to be
meaningless because I don't believe there are concrete standards for a food
to be labeled "organic"
VA
I do not know if my survey will be helpful. I live with my ex-wife and she
does 95% of grocery shopping. I basically pick up odds and ends as
needed. I am a conservative but am rather to the left on environmental
issues other than global warming. When I had a garden space in the past it
was totally organic. Excluding my ex wife my income is 20,000-30,000.
My purchases are based more on price.
DE I do not know of "Grown Fresh with Care in DE" -- am I missing it?
VA I do not share my income. In reference to 9A I make my own.
NJ
I do not shop much and when I do it is at my local supermarket. I do not
look for special foods, just get what I think is a good buy for the $.
Thanks for $1. Good luck in the study. Thanks also for the explanations- I
needed them.
MD I do not tell my income. I shop 5 food stores and 1 farmers market every
month.
MD I don‟t know what you mean
DE I DONATED YOUR $1.00 TO THE FOOD BANK OF DELAWARE.
PA I don't care for the taste of organic food.
VA I don't know if I helped any but I hope so.

115
State Comments, Cont.
MD I don't know of "MD's Best"
DE I feel my food decisions are mainly influenced by price of product. There
aren't many "farmers markets" in my area of food shopping.
NJ
I find this a difficult questionnaire to complete. I don't think along these
lines at all. "Jersey Fresh" should mean something to me but it doesn't. It
would be helpful to know the history of this questionnaire and what it will
be used for.
NJ
I find this a very confusing survey. I would prefer to buy local organic
produce, usually a local farmers market. I do pay the higher price hoping
that it is pesticide free and fresh. I don't like to buy organic in
conventional grocery stores because I don't know where produce is from.
PA
I generally shop at our local grocery chain. In the summer, I like to buy
produce at the Farmer's market close to my home. Price, quality and
freshness matter.
NJ I grew up on a natural farm in the Caribbean. I love to have a little garden.
My mom had a plot in E. Orange
MD I grow all my vegetables. We do lot of canning. I do not grow organic.
PA
I grow my own potatoes that I can myself. Also I put up a lot of my own
cucumbers, peppers and other produce I grow. Also, I make my own
horseradish and sauerkraut; I hunt and fish, so some of the meat we eat is
from the wild game harvest. I don't know this is helpful, but I hope it is.
PA
I grow my own vegetables and make my own jams. I buy eggs and milk
at local farms; that is what I am referring to when I checked "often" for
farmer's market.
PA I grow my own.
DE I grow some of my own produce using a combination of organic and
nonorganic methods. Returned dollar.
MD
I grow strawberries, red/black raspberries, cranberries, tomatoes, mesclun
lettuce, herbs. I bought 10 doz of corn from farmer in PA - I froze it. I buy
groceries from Wegman's, Trader Joes, Millers, Weis, Wal-Mart, etc. I
use cow manure and 10*10*10 for my gardens.
NJ I have 5 adult children, 12 grands, 2 g. grandchildren - also am very
careful and frugal and have a vegetable garden for years.
NJ
I HAVE A LARGE ORGANIC GARDEN IN MY YARD AND SOME
FRUIT TREES AND BERRIES. I BELONGED TO NOFA FOR MANY
YEARS.
PA I have a nice garden grow most of all my vegetables. Freeze and eat. I
buy very little produce in markets.

116
State Comments, Cont.
VA
I have answered these questions in this manner because I believe it is all
hype! An advertising ploy. Charge more for healthy while paying less to
grow it.
VA I have chickens so I get my own eggs and meat. Guess the name of the
breed; it is Delaware.
VA
I have homes in VA and DE -- a few answers may be distorted. I prefer
local farmers markets and price is no issue. Local at the farmers markets
are fresher and often taste better. My husband doesn't care for organic, so
I don't purchase it normally but believe it's far healthier!
DE
I have my own garden & grow much of my own vegetables. I also
purchase vegetables and fruits and preserves from road side stands and
church bazaars.
DE I have never heard of "Grown Fresh with Care in DE." Bring a "Whole
Foods" supermarket to Kent County
PA I have never seen or heard of the PA preferred.
NJ
I have noticed produce is limited such as oranges, have been scarce in NJ
from time to time. And other produce not quite ripe but sold anyway a
"bland" taste to it.
VA I hope I did it right. I am 78 years old. My husband lives with me.
VA I hope this helps. Good luck with your research!
DE
I hope this info helps you achieve the success you are looking for
Kathryn!!! Thanks John for the chance to be heard!!! Use me anytime for
more surveys and studies!!!
NJ I hope you the best. Good luck.
NJ
I kept putting off completing this because it made no sense - it is the worst
laid-out survey I have ever seen - too complicated - not well thought out
to gain a response.
MD I like local, reasonable price, don't care about organic. Fresh food gets
priority-also I like to support the locals.
PA I like natural and organic, but mostly I like local enough that fruits and
vegetables can be picked ripe!
VA I like organic food, but local farmers produce organic food and I like to
support our local economy -
VA I like seasonal foods.
DE I like Shopping the Supermarket
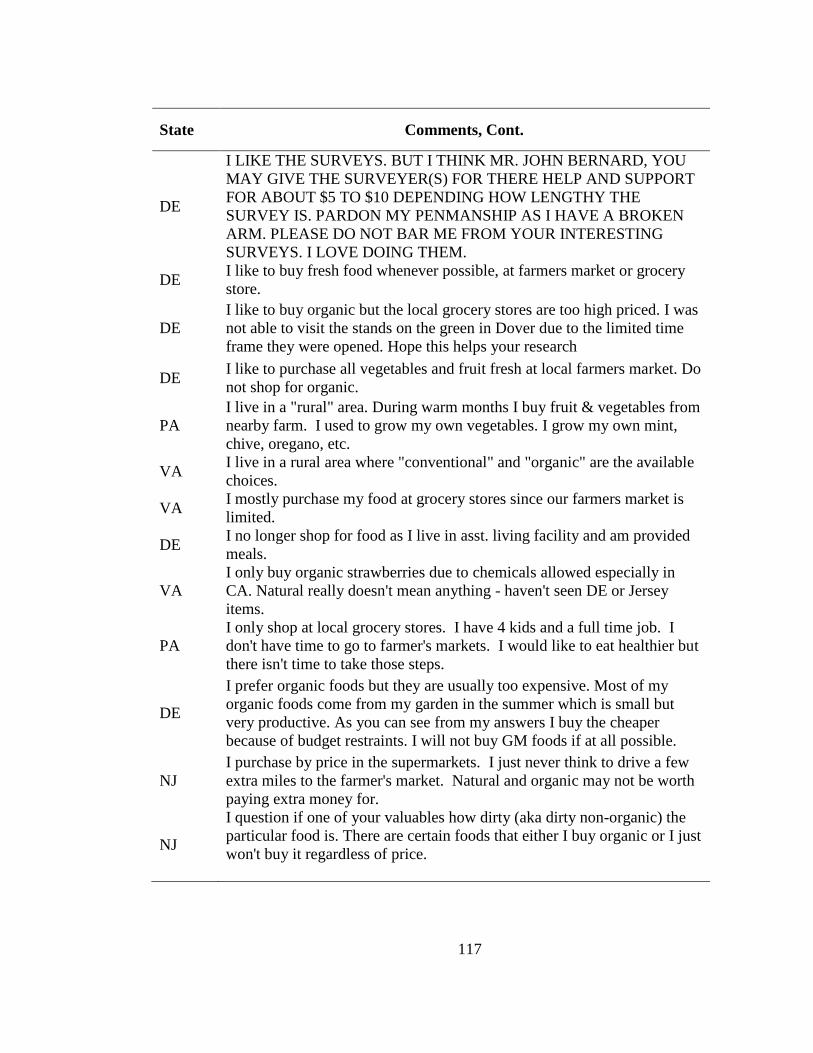
117
State Comments, Cont.
DE
I LIKE THE SURVEYS. BUT I THINK MR. JOHN BERNARD, YOU
MAY GIVE THE SURVEYER(S) FOR THERE HELP AND SUPPORT
FOR ABOUT $5 TO $10 DEPENDING HOW LENGTHY THE
SURVEY IS. PARDON MY PENMANSHIP AS I HAVE A BROKEN
ARM. PLEASE DO NOT BAR ME FROM YOUR INTERESTING
SURVEYS. I LOVE DOING THEM.
DE I like to buy fresh food whenever possible, at farmers market or grocery
store.
DE
I like to buy organic but the local grocery stores are too high priced. I was
not able to visit the stands on the green in Dover due to the limited time
frame they were opened. Hope this helps your research
DE I like to purchase all vegetables and fruit fresh at local farmers market. Do
not shop for organic.
PA
I live in a "rural" area. During warm months I buy fruit & vegetables from
nearby farm. I used to grow my own vegetables. I grow my own mint,
chive, oregano, etc.
VA I live in a rural area where "conventional" and "organic" are the available
choices.
VA I mostly purchase my food at grocery stores since our farmers market is
limited.
DE I no longer shop for food as I live in asst. living facility and am provided
meals.
VA
I only buy organic strawberries due to chemicals allowed especially in
CA. Natural really doesn't mean anything - haven't seen DE or Jersey
items.
PA
I only shop at local grocery stores. I have 4 kids and a full time job. I
don't have time to go to farmer's markets. I would like to eat healthier but
there isn't time to take those steps.
DE
I prefer organic foods but they are usually too expensive. Most of my
organic foods come from my garden in the summer which is small but
very productive. As you can see from my answers I buy the cheaper
because of budget restraints. I will not buy GM foods if at all possible.
NJ
I purchase by price in the supermarkets. I just never think to drive a few
extra miles to the farmer's market. Natural and organic may not be worth
paying extra money for.
NJ
I question if one of your valuables how dirty (aka dirty non-organic) the
particular food is. There are certain foods that either I buy organic or I just
won't buy it regardless of price.

118
State Comments, Cont.
DE
I RARELY EVER SHOP AT FARMERS MARKETS. I PURCHASE
PRODUCTS MOSTLY BASED ON PRICE AND LOOK FOR
CHEAPEST PRICE. IF PRICE THE SAME THEN BUY LOCAL.
PA I realize the value of surveys & getting people to participate. Please use
the dollar to further your research. Thanks…
VA I really like the home grown food.
VA I resent your waste of my (taxpayer) money to do a stupid survey that has
no readily apparent benefit to anyone except the faculty of UD.
MD I shop at different grocery markets and stores
PA I shop at Giant food store.
MD I shop at the Farmers Market at the Cantonville location once a week
when it is open from the spring until it closes before Thanksgiving.
MD I shop by the cost at the grocery store.
NJ
I shop for good bargain items & I dislike having to choose non-USA
produce - local (in NJ) nearby farm products are trusted to be at least -
natural - but who knows?
DE I shop military commissaries. I have a garden and grow a lot of my own
food.
DE
I think a lot of "organic" is hype. Mostly I purchase canned or frozen off
season, and we garden and eat our own in summer. Otherwise, price
matters most to me.
VA I think we need to eat more food without salt and sugar in it.
NJ
I THINK YOUR RESULTS IN THE FOOD PRODUCT BOXES WILL
BE QUESTIONABLE. HIGHLY CONFUSING AND I GOT TIRED OF
READING SIMILAR CHOICES.
NJ I try to always buy organic for fruit & veggies except for bananas.
MD
I try to buy natural or organic foods. For my basic foods I shop at Whole
Foods in Mt. Washington, Baltimore. The food is excellent; carry out is
especially good.
VA I try to shop at one store to save time.
NJ I try to use a warehouse club. Also, jct., but don't last from there.
DE
I usually shop in Sam's Club and Wal-Mart‟s. We have a farmer's market
but it is sold in large quantities. Organic is questionable most sprays have
ruined good land.
DE
I want to buy local and organic at the regular grocery store, I want to
make one trip for all groceries- do not want to stop at SuperFresh, then
Farmers Market. Just stock conventional grocery stores with more local
and better labeled organic.

119
State Comments, Cont.
MD I was happy to participate in this survey, but found it confusing to
answer…anyway, good luck with your research!
PA I will always purchase organic 1st as long as the produce looks ok. If
organic isn't available then my 2nd choice is local produce.
PA I will always shop the grocery store above all others to avoid extra stops,
regardless of cost.
DE
I will check more closely. What is the correct definition of "local"? Please
place $1.00 in the self addressed stamped letter for a nonprofit
organization and send off for me.
NJ
I would generally support the purchase of organic food if it was within
10% of the price of non-organic food. Would always purchase from a
local "farmers market" if one was closer. Good luck!
PA I would like to clarify not knowing about "PA preferred". I have just
recently moved to Pennsylvania. Thank you-
DE
I would like to have locally grown produce year round. I do have a garden
in the summer for fresh fruit and vegetables. Grown fresh with care in
Delaware I will be on the lookout for this.
DE I would like to see more farmers markets and local produce stands in
southwestern Sussex County!
MD
I would love to eat more organic and locally grown products but the
grocery store is far more convenient than a farmers market. Organic
products can also be very expensive. Thank you for including me in your
survey.
MD I would prefer to buy local organic, but sometimes it's just too expensive.
PA I'd be interested in reading the results of your research.
PA If I had knowledge of "PA Preferred" I would have probably changed
some answers in the "set" questions.
DE If the scales/questions don't show it, I always shop at the closest grocery
store to my house and I often buy whatever produce is on sale.
PA I'm 93 years old and trying to live alone. I'm into frozen food dinners! -
Amen! (dollar returned)
MD I'm getting better with organic and natural foods.
MD
I'm in grad school, so I'm broke and my answers reflect that. If I made
more $, I would favor local more than organic, but it also depends on
what's in season where. Like there's no way I'd ever eat citrus if I was
strictly locavore. So in Feb, I eat lots of grapefruit instead of old local
apples. We have a great food shipment system, and I think it's more
healthy to eat fresh in winter than locally. And thanks for the dollar! :)

120
State Comments, Cont.
VA
I'm interested in your survey results, please let me know if they are
published or posted online. I would go to the farmers' markets more often
if kids were a little older, easier to shop with.
PA
I'm not a good example for the study since I live alone - my husband is in
a nursing home - my shopping is limited but do frequent a farmers market
when I can.
NJ I'm returning your gift of $1.00. Please use for a good purpose. Good luck
with your research.
MD I'm sending your dollar back. I'm glad to help a student out.
PA I'm sorry but I'm not at all familiar with the issues you seem to be working
with.
DE
I'M SORRY YOU DIDN'T RECEIVE THE FIRST ONE I
SENT…HOPEFULLY YOU GET THIS ONE. MERRY CHRISTMAS!
HAPPY NEW YEAR!
PA In my household I purchase the fruits and vegetables and my wife does
the remainder 80% wife 20% husband
NJ In spring- summer, and fall, I tend to buy locally whenever available and
also grow vegetables without sprays.
MD
In summer, I buy as much locally (MD- thru Delaware - to Ocean City -
150 mi radius) as I can at roadside stands, etc. I fill in at supermarkets, i.e.
Super Fresh, Safeway, Giant, rest of the year mostly supermarket. Happy
thanksgiving. Good luck!
PA Income question #17 is not necessary for the survey
NJ Interesting survey.
VA Interesting survey. Good luck! :)
NJ Interesting! As you can see, I am very driven by cost…always have been.
Good Luck!
PA Interesting! Money returned for your good use!! Thank you!
MD It also depends how the product looks. Good luck!
MD It was a pleasure to help.
MD
It will be entertaining to see the results. My focus is on cost and easy
accessibility. I think more education needs to be done on organic, natural,
MD's best - etc. I don't think I have heard of MD's best.
NJ
I've added a dollar for a donation. Sorry it took so long, misplaced survey.
Hope this helps Kathryn's thesis. If I could help in any other way please
respond back. Good luck!
MD I've never tried organic foods. I have a daughter in college so the dollar
needs to be returned because to me education is important.

121
State Comments, Cont.
PA Keep the $1 for future research. Thanks.
DE Keep the $1.00 for your program. Thanks.
PA keep the dollar
NJ Keep the dollar; glad to help.
PA Keep up the good study/investigation relative to health concerns!
VA Kind of an odd survey, but you have to get answers somehow!
PA Let me know if you have any questions! Included email.
MD Local, seasonal products
VA Location, availability and mobility of purchasers would be strong
deciding factors.
DE Make survey in Spanish - be fair to this segment I offer to translate for
free.
PA Meat and dairy foods, I will buy "natural" and organic. For vegetables, I
don't care.
PA Most times organic is the most expensive.
MD Mostly I shop at a warehouse club, twice a month I'll go to a grocery
store. Good luck, grad student! :)
DE Mr. G……... has had a stroke and is in a nursing home and is unable to
fill this out.
PA Much luck on your paper-
VA
My comments is that I plant my own vegetables so I doesn't buy any
vegetables, home grown because I eat more vegetable our of my garden. I
plant them myself I go to grocery store for thing I can't plant.
PA My concerns regarding organic is that I worry the process doesn't kill
micro-organisms that can make you sick
NJ
My family enjoyed shopping at the farmers market near our summer home
in Blairstown, NJ, and a USDA organic farm stand in Newton, NJ, once a
week.
NJ My granddaughter went to the University of Delaware. Good luck with
this!
DE My husband did not fill out the survey-his wife did.
MD
My occupation is a Produce Quality (QA.) Assurance Inspector as well as
the Receiving Dept. manager. For a major produce warehouse in MD.
Also I am a very small farmer afford 60 acres.
DE My opinions are free! I think your study should donate the $ to a food
bank.
NJ
MY PRIMARY CONSIDERATION FOR BUYING FOOD IS THE
PRICE, REGARDLESS OF THE LOCATION BUT WILL BUY FROM
ORGANIC STORE IF THE PRICE IS THE SAME AS OTHERS.

122
State Comments, Cont.
PA My purchasing habits are influenced by "Depression" childhood. Best
value for dollar . Good nutrition.
PA My wife and I both shop for food. Due to the economy price dictates a lot
of our purchases.
PA
My wife and I prefer to buy organic but find ourselves shopping at
conventional stores for convenience. They are on every corner and open
late.
NJ My wife does most of the grocery shopping.
NJ My wife is allergic to strawberries, so I never would buy strawberry
preserves.
DE Need to educate more consumers on the state marketing programs and
Delaware needs to do more to market their program.
MD No token received
DE None at this time. I hope I have helped in survey.
PA On question 9, price overrides other attributes. Thank you for the dollar.
I will donate it to the DE food bank. Good luck with your thesis!
PA Organic food is very good but must be substituted for lesser value because
of price.
NJ
Organic is overpriced and poorly regulated. No standards to rely on and
fancy marketing do not make something healthier. Making harmful
pesticides, hormones, and chemicals and all "GM" ingredients unlawful is
only way to ensure healthier produce.
PA Organic produce in our town is too expensive.
VA
Organic products are too expensive, I just don't bother buying them. Local
products are of course the best. Returning your $1.00 to help with mailing.
Good luck Kathryn with your thesis.
NJ
Our local grocery store carries mostly local (within 20 miles) produce and
always labels which farm the produce comes from. That makes a big
difference in which produce I choose because I like to help out the
"locals".
VA Our stores carry local produce and we select locally produced food when
possible. I pick up what my wife designates.
VA Please contact me regarding survey results.
PA Please do not send anymore.
DE Please don't send any more correspondence to me. Don't like giving my
info to persons I do not know, nor leaving my address.
NJ Please let me know of anything else or any other surveys going on!
PA Please let me know where I can read your results. Thank you!

123
State Comments, Cont.
DE
Please note that if we had a Trader Joe's, Whole Foods, etc., some of my
answers would differ. I'm not really aware of any organic farmers market
locally?! Some of these distributing sites you mention are not easily
available in Newark, or at least I'm not aware of them. I am willing to pay
- however items' availability a problem!
NJ Please send this survey to my friend. J…….
DE Price is a large factor in my choices for groceries.
NJ Price is almost the most important factor, but we are willing to pay a little
more for jersey fresh or locally grown, but not much more.
MD price matters as our income is low. I like farmer's markets and we need to
support local economy by helping local farmers
DE
Price will always be a consideration; 9A and B will skew. We prefer to
buy all US products but since suspension of USDA inspections, there's no
telling what kind of poison or dangerous chemicals we are ingesting due
to lack of current controls.
PA Price would make my choice.
PA
Price, has to do with choice. But if grown "local" and "organic" I am
more likely to purchase those products. "Organically/locally" grown it
would be a better product.
PA
Price, of course, is a factor in what we buy. As we learn more about the
dangers of pesticides, we avoid non-organics when possible (potatoes,
apples, milk) We use organic solutions to gardening problems.
NJ priority order: price - local - w/in NJ
PA Purchasing answers given as if I had all the available choices in our area
which we don't.
MD Q7 local is the state where I live
PA Question 9 could use some further explanation at bit confusing at first.
DE Retired
DE Retired in January 2009. Most of the times buy generic. Organic food are
more expensive- I need to watch my expenses since retirement.
MD
Retuned Dollar "I would like to hear more about your study before giving
you (unknown to me) more of my opinion! Good luck! Eat Treats as long
as it's good"
DE RETURNED $1. LIVE IN NURSING HOME. DO NOT SHOP.
MD Returned Dollar "Good Luck"
PA Send copy of results to …….Thanks and good luck w/survey

124
State Comments, Cont.
MD
Some of the decisions were difficult because I shop at a number of places
and if I'm not at Giant Food, I mainly…?. I shop at MOMS, Trader Joe's,
farmers markets, Giant and occasionally other - price is important. Best
tomatoes get at local farmer's market, their own locally grown heirloom
tomatoes. I'm buying more organic produce now to avoid pesticides...
PA Sorry about the delay. I had very serious problems at home.
NJ Sorry for getting back to you so late. Survey was misplaced. Good luck!
NJ Sorry for the delay, I underwent total knee replacement surgery and hence
the delay. All the best to you.
DE Sorry I'm not willing to answer the last question.
DE Sorry the sharpie went through the pages. Hope you can decipher. Good
luck on project.
VA Sorry this is late!
DE SORRY TO TAKE SO LONG. IF I HAD A FEW CHILDREN IN THE
HOUSE MY CHOICES MIGHT BE DIFFERENT.
PA Sorry to take so long. My wife and I were visiting our son in Western PA
and just got back.
DE
STRAWBERRY PRESERVES WAS A BAD CHOICE BECAUSE I
DON‟T LIKE THEM. A DIFFERENT FRUIT WOULD HAVE BEEN
BETTER.
PA Suggest return date on survey.
VA Thank you Dr. Bernard. Good luck with your research.
VA Thank you for allowing me to participate in your survey.
PA Thank you for allowing us to have some say. Put your $1 towards a better
future.
VA Thank you for asking me to participate!
VA Thank you for offering the dollar bill, but it wasn't necessary. I enjoyed
the survey. Good luck with your project!
DE Thank you for the dollar and good luck with your survey.
DE Thank you for the dollar.
PA Thank you for the gift of $1. Good luck with your efforts.
PA Thank you for the gift. I am giving it back. Thank you for the thought.
VA Thank you for this opportunity in helping your research.
NJ
Thank you for your gift ($1) I shop (food) mainly in Super Markets (Food
Town or Shop Rite or A&P, but at times pick up food at local drugstore or
deli)
NJ THANK YOU SO MUCH AND GOOD LUCK.
NJ Thank you!

125
State Comments, Cont.
VA Thanks for $1.00. I hope I was of help.
DE Thanks for giving me the opportunity to fill this out and hope you have a
great day
VA Thanks for the "buck"
VA Thanks for the $1.00
PA Thanks for the $1.00, but use it for something else.
MD Thanks for the dollar bill. I hope this survey helps you.
VA Thanks for your work. Hope this is not too late
DE Thanks so much for the small token. It added to something I really
needed. God bless you. Send me the survey any time.
NJ THANKS YOU!! HOPE IT HELPS OUT
DE The address used is a seasonal home. Please remove from your mailing
list.
MD The best tomato still comes from one's own back yard!
PA The format of this survey sucks. Feel free to contact me if you need
advice on how to improve its design.
MD
the non-local organic grocery store - few and far between. Maryland's
best natural grocery store - hit or miss in terms of quality, not constant
with selections. To eat healthy means to pay more- prices jump too much.
VA The person to whom this survey is addressed has been deceased for 30
years. Please remove name from your mailing list. Thanks.
MD The purchase choice would depend significantly on the convenience and
availability of farmer's market at time of need.
DE The wife of the intended recipient completed this survey. Good luck with
your study.
PA
There is anything wrong with these types of surveys. But I think using
others info for results, like in newspapers, radios, tvs and towns meetings.
I'm sorry returning this report late. Sorry, again.
NJ Think organic foods are overpriced and don't taste any better.
NJ
This is a difficult survey. Depends on seasons - i.e. tomatoes - I'll buy
from a roadside stand vs. grocery store while in season of the particular
item
MD This is a very good survey because foods are quite important as medicine.
DE This is about how we shop. Not our education or race, income ask about
food.
DE This is really important research. Thank you
DE This survey is a bit confusing.
DE THIS SURVEY WAS FILLED OUT BY J………'S WIFE.

126
State Comments, Cont.
VA
This was sent to an address in Northern Virginia; I spend most of the year
in Southwest Virginia. I don't know if region is important to your study,
but just in case…
VA Time for farmer market coincides with my church schedule. Plan to grow
my own organic fruits and vegetables in the next few years.
PA
To be my age I must be doing something right. Can't believe all on the
labels anyway. Everything is a survey, survey. I am tired of them. Use
common sense.
MD Too much thinking required, make it more simple!
MD Total annual household income mentioned in this survey includes my
wife's earning.
VA Tropical storm "Ida" soaked your mailing!
VA Use Walmart for food source except for meat.
MD
Used to work for a farmer's market in the area, never heard of Maryland‟s
best. Wrote in "southern maryland… so good" as mktg program and rated
it "3"
VA
Very confusing. I live in a "life care" community, and shopping at least
once a week for breakfast and lunch, both of which are light. I have little
control over main food.
PA Very enlightened. Good luck Kathryn Onken.
PA Very long comment about being a caregiver.
PA Was I supposed to factor in travel/convenience when making choices?
Unclear to me. Good luck with your research!
DE We also grow a lot of our own food-garden-
MD We buy organic when we can usually from the grocery store or local
markets.
DE
We do not cook at home very much so I do not buy a lot of groceries. We
do try to buy low fat and sodium foods and no red meats when we do
prepare our food.
DE We grow our own vegetable in the summer all organic.
MD We have a garden, grow some of our own food, we don't like food that has
all those pesticides, etc. in them.
MD We have our own garden, vegetable type in our yard.
MD We purchase garden veggies from you-pick farms on the Maryland,
Delaware border
NJ
We seldom choose any organic products, mostly because of price. We buy
most vegetables and fruits from a local vegetable store. Sometimes the
products are marked Jersey Fresh.
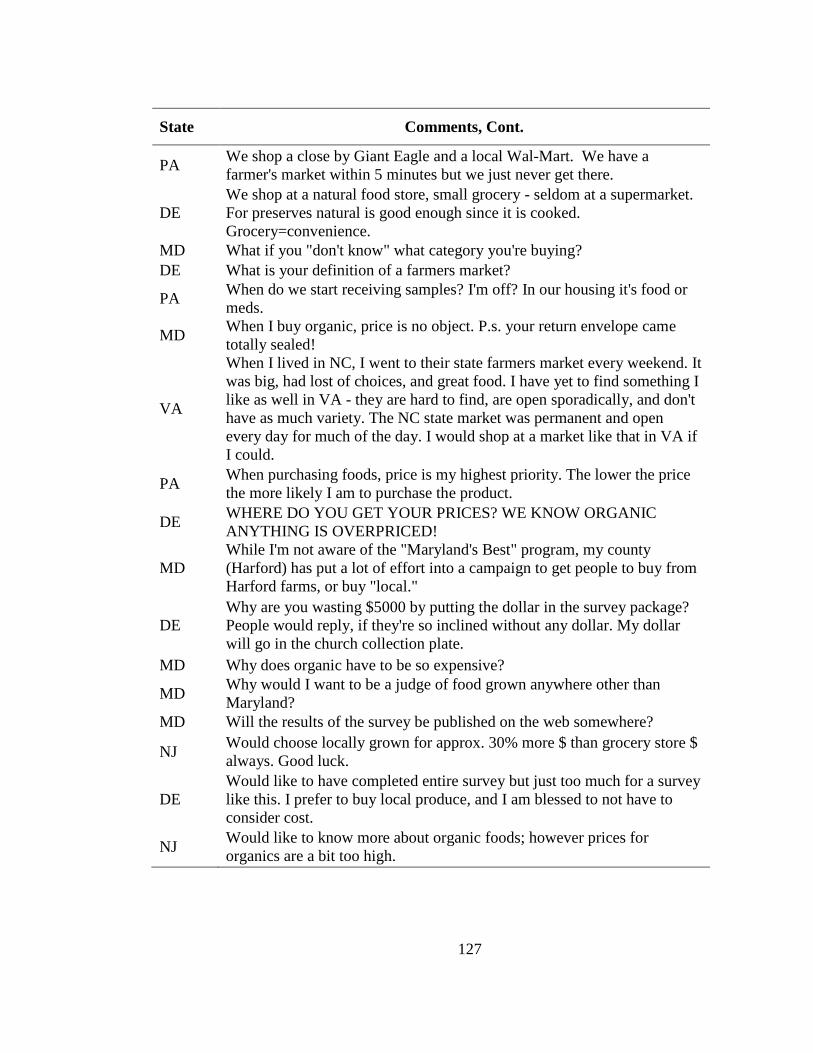
127
State Comments, Cont.
PA We shop a close by Giant Eagle and a local Wal-Mart. We have a
farmer's market within 5 minutes but we just never get there.
DE
We shop at a natural food store, small grocery - seldom at a supermarket.
For preserves natural is good enough since it is cooked.
Grocery=convenience.
MD What if you "don't know" what category you're buying?
DE What is your definition of a farmers market?
PA When do we start receiving samples? I'm off? In our housing it's food or
meds.
MD When I buy organic, price is no object. P.s. your return envelope came
totally sealed!
VA
When I lived in NC, I went to their state farmers market every weekend. It
was big, had lost of choices, and great food. I have yet to find something I
like as well in VA - they are hard to find, are open sporadically, and don't
have as much variety. The NC state market was permanent and open
every day for much of the day. I would shop at a market like that in VA if
I could.
PA When purchasing foods, price is my highest priority. The lower the price
the more likely I am to purchase the product.
DE WHERE DO YOU GET YOUR PRICES? WE KNOW ORGANIC
ANYTHING IS OVERPRICED!
MD
While I'm not aware of the "Maryland's Best" program, my county
(Harford) has put a lot of effort into a campaign to get people to buy from
Harford farms, or buy "local."
DE
Why are you wasting $5000 by putting the dollar in the survey package?
People would reply, if they're so inclined without any dollar. My dollar
will go in the church collection plate.
MD Why does organic have to be so expensive?
MD Why would I want to be a judge of food grown anywhere other than
Maryland?
MD Will the results of the survey be published on the web somewhere?
NJ Would choose locally grown for approx. 30% more $ than grocery store $
always. Good luck.
DE
Would like to have completed entire survey but just too much for a survey
like this. I prefer to buy local produce, and I am blessed to not have to
consider cost.
NJ Would like to know more about organic foods; however prices for
organics are a bit too high.

128
State Comments, Cont.
VA
Would welcome locally grown organic produce, provided prices are
reasonable. We should not have to expend a great amount in order to eat
healthfully (organic).
MD wrote "none of y.b" by income
PA
To me, local means it can be picked in the morning & delivered to my
store or farmer's market by the afternoon; I guess that could happen if the
delivery truck was v.fast.
NJ Wrote his name/address
DE You made me think where I should buy my groceries and if I should get
organic or natural.
DE
You should have a box indicating "prefer not to answer." DK responses
are as valuable as valid response. For question #2 (strawberry preserves), I
do not use this type of product. You might want to add a box asking how
often you purchase these types of product.
NJ Your method of following up on the survey encouraged me to participate.
To be honest I usually throw these types of things away. Good job!!

129
Appendix IV
SAS CODE USED TO GENERATE CHOICE EXPERIMENT
title "Working with the choiceff macro with market" ;
options linesize=80 noovp ;
title2 "Getting a design";
%mktex(2 3 2 2 3 2 2 3 2 ,n=1728,seed=2009081814)
;
data test ;
set randomized ;
run;
proc sql ;
create table test
as select * from test
order by ranuni(2345);
quit;
/*
proc print data=test ;
run;
*/
title2 "Create the Choice design key " ;
data key;
input
Choice $ 1-9 organic $ pricec $ market $;
cards;
Program x1 x2 x3
Local x4 x5 x6
Non-Local x7 x8 x9
None . . .
;
title2 "Create the Choice design key " ;
title2 "Create Choice Design from Linear Design" ;
%mktroll(design=test,
key=key,
alt=choice,
out=designblock)
run;

130
/*
proc print data=designblock ;
by set;
run;
*/
data designblock ;
length price 8;
set designblock;
if pricec='1' then price=2.99 ;
else if pricec='2' then price=3.99 ;
else if pricec='3' then price=4.99 ;
run;
run;
title2 "Use choiceff" ;
%choiceff(data=designblock,
init=designblock(keep=set),
intiter=1000,
iter=1000,
model=
class(choice organic market
organic*market /sta)
identity(price) identity(price*price)
identity(price)*class(organic/sta)
identity(price)*class(market/sta)
,
nalts=4,
nsets=12,
seed=2009082634,
beta=zero)
proc print data=results ;
run;
libname design "." ;
title2 "Create blocks" ;
%mktblock(data=results,nblocks=2,out=design.blocked,nalts=4
,maxiter=1000,
factors=choice
price organic market ,seed=2009100137) ;
data design.blocked;
set design.blocked;
if price=. then price=0;
run;
proc format;
value market 1 = 'FarmersMkt' 2 = 'GroceryStore' ;
value organic 1 = 'Organic' 2 = 'Natural';

131
run;
data design.blocked;
set design.blocked;
format market market. organic organic. ;
run;
proc print data=design.blocked ;
by set notsorted ;
run;
proc freq data=design.blocked ;
tables block*price ;
tables block*market ;
tables block*organic ;
run;
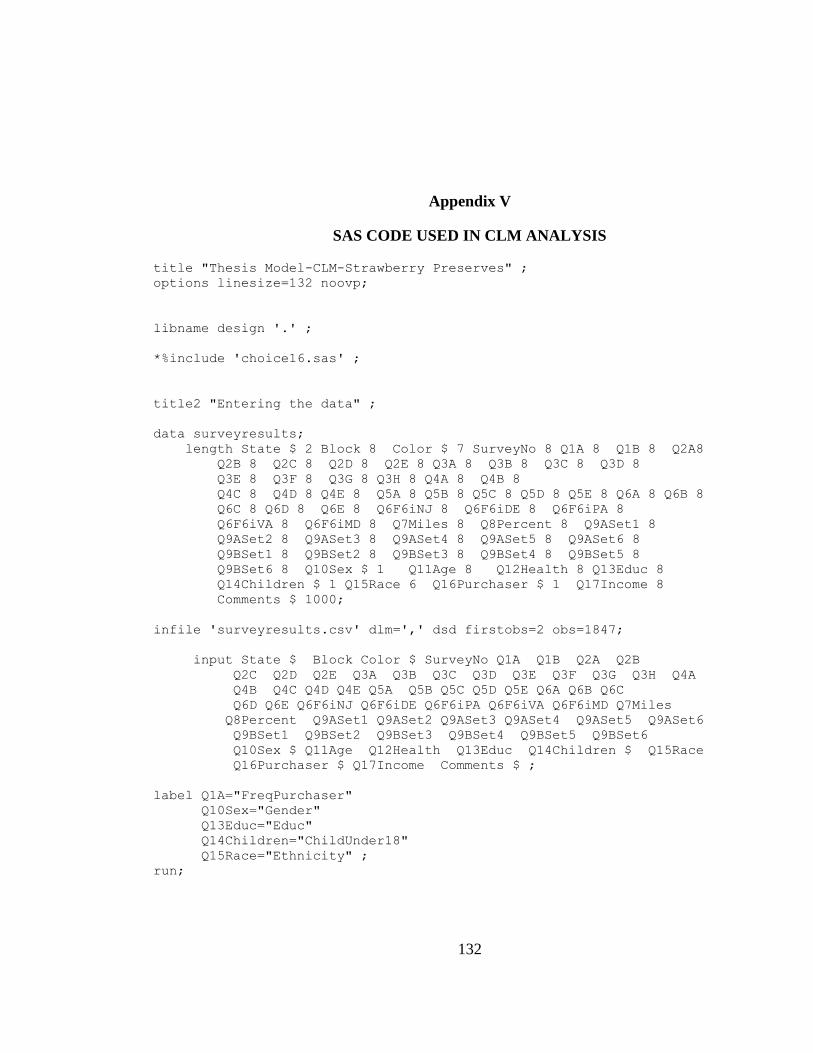
132
Appendix V
SAS CODE USED IN CLM ANALYSIS
title "Thesis Model-CLM-Strawberry Preserves" ;
options linesize=132 noovp;
libname design '.' ;
*%include 'choice16.sas' ;
title2 "Entering the data" ;
data surveyresults;
length State $ 2 Block 8 Color $ 7 SurveyNo 8 Q1A 8 Q1B 8 Q2A8
Q2B 8 Q2C 8 Q2D 8 Q2E 8 Q3A 8 Q3B 8 Q3C 8 Q3D 8
Q3E 8 Q3F 8 Q3G 8 Q3H 8 Q4A 8 Q4B 8
Q4C 8 Q4D 8 Q4E 8 Q5A 8 Q5B 8 Q5C 8 Q5D 8 Q5E 8 Q6A 8 Q6B 8
Q6C 8 Q6D 8 Q6E 8 Q6F6iNJ 8 Q6F6iDE 8 Q6F6iPA 8
Q6F6iVA 8 Q6F6iMD 8 Q7Miles 8 Q8Percent 8 Q9ASet1 8
Q9ASet2 8 Q9ASet3 8 Q9ASet4 8 Q9ASet5 8 Q9ASet6 8
Q9BSet1 8 Q9BSet2 8 Q9BSet3 8 Q9BSet4 8 Q9BSet5 8
Q9BSet6 8 Q10Sex $ 1 Q11Age 8 Q12Health 8 Q13Educ 8
Q14Children $ 1 Q15Race 6 Q16Purchaser $ 1 Q17Income 8
Comments $ 1000;
infile 'surveyresults.csv' dlm=',' dsd firstobs=2 obs=1847;
input State $ Block Color $ SurveyNo Q1A Q1B Q2A Q2B
Q2C Q2D Q2E Q3A Q3B Q3C Q3D Q3E Q3F Q3G Q3H Q4A
Q4B Q4C Q4D Q4E Q5A Q5B Q5C Q5D Q5E Q6A Q6B Q6C
Q6D Q6E Q6F6iNJ Q6F6iDE Q6F6iPA Q6F6iVA Q6F6iMD Q7Miles
Q8Percent Q9ASet1 Q9ASet2 Q9ASet3 Q9ASet4 Q9ASet5 Q9ASet6
Q9BSet1 Q9BSet2 Q9BSet3 Q9BSet4 Q9BSet5 Q9BSet6
Q10Sex $ Q11Age Q12Health Q13Educ Q14Children $ Q15Race
Q16Purchaser $ Q17Income Comments $ ;
label Q1A="FreqPurchaser"
Q10Sex="Gender"
Q13Educ="Educ"
Q14Children="ChildUnder18"
Q15Race="Ethnicity" ;
run;

133
/*
proc print data=surveyresults (obs=100);
run;
*/
data conjoint1;
set surveyresults (keep= State Block SurveyNo Q1A
Q9BSet1 Q9BSet2 Q9BSet3 Q9BSet4 Q9BSet5 Q9BSet6
Q10Sex Q11Age Q13Educ Q14Children Q15Race Q17Income );
where ((State='DE') or (State='NJ') or (State='MD') or (State='PA')
or (State='VA'))
and Q9BSet1 in (1,2,3,4)
and Q9BSet2 in (1,2,3,4)
and Q9BSet3 in (1,2,3,4)
and Q9BSet4 in (1,2,3,4)
and Q9BSet5 in (1,2,3,4)
and Q9BSet6 in (1,2,3,4)
;
run;
/*proc freq data=conjoint1 ;
title "Response breakdown" ;
tables state*(q9bset1-q9bset6) ;
run;
*/
/*proc print data=conjoint1 (obs=100);
run;
*/
/*proc print data=design.blocked;
run;
*/
title2 'Merge Data and Design' ;
%mktmerge (design=design.blocked, data=conjoint1,
out=res2,blocks=Block, nsets=6, nalts=4, setvars=Q9BSet1 - Q9BSet6)
/*title2 'Design and Data Both';
proc print data=res2 (obs=100);
by SurveyNo block; id set SurveyNo;
run;
*/
title2 'Code the Independent Variables' ;

134
proc transreg design norestoremissing data=res2;
model class(choice organic market organic*market )
identity(price) identity(price*price)
identity(price)*class(organic)
identity(price)*class(market);
id state block SurveyNo Q1A Q10Sex Q11Age Q13Educ Q14Children
Q15Race Q17Income set c;
output out=coded ;
run;
*%put variables are &_trgind ;
/*proc print data=coded ;
where choicelocal=. ;
run;
*/
/*proc print data=coded (obs=100);
run;
*/
/* add proc freq statement */
/*proc freq data=coded ;
title2 "Check on NJ choices" ;
where choicenone=1;
table c*state ;
run;
*/
%phchoice(on)
title2 "Multinomial Logit Discrete Choice Model";
data coded ;
set coded ;
if ChoiceLocal=0 and ChoiceNon_local=0 and ChoiceNone=0
then ChoiceProgram=1 ; else ChoiceProgram=0 ;
if state="NJ" then NewJersey=1;
else if state="DE" then NewJersey=0;
else if state="MD" then NewJersey=0;
else if state="PA" then NewJersey=0;
else if state="VA" then NewJersey=0;
if state="MD" then Maryland=1;
else if state="DE" then Maryland=0;
else if state="NJ" then Maryland=0;
else if state="PA" then Maryland=0;
else if state="VA" then Maryland=0;

135
if state="PA" then Pennsylvania=1;
else if state="DE" then Pennsylvania=0;
else if state="NJ" then Pennsylvania=0;
else if state="MD" then Pennsylvania=0;
else if state="VA" then Pennsylvania=0;
if state="VA" then Virginia=1;
else if state="DE" then Virginia=0;
else if state="NJ" then Virginia=0;
else if state="PA" then Virginia=0;
else if state="MD" then Virginia=0;
if state="DE" then Delaware=1;
else if state="MD" then Delaware=0;
else if state="NJ" then Delaware=0;
else if state="PA" then Delaware=0;
else if state="VA" then Delaware=0;
if Q10Sex="F" then Female=1;
else if Q10Sex="M" then Female=0;
if Q14Children="Y" then ChildUnder18=1;
else if Q14Children="N" then ChildUnder18=0;
if Q1A=4 then FreqPurchaser=1;
else if Q1A=5 then FreqPurchaser=1;
else if Q1A=1 then FreqPurchaser=0;
else if Q1A=2 then FreqPurchaser=0;
else if Q1A=3 then FreqPurchaser=0;
if Q13Educ=3 then SomeCollegeorAbove=1;
else if Q13Educ=4 then SomeCollegeorAbove=1;
else if Q13Educ=5 then SomeCollegeorAbove=1;
else if Q13Educ=6 then SomeCollegeorAbove=1;
else if Q13Educ=1 then SomeCollegeorAbove=0;
else if Q13Educ=2 then SomeCollegeorAbove=0;
if Q15Race=1 then AfriAmer=0;
else if Q15Race=2 then AfriAmer=1;
else if Q15Race=3 then AfriAmer=0;
else if Q15Race=4 then AfriAmer=0;
else if Q15Race=5 then AfriAmer=0;
else if Q15Race=6 then AfriAmer=0;
else if Q15Race=7 then AfriAmer=0;
if Q11Age^=. then do;
if Q11Age=1 then Age=21;
else if Q11Age=2 then Age=29.5;
else if Q11Age=3 then Age=40.5;
else if Q11Age=4 then Age=49.5;
else if Q11Age=5 then Age=57;
else if Q11Age=6 then Age=62;

136
else if Q11Age=7 then Age=67;
else if Q11Age=8 then Age=72;
else if Q11Age=9 then Age=77;
else if Q11Age=10 then Age=85;
end;
if Q17Income^=. then do;
if Q17Income=1 then Income=0.5;
else if Q17Income=2 then Income=1.24995;
else if Q17Income=3 then Income=1.99995;
else if Q17Income=4 then Income=2.99995;
else if Q17Income=5 then Income=4.24995;
else if Q17Income=6 then Income=6.24995;
else if Q17Income=7 then Income=8.74995;
else if Q17Income=8 then Income=11.24995;
else if Q17Income=9 then Income=13.74995;
else if Q17Income=10 then Income=17.49995;
else if Q17Income=11 then Income=22.49995;
else if Q17Income=12 then Income=30.0000;
end;
ageage=Age*Age ;
incomeincome=Income*Income;
NCmarket1=(1-choicenone)*market1 ;
NCprice=(1-choicenone)*price ;
NCorganic1=(1-choicenone)*organic1 ;
NCpriceprice=(1-choicenone)*priceprice ;
NCpricemarket1=(1-choicenone)*pricemarket1 ;
NCpriceorganic1=(1-choicenone)*priceorganic1 ;
NCorganic1market1=(1-choicenone)*organic1market1 ;
NJChoiceLocal=NewJersey*ChoiceLocal ;
NJChoiceNone=NewJersey*ChoiceNone ;
NJChoiceProgram=NewJersey*ChoiceProgram ;
NJChoiceNon_Local=NewJersey*ChoiceNon_Local ;
NJNCmarket1=NewJersey*NCmarket1 ;
NJNCprice=NewJersey*NCprice ;
NJNCorganic1=NewJersey*NCorganic1 ;
NJNCpriceprice=NewJersey*NCpriceprice ;
NJNCpricemarket1=NewJersey*NCpricemarket1 ;
NJNCpriceorganic1=NewJersey*NCpriceorganic1 ;
NJNCorganic1market1=NewJersey*NCorganic1market1 ;
MDChoiceLocal=Maryland*ChoiceLocal ;
MDChoiceNone=Maryland*ChoiceNone ;
MDChoiceProgram=Maryland*ChoiceProgram ;
MDChoiceNon_Local=Maryland*ChoiceNon_Local ;
MDNCmarket1=Maryland*NCmarket1 ;
MDNCprice=Maryland*NCprice ;
MDNCorganic1=Maryland*NCorganic1 ;
MDNCpriceprice=Maryland*NCpriceprice ;

137
MDNCpricemarket1=Maryland*NCpricemarket1 ;
MDNCpriceorganic1=Maryland*NCpriceorganic1 ;
MDNCorganic1market1=Maryland*NCorganic1market1 ;
PAChoiceLocal=Pennsylvania*ChoiceLocal ;
PAChoiceNone=Pennsylvania*ChoiceNone ;
PAChoiceProgram=Pennsylvania*ChoiceProgram ;
PAChoiceNon_Local=Pennsylvania*ChoiceNon_Local ;
PANCmarket1=Pennsylvania*NCmarket1 ;
PANCprice=Pennsylvania*NCprice ;
PANCorganic1=Pennsylvania*NCorganic1 ;
PANCpriceprice=Pennsylvania*NCpriceprice ;
PANCpricemarket1=Pennsylvania*NCpricemarket1 ;
PANCpriceorganic1=Pennsylvania*NCpriceorganic1 ;
PANCorganic1market1=Pennsylvania*NCorganic1market1 ;
VAChoiceLocal=Virginia*ChoiceLocal ;
VAChoiceNone=Virginia*ChoiceNone ;
VAChoiceProgram=Virginia*ChoiceProgram ;
VAChoiceNon_Local=Virginia*ChoiceNon_Local ;
VANCmarket1=Virginia*NCmarket1 ;
VANCprice=Virginia*NCprice ;
VANCorganic1=Virginia*NCorganic1 ;
VANCpriceprice=Virginia*NCpriceprice ;
VANCpricemarket1=Virginia*NCpricemarket1 ;
VANCpriceorganic1=Virginia*NCpriceorganic1 ;
VANCorganic1market1=Virginia*NCorganic1market1 ;
label ChoiceProgram="ChoiceProgram"
price="price"
NCmarket1="NCMarket1"
NCprice="NCprice"
NCorganic1="NCorganic1"
NCpriceprice="NCpriceprice"
NCpricemarket1="NCpricemarket1"
NCpriceorganic1="NCpriceorganic1"
NCorganic1market1="NCorganic1market1"
NJChoiceLocal="NJChoiceLocal"
NJChoiceNone="NJChoiceNone"
NJChoiceProgram="NJChoiceProgram"
NJChoiceNon_Local="NJChoiceNon_Local"
NJNCmarket1="NJNCmarket1"
NJNCprice="NJNCprice"
NJNCorganic1="NJNCorganic1"
NJNCpriceprice="NJNCpriceprice"
NJNCpricemarket1="NJNCpricemarket1"
NJNCpriceorganic1="NJNCpriceorganic1"
NJNCorganic1market1="NJNCorganic1market1"

138
MDChoiceLocal="MDChoiceLocal"
MDChoiceNone="MDChoiceNone"
MDChoiceProgram="MDChoiceProgram"
MDChoiceNon_Local="MDChoiceNon_Local"
MDNCmarket1="MDNCmarket1"
MDNCprice="MDNCprice"
MDNCorganic1="MDNCorganic1"
MDNCpriceprice="MDNCpriceprice"
MDNCpricemarket1="MDNCpricemarket1"
MDNCpriceorganic1="MDNCpriceorganic1"
MDNCorganic1market1="MDNCorganic1market1"
PAChoiceLocal="PAChoiceLocal"
PAChoiceNone="PAChoiceNone"
PAChoiceProgram="PAChoiceProgram"
PAChoiceNon_Local="PAChoiceNon_Local"
PANCmarket1="PANCmarket1"
PANCprice="PANCprice"
PANCorganic1="PANCorganic1"
PANCpriceprice="PANCpriceprice"
PANCpricemarket1="PANCpricemarket1"
PANCpriceorganic1="PANCpriceorganic1"
PANCorganic1market1="PANCorganic1market1"
VAChoiceLocal="VAChoiceLocal"
VAChoiceNone="VAChoiceNone"
VAChoiceProgram="VAChoiceProgram"
VAChoiceNon_Local="VAChoiceNon_Local"
VANCmarket1="VANCmarket1"
VANCprice="VANCprice"
VANCorganic1="VANCorganic1"
VANCpriceprice="VANCpriceprice"
VANCpricemarket1="VANCpricemarket1"
VANCpriceorganic1="VANCpriceorganic1"
VANCorganic1market1="VANCorganic1market1" ;
run;
/*title3 "Test dataset" ;
proc print data=coded(obs=100) ;
run;
*/
/*proc freq data=coded ;
table choicenone*price ;
table choicenone*market1 ;
table choicenone*pricemarket1 ;
run;
*/

139
title3 "Using 1-nc interactions-StateProgram & DE as Ref-New Full
Model-Demographic Covariates added";
proc phreg data=coded brief;
model c*c(2) = ChoiceLocal ChoiceNon_Local ChoiceNone
ncmarket1 ncprice ncorganic1
ncpriceprice ncpricemarket1
ChoiceNon_Local*Age ncprice*Age ncorganic1*Age ncpriceprice*Age
ChoiceNon_Local*ageage ncprice*ageage ncorganic1*ageage
ncpriceprice*ageage
ChoiceNone*Income ncprice*Income ncorganic1*Income
ncpriceprice*Income
ChoiceNone*incomeincome ncprice*incomeincome
ncpriceprice*incomeincome
ncorganic1*ChildUnder18
ncorganic1*SomeCollegeorAbove
ChoiceNon_Local*AfriAmer ncprice*AfriAmer
NJChoiceLocal NJChoiceNon_Local
NJNCorganic1
MDChoiceLocal MDChoiceNon_Local
MDNCorganic1
PAChoiceLocal PAChoiceNon_Local
PANCorganic1
VAChoiceLocal VAChoiceNon_Local
VANCorganic1
/ ties=breslow;
strata Block SurveyNo set;
run;
title3 "Using 1-nc interactions-StateProgram & DE as Reference-
Reduced Model for LRTs";
proc phreg data=coded brief;
model c*c(2) = ChoiceLocal ChoiceNon_Local ChoiceNone
ncmarket1 ncprice ncorganic1
ncpriceprice ncpricemarket1
ChoiceNon_Local*Age ncprice*Age ncorganic1*Age ncpriceprice*Age
ChoiceNon_Local*ageage ncprice*ageage
ncorganic1*ageage ncpriceprice*ageage
ChoiceNone*Income ncprice*Income
ncorganic1*Income ncpriceprice*Income
ChoiceNone*incomeincome ncprice*incomeincome
ncpriceprice*incomeincome
ncorganic1*ChildUnder18
ncorganic1*SomeCollegeorAbove
ChoiceNon_Local*AfriAmer ncprice*AfriAmer
NJChoiceLocal NJChoiceNon_Local

140
NJNCorganic1
MDChoiceLocal MDChoiceNon_Local
MDNCorganic1
PAChoiceLocal PAChoiceNon_Local
PANCorganic1
VAChoiceLocal VAChoiceNon_Local
VANCorganic1
/ ties=breslow;
strata Block SurveyNo set;
run;
%include "macro_definition.sas" ;
/*Some Likelihood Ratio Tests*/
/*%ChoiceLRT (ChoiceLocal ChoiceNon_Local ChoiceNone
ncmarket1 ncprice ncorganic1
ncpriceprice ncpricemarket1 ncpriceorganic1
ncorganic1market1
MDChoiceLocal MDChoiceNone MDChoiceNon_Local
MDNCmarket1 MDNCprice MDNCorganic1
MDNCpriceprice MDNCpricemarket1 MDNCpriceorganic1
MDNCorganic1market1,
ChoiceLocal ChoiceNon_Local ChoiceNone
ncmarket1 ncprice ncorganic1
ncpriceprice ncpricemarket1 ncpriceorganic1
ncorganic1market1, test) ;*/
%ChoiceLRT (ChoiceLocal ChoiceNon_Local ChoiceNone
ncmarket1 ncprice ncorganic1
ncpriceprice ncpricemarket1
ChoiceNon_Local*Age ncprice*Age ncorganic1*Age
ncpriceprice*Age
ChoiceNon_Local*ageage ncprice*ageage
ncorganic1*ageage ncpriceprice*ageage
ChoiceNone*Income ncprice*Income
ncorganic1*Income ncpriceprice*Income
ChoiceNone*incomeincome
ncprice*incomeincome ncpriceprice*incomeincome
ncorganic1*ChildUnder18
ncorganic1*SomeCollegeorAbove
ChoiceNon_Local*AfriAmer
ncprice*AfriAmer
NJChoiceLocal NJChoiceNon_Local
NJNCorganic1
MDChoiceLocal MDChoiceNon_Local
MDNCorganic1
PAChoiceLocal PAChoiceNon_Local
PANCorganic1

141
VAChoiceLocal VAChoiceNon_Local
VANCorganic1,
ChoiceLocal ChoiceNon_Local ChoiceNone
ncmarket1 ncprice ncorganic1
ncpriceprice ncpricemarket1
ChoiceNon_Local*Age ncprice*Age ncorganic1*Age
ncpriceprice*Age
ChoiceNon_Local*ageage ncprice*ageage
ncorganic1*ageage ncpriceprice*ageage
ChoiceNone*Income ncprice*Income
ncorganic1*Income ncpriceprice*Income
ChoiceNone*incomeincome
ncprice*incomeincome ncpriceprice*incomeincome
ncorganic1*ChildUnder18
ncorganic1*SomeCollegeorAbove
ChoiceNon_Local*AfriAmer
ncprice*AfriAmer
NJChoiceLocal NJChoiceNon_Local
NJNCorganic1
MDChoiceLocal MDChoiceNon_Local
MDNCorganic1
PAChoiceLocal PAChoiceNon_Local
PANCorganic1
VAChoiceLocal VAChoiceNon_Local
VANCorganic1, test) ;
/*
data coded ;
set coded ;
market1=1-market1 ;
pricemarket1=price*market1 ;
if choicenone=1 then price=-2.99 ;
run;
title3 "ChoiceNone Price change WIth ChoiceNone Interaction" ;
proc phreg data=coded brief;
model c*c(2) = ChoiceLocal ChoiceNon_Local ChoiceNone
ncmarket1 ncprice
ncpriceprice ncpricemarket1
/ ties=breslow;
strata Block SurveyNo set;
run;
title3 "ChoiceNone Price change without Choicenone interaction";
proc phreg data=coded brief;
model c*c(2) = ChoiceLocal ChoiceNon_Local ChoiceNone
market1 price
priceprice pricemarket1

142
/ ties=breslow;
strata Block SurveyNo set;
run;
*/
/*title3 "Using 1-nc interactions-StateProgram & DE as Reference-
Final CLM Model-demographic covariates removed";
proc phreg data=coded brief;
model c*c(2) = ChoiceLocal ChoiceNon_Local ChoiceNone
ncmarket1 ncprice ncorganic1
ncpriceprice ncpricemarket1
NJChoiceLocal NJChoiceNon_Local
NJNCorganic1
MDChoiceLocal MDChoiceNon_Local
MDNCorganic1
PAChoiceLocal PAChoiceNon_Local
PANCorganic1
VAChoiceLocal VAChoiceNon_Local
VANCorganic1
/ ties=breslow;
strata Block SurveyNo set;
run;
*/
%phchoice(off)
There was some concern with how to correctly include the choice No
Purchase within the CLM, as No Purchase is separate from the other three purchase
options present in the design. It was decided to add a constant term to the model in
which the term (1-NoPurchase) was included for the attribute variables. This type of
approach has been explored previously by Haaijer, Kamakura, and Wedel (2001), the
benefits of which include a better predictive fit and unbiased estimates for the
attributes.