why is it so hard for developing countries to make progress? · why is it so hard for developing...
TRANSCRIPT

Why is it so hard for developing countries to make progress?
Ricardo HausmannHarvard Kennedy School of Government &Center for International Development at Harvard UniversityLecture presented at the UN General AssemblyOctober 6th, 2008

Global inequality is huge
Income per capita in the United States is over 50 times larger than in Malawi, Burundi, the Democratic Republic of Congo, Tanzania, Niger, Sierra Leon and Guinea-Bissau. Life expectancy in Japan, Australia and Norway is about twice that in Angola, Central African Republic, Mozambique and ZambiaWhat can explain this?Differences in growth rates over a long period of time

Why is growth important?
It accumulates over timeRemember the 69 rule!Time to double income = 69/Rate of growthYou care about your childrenOn average, mothers are about 25 years older than their children

Why is growth important?Rate of growth
Time to double income
% increase Child - parent
Grandchild/ grandparent
0.5 138.0 13% 1.281 69.0 28% 1.642 34.5 64% 2.693 23.0 109% 4.384 17.3 167% 7.115 13.8 239% 11.476 11.5 329% 18.427 9.9 443% 29.468 8.6 585% 46.90
If two countries start at the same level of incomeand diverge in growth rates by 6 percent per year,
after 50 years one country will be 18.4 times richer than the other

Growth rate in 1980-2005 vs. initial GDPpc
AGO
ALB
ARG
AUSAUT
BDI
BEL
BEN
BFA
BGDBGR
BHR
BLZ
BOLBRA
BTN BW A
CAF
CAN
CHE
CHL
CHN
CIV
CMRCOG
COL
COM
CRIDEUDNK
DOM
DZAECU
EGY ESPEST FIN
FJI
FRA
GAB
GBR
GHA
GMBGNB
GRC
GTMGUY
HKG
HND
HUN
IDNIND
IRL
IRN
ISLISRITAJAM
JOR
JPN
KENKIR
KOR
KW T
LBY
LKA
LSO
LUX
LVAMAR
MDAMDG
MEXMLI
MLT
MOZ
MRT
MUS
MWI
MYS
NAM
NER
NGA
NIC
NLD
NORNPL
NZL
PAK
PAN
PERPHLPNG
PRT
PRY
ROM
RWA
SAU
SDN
SEN
SGP
SLB
SLE
SLVSUR
SWESWZ SYC
SYR
TCD
TGO
THA
TTO
TUN TUR
URY
USA
VCT
VEN
VUTZAF
ZMBZWE
-.02
0.0
2.0
4.0
6.0
8G
25Y
PCLC
U
5 6 7 8 9 10L25.LYPCUSD Log of GDPpc in 1980
Gro
wth
in p
er c
apita
GD
P 19
80-2
005

Global inequality is a recent phenomenon
When Adam Smith wrote “The Wealth of Nations”, the richest country in the world (The Netherlands) had a per capita income about 4 times richer than the poorest country in the world (Nepal)Today, the poorest countries in the world are:
Malawi, Burundi, DR Congo, Tanzania About US$ 700 per capita at PPPA bit less than US$ 2 per day
Four times richer are:Bolivia, Vietnam and Lesotho (~US$ 2,800 per capita)
Four times richer areRussia, Malaysia, South Africa (~ US$ 11,000 per capita)
Four times richer areNorway, USA (US$ 44,000 per capita)
Today the Netherlands are 21 times richer than Nepal

Growth is a relatively recent phenomenon

The great divergence: it did not happen simultaneously across regions of the world

Could these differences be explained by Imperialism?

Is imperialism the reason?Spanish colonialism between 1500 and 1800 did not cause increases in income per capita in SpainLatin American independence circa 1820 was not followed by a catch upAfrica fell behind before the “scramble” of the 1890s…and after independenceCountries never colonized also fell behind
Afghanistan, Thailand, Turkey, EthiopiaCountries that never had colonies also became rich
Switzerland, Italy, Norway, Singapore, KoreaCountries that became independent in the Caribbean fell behind those that are still dependent todayHuge variation of growth within formerly colonized regions

There is huge variation in individual country performance in every region of the world
Imperialism?

East Asia: Korea vs. the Philippines0
5000
1000
015
000
2000
0R
eal G
ross
Dom
estic
Pro
duct
per
Cap
ita (P
WT
6.2)
1940 1960 1980 2000 2020year
PhilippinesKorea

Africa: Botswana vs. Zambia0
2000
4000
6000
8000
1000
0
1940 1960 1980 2000 2020year
Rea
l Gro
ss D
omes
tic P
rodu
ct p
er C
apita
(PW
T 6.
2)
ZambiaBotswana

Latin America: Chile vs. Venezuela40
0060
0080
0010
000
1200
0
Rea
l GD
P p
er c
apita
(Las
peyr
es, P
PP
) (P
WT
6.2)
1940 1960 1980 2000 2020year
Chile Venezuela

Africa vs. Western Europe since 1820
In 1820, Western Europe had an income per capita 2.9 times that of AfricaToday, the difference in income is about 13.1 timesWhat was the differential in growth rates between Western Europe and Africa during the intervening period that is behind today’s income differential?0.9 percent per year from 1820 to 2000This is a small difference compared to what we have seen over the past 25 to 50 yearsDivergence may be gaining strength

The transition to modern growth:what is involved?
Urbanization
Demographic transitionFertility declineMortality decline
Education
Exports
Growth
Technology

Why the differences in growth rates?
Many possible answersSome countries have yet to go through the demographic transition…others face other challengesI will focus on a particular mechanism

Question: How many of the 24 developed countries had their highest GDP per capita before 2000

None
1
3
20
05
1015
20Fr
eque
ncy
2000 2001 2002 2003 2004MAXPCTIME

Take the US as an example15
000
2000
025
000
3000
035
000
GD
P p
er c
apita
(con
stan
t 200
0 U
S$)
- W
DI (
2005
)
19 60 1 97 0 19 80 1 99 0 20 00yea r

Out of 112 developing countries with data since 1980, how many had their maximum GDP per capita before 2000?

67 (58 percent) had their peak before 2000
2 24
6
17
10
4 42
16
49
010
2030
4050
Freq
uenc
y
1960 1970 1980 1990 2000MAXPCTIME
Out of 112 developing countries with data since 1980, how many had their maximum GDP per capita before 2000?

67 (58 percent) had their peak before 2000
2 24
6
17
10
4 42
16
49
010
2030
4050
Freq
uenc
y
1960 1970 1980 1990 2000MAXPCTIME

Zambia GDP per capita
5.4
5.5
5.6
5.7
LYP
CLC
UK
1960 1970 1980 1990 2000year

AFGAGOANT
ARE
ARG
ATG AUSAUT
BDI
BELBENBFABGDBGRBHR
BHS
BLZ
BMU
BOL
BRA
BRB
BTNBWA
CAF
CAN
CHE
CHLCHN
CIV
CMRCOG
COL
COM
CRICYP DEU
DMA
DNKDOM
DZA
ECUEGYESPFINFJIFRA
GAB
GBR
GHA
GMB
GNB
GRC
GRD
GTM
GUYHKG
HNDHTI
HUN
IDN
INDIRL
IRN
IRQ
ISL
ISR
ITA
JAM
JOR
JPN
KEN
KIR
KNA
KOR
KWT
LBR
LBY
LCA
LKA LSOMAR
MDG
MEX MLI
MLTMMR
MOZMRT MUS
MWI
MYS
NAM
NCL
NER
NGANIC
NLD
NOR
NPL
NZL
OMN
PAKPAN
PER
PHL
PNG
PRT
PRY
PYF
ROM
RWA
SAU
SDN
SEN
SGP
SLB
SLE
SLVSUR
SWESWZ
SYCSYR
TCD
TGO
THATTOTUNTUR
URY
USAVCT
VEN
VUT
WSM
ZAF
ZAR
ZMB
ZWE
1960
1970
1980
1990
2000
1960 1970 1980 1990 2000LOCMAXTIMEX
MAXPCTIME LOCMAXTIMEX
Most growth collapses coincide with export collapses
Date of export collapse
Dat
e of
gro
wth
col
laps
e

AFGANT
ARE
BDI
BHS
BOL
BRB
CAF
CIVCMR
COG
COM
DMADOM
DZA
GAB
GHA
GMB
GNB
GRD
GTM
HND
HTI
IDN
IRN
IRQ
ISR
JAM
KEN
KIR
KNA
KWT
LBR
LCA
MDG
MLTMWI
NAM
NCL
NER
NGA
NIC
NPL OMN
PER
PNGPRY
ROM
RWASAU
SEN
SLB
SLE
SLVSUR
SYR
TGO
URY
VEN
VUTZAF
ZAR
ZMB
ZWE
0.2
.4.6
.81
.2 .4 .6 .8 1GAPXPC
GAPPCGDP GAPXPC
Collapses in exports were typically larger than those in output
Fall of exports
Fall
of o
utpu
t

19601961
19621963
1964
1965
1966
19671968196919701971
19721973
1974
19751976
19771978
197919801981
1982
198319841985
1986 19871988
19891990
1991
19921993
1994
1995
19961997199819992000
200120022003
2004
5.4
5.5
5.6
5.7
LYP
CLC
UK
4 5 6 7LXPCKUS
The growth collapse in Zambia
Log of real exports per capita
Log
of re
al G
DP
per
cap
ita

A different perspective
on the development
process

-30-
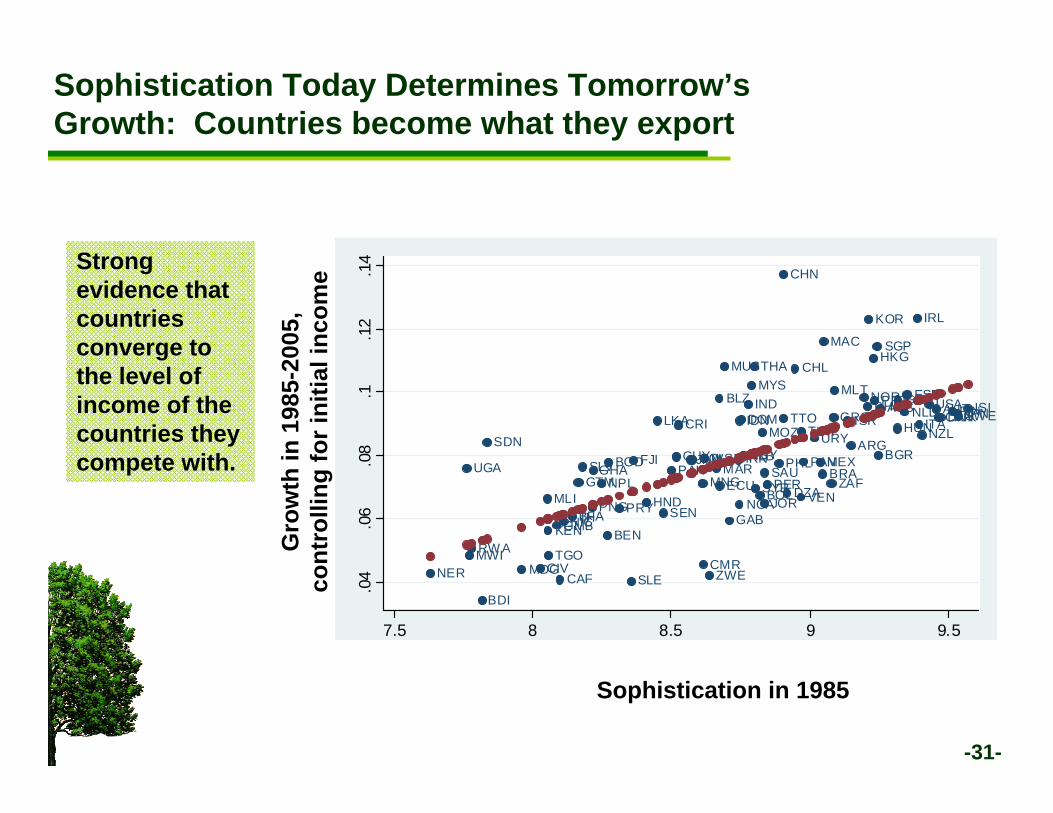
Sophistication of exports is measured as the income per capita of countries with a comparative advantage in the country’s export basket
Rich Countries Produce Rich Country Goods Relationship between per-capita GDP and EXPY, 2003
• Rich countries do not just produce more of the same
•They produce different goods
• To grow rich, countries need to change what they produce and export
-31-
Sophistication in 1985
Gro
wth
in 1
985-
2005
,co
ntro
lling
for i
nitia
l inc
ome
Sophistication Today Determines Tomorrow’s Growth: Countries become what they export
Strong evidence that countries converge to the level of income of the countries they compete with. ALB
ARG
AUS AUT
BDI
BENBFA
BGD BGR
BHRBLZ
BOLBRA
CAF
CAN
CHL
CHN
CIV CMR
COL
CRI DNKDOM
DZAECU
EGY
ESP
ETH
FIN
FJI
GAB
GBR
GHA
GMB
GRC
GTM
GUY
HKG
HND
HUNIDNIND
IRL
IRN
ISLISR ITA
JAM
JOR
JPN
KEN
KOR
LKA
MAC
MAR
MDG
MEX
MLI
MLT
MNG
MOZ
MUS
MWI
MYS
NER
NGANIC
NLDNOR
NPL
NZL
PAK PAN
PERPHL
PNG
PRT
PRY
RW A
SAU
SDN
SEN
SGP
SLE
SLV
SW E
SYR
TGO
THA
TTOTUR
UGA
URY
USA
VEN
WSM
ZAF
ZWE
.04
.06
.08
.1.1
2.1
4
7.5 8 8.5 9 9.5l20l

-32-
How To Advance? Monkeys & Trees
Our metaphor:• Products are like trees• Firms are like monkeys
• Structural transformation: process whereby monkeys move from the poor part to the rich part of the forest• Easier for monkeys to jump short distance(i.e. to change to products that use similar capabilities)

-33-
Moving to different products is more difficult
New products face a chicken and egg problem:• Why create inputs for an industry that does not exist?• How can the industry exist, if the inputs are not there?
In practice, new products use inputs that have been accumulated to serve other “nearby” products• This creates very strong path dependence

-34-
Step 1: Maximum Spanning Tree
Our Approach:• Distance between trees
depends on similarities of required capabilities
• Distance measured by probability that, if a country is good in one product, it’s also good in another product.
• What is the shape of a forest?
– Homogenous or Heterogeneous?
• What does it look like?

-35-
Step 2: Overlay Strong Links
0.4 >
0.4 – 0.55
0.55 – 0.65
0.65 <

-36-
Nodes sized according to PRODY, darker links are stronger (red is strongest)
Step 3: Insert Products

CA Hidalgo, B Klinger, A‐L Barabasi, R Hausmann.Science (2007)

Where are the monkeys?

Where are the monkeys?

Malaysia
1985 2000

Countries face different opportunities to jump to other trees
ALB
ARG
ARM
AUS
AUT
AZE
BDI
BEN
BFA
BGD
BLR
BOL
BRA
CAF
CAN
CHL
CHN
CIV
CMR
COL
CRI
CZEDEUDNK
DOM
DZA
ECU
EGY
ESP
ETH
FIN
GBR
GEO
GHA
GIN
GRC
GTM
HKG
HND
HRV
HTI
HUN
IDNIND
IRL
IRN
ISR
ITA
JAM
JOR
JPN
KAZ
KEN
KGZ
KOR
LBNLKA
LTU
LVAMARMDA
MDG
MEX
MLI MNG
MOZ
MWI
MYS
NERNGA
NIC
NLD
NOR
NPL
NZL
OMN
PAK PANPERPHL
PNG
POL
PRT
PRY
ROM
RUS
RWA
SAUSDN
SEN
SGP
SLE SLV
SVK SWE
SYR
TGO
THA
TJK
TKM
TUR
TZA
UGA
UKR
URY
USA
VEN
ZAF
ZMB
ZWE
1112
1314
15ln
open
_for
est1
b
6 7 8 9 10 11lngdppcppp Income per capita
Ope
n fo
rest
: opt
ion
valu
e of
jum
ping
to o
ther
tree
s

Space to grow in existing products
Ease
to ju
mp
to n
ew
prod
ucts
: ope
n fo
rest
Low High
Low
High
Bridge over troubled waters
Strategic betsLittle space to improve quality
and few nearby trees
Stairway to heaven
Parsimonious industrial policy
Help jump short distances to other products
Let it be
It ain’t brokeAmple space to move
in all directions
Hey Jude: make it better
Competitiveness policyImprove the quality of what
already exists
Strategic approaches

ARG
AZE
BDI
BEN
BGRBLR
BLZ
BOLBRACHL
CHNCOL
CRICYP
CZE
DMA
ECU
EST
GEO
GMB
GTM
GUY
HND
HRVHUN
IDNIND
IRN
KAZ
KGZ
KNA
KORLCA
LTU LVA
MAR
MDA
MEX
MKD
MNGMUS
MWI
MYS
NERNIC
PAN
PER
PHL
POLROM
RUS
SAU
SDN
SEN
SGP
SVKSVN
TGOTHA
TTO
TUNTUR
TZA
UGA
UKRURY
VCT
VEN
ZAF
ZMB
-1.5
-1-.5
0.5
1R
esid
uals
-.6 -.4 -.2 0 .2 .4Residuals
Where are the countries?

Some implications
Why do many poor countries not catch up to rich countries?Because there is no “stairway to heaven” or sequence of nearby trees that can get them to the denser parts of the product space
What causes the “resource curse”? (i.e. bad performance by resource rich countries)
Poor connectedness of the resource intensive sectorsWhy do countries fall into protracted slumps?
Because their existing export products get into trouble when they are in a part of the forest where there are no nearby trees
How to think of the next products?Not by adding value to your limited raw materialsThe example of Finland: from wood to where?
Follow the capabilities, not the products

What should governments do? The public policy challenge
Public and private inputs are deeply complementaryHow to provide highly specific public inputs that are complements in private production?Private inputs:
Prices: informationProfit-motivated firms: incentivesCapital markets: move resources
Public inputs:No price: where to get the information?What are the incentives? Political?Even with incentives, how would resources move?

Four principles for public policy design
Four principlesTransparency
and accountability
Demands, evaluations and
decisions should be public knowledge
Open Architecture
Whenever possible, elicit information about required public inputsCo-financing
Self-Organization
Allow self-organization around
critical inputs. Imposing “industry”
definitions / requiring agreement
is inefficient
Experimentation and
EvaluationBold moves, tolerance for
failures, frequent monitoring,
correction over time

Appendix

Income per capita in Spain did not go up during the Colonial period (1500-1820)
0.5
11.
52
Y
050
0010
000
1500
020
000
GD
P p
er c
apita
(Mad
diso
n (1
990
Inte
rnat
iona
l Gea
ry-K
ham
is d
olla
rs))
1500 1600 1700 1800 1900 2000year
GDP per capita (Maddison (1990 International Geary-Khamis dollars)) Y
Income per capita(left axis)
Income per capita relative to US(right axis)
Independence

Latin America fell behind after Independence circa 1820
.1.2
.3.4
.5Y
010
0020
0030
0040
00G
DP
per
cap
ita (M
addi
son
(199
0 In
tern
atio
nal G
eary
-Kha
mis
dol
lars
))
1800 1850 1900 1950 2000year
GDP per capita (Maddison (1990 International Geary-Khamis dollars)) Y
Income per capita(left axis)
Income per capita relative to US(right axis)

Table 8: Level of GDP per capita within the Caribbean: still dependents, recent independents, old independents Country name Independent from PPP GDP per capita
Still dependent Anguilla AGI . 8,200Aruba ABW . 28,000Bermuda BMU . 33,000British Virgin Islands BVI . 16,000Cayman Islands CYM . 24,500French Guiana GUF 6,000Guadeloupe GLP . 9,000Martinique MTQ 11,000Netherlands Antilles ANT . 24,400Puerto Rico PRI . 10,000Virgin Islands VIR . 15,000
Average 16,827Median 15,000
Recent Independents St. Kitt KNA BRITAIN 7,000Antigua ATG BRITAIN 8,200Belize BLZ BRITAIN 3,200St. Lucia LCA BRITAIN 4,500St. Vincent VCT BRITAIN 2,800Dominica DMA BRITAIN 4,000Suriname SUR NLD 3,400Grenada GRD BRITAIN 4,400Bahamas BHS BRITAIN 15,000Barbados BRB BRITAIN 14,500Guyana GUY BRITAIN 4,800Jamaica JAM BRITAIN 3,700Trinidad TTO BRITAIN 9,500
Average 6,538Median 4,500
Old independents Cuba CUB . 1,700Dominican Rep. DOM . 5,700Haiti HTI . 1,800
Average 3,067Median 1,800

World growth between 1820 and 2000
0.9%13.12.9Western Europe vs. Africa
1.8%21.7273131202Western Offshoots
1.6%15.0192641202Western Europe
1.2%7.55893691Latin America
1.0%5.54454688Former USSR
1.2%7.65901683East European Countries
1.1%5.63807581Asia
0.7%2.51474420Africa
Annual 1820-2000
Cumulative1820-200020001820Region
Source: Maddison (2005)

How different are country growth rates over the last 40 years?
Between 1965 and 2005, the median country grew at 2.9 percent (in a sample of 103 countries, WDI)The difference between the 25th and the 75th percentile was 2 percent per yearThe difference between the 10th and the 90th percentile was 3.7 percent
1 1 1
56
19
2627
8
43
1 1
010
2030
Freq
uenc
y
-.05 0 .05 .1G40YPCLCU
Much greater than the growth differences that causedthe Great Divergence
Histogram of per capita growth rate 1965-2005

China
1975 1985 2000

Mexico
1985 2000