whose and what social media complaints have happier
TRANSCRIPT

Whose and What Social Media ComplaintsHave Happier Resolutions? Evidence fromTwitter
PRIYANGA GUNARATHNE, HUAXIA RUI, ANDABRAHAM SEIDMANN
PRIYANGA GUNARATHNE ([email protected]) is a Ph.D. can-didate in computer information systems at the Simon Business School of theUniversity of Rochester. Before joining Simon Business School, she worked as asoftware engineer in financial markets. Her primary research interests are consumerand organizational behavior on social media, and the use of deep learning andnatural language processing in business.
HUAXIA RUI ([email protected]) is the Xerox Assistant Professor at theSimon Business School of the University of Rochester. He received his Ph.D. fromthe University of Texas at Austin in 2012. His work has been published inManagement Science, Information Systems Research, Journal of ManagementInformation Systems, MIS Quarterly, Production and Operations Management,and others.
ABRAHAM SEIDMANN ([email protected]; corresponding author) isthe Xerox Professor of Computers and Information Systems and OperationsManagement at the Simon Business School of the University of Rochester. Hisresearch and consulting work focuses on the development of advanced analyticaltools for solving real business problems in information-intensive industries, mostrecently in health care, web services, software development, digital supply chains,and automated manufacturing. His research also involves the economic aspects ofinformation technology and its strategic interactions with organizations, markets,and value chain operations. He is a Distinguished Fellow of the INFORMSInformation Systems Society.
ABSTRACT: Many brands try to manage customer complaints on social media, help-ing their customers on a real-time basis. Inspired by this popular practice, in thisstudy, we aim to understand whose and what complaints on social media are likelyto have happier resolutions. We analyzed the complaint resolution experience ofcustomers of a major U.S. airline, by exploiting a unique data set combining bothcustomer–brand interactions on Twitter and how customers felt at the end of theseinteractions. We find that complaining customers who are more influential in onlinesocial networks are more likely to be satisfied. Customers who have previouslycomplained to the brand on social media, and customers who complain aboutprocess-related rather than outcome-related issues are less likely to feel better inthe end. To the best of our knowledge, this study is the first to identify the keyfactors that shape customer feelings toward their brand–customer interactions on
Journal of Management Information Systems / 2017, Vol. 34, No. 2, pp. 314–340.
Copyright © Taylor & Francis Group, LLC
ISSN 0742–1222 (print) / ISSN 1557–928X (online)
DOI: https://doi.org/10.1080/07421222.2017.1334465

social media. Our results provide practical guidance for successfully resolvingcustomers’ complaints through the use of social media—an area that expects expo-nential growth in the coming decade.
KEY WORDS AND PHRASES: airline industry, CLASS methodology, complaint manage-ment, customer service, Klout score, online complaints, social influence, socialmedia, Twitter.
On March 13, 2014, Lauren Munhoven, a customer in Ketchikan, Alaska, turned toTwitter after wasting an hour on the phone with General Motors (GM), trying to gethelp with her 2006 Saturn Ion regarding a GM vehicle recall [16]. After she wrote apublic tweet—“@GM your agents keep telling me to take my car to a GM dealer forthe recall, after I’ve explained I live on an island in Alaska! Help!!!!”—a member ofGM’s Twitter team helped. The company agreed to pay the $600 cost of a round-tripferry to ship Ms. Munhoven’s car to the nearest dealer, about 300 miles away inJuneau, and to pay for a rental car for the time she would be without the Saturn. Ms.Munhoven credited the public nature of complaining on social media with gettingGM’s attention, and she was so pleased that she posted a public thank-you to GM onTwitter.Empowered by social media and mobile technologies, more and more customers
are turning to social media platforms such as Twitter and Facebook to post theircomplaints to brands in real-time. In response, brands are striving to monitor andquickly respond to those complaints to prevent them from festering and damagingtheir reputation. Many consumer brands equip their social media teams with sig-nificant organizational customer relationship management (CRM) experience, aswell as access to the associated CRM system, so that complaints can be effectivelyand efficiently managed online. For instance, airline social media teams today can doflight reservations and rebooking for customers in real-time. In the pre-social-mediaera, customers directly contacted the brand’s customer service call center to beginthe organizational complaint management process, and the communication betweenthe customer and the brand was always kept private and confidential. In contrast,social media has enabled customers to publicly express their dissatisfaction about abrand, and the brand’s dedicated social media team starts a conversation with thecustomer openly. Such conversations are typically open to third-party audiences suchas the followers of the customer, or to anybody if the posts do not assume anyprivacy. The simplicity and timeliness of delivering customer service through socialmedia might quickly turn an angry or unhappy customer into a calm, relieved, oreven happy customer at the end of the interaction, thereby making it more likely thatthe brand will retain the customer.Inspired by this growing phenomenon, in this study, we aim to understand whose
and what complaints on social media are likely to have happier resolutions. On thecustomer side (i.e., whose complaint), we first examine whether a customer’s onlinesocial influence is related to whether the customer would feel better after
CUSTOMER COMPLAINTS ON SOCIAL MEDIA 315

complaining to and interacting with a brand’s social media team. Second, weexamine whether a customer’s past complaints are related to the customer’s com-plaint resolution experience on social media. A customer’s online influence andcomplaint history on social media are probably the two most salient and relevantcustomer characteristics in our context. Both are likely to affect a customer’ssatisfaction with the complaint resolution, and both can be directly measured andeasily used by a brand to customize its social media customer service. On thecomplaint side (i.e., what complaint), we investigate whether customers complainingabout outcome-related issues (i.e., operations) and customers complaining aboutprocess-related issues (i.e., employees) have different degrees of satisfaction abouttheir complaint resolution experience on social media. Prior literature [4, 34] hassuggested different customer perceptions of outcome-related service failure andprocess-related service failure. Therefore, it is both intellectually interesting andpractically important to understand whether the distinction between these two typesof complaints has any implications for customer satisfaction regarding complaintresolution on social media.To address our research questions, we first developed our Closed Loop Analytical
Social Survey (CLASS) methodology, which is an innovative way of learning howhappy a customer felt about an interaction in complaining to a brand’s social mediacustomer service team. We directly queried 1,500 randomly selected customers withrecent complaints to a major U.S. airline on Twitter.We then analyzed the profiles of the complaining customers, their complaints, and
their responses to our survey questions to estimate an ordered logit model. Theestimation results suggest that a customer’s satisfaction with the complaint resolutionexperience on social media is positively associated with the customer’s online socialinfluence and is negatively associated with whether the customer has complainedpreviously to the airline on social media. We also find that a customer’s satisfactionis positively associated with whether the complaint is outcome-related. To alleviatethe concern about potential nonresponse bias, as complaining customers who areunhappier about their social media interaction may also be more likely to respond tosurveys such as ours, we augmented our data with customers who did not respond toour survey and employed a Heckman-type procedure to estimate our model. Theresults are qualitatively the same as our benchmark model and indicate that non-response bias is not likely a major concern in this study.Our study makes important contributions to the field of information systems (IS)
and service management in the social media era. Previous studies mostly looked atthe causes and the sources of consumer complaint behavior [11, 15, 32, 37], and theprocedural determinants of the organizational complaint management process, withspecific focus on repurchase intentions, potential word-of-mouth, and customersatisfaction with the outcomes [4, 7, 9, 34]. To the best of our knowledge, ourstudy is the first to investigate factors that may potentially affect how complainingcustomers would actually feel after their interaction with customer service on socialmedia. Given the growing importance of using social media to deliver customerservice and the sparse literature studying this new phenomenon, our article offers
316 GUNARATHNE, RUI, AND SEIDMANN

timely and much-needed empirical evidence to guide managers in practice. Forexample, our findings suggest that it is worthwhile to customize a brand’s responseto a customer complaining on social media based on the customer’s complainthistory, rather than treating each complaint as completely new. Although a brandmay track complaints received via the traditional complaint management process,whether the same is true for the complaints received via social media is not evident.Thus, our findings on the importance of accounting for customers’ past complaintson social media in providing happier complaint resolutions contribute to the currentliterature on customer complaint management in the age of social media.Another important contribution of our research is the CLASS methodology that we
used to directly survey customers who received customer service through socialmedia. Although many studies have used social media data to study various inter-esting questions, we leverage the power of social surveillance to establish themissing link between researchers and actual customers by using social media datain an active rather than passive manner. Such a methodology can be easily auto-mated and leveraged to generate large amounts of customer satisfaction data, whichcould be extremely valuable to researchers, companies, and policymakers.
Literature Review
The study of complaint management is challenging because complaints and theirhandling are only triggered by a service failure, making systematic empiricalresearch almost impossible to conduct in either a laboratory or a field environ-ment [34]. As a result, it is difficult to find an ideal setup to do causal inferencein a strict sense. Nevertheless, studies in traditional complaint management haveused hypothetical service failure scenarios or incident recall techniques to capturecustomer perceptions about organizations’ complaint-handling processes. Thus,several complaint management frameworks have been developed over the yearsto model satisfaction, and other postcomplaint customer attitudes and behaviors[5, 9, 34, 41].Tax et al. [41] examined the influence of a customer’s justice evaluations on
complaint-handling satisfaction, trust, and commitment, differentiating between thedistributive, procedural, and interactional justice aspects of service. Distributivejustice in complaint handling refers to whether the complaint outcome was perceivedto be deserved, met the customer’s needs, or was fair. Procedural justice refers to theperceived fairness of the complaint-handling process, including quality attributessuch as accessibility, timing/speed, flexibility, process control (i.e., freedom tocommunicate views on a decision process), and decision control (i.e., the extent towhich the customer is free to accept or reject an outcome). Interactional justicerefers to the treatment the complainant receives in the direct interaction with theemployees of the organization, which includes quality attributes such as explanation/causal account, empathy, politeness, honesty, and effort. This justice-evaluationapproach provides a comprehensive list of complaint management quality attributes
CUSTOMER COMPLAINTS ON SOCIAL MEDIA 317
and calls for a dimensional structure, if the different types of perceived justice areinterpreted as quality dimensions of complaint management [36].Another empirically tested approach to conceptualize customer satisfaction with
service encounters involving failure and recovery was presented by Smith et al. [34].Their model provided a framework for considering how the context of service failure(failure type, magnitude) and the attributes of service recovery (compensation,response speed, apology, initiation) influence customer evaluations through discon-firmation and perceived justice, thereby influencing satisfaction with the serviceencounter. Their findings suggest that satisfaction is related positively to perceptionsof distributive, procedural and interactional justice. Also, a customer’s satisfactionlevel after a service failure is shown to depend on both the type and the magnitude ofthe failure. Moreover, all the service recovery attributes show positive effects onperceptions of justice, thereby positively influencing complaint satisfaction.Davidow [9] presented a comprehensive framework of organizational complaint
management, empirically differentiating between organizational response dimen-sions, customer satisfaction, and postcomplaint customer behaviors such as word-of-mouth activity and intention to repurchase. His model subsumed six organiza-tional response dimensions (timeliness, facilitation, redress, apology, credibility, andattentiveness) that incorporated almost all the dimensions mentioned in prior studiesof complaint management. His empirical study found only timeliness, credibility,redress, and attentiveness to have significant positive impacts on satisfaction.Several other studies on traditional complaint management also showed mixed
results regarding which aspects of organizational responses to complaints are mosteffective in shaping postcomplaint customer behavior [10]. Levesque andMcDougall [25] investigated the connection between the type of problem andcustomer dissatisfaction with issues associated with service outcomes, service pro-cess, pricing, and location. Their findings suggest that customers are more likely tovoice a complaint than to exit when they encounter problems and the importance ofthe problem is linked to the rate of taking action. Estelami [13] examined the impactof various procedural determinants of complaint handling such as compensation,employee behavior, and promptness, on the creation of outstanding complaintresolutions. The author found that consumer delight and disappointment with com-plaint outcomes are primarily influenced by the compensatory aspects of complaintresolutions. Strauss and Hill [39] explored company responses to genuine com-plaints via e-mails, and consumer reactions to those responses. They found 47percent of the firms responded to the complaint e-mails, which in turn resulted inhigher customer satisfaction and purchase likelihood. Additionally, response e-mailsthat were sent quickly, addressed the specific problem, and were signed with anemployee’s name resulted in higher customer satisfaction.Although delivering customer service on social media has become very popular
today, there is little empirical research about the effectiveness of this practice. Ourresearch thus fills this gap and contributes to the stream of research literature oncustomer complaint management in the digital age by investigating the key factors inpostcomplaint customer satisfaction in the context of social media and offering
318 GUNARATHNE, RUI, AND SEIDMANN

guidance on how customer service can be successfully delivered through socialmedia platforms.
Development of Hypotheses
Building on the current research literature on complaint management, theories fromsocial psychology, and anecdotal evidence on social customer service, in this sec-tion, we discuss the theoretical background of our hypotheses.
Social Influence
Online social influence is an important concept arising from the popularity of socialmedia and companies’ growing desire to identify potential opinion leaders andinfluential word-of-mouth (WOM) on social media [31, 40]. One popular measureof a person’s online social influence is the person’s Klout score. According toKlout’s official website, klout.com, the Klout score algorithm uses more than 400signals from several leading online social networks (e.g., Twitter, Facebook,Instagram, Foursquare, Blogger, Tumblr, Google+, and LinkedIn) and data fromplaces such as Bing and Wikipedia to construct Klout scores. Since its launch in2008, the Klout score has become a popular marketing tool, as several leadingbrands offer free and exclusive products and experiences (i.e., perks) to high Kloutscorers, who are often happy to spread the brand message on social media, eventhough they are not required to do so. For example, for limited periods in recentyears, American Airlines and Cathay Pacific Airways granted high Klout scorersaccess to their exclusive airport lounges, which would otherwise have been availableonly to their first-class or business-class passengers. Therefore, it is natural toexamine the role of online social influence in shaping the satisfaction judgmentsof customers complaining to brands on social media.There can be at least three potential mechanisms through which customers’ online
social influence might be associated with their judgment about satisfaction regardingthe resolution of a complaint received via social media: (1) the preferential customerservice that may be offered to customers of high social influence, (2) certainpersonality characteristics of highly influential individuals, and (3) highly influentialcustomers’ likely higher level of expectations of social media customer service.Next, we discuss each of these three mechanisms in detail.
Preferential Customer Service
First, a customer with greater online social influence might have a better relationshipwith a brand as a result of preferential treatment (e.g., access to airport lounges). Amore positive relationship between a customer and a brand moderates the customer’semotional reaction to, and results in higher satisfaction with a complaint resolutionexperience [44]. Preferential treatment is the practice of giving some customers
CUSTOMER COMPLAINTS ON SOCIAL MEDIA 319

elevated recognition, and additional or enhanced products and services above andbeyond standard firm value propositions and customer service practices [23]. Forexample, a company may offer preferential treatment to a customer by placing thecustomer higher on a priority list if there is a queue, and giving the customer moreattention or faster service than other customers [35]. Practitioners and academicresearchers have long been interested in identifying high-value customers [8]. Thetraditional view of preferential treatment assumes that the customers earned thespecial treatment through loyalty (i.e., their economic value) or effort. For example,frequent flyer programs offer priority boarding and first-class/business-classupgrades to airlines’ frequent travelers. However, in the age of social media,customers’ online social influence has become an important factor driving a brand’sprioritization decisions. As Allon and Zhang [1] argue, it is not only the value thatcustomers bring in that matters to a company, but also the ability of those customersto influence others in the social network. Prioritization based on a customer’s onlinesocial influence has also become technically convenient in recent years. For exam-ple, Genesys, a global omnichannel customer experience and contact center solutionprovider for business clients, including major airlines, banks, and telecommunica-tions companies, integrated the Klout score into its solutions. This enabled compa-nies that used the Genesys platform to recognize their customers with high Kloutscores and route them to specialized customer service agents, if they wished to doso. Although it is unclear how widely and to what extent preferential customerservice that is based on online social influence has been adopted in practice, recentresearch [20] finds evidence that in the airline industry, customers with larger onlinesocial influence are more likely to receive a response, and also are more likely toreceive a response faster when they complain through social media.While preferential treatment might make a customer happier with the brand and
thus happier with the complaint resolution experience, less-influential customersmay feel unhappy about their overall complaining experience on social media notonly because of the poorer treatment or a less-positive relationship due to poorertreatment, but also because they perceive influence-based preferential treatment asunfair [20]. Previous research indicates that perceived service unfairness inducesnegative emotional reactions, such as feelings of betrayal and anger, as well asbehavioral responses, such as venting and revenge.
Customer Personality Traits
Certain personality characteristics might drive both a customer’s online socialinfluence and satisfaction with complaint resolution. For instance, customers withgreater online social influence may be happier people in general, so even in theabsence of preferential treatment, the very personalities of these influential custo-mers could lead to more-positive feelings about the complaint resolution experience.In fact, empirical studies in psychology show that happy people tend to be morelikable and thus more popular than unhappy people [3, 14]. Although many
320 GUNARATHNE, RUI, AND SEIDMANN

definitions of happiness have been used in the literature, in general, happy indivi-duals are characterized as those who experience frequent positive emotions, such asjoy, interest, and pride, and infrequent (though not absent) negative emotions such assadness, anxiety, and anger [27]. Social influence is often associated with socialdominance [42]. Lucas et al. [26] found that across the world, positive feelings wereassociated with tendencies for affiliation, dominance, excitement seeking, and socialinteraction. Furthermore, influence has been shown to be associated with the BigFive personality trait, emotional stability, which is a person’s ability to remain calmwhen facing pressure or stress [26, 29].1 Does this imply that the unobservedpersonality features related to a person’s general level of happiness and emotionalstability cause people to be more influential in online social networks? Although theliterature in psychology seems to support this claim, we may never know for sure.However, if this is the case, the positive emotions and emotional stability that makea customer influential in online social networks might make the customer perceivethe experience with a brand as more pleasant.
Differential Customer Expectations
A customer who is highly influential onlinemight have higher expectations for customerservice and be less likely to be satisfied with the complaint resolution experience. Thisconjecture may be supported by theories from behavioral psychology, where influencehas long been studied as a prominent style of human behavior. For instance, thecelebrated psychologist, William Marston, who proposed the dominance, inducement,submission, and compliance model of human behavior (DISC) [28], recognized influ-ence as “inducement” behavior, characteristic of people who can persuade, attract,convince, convert, and lead other people. Recently, the DISC model of human behaviorhas been adapted and customized to customer service [22], where the inducementbehavior is characteristic of the “influential customers,” who are optimistic, persuasive,inspiring, and trusting in their approach toward customer service organizations andexpect the same in return. Such influential customers have a need for social recognition,and always want to be accepted. Therefore, we could expect influential customers tohave higher than normal expectations for social media customer service.Hence, from a purely theoretical perspective, it is not clear which mechanism
would dominate in shaping a customer’s satisfaction regarding the resolution of acomplaint. However, considering the nature of individuals of higher online socialinfluence, it is more likely that the first two mechanisms would dominate the thirdmechanism. Thus, if we use a customer’s Klout score to measure his or her onlinesocial influence, we might observe a positive or negative correlation between theKlout score and the customer’s satisfaction with the complaint resolution. Toinvestigate this, we propose the following hypothesis for empirical testing:
Hypothesis 1 (The Social Influence Hypothesis): The higher a complainingcustomer’s Klout score is, the more likely the customer will feel better at theend of a conversation with a brand on social media.
CUSTOMER COMPLAINTS ON SOCIAL MEDIA 321

Prior Complaint Experience
The effect of past behavior on individuals’ attitudes, intentions, and behavior haslong been recognized in studies of personality and social psychology. The idea thatthe extent of past complaining experiences becomes assimilated into an indivi-dual’s attitude toward complaining, is consistent with the behaviorist and situa-tionist theories of psychology, which explain how past behaviors and exposure tosituations shape and reinforce an individual’s behavioral dispositions in futuresituations [33]. From the perspective of customer–brand relationship, customerswith prior complaint experience are likely to have a weaker relationship with thebrand than customers without prior complaint experience do. Prior literaturessuggest that there is a buffering effect of relationship strength. For example, Xia[44] finds that consumers with a stronger existing relationship with a brand willperceive a defensive reaction toward criticism by the brand as less inappropriatethan those with a weaker existing relationship. Hence, the threshold for successfulcomplaint resolution tends to be higher for customers who have had a negativeexperience with the brand in the past than for customers who have had no suchexperience. These differences in expectations may lead to differences in postcom-plaint satisfaction. Based on these arguments, we propose the following hypothesisfor empirical testing:
Hypothesis 2 (The Prior Complaint Experience Hypothesis): A complainingcustomer is more likely to feel worse at the end of a conversation with a brandon social media if the customer has prior complaint experience with the brand.
Complaint Type
When customers deal with service firms, the two main reasons for complaints arethe failure to deliver the service and how the service was delivered [4]. Themarketing literature recognizes these two types of service failures as outcomeand process failures [4, 19, 25]. The outcome dimension involves what customersactually receive from the service, or the performance aspects of the service, and theability of the organization to keep its promises and to solve problems when theyarise [19]. Processes involve the functional or people aspects of the service and area consequence of the behavior and customer-oriented service-mindedness of theemployees [19]. Therefore, in an outcome failure, the organization does not fulfillthe core service need, whereas in a process failure, the delivery of the core serviceis flawed or deficient in some way [34]. For example, in the airline industry,outcome-related complaints might include flight delays, flight cancellations, mis-handled baggage, in-flight service-related issues (e.g., seats, wi-fi, meals), longqueues at check-in counters, and boarding issues. Process-related complaints mayinclude issues such as unprofessional employees, and issues related to the airline’sdedicated customer service (e.g., long on-hold times, pending refunds, mishandledcomplaints).
322 GUNARATHNE, RUI, AND SEIDMANN

As per social exchange and equity theories [21, 43], a complaint encounter canbe viewed as an exchange in which the customer experiences a loss due to thefailure and the organization attempts to provide a gain, in the form of effectivehandling of the complaint, to make up for the customer’s loss. Service failures canresult in the loss of economic resources (money, time) or psychological/socialresources (status, empathy, esteem) for customers, and organizations often offercustomers economic resources in the form of compensation, or psychological/socialresources such as an apology [34]. An outcome failure involves a loss of economicresources, whereas a process failure involves a loss of psychological/socialresources. Thus, we expect customers’ complaint satisfaction judgments to differby the type of complaint, as outcome and process failures represent differentcategories of loss to the customer. The marketing literature provides very limitedevidence on which type of failure has more influence on customers’ postcomplaintsatisfaction. Smith et al. [34] found that customers who experienced processfailures were more dissatisfied than those who experienced outcome failures.Bitner et al. [4] found that a large percentage of unsatisfactory service encounterswere related to employees’ inability or unwillingness to respond effectively toservice failure. Furthermore, prior studies indicate that operational failures them-selves do not necessarily lead to customer dissatisfaction, since most customersaccept that things may sometimes go wrong [12]. However, if it is the organiza-tion’s employees who failed to live up to customer expectations of service, it isless likely that the customers will be satisfied with their experience. Based on thesearguments, we propose the following hypothesis for empirical test:
Hypothesis 3 (The Complaint Type Hypothesis): A complaining customer ismore likely to feel better at the end of a conversation with a brand on socialmedia if the complaint is outcome-related rather than process-related.
Data, Measures, and Methodology
Data Collection
We used the Twitter API (application program interface) to collect all the user tweetsmentioning the official Twitter account of a major U.S. airline, which we havepurposely kept anonymous, as well as all the tweets posted by that airline, from July2014 to January 2015. We processed the tweets daily, when constructing our maindata set of complaint-based conversations between the users (i.e., customers) and theairline on Twitter. We define a conversation as a dialogue between a customer andthe airline on Twitter, containing all the tweets the customer sent to the airlineregarding a particular complaint and the associated reply tweets from the airline. Weobtained a variety of conversations users had with the airline, particularly oncomplaints, compliments, and on information sharing in general. Then we processedour data to identify all the complaint-based conversations, and randomly selected 40percent of the conversations for further analysis. Taking the concise nature of
CUSTOMER COMPLAINTS ON SOCIAL MEDIA 323

communication on Twitter into account, we picked only conversations with at leasttwo replies from the airline, for our main data set. This process was repeated until weobtained 1,500 single-complaint-based conversations of different customers. Onaverage, a conversation contained 6.4 total tweets (i.e., both user tweets and airlinetweets), and 2.75 airline tweets. Customers interacted with the airline to complainmostly about flight delays, flight cancellations, mishandled baggage, in-flight ser-vice-related issues (e.g., seats, wi-fi, meals), long queues at check-in counters,boarding issues, rude flight attendants, and issues related to the airline’s dedicatedcustomer service. To learn how these customers felt at the end of the conversationthey had with the airline on Twitter, we developed the Closed Loop AnalyticalSocial Survey (CLASS) approach to survey these customers using Twitter.
CLASS Methodology
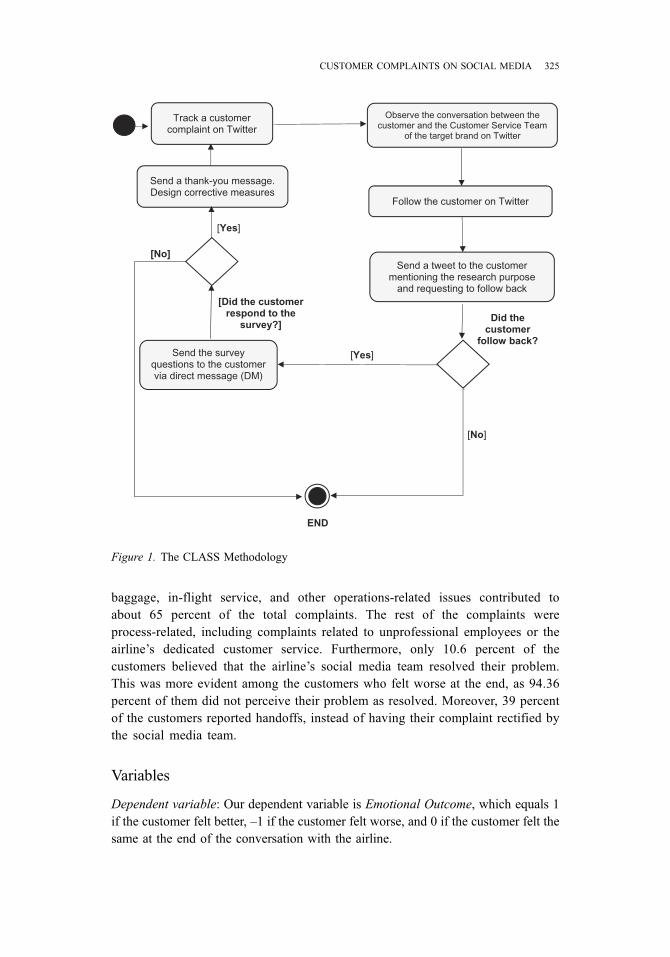
We began by creating a dedicated Twitter account and started following eachcustomer, as the instantaneous Twitter notification this creates is likely to capturethe customer’s immediate attention. Next, we sent out a tweet to the customerasking her to follow us back, so we could communicate via direct messages (DM),keeping the conversation private and confidential. This tweet took the followingform: “Hi Amy, we are studying how airlines treat customers on Twitter. Couldyou follow us so we can DM you 2 short questions? Thanks!” If the customerfollowed us back indicating a preference to interact, we sent a couple of directmessages asking two short questions: “Thx Amy. We are collecting voices on@airline to monitor their service. We want to learn your Twitter experience withthem on December 7th” and then “(Q1) Did @airline solve your problem? (Q2)Did your conversation with @airline make you feel better, worse, or the same?”Upon receiving responses from the customer, we ended the conversation with athank-you note. In Figure 1, we present a more general framework for thisproposed new survey method. It can easily be adapted to any other social mediauser survey such as ours.As expected, not all the customers followed us back. Some customers followed
us, but did not respond to our DMs. Some customers who responded to our DMsdid not stop at providing the answers, but explained their actual experience withthe airline in detail. We offered the survey to 1,500 different customers and heardback from 503 of them, which is a response rate of 33.54 percent. Although ourdata collection methodology can be completely automated to increase the samplesize, we are currently prevented from doing so due to Twitter API rules and ratelimits.2 As a result, we did the survey manually and could only obtain a few datapoints each day.Surprisingly, 53.2 percent of the customers reported that they felt worse at the
end of the conversation with the airline on Twitter, while only 19.8 percent of thecustomers felt better and 27 percent felt the same. Among the various types ofcomplaints present in the conversations, flight delays, cancellations, mishandled
324 GUNARATHNE, RUI, AND SEIDMANN
baggage, in-flight service, and other operations-related issues contributed toabout 65 percent of the total complaints. The rest of the complaints wereprocess-related, including complaints related to unprofessional employees or theairline’s dedicated customer service. Furthermore, only 10.6 percent of thecustomers believed that the airline’s social media team resolved their problem.This was more evident among the customers who felt worse at the end, as 94.36percent of them did not perceive their problem as resolved. Moreover, 39 percentof the customers reported handoffs, instead of having their complaint rectified bythe social media team.
Variables
Dependent variable: Our dependent variable is Emotional Outcome, which equals 1if the customer felt better, –1 if the customer felt worse, and 0 if the customer felt thesame at the end of the conversation with the airline.
Did the customer
follow back?
Send a tweet to the customer mentioning the research purpose
and requesting to follow back
Follow the customer on Twitter
[Yes]
[No]
[Yes]
[Did the customer respond to the
survey?]
Send the survey questions to the customer via direct message (DM)
Send a thank-you message. Design corrective measures
Track a customer complaint on Twitter
END
[No]
Observe the conversation between the customer and the Customer Service Team
of the target brand on Twitter
Figure 1. The CLASS Methodology
CUSTOMER COMPLAINTS ON SOCIAL MEDIA 325

Independent variables: The primary independent variables of interest arethe customer’s Klout score, whether the customer has prior experience complainingto the airline, and the complaint type (i.e., whether the complaint is outcome-relatedor process-related). Users’ Klout scores were obtained using the Klout API. Tocapture users’ prior experience for complaining to the airline, we used the TwitterAPI to collect the users’ historical tweets up to a maximum of 3,200, and examinedwhether they contained complaints sent to the airline at least 24 hours before thestart of the conversation under consideration.Control variables: We include a set of control variables to account for unobserved
heterogeneity at the conversation level and the customer level. The first set ofcontrol variables includes the characteristics specific to the conversation betweenthe customer and the airline such as whether:
● the airline apologized, provided an explanation, expressed gratitude, made ahandoff during the conversation, or posted consecutive tweets during theconversation;
● the customer had their problem solved, ended the conversation, warned theairline about potential brand switching in future, or posted consecutive tweetsduring the conversation; and
● the airline or customer mentioned using direct messaging.
In addition, we controlled for the airline’s average response time, and the totalnumber of tweets exchanged during the conversation.The second set of control variables includes characteristics specific to the custo-
mer, such as gender, race, whether the customer had a verified Twitter account, theage of the Twitter account, whether the customer’s location/website/profile descrip-tion was publicly available on Twitter, and the customer’s personality.Controlling for the customer’s personality is important here, as personality traits
are likely to influence a customer’s evaluation of the outcome. Therefore, for eachcustomer, we derived the Big Five personality traits (openness, conscientiousness,extraversion, agreeableness, neuroticism) via a lexicon-based approach, using thecustomer’s past tweets as input to the linguistic inquiry and word count (LIWC)dictionary [17, 30]. Past tweets could be collected for only 453 customers, as someuser timelines were private and some other profiles were no longer on Twitter. Weaugment our empirical model with the derived Big Five personality traits, account-ing for the likely omitted variable bias due to differences in customer personality.The details on how we derived the personality traits are reported in Section A1 of theOnline Appendix.Table 1 explains the key variables in our empirical analysis. The summary
statistics are presented in Table 2. The correlation matrix is presented in SectionA2 of the Online Appendix.Some of the service quality variables (e.g., handoff, apology) required manual
coding. They are presented in Table 3, along with some sample tweets used toidentify the respective constructs.
326 GUNARATHNE, RUI, AND SEIDMANN

Table 1. Definitions of Variables
Variable Description
Emotional Outcome How the customer felt at the end of the conversation (obtained fromQ1 of the survey)(–1 = worse, 0 = the same, 1 = better)
Klout Score Klout score of the customer as obtained via the Klout API (numericvalue between 1 and 100)
Complaint Type Binary variable indicating the complaint type (1 = outcome/operations,e.g., flight delay/cancellation, mishandled baggage, in-flightservice, non-employee-related issues at airports, etc.)0 = process/employees/dedicated customer service-relatede.g., rude flight attendants, longer than usual holding times incontacting customer service, delays in responses from customerservice, etc.)
Prior ComplaintExperience
Binary variable indicating whether the customer has priorcomplaining experience with the airline on Twitter (1 = Yes, 0 = No)
Handoff Binary variable indicating whether the social media team handed thecustomer off to some other department (1 = Yes, 0 = No)
Problem Solved Binary variable indicating whether the airline resolved the complainton social media (obtained from Q2 of the survey) (1 = Yes, 0 = No)
Apology Binary variable indicating whether the airline apologized (1 = Yes, 0 = No)Explanation Binary variable indicating whether the airline provided an explanation
(1 = Yes, 0 = No)Gratitude Binary variable indicating whether the airline expressed its gratitude
to the customer (1 = Yes, 0 = No)Total Tweets
ExchangedTotal number of tweets exchanged during the conversation
Average AirlineResponse Time
Average of response times between airline tweets and theirrespective parent user tweets, in seconds
Direct Messaging(DM)
Binary variable indicating whether the customer or the airlinementioned direct messaging (1 = Yes, 0 = No)
Ended by Customer Binary variable indicating whether it was the customer who ended theconversation (1 = Yes, 0 = No)
Brand SwitchWarning
Binary variable indicating whether the customer warned the airlineabout possible brand switching in the future (1 = Yes, 0 = No)
Consecutive UserTweets
Binary variable indicating whether consecutive user tweets exist inthe conversation (1 = Yes, 0 = No)
Consecutive AirlineTweets
Binary variable indicating whether consecutive airline tweets exist inthe conversation (1 = Yes, 0 = No)
Gender Categorical variable indicating the customer’s gender, as obtainedvia Kairos (kairos.com) face detection API (1 = Female, 2 = Male,3 = Unidentifiable)
Race Categorical variable indicating the customer’s race, as obtained viaKairos face detection API (1 = White, 2 = Black, 3 = Other,4 = Unidentifiable)
Verified Account Binary variable indicating whether the customer’s account is verifiedon Twitter (1 = Yes, 0 = No)
(continues)
CUSTOMER COMPLAINTS ON SOCIAL MEDIA 327

Econometric Analysis
Benchmark Model
The latent perceived satisfaction from complaining to an airline on social media forcustomer i in conversation j is Y �
ij ;where
Y �ij ¼ β0 þ Djβ1 þ Cijβ2 þ εij:
Here, Dj refers to the vector of observable characteristics of conversation j, andCij refers to the vector of observable characteristics of customer i in conversation j.ε is an error term with cumulative distribution function G such thatG xð Þ ¼ 1� G �xð Þ.Let Yij be an ordered outcome of whether the customer felt worse, the same, or
better at the end of the conversation with the brand, taking on the values {–1, 0, +1}respectively. Let τ1< τ2 be unknown thresholds such that:
Yij ¼ �1 if Y �ij � τ1
Yij ¼ 0 if τ1<Y�ij � τ2
Yij ¼ þ1 if Y �ij > τ2
For simplicity, we denote by Xij all independent variables includingthe conversation and customer-related variables as well as the unit for the
Table 1. Continued
Variable Description
Customer AccountAge
Number of days since the creation of the customer’s Twitter account
Public Web Site/Location/ProfileBio
Binary variable indicating whether the user’s location, website, orprofile description is publicly available (1 = Yes, 0 = No)
Agreeableness Numeric value representing a person’s tendency to becompassionate and cooperative toward others (altruism,cooperation, trustworthiness, empathy)
Conscientiousness Numeric value representing a person’s tendency to be organized anddependable (organization, persistence, self-assurance)
Extraversion Numeric value representing a person’s tendency to seek stimulationin the company of others (outgoingness, sociability, energy,positive emotions, assertiveness, sociability, talkativeness)
Neuroticism Numeric value representing a person’s tendency to experienceunpleasant emotions easily, such as anger, anxiety, anddepression
Openness Numeric value representing the extent to which a person is open toexperiencing a variety of activities (creativity, intellect, preferencefor novelty)
328 GUNARATHNE, RUI, AND SEIDMANN

constant term, and we denote by β the vector of all coefficients including theconstant term β0. The conditional distribution of Yij given Xij can be defined asfollows:
Pr Yij ¼ �1jXij
� � ¼ PrðY �ij � τ1jXijÞ ¼ G τ1 � Xijβ
� �;
Pr Yij ¼ 0jXij
� � ¼ Pr τ1<Y�ij � τ2jXij
� �¼ G τ2 � Xijβ
� �� G τ1 � Xijβ� �
;
Pr Yij ¼ 1jXij
� � ¼ PrðY �ij > τ2jXijÞ ¼ 1� G τ2 � Xijβ
� �:
The log likelihood function is given by:
Li τ; βð Þ ¼ 1 Yij ¼ �1� �
log G τ1 � Xijβ� �� �
þ 1 Yij ¼ 0� �
log G τ2 � Xijβ� �� G τ1 � Xijβ
� �� �
þ 1 Yij ¼ 1� �
log 1� G τ2 � Xijβ� �� �
:
Table 2. Summary Statistics (N = 453)
Variable Mean Std. dev.
Emotional Outcome –0.34 0.79Klout Score 30.70 14.29Complaint Type 0.70 0.46Prior Complaint Experience 0.20 0.40Handoff 0.39 0.49Problem Solved 0.10 0.31Apology 0.72 0.45Explanation 0.34 0.48Gratitude 0.25 0.44Total Tweets Exchanged 6.57 2.74Log of Average Airline Response Time (seconds) 1,056.60 1,141.71Direct Messaging (DM) 0.16 0.37Ended by Customer 0.24 0.43Brand Switch Warning 0.23 0.42Consecutive User Tweets 0.34 0.48Consecutive Airline Tweets 0.01 0.09Gender 1.81 0.73Race 3.19 1.20Verified Account 0.01 0.105Customer Account Age (days) 1,514.76 632.93Public Web Site/Location/Profile Bio 0.86 0.35Agreeableness 5.69 1.33Conscientiousness –1.83 0.70Extraversion 2.42 0.98Neuroticism 1.38 0.63Openness –7.87 2.53
CUSTOMER COMPLAINTS ON SOCIAL MEDIA 329

We further assume that the error term ε follows a logistic distribution, and weestimate an ordered-logit model to test our hypotheses. Here we adopt the propor-tional odds assumption [18] or the parallel regression assumption such that therelationship between each pair of outcome categories of the dependent variable is thesame. To test this assumption, we performed a Brant test [6]; it generated nonsigni-ficant test statistics, providing evidence that the parallel regression assumption hadnot been violated. The regression results are reported in Columns (1) and (2) ofTable 4.
Table 3. Sample Tweets for Manually Coded Service Quality Variables
Variable Sample Tweets
Handoff ● @user Sonya; have you reached out to our Customer Relationsteam? They can help you with past date travel issues.
● @user We’re sorry to hear this. Contact our Central BaggageServices for assistance with this.
● @user Our agents will help you with available options. Please seethem as soon as you can
Apology ● @user No one likes delays; especially on their birthday☺. Weapologize for the inconvenience.
● @user We hear your frustration. Please accept our apology.● @user We expect our team to always be cordial at all times; Ashley.
Our apologies that you experienced otherwise.Explanation ● @user We show the equipment is out of service; Justin. Safety of
our customers and crew is always our top priority.● @user We’re sorry your flights delayed. There are major Air Traffic
Control delays beyond our control.● @user Weather can back up Air Traffic Control flows once things
get moving again; Bianca. Our apologies for the inconvenience.Gratitude ● @user We’re glad we have you to Sacramento. Have a good rest of
your Sunday and thanks for flying with us.● @user We appreciate you feedback and thank you for the kind
words for our staff.● @user Our goal is to provide exceptional customer service. We’re
sorry we missed the mark today. We appreciate your loyalty.Direct Messaging
(DM)● @user Please send us a DM with your bag tag number. We’ll take
a look.● @user We’re very sorry to hear this; Sharina. Did you file a report at
<URL>? If so; DM your CR file number.● @user Rachel; please DM your record locator or Baggage Report
number. We’d like to check on that for you.Brand Switch
Warning● @airline Never Again! 4 flight changes lost luggage. And my
UNACCOMPANIED minor still not where she needs to be. 1st andlast <airline> flight.
● @airline . . . Worst customer service. My mom has been through hellwith you. Now both of us won’t fly with you. @airline2 wins again
● Stuck on a plane for over an hour; gets told to wait at least another20mins before further info? Never EVER flying with @airline again
330 GUNARATHNE, RUI, AND SEIDMANN

Estimation Results
From Table 4, we see that Klout Score is positive and statistically significant(0.032, p < 0.01). In terms of magnitude, for a one-unit increase in Klout Score,the odds of feeling better increase by a factor of 1.032 (3.2 percent) more than
Table 4. Ordered Logistic Regression: Benchmark Model
Variable
(1)Ordered LogitCoefficient
(2)Ordered LogitOdds Ratio
Klout Score 0.032*** (0.008) 1.032*** (0.008)Complaint Type 0.643*** (0.232) 1.903*** (0.441)Prior Complaint Experience –0.528** (0.256) 0.590** (0.151)Handoff –0.465** (0.213) 0.628** (0.134)Problem Solved 1.381*** (0.330) 3.981*** (1.314)Apology 0.295 (0.233) 1.343 (0.313)Explanation –0.178 (0.219) 0.837 (0.184)Gratitude 0.609*** (0.226) 1.838*** (0.415)Total Tweets Exchanged –0.145*** (0.048) 0.865*** (0.042)Log of Average Response Time 0.018 (0.105) 1.018 (0.107)Direct Messaging (DM) 0.355 (0.277) 1.426 (0.395)Ended by Customer –0.407* (0.245) 0.666* (0.163)Brand Switch Warning –0.659** (0.258) 0.518** (0.133)Consecutive User Tweets 0.283 (0.247) 1.327 (0.328)Consecutive Airline Tweets 0.056 (1.016) 1.058 (1.075)Gender—Male (base: Female) –0.117 (0.232) 0.890 (0.206)Gender—Unidentifiable (base: Female) 0.203 (0.784) 1.226 (0.961)Race—Black (base: White) –0.323 (0.740) 0.724 (0.536)Race—Other (base: White) 0.399 (0.525) 1.490 (0.781)Race—Unidentifiable (base: White) –0.053 (0.316) 0.949 (0.300)Verified Account –1.478 (0.976) 0.228 (0.223)Customer Account Age –0.000 (0.000) 1.000 (0.000)Public Web Site/Location/Profile Bio –0.426 (0.332) 0.653 (0.217)Agreeableness –0.104 (0.142) 0.901 (0.128)Conscientiousness 0.514* (0.274) 1.673* (0.459)Extraversion 0.033 (0.191) 1.033 (0.197)Neuroticism –0.055 (0.318) 0.946 (0.301)Openness –0.141 (0.097) 0.869 (0.084)Cut 1 Constant –0.174 (0.998) 0.840 (0.839)Cut 2 Constant 1.312 (1.000) 3.713 (3.714)Observations 453Log likelihood –404.155AIC 868.340BIC 991.786
Notes: Standard errors are in parentheses. Significance: ***p < 0.01; **p < 0.05; *p < 0.1.
CUSTOMER COMPLAINTS ON SOCIAL MEDIA 331

the odds of feeling the same or feeling worse.3 This finding suggests that asthe Klout score increases, there is a corresponding increase in the probabilityof the customer feeling better at the end of a conversation with the airlineon social media, thereby providing support for the Social InfluenceHypothesis (H1).To better evaluate how the probabilities of each emotional outcome changes as
Complaint Type and Prior Complaint Experience vary, we generate their respectivepredicted probabilities while keeping the rest of the variables at their means. Theresults are reported in Table 5.From Table 4, we also see that Prior Complaint Experience is negative and
statistically significant (–0.528, p < 0.05). In terms of magnitude, having priorcomplaint experience decreases the odds of feeling better by a factor of 0.59 (41percent), than the odds of feeling the same or feeling worse. Moreover, the predictedprobabilities (Table 5) indicate that there is 64.4 percent chance that the customerfeels worse if the customer has had prior complaint experience, as opposed to a 51.7percent probability of feeling worse if the customer has had no such experience.Thus, our findings suggest that a customer who previously complained is morelikely to feel worse than to feel the same or better, thereby providing support for thePrior Complaint Experience Hypothesis (H2).Finally, we see in Table 4 that Complaint Type is positive and statistically
significant, (0.643, p < 0.01). In terms of magnitude, customers with outcome-related complaints are more likely to feel better than those with process-relatedcomplaints by a factor of 1.903 (90.3 percent) more than the odds of feeling thesame or feeling worse. As per the predicted probabilities (Table 5), there is a 65percent chance that the customer feels worse at the end when the complaint isprocess-related, and just a 49.4 percent chance when the complaint is outcome-related. Accordingly, our findings suggest that process-related complaints areless likely to make a customer feel better at the end of a conversation with anairline on social media, thereby providing support for the Complaint TypeHypothesis (H3).
Table 5. Predicted Probabilities
Variable Emotional outcome Probability at 0 Probability at 1
Complaint Type Worse 0.650*** (0.045) 0.494*** (0.031)Same 0.242*** (0.030) 0.318*** (0.026)Better 0.109*** (0.021) 0.188*** (0.022)
Prior ComplaintExperience
Worse 0.517*** (0.029) 0.644*** (0.053)Same 0.309*** (0.025) 0.245*** (0.034)Better 0.175*** (0.020) 0.111*** (0.025)
Notes: Standard errors are in parentheses. Significance: ***p < 0.01
332 GUNARATHNE, RUI, AND SEIDMANN

We found that several other variables were statistically significant. For example,Handoff is negative and statistically significant (–0.465, p < 0.05). In terms ofmagnitude, handing the customer off to some other department, rather than thesocial media team taking care of the customer, decreases the odds of feeling betterby a factor of 0.628 (37.2 percent), as compared with the odds of feeling the same orfeeling worse. Thus, our findings suggest that a complaining customer is more likelyto feel worse, if the airline’s social media team hands that customer off to some otherdepartment.Furthermore, Problem Solved is positive and statistically significant (1.381, p <
0.01). In terms of magnitude, a customer’s perception of the problem as being fixedby the social media team increases the odds of feeling better by a factor of 3.981(298.1 percent) as compared to the odds of feeling the same or feeling worse. Thus,Problem Solved has the largest positive effect on a customer’s emotional outcome atthe end of the complaining encounter. This makes sense because one of theresponses that a customer expects when a problem arises is a “fair fix” that atleast returns the customer to the starting point before the service failure [9]. Ouranalysis reveals that this could mean a variety of possible resolutions includingreplacement, refund, repair, discounts, corrections, and appropriate remedial action.In the airline industry, these may include paying damaged baggage claims, rebook-ing, hotel and food vouchers in case of flight delays or cancellations, free miles,refunds, customer status upgrades, reporting unprofessional employees to manage-ment, and so on.
Robustness Test: Nonresponse Bias
Although we sent the survey to 1,500 Twitter users who had a complaint-basedconversation with the airline on Twitter, we heard back from only about a thirdof them. Our main analysis was primarily based on the users who responded tothe survey. If the unobservables that (1) determine customers’ satisfaction afterthe interaction with the brand on social media, and (2) increase the likelihoodof not responding to the survey are correlated, then our model suffers fromnonresponse bias. This would have been the case if users who did not respondto our survey were significantly different from those who responded to thesurvey. To correct for this, we randomly selected 200 users who did notrespond to our survey and introduced these users into the main data set. Thenwe formulated an ordered probit model for customers’ emotional outcome, withselection on whether they responded to the survey. As the outcome covariates,we used the same set of variables used in the benchmark model. We particu-larly assume that how influential the customer is on social media (Klout score),gender, race, complaint type, customer account age, whether the customer hadhis or her location/website/profile description publicly available on Twitter, andwhether the customer warned the airline about switching to another brand,affect the selection. Then we employ the Heckman procedure to estimate our
CUSTOMER COMPLAINTS ON SOCIAL MEDIA 333

model. The results, which are presented in Table 6, are qualitatively the sameas the benchmark model. Moreover, error correlation was not statisticallysignificant at the p < .05 level, suggesting that nonresponse bias is not likelya major concern.
Table 6. Robustness Test: Heckman Selection
Variable
(1)Ordered Probit Model(Emotional Outcome)
(2)Selection Model
(Responded to Survey)
Klout Score 0.016*** (0.005) -0.001 (0.004)Complaint Type 0.351*** (0.130) 0.061 (0.119)Prior Complaint Experience –0.287** (0.140)Handoff –0.266** (0.119)Problem Solved 0.698*** (0.227)Apology 0.151 (0.125)Explanation –0.094 (0.117)Gratitude 0.317** (0.133)Total Tweets Exchanged –0.072*** (0.027)Log of Average Response Time 0.018 (0.061)Direct Messaging (DM) 0.174 (0.152)Ended by Customer –0.221* (0.132)Brand Switch Warning –0.273 (0.169) 0.284** (0.137)Consecutive User Tweets 0.147 (0.136)Consecutive Airline Tweets 0.026 (0.576)Gender—Male (base: Female) –0.143 (0.129) –0.243* (0.134)Gender—Unidentifiable (base: Female) –0.421 (0.494) –1.555*** (0.565)Race—Black (base: White) 0.016 (0.425) 0.625 (0.550)Race—Other (base: White) 0.092 (0.315) –0.420 (0.280)Race—Unidentifiable (base: White) –0.032 (0.172) –0.126 (0.170)Verified Account –0.791 (0.558)Customer Account Age 0.00002 (0.000) 0.000** (0.000)Public Web Site/Location/Profile Bio –0.218 (0.191) 0.033 (0.156)Agreeableness –0.063 (0.071)Conscientiousness 0.283* (0.161)Extraversion 0.024 (0.105)Neuroticism –0.040 (0.175)Openness –0.082 (0.051)Cut 1 Constant 0.289 (0.615)Cut 2 Constant 1.063* (0.585)Constant 0.549*** (0.210)atanh ρ (ρ = error correlation) 0.971 (0.891)Observations 653.00 653.00Log likelihood –773.21 –773.21AIC 1,630.43 1,630.43BIC 1,818.65 1,818.65
Notes: Standard errors are in parentheses. Significance: ***p < 0.01; **p < 0.05; *p < 0.1.
334 GUNARATHNE, RUI, AND SEIDMANN

Extension
Given that 53.2 percent of the customers in our sample felt worse at the end of theirconversations with the airline on Twitter, one naturally questions whether doingcustomer service on social media is worthwhile for a brand. As an extension to ourstudy, we investigated this question by doing a short survey among customers whodid not receive any response from the airline after complaining to the airline onTwitter. Again, we followed the CLASS approach; the survey questionnaire took thefollowing form: “Our records show that @airline did not respond to your complainton Twitter on January 14th. We want to learn your experience. (Q1) Rate youroverall satisfaction regarding the way @airline handled your complaint on Twitter:Very Dissatisfied/Dissatisfied/Neither Satisfied Nor Dissatisfied/Satisfied/VerySatisfied (Q2) What is the likelihood that you would use Twitter again to complainto @airline in the future? Very Unlikely/Unlikely/Not Sure/Likely/Very Likely.”We sent out 222 survey requests and heard back from 38 people.4 Of the
respondents, 92.1 percent reported that they were either very dissatisfied or dissa-tisfied regarding the way the airline handled their complaint on Twitter (i.e., bychoosing not to respond). Surprisingly, 81.58 percent of these respondents claimedthat they are very likely or likely to use Twitter to complain to the airline in thefuture. One possible explanation of these results is that customers whose complaintsare ignored by a brand are more motivated to punish the brand by publiclycomplaining on social media.Considering the high percentage of people unhappy with the airline for not
responding to their complaint, and their intention to keep complaining on socialmedia, it seems that brands would still be much better off investing in social mediacustomer service, even though it does not always effectively transform a disgruntledcustomer into a happy one. Moreover, recent research [38] has suggested thatemotionally charted tweets tend to be retweeted more often and more quicklycompared to neutral ones. Simply put, brands today have no option but to listen toand engage with their customers on a real-time basis in order to succeed. Thedemocratization of media by social media platforms like Twitter has effectivelyraised the bar for customer service and will ultimately lead to more transparencyand better service.
Managerial Implications
Our findings have important implications for the brands striving to harness thepower of social media to deliver customer service.First, our empirical test of the Social Influence Hypothesis (H1) indicates that
complaining customers with a higher Klout score are more likely to feel better at theend of a conversation with a brand on social media. As we argued earlier, this maybe because customers with greater social influence receive preferential customerservice from the airline, or simply because socially influential customers are happierand emotionally more stable individuals in general. If it is social-influence-based
CUSTOMER COMPLAINTS ON SOCIAL MEDIA 335

preferential customer service that is mainly at work, the result would suggest that abrand’s influence-based preferential treatment pays off during complaint resolution,at least for those customers who are treated better. However, given the controversialnature of this practice, and its implications on perceptions of fairness, brands shouldcarefully examine the drivers of this practice within their social media teams and actaccordingly.On the other hand, if it is the happy and emotionally more stable nature of socially
influential individuals that makes them more satisfied about the complaint resolutionreceived, then this suggests that those customers with greater online social influenceare simply easier to please. Hence, the brand can customize its marketing strategiesaccordingly, in targeting this particular customer segment. On the other hand, theresult also reveals a challenge in achieving high satisfaction with less-influentialcustomers. Nevertheless, the extension of our study shows that it is imperative forbrands to monitor and engage with complaining customers on social media eventhough the customers may still be dissatisfied after their complaint resolutionexperience on social media.Second, our empirical test of the Prior Complaint Experience Hypothesis (H2)
indicates that customers with prior complaint experience with the airline are morelikely to feel dissatisfied about their social media interactions with that brand.Hence, it may be worthwhile to customize the response to a customer complainingon social media, based on the customer’s social media-complaint history, instead oftreating each complaint as completely new. Although a brand may keep track of allhistorical complaints received from each customer via the traditional complaintmanagement process, whether the same is true for complaints received via socialmedia is not evident. Thus, a direct implication for practice would be to keep trackof all complaints from each customer and train the social media team to handle thosecustomers accordingly.Third, our empirical test of the Complaint Type Hypothesis (H3) shows that
customers complaining about process-related issues (e.g., unprofessional employeesor dedicated customer service) are more likely to feel worse at the end than thosewho complained about outcome or operations-related issues. Most customers under-stand that things may sometimes go wrong in airline operations, but when it comesto issues of employee attitude, they find it harder to forgive. Therefore, it isimportant to devise a separate response strategy to manage process-related com-plaints on social media. For example, in addition to reassuring the customer thataction will be taken against the reported unprofessionalism, it may also be worth-while to cheer the customer with some sort of compensation.Another important implication for practice would be the pressing need to empower
the social media team. We find that customers who were handed off to otherdepartments are more likely to feel worse at the end. It appears that customerstend to perceive a service handoff as a way of “passing the buck,” rather than thesocial media team’s lack of ability to resolve the complaints. The reasons for the lowproblem resolution rate and the high handoff rate may be a lack of technologyinfrastructure, training opportunities, and budget available to social media teams.
336 GUNARATHNE, RUI, AND SEIDMANN

Therefore, a careful social media investment strategy should be defined at thecorporate level, enabling seamless integration between the social media team andthe dedicated customer service of the brand. For instance, rather than letting thesocial media team ask the customer to contact the baggage claims departmentregarding lost baggage, the social media team should be able to access the relevantcorporate databases to provide more complete and worthwhile social media customerservice. Furthermore, social media teams should be given continuous and mandatoryopportunities to learn to provide high-quality complaint resolutions faster.
Conclusion
As consumers become more empowered by social media, companies are underincreasing pressures to improve not only the core value they deliver to theircustomers but also everything their customers experience [24]. To succeed in sucha competitive environment, companies need to place customer experience into oneholistic view for their present customers as well as for past and future customers. Akey component of building a successful customer experience is establishing asystematic approach to ongoing listening to customers and to their perceptions ofthe way in which the company addresses their concerns. There are several commonapproaches to doing that, including focus groups, mystery shoppers, advisory panels,periodic surveys, and transactional surveys. Transactional surveys have the advan-tage of getting feedback while the service experience is still fresh, and they allow thecompany to act quickly if it detects a major service gap. This approach motivated thedevelopment of our Closed Loop Analytical Social Survey (CLASS) methodology,which leverages the popularity of social media as a novel and rapid way to conductsuch transactional surveys. At a broad level, this research can be viewed as anexample from service science, management, and engineering (SSME) which is animportant multidisciplinary area [2].Our study has some limitations. It assumes that a customer’s satisfaction regarding
his or her interaction with the brand on social media genuinely reflects the custo-mer’s true emotional status at the end of the conversation with the airline. Thisapproach may not be perfect for at least two reasons. First, although we maintainedthe minimum possible interval between the end of the conversation on Twitter andthe survey offer, this gap may psychologically cause customers to overestimate orunderestimate how they actually felt at the end of the interaction. Second, someindividuals, such as people with greater online social influence, may be particularlycautious in their social media interactions with brands, such that their conversationson social media may not reveal their actual preferences, while average customersmay choose to express their concerns freely. Although we are unable to determinethe extent to which these factors may affect our findings, their existence couldundermine the importance of studies such as this one in determining the drivers ofhappier complaint resolutions on social media.
CUSTOMER COMPLAINTS ON SOCIAL MEDIA 337

Acknowledgments: An early version of this study was previously circulated as “What DrivesSuccessful Complaint Resolutions on Social Media? Evidence from the Airline Industry.” Theauthors thank the JMIS coeditors Rob Kauffman, Rajiv Dewan, Thomas Weber, Eric Clemons,the HICSS minitrack chairs, Jie Zhang, Yabin Jiang, and all the participants of the HICSSminitrack on “Integrating Business Operations, Information Technologies, and ConsumerBehavior” in the Organizational Systems and Technology Track, for useful discussion andcomments.
Supplemental File
Supplemental data for this article can be found on the publisher’s website at10.1080/07421222.2017.1334465
NOTES
1. The Big Five personality traits refer to openness, conscientiousness, extraversion,agreeableness, and neuroticism/degree of emotional stability; see [17] for details.
2. To automate the process, one needs to apply for special permission and be approved byTwitter.
3. See Greene and Hensher [18], for details on the interpretation of ordered logitcoefficients.
4. The small sample size is due to both the low response rate and limiting rules imposed byTwitter.
REFERENCES
1. Allon, G., and Zhang, D.J. Managing service systems in the presence of social net-works. Available at: http://ssrn.com/abstract=267313 (accessed on October 12, 2015).
2. Bardhan, I.R.; Demirkan, H.; Kannan, P.K.; Kauffman, R.J.; and Sougstad, R. Aninterdisciplinary perspective on IT services management and service science. Journal ofManagement Information Systems, 26, 4 (April 2010), 13–64.
3. Bell, P.A. Affective state, attraction, and affiliation: Misery loves happy company too.Personality and Social Psychology Bulletin, 4 (October 1978), 616–619.
4. Bitner, M.J.; Booms, B.H.; and Tetreault, M.S. The service encounter: Diagnosingfavorable and unfavorable incidents. Journal of Marketing, 54, 1 (January 1990), 71–84.
5. Boshoff, C. RECOVSAT: An instrument to measure satisfaction with transaction-spe-cific service recovery. Journal of Service Research, 1, 3 (February 1999), 236–249.
6. Brant, R. Assessing proportionality in the proportional odds model for ordinal logisticregression. Biometrics (December 1990), 1171–1178.
7. Conlon, D.E., and Murray, N.M. Customer perceptions of corporate responses toproduct complaints: The role of explanation. Academy of Management Journal, 39, 4(August 1996), 1040–1056.
8. Cui, G.; Wong, M.L; and Wan, X. Cost-sensitive learning via priority sampling toimprove the return on marketing and CRM investment. Journal of Management InformationSystems, 29, 1 (July 2012), 341–374.
9. Davidow, M. The bottom line impact of organizational responses to customer com-plaints. Journal of Hospitality and Tourism Research, 24, 4 (November 2000), 473–490.10. Davidow, M. Organizational responses to customer complaints: What works and what
doesn’t. Journal of Service Research, 5, 3 (February 2003), 225–250.11. Day, R.L. Modeling choices among alternative responses to dissatisfaction. Advances in
Consumer Research, 11, 1 (1984), 496–499.
338 GUNARATHNE, RUI, AND SEIDMANN

12. Del Río-Lanza, A. B.; Vázquez-Casielles, R.; and Díaz-Martín, A. M. Satisfaction withservice recovery: Perceived justice and emotional responses. Journal of Business Research,62, 8 (August 2009), 775–781.13. Estelami, H. Competitive and procedural determinants of delight and disappointment in
consumer complaint outcomes. Journal of Service Research, 2, 3 (February 2000), 285–300.14. Feingold, A. Happiness, unselfishness, and popularity. Journal of Psychology, 115
(September 1983), 3–5.15. Folkes, V.S. Consumer reactions to product failure: An attributional approach. Journal
of Consumer Research, 10, 4 (March 1984), 398–409.16. Goel, V. G.M. uses social media to manage customers and its reputation. New York
Times. March 23, 2014. Available at: http://www.nytimes.com.17. Goldberg, L.R. The structure of phenotypic personality traits. American Psychologist,
48, 1 (January 1993), 26–34.18. Greene, W.H., and Hensher, D.A. Modeling Ordered Choices: A Primer. Cambridge:
Cambridge University Press, 2010.19. Gronroos, C. Service quality: The six criteria of good perceived service quality. Review
of Business, 9, 3 (January 1988), 10–13.20. Gunarathne, P.; Rui, H.; and Seidmann, A. When social media delivers customer
service: Differential customer treatment in the airline industry. Working Paper, SimonBusiness School, University of Rochester, 2017.21. Homans, G.C. Social Behavior: Its Elementary Forms. New York, NY: Harcourt, Brace
and World, 1961.22. Karr, R., and Blohowiak, D.W. The Complete Idiot’s Guide to Great Customer Service.
New York, NY: Alpha Books, 1997.23. Lacey, R.; Suh, J.; and Morgan, R.M. Differential effects of preferential treatment levels
on relational outcomes. Journal of Service Research, 9, 3 (February 2007), 241–256.24. Lemon, K.N. The art of creating attractive consumer experiences at the right time: Skills
marketers will need to survive and thrive. GfK Marketing Intelligence Review, 8, 2 (November2016), 44–49.25. Levesque, T.J., and McDougall, G.H. Customer dissatisfaction: The relationship
between types of problems and customer response. Canadian Journal of AdministrativeSciences, 13, 3 (September 1996), 264–276.26. Lucas, R.E.; Diener, E.; Grob, A.; Suh, E. M.; and Shao, L. Cross-cultural evidence for
the fundamental features of extraversion. Journal of Personality and Social Psychology, 79, 3(September 2000), 452–468.27. Lyubomirsky, S.; King, L.; and Diener, E. The benefits of frequent positive affect: Does
happiness lead to success? Psychological Bulletin, 131, 6 (November 2005), 803–855.28. Marston, W.M. Emotions of Normal People. New York, NY: Harcourt Brace, 1928.29. Mervielde, I., and de Fruyt, F. The Big Five personality factors as a model of the
structure of children’s peer nominations. European Journal of Personality, 14, 2 (March2000), 91–106.30. Pennebaker, J.W.; Boyd, R.L.; Jordan, K.; and Blackburn, K. The development and
psychometric properties of LIWC2015. LIWC development manual, University of Texas atAustin, 2015.31. Schlereth, C.; Barrot, C.; Skiera, B.; and Takac, C. Optimal product-sampling strategies
in social networks: How many and whom to target? International Journal of ElectronicCommerce, 18, 1 (October 2013), 45–72.32. Singh, J. Voice, exit, and negative word-of-mouth behaviors: An investigation across
three service categories. Journal of the Academy of Marketing Science, 18, 1 (January 1990),1–15.33. Singh, J., and Wilkes, R.E. When consumers complain: A path analysis of the key
antecedents of consumer complaint response estimates. Journal of the Academy of MarketingScience, 24, 4 (September 1996), 350–365.34. Smith, A.K.; Bolton, R.N.; and Wagner, J. A model of customer satisfaction with
service encounters involving failure and recovery. Journal of Marketing Research, 36(August 1999), 356–372.
CUSTOMER COMPLAINTS ON SOCIAL MEDIA 339

35. Söderlund, M.; Liljander, V.; Gummerus, J.; Hellman, P.; Lipkin, M.; Oikarinen, E.L.;Sepp, M.; and Liljedal, K.T. Preferential treatment in the service encounter. Journal of ServiceManagement, 25, 4 (August 2014), 512–530.36. Stauss, B. The dimensions of complaint satisfaction: Process and outcome complaint
satisfaction versus cold fact and warm act complaint satisfaction. Managing Service Quality:An International Journal, 12, 3 (June 2002), 173–183.37. Stephens, N., and Gwinner, K.P. Why don’t some people complain? A cognitive-
emotive process model of consumer complaint behavior. Journal of the Academy ofMarketing Science, 26, 3 (July 1998), 172–189.38. Stieglitz, S., and Dang-Xuan, L. Emotions and information diffusion in social media-
sentiment of microblogs and sharing behavior. Journal of Management Information Systems,29, 4 (April 2013), 217–248.39. Strauss, J., and Hill, D.J. Consumer complaints by e-mail: An exploratory investigation
of corporate responses and customer reactions. Journal of Interactive Marketing, 15, 1(January 2001), 63–73.40. Susarla, A.; Oh, J.H.; and Tan, Y. Influentials, imitables, or susceptibles? Virality and
word-of-mouth conversations in online social networks. Journal of Management InformationSystems, 33, 1 (January 2016), 139–170.41. Tax, S.S.; Brown, S.W.; and Chandrashekaran, M. Customer evaluations of service
complaint experiences: Implications for relationship marketing. Journal of Marketing, 62(April 1998), 60–76.42. Van Der Linden, D.; Scholte, R.H.; Cillessen, A.H.; te Nijenhuis, J.; and Segers, E.
Classroom ratings of likeability and popularity are related to the Big Five and the generalfactor of personality. Journal of Research in Personality, 44, 5 (October 2010), 669–672.43. Walster, E.; Berscheid, E.; and Walster, G.W. New directions in equity research. Journal
of Personality and Social Psychology, 25, 2 (February 1973), 151–176.44. Xia, L. Effects of companies’ responses to consumer criticism in social media.
International Journal of Electronic Commerce, 17, 4 (July 2013), 73–100.
340 GUNARATHNE, RUI, AND SEIDMANN

Copyright of Journal of Management Information Systems is the property of Taylor & FrancisLtd and its content may not be copied or emailed to multiple sites or posted to a listservwithout the copyright holder's express written permission. However, users may print,download, or email articles for individual use.