who indoor air quality guidelines: household fuel combustion
TRANSCRIPT

WHO IAQ guidelines: household fuel combustion – Review 6: impacts of interventions on PM and CO
1
WHO Indoor Air Quality Guidelines:
Household Fuel Combustion
Review 6: Impacts of interventions on household air pollution concentrations and personal exposure
Convening lead authors: Eva Rehfuess1, Dan Pope2, Nigel Bruce2,3 Lead authors: Mukesh Dherani2, Kirstie Jagoe4 Luke Naeher5, Curtis Noonan6 Affiliations 1 Institute for Medical Informatics, Biometry and Epidemiology, Ludwig-Maximilians-University Munich
2 Department of Public Health and Policy, University of Liverpool, UK
3 World Health Organization, Public Health, Social and Environmental Determinants of Health,
Interventions for Healthy Environments, Geneva, Switzerland 4 Independent Consultant
5 Environmental Health Science, University of Georgia, USA
6 Center for Environmental Health Sciences, University of Montana, USA
Convening lead author: that author who led the planning and scope of the review, and managed the process of working with other lead authors and contributing authors, and ensuring that all external peer review comments were responded to. Lead authors: those authors who contributed to one or more parts of the full review, and reviewed and commented on the entire review at various stages. Disclaimer:
The work presented in this technical paper for the WHO indoor air quality guidelines: household fuel combustion has been carried out by the listed authors, in accordance with the procedures for evidence review meeting the requirements of the Guidelines Review Committee of the World Health Organization.
Full details of these procedures are described in the Guidelines, available at: http://www.who.int/indoorair/guidelines/hhfc ; these include declarations by the authors that they have no actual or potential competing financial interests. The review was conducted in order to inform the development of recommendations by the Guidelines Development Group. Some of the authors are staff members of, or consultants to, the WHO. The authors alone are responsible for the views expressed in this publication, which do not necessarily represent the views, decisions, or policies of the WHO.
This article should not be reproduced for use in association with the promotion of commercial products, services or any legal entity. The WHO does not endorse any specific organization or products. Any reproduction of this article cannot include the use of the WHO logo.

WHO IAQ guidelines: household fuel combustion – Review 6: impacts of interventions on PM and CO
2
Contents
Summary .............................................................................................................................. 3
1. Introduction and scope ................................................................................................... 4
2. Review methods .............................................................................................................. 6
2.1 Key questions ............................................................................................................ 6 2.2 Search strategy and search terms ............................................................................ 7 2.3 Inclusion criteria and study selection ...................................................................... 8 2.4 Data extraction and quality appraisal ....................................................................... 9 2.5 Evidence synthesis ...................................................................................................10 2.6 Assessment of strength of evidence (GEPHI) .........................................................11
3. Results ............................................................................................................................11
3.1 Overview of included studies ...................................................................................11 3.2 Solid fuel stoves with chimneys ..............................................................................12
3.2.1 Kitchen concentrations .........................................................................................13 3.2.2 Personal exposures ..............................................................................................23
3.3 Solid fuel stoves (standard combustion type) without chimneys .........................30 3.3.1 Kitchen concentrations .........................................................................................30 3.3.2 Personal exposures ..............................................................................................36
3.4 Advanced combustion solid fuel stoves .................................................................36 3.4.1 Kitchen exposures ................................................................................................36 3.4.2 Personal exposure ................................................................................................40
3.5 Mixed interventions ..................................................................................................40 3.6 Charcoal improved cook stoves ..............................................................................41 3.7 Liquefied petroleum gas and natural gas ................................................................41 3.8 Ethanol ......................................................................................................................41
3.8.1 Kitchen concentrations .........................................................................................41 3.8.2 Personal exposure ................................................................................................45
3.9 Electrification ............................................................................................................46 3.10 Other clean cooking interventions: biogas and solar ..........................................46 3.11 Behavioural and other types of intervention .........................................................47
4. Summary of impacts of interventions on kitchen PM and CO ....................................47
5. Experience from stove interventions in industrialised countries and China .............53
5.1 Industrialised countries ............................................................................................53 5.2 The Chinese National Improved Stoves Programme ..............................................54
6. Discussion and conclusions .........................................................................................55
Appendix 1: GEPHI Assessments .....................................................................................58
A1.1 Solid fuel stoves with chimneys (kitchen measurements) ..................................59 A1.2 Solid fuel stoves with chimneys (personal measurements) ................................60 A1.3 solid fuel stoves without chimneys (kitchen measurements) .............................61 A1.4 Advanced combustion solid fuel stoves without chimneys (kitchen measurements) ...............................................................................................................62 A1.5 Ethanol fuel stoves (kitchen measurements) .......................................................63
References ..........................................................................................................................64

3
Summary Background In order to assess the health benefits that can be expected following the introduction of improved solid fuel stoves and clean fuels, it is important to examine the reductions in HAP and personal exposure – and the absolute levels achieved – when these interventions are in everyday use. While laboratory emissions test results provide valuable information on the potential exposure reductions, field evaluation can provide a more realistic assessment of exposure when such interventions are adopted and used at scale. Aim and key questions The aim of this review was to compile all available information on the impacts that solid and clean fuel interventions used in homes for everyday needs have on HAP and personal exposure. The key questions for the review were as follows:
1. Are improved solid fuel stoves and cleaner fuel interventions in everyday use, compared to traditional solid fuel stoves, effective for reducing average concentrations of, or exposure to, particulate matter (PM) and carbon monoxide (CO) among households in low- and middle-income countries?
2. By what amount (in absolute and relative terms) do the interventions reduce PM and CO, and how do post-intervention (in-use) levels compare with WHO air quality guidelines?
Methods A search was conducted of electronic databases and specialist web sites. Eligible studies included randomised trials, quasi-experimental and before-and-after studies, as well as observational designs, and reported daily mean (24 or 48-hr) small particulate matter (majority PM2.5, two studies reported PM4) and/or carbon monoxide (CO), with standard deviations and/or 95% confidence intervals. Interventions were categorised as standard-combustion solid fuel stoves with and without chimneys, advanced combustion solid fuel stoves, clean fuels (LPG, biogas, ethanol, electricity, and solar) and mixed interventions. Studies were selected, extracted and quality-assessed using standardised procedures and forms. Baseline and post-intervention values, differences, and percentage changes from baseline were tabulated for each study, and weighted average values calculated for all studies contributing data to each category of stove or fuel intervention. Subject to sufficient studies, meta-analysis of absolute changes in the two pollutants for each solid fuel stove and clean fuel category was carried out using the generic inverse-variance method, and publication bias was assessed. Narrative summaries were provided for those intervention categories with very few eligible studies. Results A total of 38 eligible studies (providing 98 estimates) were included, 27 studies providing data on kitchen PM, three on personal PM, 26 on kitchen CO and five on personal CO. Only one or two studies were available for each of LPG, electricity, charcoal and mixed interventions. Baseline levels of PM and CO were highly variable, but in all cases exceeded the annual WHO IT-1 for PM2.5 of 0.035 g/m3 by a factor of 10-100 times, while CO varied from just below to around six times greater than the 24-hr AQG for CO of 7 mg/m3 (5.68 ppm). Reductions in pollutants were reported for almost all individual studies, and when grouped, large reductions in kitchen PM and CO levels in the range of 38-82% were found, largest for solid fuel chimney stoves and ethanol, least for solid fuel stoves without chimneys. Studies reporting impacts on personal exposure were only identified for solid fuel chimney stoves, but similar reductions in the range of 47-76% were found. Despite these large percentage reductions, post-intervention levels for PM remained well above the WHO IT-1 level for group weighted means at around 0.4 mg/m3, although the few personal exposure studies had a considerably lower weighted mean of 0.07 mg/m3. For CO on the other hand,

4
many interventions reduced this pollutant to levels below the WHO 24-hr AQG level, with weighted mean values of 4-5 ppm for chimney stoves, but almost 7 ppm for stoves without chimneys. Post-intervention personal exposure in the set of chimney-stove studies was 1.7 ppm. Sensitivity analyses (conducted where a sufficient number of estimates were available) including by study design, analytic approach (i.e. whether only stoves being used vs. all those allocated were compared with controls) and duration of use did not find strong effects. Among the larger sets of studies there was clear evidence of publication bias. GEPHI assessed the evidence as moderate to low quality. Evidence from improved wood stove studies in high income rural settings found, as expected, PM2.5 levels much lower than in developing countries (range 13 to 54 µg/m3), and that improved solid fuel stoves (all of which are vented and variously include advanced emission reduction technology) were associated with reductions in a majority of homes. Conclusions This review found that solid fuel stoves with chimneys, and one clean fuel with sufficient available studies (ethanol) delivered the largest reductions in PM and CO, but for a number of important clean fuels (including LPG and biogas) very few or no studies were found. GEPHI assessment indicated that the effects reported may give reasonable estimates of impact on PM and CO, but that further research may well result in these being considerably revised. One key issue is the degree of heterogeneity between studies, and reference back to the circumstances and results of individual stove and fuel evaluations is important for appropriate interpretation of these results. Continued efforts to standardise the methods used for field evaluation is important.
1. Introduction and scope The objective of this review is to summarize existing evidence on the impacts of interventions to reduce household air pollution from solid fuel use (HAP) in everyday use. This section sets the boundaries for the review by defining key issues to be addressed. Interventions HAP originates when solid fuels, that is biomass (wood, animal dung, crop wastes, charcoal) or coal are burnt on inefficient open fires or traditional stoves. Interventions to reduce exposure to HAP can be classified broadly as (i) those acting to change the primary household fuel, (ii) those promoting improved solid fuel stoves, (iii) those improving the living environment and (iv) those modifying user behaviour (1). Switching from biomass fuels or coal to cleaner fuels such as liquefied petroleum gas (LPG), biogas, ethanol or solar cooking, is likely to bring about the largest reductions in HAP, provided these fuels are used to fulfil a majority of household energy tasks. However, in the short- to medium-term, the assumption that these cleaner alternatives completely replace traditional practices rarely holds, with so-called fuel stacking, i.e. the parallel use of multiple fuels and multiple stoves, being a common phenomenon (2). Some of these interventions present distinct additional limitations, for example, even under ideal geographical conditions solar cookers, given their dependence on solar irradiance, have been estimated to be able to meet at most 38% of a household’s cooking needs (3). For a substantial proportion of current solid fuel users, opportunities to switch fully to clean fuels will be limited for many years, and therefore improved solid fuel stoves will continue to play an important part in the mix of intervention options. There is a wide variety of improved solid fuels stoves, including widely used, relatively high-emission stoves, such as rocket or ceramic Jiko stoves to more recent low-emission advanced combustion stoves, such as forced draft or semi-gasifier stoves. These stoves may or may not include a flue and chimney or smoke hood for ventilation. Stove location, housing construction and better room ventilation, as well as behaviour change, such as drying fuel wood, using pot lids to reduce cooking time or moving young children away from the source of pollution, can also make

5
some contribution to reducing HAP levels and personal exposures. Importantly, all improved solid fuel stove or cleaner fuel interventions need to be accompanied by measures to encourage behaviour change towards adoption, correct use and maintenance over time. This review covers all of these options but will focus on cleaner fuels (i.e. liquefied petroleum gas or natural gas, ethanol, biogas, solar cookers and electricity) and improved solid fuel stoves (i.e. with chimney, without chimney, mixed interventions comprising an improved stove and other interventions), which offer the most promising means to achieve substantial reductions in exposure to HAP. Household energy uses Energy is required for a range of household tasks, including cooking, lighting, boiling water for tea or coffee, heating water for bathing, household-based income generation and, depending on climatic conditions and season, space-heating. Fuels and devices used can vary widely but, especially among the poorest groups, solid fuels are used to meet all or a majority of these tasks, while kerosene is probably the most widely used lighting fuel. In higher-income countries, especially in rural areas, solid fuels are widely used for heating, although the stoves technologies are generally of much higher quality and vented. The main focus of this review is the evaluation of technologies used for cooking, which is the most universal need and in low-income settings tends to be responsible for the greatest share of household energy use. Moreover, the majority of the evaluation research evidence relates to the use of the stoves for cooking, even if many could also be used for other tasks. It is important, however, not to lose sight of other household tasks and the fuel combustion technologies used, as these can also contribute substantially to HAP. For example, in colder settings or seasons where households seek warmth from the stoves, the introduction of a more enclosed, insulated and efficient cookstove may be accompanied by increased use of the traditional stove or open fire for warmth. See also Review 9 that discusses the emissions rates from different types of kerosene lamps; although no formal studies were found on the impacts on HAP levels of replacing these with cleaner lighting, for example electricity, the potential for large reductions is clear. Although this review addresses the household energy situation primarily in developing countries, lessons learned from the introduction of improved solid fuel stoves in industrialized countries is also reviewed. Types of impact HAP has been linked to a broad range of health outcomes (see Reviews 4 and 8). For several of these, such as chronic obstructive pulmonary disease, lung cancer or cataract, there is a lag time of years to decades between exposure and development of disease. This review is therefore primarily concerned with the impact of interventions on HAP, measured as either concentrations of or exposure to the key indicator pollutants particulate matter (PM) and carbon monoxide (CO). The available evidence regarding health outcomes is revised in Review 4. Measures of effectiveness It was shown in Review 2 that emissions test results in the laboratory usually differ markedly from those obtained for the same stoves in more ‘real-life’ settings and use. For this reason, the focus of this review is evaluation studies, which provide evidence about the impacts of the main types of stove and clean fuels on HAP and personal exposure, when in everyday use. The primary measures of outcome are two important pollutants, small particles (mostly PM2.5, a few studies having measured PM4), and carbon monoxide (CO). Not only are they important in their own right, but crucially are those that have been measured most commonly. Very few experimental studies have examined the impacts on health outcomes, and these have been reviewed in Review 4.

6
While the results of these evaluation studies provide a useful guide to the HAP and exposure reduction achieved, the actual performance in any given setting will vary, and sometimes vary considerably, according to conditions in which the stove and/or fuel us used, the housing type and condition, needs of the users, climatic conditions, and many other factors. Results should therefore be interpreted with some caution, with the overall pooled results for each stove and fuel type seen as a general guide to what is being achieved, while individual studies can provide more detailed insights. For this reason, some details of all studies included in pooled analyses are presented alongside the combined results. Applying evaluation evidence to adoption at scale A public health problem affecting almost half of the world’s population demands large-scale solutions. It is, however, clear that no single “one size fits all”-solution to the HAP problem exists, but that suitable technologies and programmatic approaches are required in specific geographical, socio-economic and cultural settings. Although there are a few large (and very large) scale programmes that provide evidence on intervention impacts, the majority to date have been studies of relatively small projects and programmes. In addition the evaluation studies have often been carried out during the development stage, so there is some additional uncertainty as to the validity of the results in terms of what to expect ultimately from large-scale adoption. These and related issues for interpretation of the findings are considered further in the Discussion and Conclusions
2. Review methods This review is based mainly on a systematic review of the impact of interventions to reduce HAP and, consequently, much of this section is dedicated to describing the methods employed. Some findings reported in this review draw on focused, non-systematic literature reviews related to a specific topic (e.g. overview of solid fuel stoves in industrialized countries). Wherever this is the case, the source of evidence is stated.
2.1 Key questions
The aim of this review was to compile all available information on the impacts that solid and clean fuel interventions used in homes for everyday needs have on HAP and personal exposure. The key questions for the review were as follows:
1. Are improved solid fuel stoves and cleaner fuel interventions in everyday use, compared to traditional solid fuel stoves, effective for reducing average concentrations of, or exposure to, particulate matter (PM) and carbon monoxide (CO) among households in low- and middle-income countries?
2. By what amount (in absolute and relative terms) do the interventions reduce PM and CO, and how do post-intervention (in-use) levels compare with WHO air quality guidelines?
7
PICO Description
Population Households in low- and middle-income countries
Intervention Improved solid fuel stoves Clean fuels
With chimney Liquefied petroleum gas (LPG)/ natural gas
Without chimney Ethanol
Mixed (stove plus other improvements to kitchen and cooking arrangements)
Biogas
Solar cookers
Electricity
Comparison Traditional solid fuel stoves
Outcomes Average 24-hr (or 48-hr)
Kitchen concentrations of PM2.5
Kitchen concentrations of CO
Personal exposure to PM2.5
Personal exposure to CO
2.2 Search strategy and search terms
This systematic review was concerned with estimating “real-life” effectiveness, and therefore considered both programme evaluations and research studies.
Programme evaluations were defined as studies that measure impact in relation to an intervention delivered as part of a household energy project or programme.
Research studies were defined as peer-reviewed studies that were carried out by or in collaboration with academic institutions and provide information on impact in situations where the intervention was delivered under research conditions. In order to be eligible for inclusion, research studies must be concerned with a specific intervention for which programmatic data are available in the same or a similar setting.
Corresponding to a period of intense activity in the household energy and health field and greater standardisation of measurements, the systematic review covered the period 1998 to July 2012. For programme evaluations we also included all programmes affecting at least 100,000 households that had been conducted during the last 30 years or were on-going. Given the varied nature of the evidence, we adopted a broad search strategy encompassing (i) systematic searches of electronic and grey literature databases, (ii) searches of specialist websites, (iii) personal communication with key informants in the field, as well as (iv) reference tracking of all included studies. The main search strategy is summarized here; details are provided in the systematic review protocol (available on request). The electronic published and grey literature databases, and most important specialist websites, searched are listed in Table 1, below. For the websites, all relevant links on these and, where applicable, subsequent websites were followed. More than 25 experienced practitioners, stove producers, researchers and donors in the field of household energy and health were contacted to ensure that any activities they were implementing, funding or involved with in any other capacity and that has been, or were being, evaluated were captured.

8
Table 1: Databases and main websites searched
Electronic published and grey literature databases
Specialist websites
PubMed
Ovid (Medline)
Scopus
Environmental Science and Pollution Management (comprising Pollution Abstract and Applied Social Sciences Index and Abstract).
Asia Regional Cookstove Programme (ARECOP)
International Network on Gender and Sustainable Energy (ENERGIA)
World Bank’s Energy Sector Management Assistance Programme (ESMAP)
Deutsche Gesellschaft für Internationale Zusammenarbeit (GIZ)
Global Alliance for Clean Cookstoves
Household Energy Network (HEDON)
Partnership for Clean Indoor Air (PCIA)
United States Agency for International Development (USAID)
Searches were carried out using the search terms listed in Table 2. Key terms and combination terms were combined using the Boolean operator “AND” and adapted to the needs of specific databases or specialist websites1. Searches were conducted covering the period 1998 to July 2012; all studies identified through systematic searches or other processes (e.g. household air pollution-specific mailing lists) before 2012 were included in the screening process (papers not written in English were not screened). All search results were stored in Endnote X5. Table 2: Search terms
Key term Combination terms
“Indoor air quality” “Indoor air pollution” “particles” “particulate matter” “PM” “Carbon monoxide”
Biomass, “charcoal (stove)”, “ clean(er) fuel(s)”, “solar stove”, “ethanol stove(s)”, “methanol stove(s)”, biogas (stove), kerosene, LPG (“LPGas”/ “Liquid Petroleum Gas”/ “Liquified Petroleum Gas”/ “Liquefied Petroleum Gas”) “household energy”, “kitchen smoke”, cooking, ”improved stove(s)”, “cookstoves”, “wood stove”, chullah(s)/chula(s)/chulha(s)/chulla(s), plancha “exposure AND cooking”
2.3 Inclusion criteria and study selection
Population All studies conducted in low- and middle-income countries, concerned with urban or rural populations that, prior to intervention, were primarily dependent on solid fuels burnt on traditional stoves to meet their household energy needs were considered. Interventions The systematic review comprehensively addressed specific, named interventions to reduce HAP. These were classified as (i) solid fuel stoves with chimneys or smoke hoods, (ii) solid
1 “HAP” is notably absent from this list, as the term was very recently coined under the WHO’s Comparative Risk
Assessment (CRA); in the literature the older term “indoor air pollution” is commonly employed. We also did not search for specific pollutants other than particulate matter and carbon monoxide, as this would have resulted in an unmanageable amount of additional literature, and as a majority of studies would have been captured using our broader search terms.

9
fuel stoves without chimneys or smoke hoods, (iii) advanced combustion solid fuel stoves, (iv) LPG or natural gas, (v) ethanol, (vi) biogas, (vii) solar cooking, (viii) electricity and (ix) mixed interventions, combining several interventions in a package or programme. The following interventions were not considered: (i) programmes aimed at industrial, farming or community energy needs rather than household energy needs; (ii) programmes aimed at lighting alone rather than cooking or heating, as this is not expected to make a sufficient impact on HAP; and (iii) programmes promoting kerosene as the cleaner fuel intervention, as evidence suggests that kerosene may not be superior to solid fuels in terms of health impacts (see Review 9). Comparison The exact definition of the comparison group varied according to study design but can be broadly classified as “continued traditional household energy practices”. Outcome In order to be eligible for inclusion, studies had to include a direct quantitative measure of either 24- or 48-hour concentrations of kitchen HAP levels and/or personal exposure, to one or both of (i) small particulate matter which in practice was PM2.5 in most studies, but PM4 in a few, and (ii) carbon monoxide (CO). Studies reporting values of these pollutants based on a sampling duration of less than 20 hours were excluded as these were very unlikely to be representative of daily time-weighted averages and therefore not comparable with other studies. Study design Eligible studies comprised randomized controlled trials, quasi-experimental and before-and-after designs as well as observational study designs. Although a few quasi-experimental studies were available, only the intervention group data were used in order to achieve comparability with the much larger numbers of before-and-after studies. The observational studies, all of which were cross-sectional studies, were only included if they provided evidence about the performance of a fuel or stove technology which was known to be the subject of a programme to promote adoption in the same (or a similar) area. Study selection: Titles and abstracts were checked for relevance by one reviewer (KJ). Any abstract potentially meeting the inclusion criteria was subjected to full-text screening by one reviewer (KJ): those clearly not meeting the inclusion criteria were excluded, those potentially meeting the inclusion criteria were independently assessed by an additional reviewer (DP, MD, ER or NB). Likewise, the results of internet searches deemed relevant (as identified by KJ) were sent to two reviewers (two of DP, MD, ER or NB) for independent eligibility assessment. Any discordant decisions were discussed and, if no agreement could be reached, assessed by a third reviewer. To ensure that selection criteria were being consistently applied, a random sample of citations excluded at different stages was taken to verify the decisions, i.e. 10% of studies excluded on title, 10% of studies excluded on abstract and 20% of studies excluded on full paper. All decisions and reasons leading to the exclusion of studies were documented.
2.4 Data extraction and quality appraisal
Data extraction was carried out by one reviewer (one of KJ, DP, MD and NB) for all studies meeting the inclusion criteria, using a comprehensive data extraction form that had been piloted on a sub-set of programme evaluations and research studies. To maximize consistency, 1 in 5 data extractions were carried out independently by two reviewers and any discrepancies resolved through discussions. Any critical missing data were requested from

10
organizations (programme evaluations) or primary authors (research studies) by email, although not all of these requests were responded to. Quality appraisal was undertaken independently by two reviewers (DP, NB) for each included study, using quality appraisal tools developed by the Department of Public Health and Policy, University of Liverpool (Liverpool Quality Assessment Tools (LQATs) (4).Each tool is design specific and awards stars for methodological quality relating to risk of bias (selection, response, follow-up and measurement), risk of confounding (balance of randomisation and adjustment) and strength of measurement of exposure and outcome. A quality percentage can be ascertained (awarded stars out of total available for that design) and for this review > 60% was taken to represent moderate/ good quality. LQATs have been used in a number of reviews conducted (5),(6) and have been critically appraised in relation to other quality tools (7).
Those included studies with direct involvement from one or more of the review authors were extracted and quality appraised by one or more other authors not directly involved in the study concerned.
2.5 Evidence synthesis
Results have been first summarised in tables with key information for all included studies (see Box 1), and subsequently using a combination of meta-analysis and narrative synthesis.
Box 1: Key information provided in summary tables for each eligible study
Author (year) and country.
Study design, number of homes.
Baseline and intervention stoves and fuels.
Duration of follow-up (use of stove).
Whether analysis by intention to treat (comparison as allocated),
or per protocol (only users compared).
Sampling period and measure (e.g. PM2.5 or PM4).
Baseline and intervention values (SD), absolute difference (95%
CI), % reduction from baseline.
Quality assessment.
Four outcomes were appraised in the meta-analyses: PM concentrations in the kitchen (kitchen PM in mg/m3), CO concentrations in the kitchen (kitchen CO in ppm), personal exposure to PM (personal PM in mg/m3) and personal exposure to CO (personal CO in ppm). Studies were included if they provided estimates of baseline exposure (mean with standard deviation) and intervention exposure (mean with standard deviation). If standard deviations were not available they were calculated from other available data (e.g. 95% confidence intervals). The measure used in meta-analysis was absolute mean differences (i.e. intervention levels minus baseline levels); these present the data as reported by most studies and provide a more accurate picture of intervention impact than relative reductions that do not take into

11
account stark differences in baseline levels across studies and settings. Very few studies presented median values despite distributions of exposure often being skewed. Separate meta-analyses were conducted for those intervention categories (i.e. solid fuel stoves with chimneys, solid fuel stoves without chimneys, advanced combustion solid fuel stoves and ethanol), where a sufficient number of studies were available for pooling. A main meta-analysis was conducted for each of the four primary exposure outcomes, combining all available effect estimates. In addition, where there were sufficient studies, sensitivity analyses were carried out for (i) study design (before and after vs. cross-sectional studies), (ii) intention-to-treat (intervention households analysed according to original allocated of the intervention) vs. per-protocol analysis (households analysed according to whether they used the intervention) , and (iii) time since installation of intervention (< 6 months vs. ≥ 6 months). Generic inverse variance models were created in the Cochrane Collaboration’s RevMan software version 5 (http://www.cc-ims.net/RevMan) using means and standard deviations to calculate pooled estimates of HAP reductions. Given substantial study heterogeneity and, in many cases, statistical heterogeneity, random-effects meta-analyses were carried out using the method of der Simonian and Laird (8). For each of the primary outcomes, likely publication bias was assessed graphically by examining funnel plots and statistically using Begg’s and Egger’s tests in Stata version 9 (9). R software (10) was used to create plots of baseline (no intervention) and intervention levels of kitchen CO (ppm) and PM (mg/m3) with associated 95% confidence intervals. Narrative synthesis was undertaken for those intervention categories (i.e. mixed interventions, LPG, electricity, charcoal or coal stoves) where a very small number of studies prohibited pooling.
2.6 Assessment of strength of evidence (GEPHI)
As this review directly informs recommendations, GEPHI was applied where there were sufficient numbers of studies. The results of this profiling are included in the main results, and tabulated in Appendix 1. Even though concentrations of and personal exposure to HAP represent surrogate outcomes for actual health benefits, we did not downgrade for indirectness, as (i) these outcomes are relevant across a broad range of health endpoints and represent the only tangible measure of intervention impact in the short- to medium-term and (ii) dose-response relationships for PM have been documented for several health outcomes, validating their health importance (see Review 4). While the body of evidence in support of the impact of interventions to reduce HAP covers different populations living on three continents, the complex multi-component nature of these interventions and their dependence on contextual issues, ranging from local geographical, climatic, cultural and socio-economic issues to modes of programme implementation and policies (see Review 7) limits the direct applicability of findings to a specific context. In addition to the pooled results, it may also be useful to refer to individual studies as described in the summary tables for specific interventions and settings along with the individual study quality appraisal, although the external validity many of these studies needs careful consideration.
3. Results
3.1 Overview of included studies
Searches of electronic databases yielded a total of 5069 studies; grey literature databases, specialist websites and consultation of key informants resulted in the identification of an additional 15 studies for inclusion (Figure 1). Ultimately, 38 studies comprising 9 programme evaluations and 29 research studies met our inclusion criteria and were subjected to data

12
extraction and quality appraisal, producing a total of 98 estimates. In total 27 studies provided 45 estimates for kitchen particulate matter, 26 studies provided 40 estimates for kitchen CO, 3 studies provided 5 estimates for personal particulate matter and 5 studies provided 8 estimates for personal CO. Quality appraisal for each study is reported in the summary tables, and the overall quality of evidence for each stove/fuel type is discussed in the relevant section, including for the GEPHI assessment. Critically, studies in most of these categories are characterized by heterogeneity in type of intervention, baseline HAP levels, intervention setting and conduct and quality of study (including timing of evaluation relative to duration of use of the intervention), all of which contribute to large variations in the observed changes in HAP and personal exposure. Therefore, while the pooled effect estimate provides a useful overall measure of likely impact of the stove or fuel type in everyday use in the circumstances typical of developing country communities, it is equally important to examine the results of individual studies. Among the many factors which impact on these reductions, and (critically) the post-intervention levels achieved, are multiple stoves and fuel use in many homes (whether or not declared in the study), the effect of lighting and other combustion sources in and around the home, and pollutants from other homes and sources in the community. These other sources of pollution can only be assumed to be present, based on data of the type reported in Review 5, but have rarely been quantified in the evaluation studies reported here. Figure 1: Flowchart of search results leading to data extraction
3.2 Solid fuel stoves with chimneys
A total of 21 included studies – 1, 10 and 10 conducted in Africa, Asia and Latin America respectively reported on the impacts of solid fuel stoves with chimneys; most of these were classified as moderate quality studies. Stove models assessed comprised various fixed stove

13
types made of mudbrick (e.g. ENPHO stove), metal (e.g. rocket stove) or brick (e.g. plancha stove). Most studies measured kitchen PM (18 studies, 24 estimates) and kitchen CO (16 studies, 22 estimates); 3 studies (5 estimates) and 5 studies (8 estimates) were available for personal PM and personal CO.
3.2.1 Kitchen concentrations ***DAN HERE***Particulate matter Studies measuring kitchen PM are shown stratified by study design in Table 3. There were 12 before-and-after studies (17 estimates) and six cross-sectional studies (7 estimates). All but six of the studies were assessed to be of moderate or good quality. The baseline levels for kitchen PM ranged from 0.27 mg/m3 (SD 0.29) to 3.37 mg/m3 (SD 1.65), and post-intervention levels from 0.05 mg/m3 (SD 0.03) to 1.43 mg/m3 (SD 0.81) Table 3). The percentage reduction in PM ranged from a decrease by 89.7% to an increase of 14.8%. The baseline weighted means for kitchen PM were 1.03 mg/m3 and 1.02 mg/m3 for before-and-after designs and cross-sectional designs, respectively; post-intervention weighted means were 0.37 mg/m3 and 0.41 mg/m3 respectively. The weighted percentage reductions were 63.9% and 59.8% for before and after and cross-sectional designs, respectively.

14
Table 3: Solid fuel stoves with chimneys: Kitchen PM (mg/m3)
Author (year) and country
Baseline stove and fuel
Intervention stove and fuel if different
Duration of follow-up
Analytic or sampling approach
Number of homes
PM2.5 or PM4; period
Baseline PM (mg
m3) (SD)
Intervention
PM (mg m3)
(SD)
% reduct- ion from baseline
Absolute difference
$
(95%CI)
Global Quality assessment
Before and after designs
ITDG 2005a(11) Nepal (winter)
Traditional stove, biomass
Smoke hood 12 months Intention to treat
31 PM2.5 24-hr
1.07 (2.49) 0.24 (0.38) 77.4 -0.82 (-1.71, +0.06)
10 /14 stars (71.4%)
ITDG 2005b(11) Nepal (summer)
Traditional stove, biomass
Smoke hood 12 months Intention to treat
31 PM2.5 24-hr
0.40 (0.57) 0.042 (0.057) 89.5 -0.36 (-0.56, -0.16)
10 / 14 stars (71.4%)
Singh 2012(12) Nepal
Traditional stove, biomass
2-pot mud ICS 12 months Intention to treat
34 PM2.5 24-hr
2.07 (1.52) 0.76 (0.69) 63.3 -1.31 (-1.87, -0.75)
7 / 12 stars (58.3%)
Li 2011a(13) Peru (winter)
Traditional stove, biomass
HNP 3-pot metal stove
3 weeks Intention to treat
26 PM2.5 48-hr
0.38 (0.43) 0.13 (0.14) 65.8 -0.14 (-0.30, +0.02)
8 / 12 stars (66.7%)
Li 2011b(13) Peru (winter)
Traditional stove, biomass
BGC 3-pot metal stove
3 weeks Intention to treat
19 PM2.5 48-hr
0.32 (0.35) 0.11 (0.18) 65.6 -0.26 (-0.43, -0.08)
8 / 12 stars (66.7%)
Lam 2012(14) Honduras
Traditional stove, biomass
ECO biomass stove
3 weeks Intention to treat
25 PM2.5 24-hr
0.31 (0.26) 0.06 (0.05) 80.6 -0.25 (-0.35, -0.14)
8 / 12 stars (66.7%)
Chengappa 2007b(15) (summer) India
Traditional stove, wood/ dung
DA 2-pot with chimney
12 months Per-protocol 15 PM2.5 48-hr
0.65 (1.00) 0.36 (0.47) 44.6 -0.29 (-0.85, +0.27)
7 / 12 stars (58.3%)
Dutta 2007(16) India
Traditional stove, wood/ dung
ARTI Laxmi 12 months Per-protocol 27 PM2.5 48-hr
1.79 (2.17) 0.99 (1.23) 44.7 -0.80 (-1.74, +0.14)
8 / 12 stars (66.7%)
Brant 2012(17) India
Traditional stove, wood/ dung
Mangala 2-pot chimney
5-6 months
Per-protocol 12 PM2.5 24-hr
0.61 (0.60 0.18 (0.10) 71.2 -0.43 (-0.78, -0.09)
9 / 12 stars (75.0%)
Winrock 2008(18) Peru
Traditional stove, biomass
Rocket with chimney 12m f-up)*
12 months Per-protocol 32 PM4 24-hr
0.68 (0.87) 0.78 (1.39) -14.8 +0.10 (-0.47, +0.67)
6 / 12 strars (50.0%)

15
Author (year) and country
Baseline stove and fuel
Intervention stove and fuel if different
Duration of follow-up
Analytic or sampling approach
Number of homes
PM2.5 or PM4; period
Baseline PM (mg
m3) (SD)
Intervention
PM (mg m3)
(SD)
% reduct- ion from baseline
Absolute difference
$
(95%CI)
Global Quality assessment
Cynthia 2008(19) Mexico
Traditional stove, biomass
Patsari 1 month Per-protocol 33 PM2.5 48-hr
1.02 (0.79) 0.35 (0.27) 65.7 -0.68 (-1.04, -0.33)
11 / 16 stars (68.8%)
Terrado 2005a(20) Nicaragua
Traditional stove, biomass
Ecostove: closed
1-2 months
Intention to treat
20 PM2.5 24-hr
0.51 (0.39) 0.05 (0.03) 89.7 -0.46 (-0.63, -0.29)
9 / 12 stars (75.0%)
Terrado 2005b(20) Nicaragua
Traditional stove, biomass
Ecostove: semi-closed
1-2 months
Intention to treat
14 PM2.5 24-hr
0.64 (0.43) 0.12 (0.09) 21.1 -0.52 (-0.75, -0.29)
9 / 12 stars (75.0%)
ENPHO 2008a(21) Dolakha Nepal
Traditional stove, biomass
Mudbrick ICS < 3 months Intention to treat
8 PM2.5 24-hr
3.37 (1.65) 1.43 (0.81) 57.6 -1.95 (-3.22, -0.67)
7 / 12 stars (58.3%)
ENPHO 2008b(21) Dang Nepal
Traditional stove, biomass
Mudbrick ICS < 3 months Intention to treat
14 PM2.5 24-hr
2.65 (1.95) 0.75 (0.51) 71.8 -1.90 (-2.96, -0.85)
7 / 12 stars (58.3%)
ENPHO 2008c(21) Ilan Nepal
Traditional stove, biomass
Mudbrick ICS < 3 months Intention to treat
14 PM2.5 24-hr
0.89 (0.72) 0.31 (0.19) 65.4 -0.58 (-0.97, -0.19)
7 / 12 stars (58.3%)
PAC 2011(22) Madagascar
Traditional biomass
Fatana pipa 1-pot
5 months Intention to treat
33 PM2.5 24-hr
1.47 (2.14) 0.71 (0.75) 48.3 -0.75 (-1.53, +0.02)
13 / 14 stars (92.9%)
Weighted means
398 1.03 0.37 63.9
Cross sectional designs
Author (year) and country
Baseline stove and fuel
Intervention stove and fuel if different
Duration of follow-up
Analytic or sampling approach
Number of homes (Trad/Int)
PM2.5 or PM4; period
Baseline PM (mg
m3) (SD)
Intervention
PM (mg m3)
(SD)
% reduct- ion from baseline
Absolute difference
$
(95%CI)
Global Quality assessment
Naeher 2001(23) Guatemala
Traditional biomass
Plancha Several years
Selected stoves
17/26 PM2.5 24-hr
0.87 (0.50) 0.15 (0.12) 82.5 -0.72 (-0.96, -0.47)
5 / 9 stars (55.6%)
Albalak 2001(24) Guatemala
3-stone fire, biomass
Plancha, biomass
Several years
Selected good condition
58/59 PM2.5 24-hr
1.93 (1.28) 0.33 (0.22) 82.9 -1.60 (-1.93, -1.27)
5 / 7 stars (71.4%)
Cowlin Traditional G2-2000 6+ months Selected 20/20 PM2.5 0.70 (0.50) 0.80 (0.40) -14.3 +0.10 (- 8 / 9 stars

16
Author (year) and country
Baseline stove and fuel
Intervention stove and fuel if different
Duration of follow-up
Analytic or sampling approach
Number of homes
PM2.5 or PM4; period
Baseline PM (mg
m3) (SD)
Intervention
PM (mg m3)
(SD)
% reduct- ion from baseline
Absolute difference
$
(95%CI)
Global Quality assessment
2005a(25) Mongolia
heating stove, coal
from user list 24-hr 0.18, +0.38)
(88.9%)
Cowlin 2005b(25) Mongolia
Traditional heating stove, coal
TT03 6+ months Selected from user list
20/18 PM2.5 24-hr
0.70 (0.50) 0.60 (0.30) 14.3 -0.10 (-0.36, +0.16)
8 / 9 stars (88.9%)
Edwards 2007(26) China
Traditional stove, biomass
NISP Several years
Selected improved stoves
88/63 PM4 22 +/- 1 hr (>20)
0.27 (0.29) 0.15 (0.08) 43.3 -0.12 (-0.18, -0.05)
6 / 9 stars (66.7%)
Matsumura 2011(27) Peru
Traditional biomass
GIZ 2-pot design
1-2 months
Regular users
4/6 PM2.5 24-hr
1.24 (0.87) 0.23 (0.17) 81.3 -1.01 (-1.86, -0.15)
3 / 9 stars (33.3%)
Chowdhury 2012(28) Bangladesh
Traditional biomass
BCSIR stove Not described
Unselected 20/19 PM2.5 24-hr
1.92 (1.59) 1.38 (1.27) 28.1 -0.54 (-1.44, +0.36)
7 / 9 stars (77.8%)
Weighted means
227/217 1.02 0.41 59.8
$ Difference = Intervention mean minus baseline mean

17
The pooled effect estimate in random effects (RE) meta-analysis was -0.50 mg/m3 (95% CI: -0.64, -0.35), Figure 2. Figure 2: Random effects meta-analysis for absolute difference in PM (mg/m3) in kitchen
The I2 value of 86% (p<0.0001) showed there was a very high degree of statistical heterogeneity. Sensitivity analyses conducted with respect to study design, intention-to-treat analysis vs. per-protocol analysis and time since installation did not find major differences in absolute reductions of PM, and these methodological considerations are therefore unlikely to be responsible for a major share of the heterogeneity (Table 4). Removal of the single coal ICS study by Cowlin et al. (25) lead to a slightly larger pooled estimate for kitchen PM (-0.56; 95%CI -0.40, -0.71). Table 4: Summary of sensitivity analysis for kitchen PM (solid fuels stoves with chimneys)
Studies included Model Number of estimates
I-squared Pooled effect
(mg/m3)
All Random 24 86% -0.50 (-0.64, -0.35)
Before and after design Random 17 69% -0.46 (-0.60, -0.33)
Cross-sectional design Random 7 94% -0.53 (-0.94, +0.13)
Intention-to-treat analysis Random 15 74% -0.40 (-0.55, -0.26)
Per-protocol-analysis Random 9 93% -0.60 (-0.97, -0.23)
Time since installation <6 months Random 14 74% -0.39 (-0.53, -0.25)
Time since installation ≥ 6 months Random 9 93% -0.64 (-1.01, -0.27)

18
Overall (all studies), tests of funnel plot asymmetry were of borderline significance for Begg’s test (p=0.074), and highly significant for Egger’s test (p=0.001), with a strong suggestion of substantive publication bias in the direction of smaller studies reporting a larger reduction in PM. Analysis stratified by study design showed this bias to be greater for before-and-after designs (Begg’s p=0.023; Egger’s p=0.001) than for observational designs (Begg’s p=0.548; Egger’s p=0.207), Figure 3. Figure 3: Funnel Plot for kitchen PM (solid fuels stoves with chimneys) by study design
Carbon monoxide Studies measuring kitchen CO are shown stratified by study design in Table 5. There were 10 before-and-after studies (16 estimates) and six cross-sectional studies (7 estimates). All but five of the studies were assessed as to be of moderate or good quality. For CO, baseline levels ranged from 1.9 ppm (SD 1.0) to 38.7 ppm (SD 13.7) with post-intervention levels from 0.7 ppm (SD 0.5) to 17.2 ppm (SD 7.7) (Table 5). The percentage reduction in CO ranged from 23.3% to 87.5%; the baseline weighted means for before and after and cross-section designs were 12.3 ppm and 10.6 ppm, respectively, and post-intervention were 4.0 ppm and 4.9 ppm, respectively. The weighted percentage reductions were 67.1% and 53.9% for before and after and cross-sectional designs, respectively.
All studies: Begg’s test: p=0.074 Egger’s test: p=0.001
Before-After designs: Begg’s test: p=0.023 Egger’s test: p=0.001
Cross-sectional studies: Begg’s test: p=0.548 Egger’s test: p=0.207

19
Table 5: Solid fuel stoves with chimneys: Kitchen CO (ppm)
Author (year) and country
Baseline stove and fuel
Intervention stove and fuel if different
Duration of follow-up
Analytic or sampling approach
Number of homes
Units and averaging period
Baseline CO (ppm) (SD)
Intervention CO (ppm) (SD)
% reduct- ion from baseline
Absolute difference
$
(95%CI)
Global Quality assessment
Before and after designs and RCT (Smith 2009)
ITDG 2005a(11) Nepal (winter)
Traditional srove, biomass
Smoke hood 12 months Intention to treat
31 ppm 24-hr
11.9 (16.8)
4.5 (4.4) 62.2 -7.42 (-13.52, -1.32)
10 / 14 stars (71.4%)
ITDG 2005b(11) Nepal (summer)
Traditional stove, biomass
Smoke hood 12 months Intention to treat
31 ppm 24-hr
7.8 (9.8) 4.1 (6.6) 47.4 -1.27 (-4.99, -2.45)
10 / 14 stars (71.4%)
ITDG 2007(29) Nepal
Traditional stove, biomass
Smoke hood, chimney, improvements
6-9 months
Intention to treat
124 ppm 24-hr
12.8 (18.7)
1.6 (1.6) 87.5 -11.26 (-14.56, -7.96)
8 / 12 stars (66.7%)
Li 2011a(13) Peru
Traditional stove, biomass
HNP 3-pot metal stove
3 weeks Intention to treat
26 ppm 24-hr
4.9 (4.8) 2.0 (3.8) 59.2 -2.90 (-5.25, -0.55)
8 / 12 stars (66.7%)
Li 2011b(13) Peru
Traditional stove, biomass
BGC 3-pot metal stove
3 weeks Intention to treat
19 ppm 24-hr
3.7 (3.2) 1.6 (1.9) 56.8 -2.10 (-3.77, -0.43)
8 / 12 stars (66.7%)
Chengappa 2007a(15) (winter) India
Traditional stove, wood/ dung
DA 2-pot with chimney
12 months Per-protocol
36 ppm 48-hr
7.9 (6.8) 5.5 (4.7) 30.4 -2.40 (-5.10, +0.30)
7 / 12 stars (58.3%)
Chengappa 2007b(15) (summer) India
Traditional stove, wood/ dung
DA 2-pot with chimney
12 months Per-protocol
15 ppm 48-hr
8.7 (7.8) 2.7 (2.8) 69.1 -5.99 (-10.18, -1.80)
7 / 12 stars (58.3%)
Dutta 2007(16) India
Traditional stove, wood/ dung
ARTI Laxmi 12 months Per-protocol
30 ppm 48-hr
15.3 (9.1) 8.4 (10.2) 45.3 -6.93 (-11.83, -2.03)
8 / 12 stars (75.0%)
Brant 2012(17) India
Traditional stove, wood/ dung
Mangala 2-pot chimney
5-6 months
Per-protocol
9 ppm 24-hr
5.7 (2.5) 2.3 (1.6) 59.6 -3.40 (-5.34, -1.46)
9 / 12 stars (75.0%)
Cynthia 2008(19) Mexico
Traditional stove, biomass
Patsari 1 month Per-protocol
32 ppm 48-hr
8.9 (4.4) 3.0 (2.7) 66.3 -5.90 (-7.69, -4.11)
11 / 16 stars (68.8%)
ENPHO 2008a(21)
Traditional stove,
Mudbrick ICS < 3 months
Intention to treat
8 ppm 24-hr
38.7 (13.7)
17.2 (7.7) 55.5 -21.44 (-32.32, -
7 / 12 stars (58.3%)

20
Author (year) and country
Baseline stove and fuel
Intervention stove and fuel if different
Duration of follow-up
Analytic or sampling approach
Number of homes
Units and averaging period
Baseline CO (ppm) (SD)
Intervention CO (ppm) (SD)
% reduct- ion from baseline
Absolute difference
$
(95%CI)
Global Quality assessment
Dolakha Nepal
biomass 10.56)
ENPHO 2008b(21) Dang Nepal
Traditional stove, biomass
Mudbrick ICS < 3 months
Intention to treat
14 ppm 24-hr
26.3 (23.2)
8.3 (5.5) 68.3 -17.95 (-30.43, -5.47)
7 / 12 stars (58.3%)
ENPHO 2008c(21) Ilan Nepal
Traditional stove, biomass
Mudbrick ICS < 3 months
Intention to treat
14 ppm 24-hr
4.7 (4.7) 3.3 (1.9) 29.5 -1.40 (-4.08, 1.28)
7 / 12 stars (58.3%)
Smith 2009(30) Guatemala
Traditional stove, biomass
Plancha 18 months Intention to treat
64 ppm 48-hr
8.6 (4.0) 1.1 (1.4) 87.2 -7.50 (-8.88, -6.12)
12 / 12 stars (100%)
PAC 2011(22) Madagascar
Traditional biomass
Fatana pipa 1-pot
5 months Intention to treat
32 ppm 24-hr
19.0 (26.0)
9.0 (16.0) 52.6 -10.0 (-20.58, +0.58)
13 / 14 stars (92.9%)
Singh 2012(12) Nepal
Traditional stove, biomass
2 pothole mud stove, biomass
12 months Intention to treat
34 Ppm 24-hr
21.5 (20.1)
8.62 (6.98) 40.1 -12.88 (-5.73, -20.03)
7/12 stars (58%)
Weighted means
519 12.3 4.0 67.1
Author (year) and country
Baseline stove and fuel
Intervention stove and fuel if different
Duration of follow-up
Analytic or sampling approach
Number of homes (Trad/Int)
Units and averaging period
Baseline CO (ppm) (SD)
Intervention CO (ppm) (SD)
% reduct- ion from baseline
Absolute difference
$
(95%CI)
Global Quality assessment
Cross sectional designs
Naeher 2001(23) Guatemala
Traditional biomass
Plancha Several years
Selected stoves
18/28 ppm 24-hr
10.6 (5.4) 2.0 (2.1) 81.2 -8.62 (-11.25, -5.99)
5 / 9 stars (55.6%)
Bruce 2004(31) Guatemala
Traditional stove, biomass
Plancha Several years
Random sample
99/46 ppm 24-hr
12.4 (10.9)
4.9 (3.7) 60.5 -7.49 (-9.89, -5.09)
8 / 11 stars (72.7%)
Cowlin 2005a(25) Mongolia
Traditional stove, biomass
G2-2000 6+ months Selected from user list
20/20 ppm 24-hr
11.6 (9.7) 7.8 (3.0) 32.8 -3.80 (-8.25, +0.65)
8 / 9 stars (88.9%)
Cowlin 2005b(25) Mongolia
Traditional stove, biomass
TT-03 6+ months Selected from user list
20/18 ppm 24-hr
11.6 (9.7) 8.9 (2.3) 23.3 -2.70 (-7.29, +1.89)
8 / 9 stars (88.9%)
Edwards 2007(26) China
Traditional stove (coal)?
NISP China Several years
Selected improved stoves
7/6 ppm 24-hr
1.9 (1.0) 0.7 (0.5) 62.2 -1.15 (-2.01, -0.29)
6 / 9 stars (66.7%)

21
Author (year) and country
Baseline stove and fuel
Intervention stove and fuel if different
Duration of follow-up
Analytic or sampling approach
Number of homes
Units and averaging period
Baseline CO (ppm) (SD)
Intervention CO (ppm) (SD)
% reduct- ion from baseline
Absolute difference
$
(95%CI)
Global Quality assessment
Matsumura 2011(27) Peru
Traditional biomass
GIZ 2-pot design
1-2 months
Regular users
4/3 ppm 24-hr
15.5 (3.7) 5.7 (7.9) 63.4 -9.85 (-19.49, -0.21)
3 / 9 stars (33.3%)
Chowdhury 2012(28) Bangladesh
Traditional biomass
BCSIR stove Not stated Users not selected
21/23 ppm 24-hr
4.9 (6.3) 3.0 (2.3) 39.4 -1.93 (-4.78, +0.92)
7 / 9 stars (77.8%)
Weighted means 189/144 10.6 4.9 53.9 $ Difference = Intervention mean minus baseline mean

22
The pooled effect estimate in RE meta-analysis was -5.4 ppm (95% confidence interval -7.3, -3.6), Figure 4 and Table 6. As with PM, sensitivity analysis to assess the impact of a number of methodological aspects showed no remarkable findings. Removal of the single coal ICS study by Cowlin et al. (25) lead to a slightly larger pooled estimate for kitchen CO (-5.6 ppm; 95%CI -4.0, -7.2).
Figure 4: Random effects meta-analysis for absolute difference in CO (ppm) in kitchen
Table 6: Summary of sensitivity analysis for kitchen CO (solid fuels stoves with chimneys)
Studies included Model Number of estimates
I-squared
Pooled effect (ppm)
All Random 23 85% -5.39 (-6.92, -3.86)
Before and after design or RCT Random 16 81% -5.69 (-7.47, -3.92)
Cross-sectional design Random 7 88% -4.66 (-7.66, -1.66)
Intention-to-treat analysis Random 13 78% -5.55 (-7.73, -3.08)
Per-protocol analysis Random 10 91% -5.55 (-7.77, -3.33)
Time since installation <6 months Random 10 85% -4.81 (-6.84, -2.77)
Time since installation ≥ 6 months Random 9 73% -6.66 (-8.79, -4.53)
For all studies, the tests for funnel plot asymmetry were non-significant for Begg’s test (p = 0.176), but significant for Egger’s test (p=0.025), suggesting that there may also have been publication bias for this pollutant in the direction of smaller studies reporting a larger reduction in CO. Again, analysis stratified by study design showed this bias to be more apparent among before-and-after designs (Begg’s p=0.063; Egger’s p=0.038) than among observational studies (Begg’s p=0.764; Egger’s p=0.130), Figure 5.

23
Figure 5: Funnel Plot for kitchen CO (solid fuels stoves with chimneys) by study design
Overall strength of evidence: impacts of solid fuel stoves with chimneys on kitchen PM and CO Particulate matter: For kitchen PM, the GEPHI assessment is based on twelve before-and-after studies (see Annex Table A1.1(a)). These were entered into the profile as moderate quality and downgraded for heterogeneity and publication bias, but upgraded for large effect (>50% reduction relative to baseline concentration). This resulted in an initial assessment of Low. As 11 out of the 12 studies (all 11 biomass studies) showed a reduction in kitchen PM, these were upgraded for consistency across settings, resulting in a final grading of Moderate. The effect estimate was -0.46 (-0.33, -0.60) mg/m3. Despite the lower quality of the cross-sectional evidence, it is notable how similar the effect estimate was from these six studies. Carbon monoxide: For kitchen CO, the GEPHI assessment included one RCT (rated high) and ten before-and-after studies (see Annex Table A1.1(b)). The before-and-after studies were downgraded for heterogeneity and publication bias, but upgraded for large effect of >50% reduction. This resulted in an initial grading of Low. As the RCT and all before-and-after studies showed reductions in CO, the assessment was upgraded for consistency across settings, resulting in a final assessment of Moderate. The effect estimate was a reduction of 5.7 ppm (-3.9, -7.5), once again similar to the result for the cross-sectional studies.
3.2.2 Personal exposures Particulate matter Studies measuring personal PM are summarised in Table 8. There were three studies (5 stove estimates); all were before-and-after studies and all were scored as moderate to good
All studies: Begg’s test: p=0.176 Egger’s test: p=0.025
Before-After designs: Begg’s test: p=0.063 Egger’s test: p=0.038
Cross-sectional studies: Begg’s test: p=0.764 Egger’s test: p=0.130

24
quality. Baseline levels ranged from 0.15 mg/m3 (SD 0.07) to 0.37 mg/m3 (SD 0.46), post-intervention levels from 0.05 mg/m3 (SD 0.03) to 0.16 mg/m3 (SD 0.13) (Table 7). The percentage reduction in PM ranged from 33.3% to 86.5% of baseline level. The weighted means for personal PM for all studies were 0.27 mg/m3 at baseline and 0.07 mg/m3 post-intervention, with a weighted percentage reduction of 75.7%.

25
Table 7: Solid fuel stoves with chimneys: Personal PM (mg/m3)
Author (year) and country
Baseline stove and fuel
Intervention stove and fuel if different
Duration of follow-up
Analytic or sampling approach
Number of homes
PM2.5 or PM4; period
Baseline PM
(mg/m3)
(SD)
Intervention
PM (mg/m3)
(SD)
% reduct- ion from baseline
Absolute difference
$
(95%CI)
Global Quality assessment
Before and after designs
Li 2011a(13) Peru
Traditional stove, biomass
HNP 3-pot metal stove
3 weeks Intention to treat
26 PM2.5 24-hr
0.19 (0.29)
0.08 (0.05) 57.9 -0.11 (-0.22, +0.01)
8 / 12 stars (66.7%)
Li 2011b(13) Peru
Traditional stove, biomass
BGC 3-pot metal stove
3 weeks Intention to treat
19 PM2.5 24-hr
0.15 (0.07)
0.07 (0.05) 53.3 -0.07 (-0.11, -0.03)
8 / 12 stars (66.7%)
Cynthia 2008(19) Mexico
Traditional stove, biomass
Patsari 1 month Per-protocol
26 PM2.5 24-hr
0.24 (0.23)
0.16 (0.13) 33.3 -0.68 (-1.04, -0.33)
11 / 16 stars (68.8%)
Terrado 2005a(20) Nicaragua
Traditional stove, biomass
Ecostove: closed
1-2 months
Intention to treat
28 PM2.5 24-hr
0.37 (0.46)
0.05 (0.03) 86.5 -0.46 (-0.63, -0.29)
9 / 12 stars (75.0%)
Terrado 2005b(20) Nicaragua
Traditional stove, biomass
Ecostove: semi-closed
1-2 months
Intention to treat
30 PM2.5 24-hr
0.36 (0.31)
0.10 (0.13) 72.2 -0.52 (-0.75, -0.29)
9 / 12 stars (75.0%)
Weighted means 129 0.27 0.07 75.7 $ Difference = Intervention mean minus baseline mean

26
The pooled estimate for absolute reductions in personal PM was -0.15 mg/m3 (95% CI: -0.24, -0.06), (Figure 6Figure 6 and Table 7). The I2 value of 74% (p=0.004) indicates considerable statistical heterogeneity, but there were insufficient studies for any further sensitivity analysis.
Figure 6: Random effects meta-analysis for absolute difference in personal PM (mg/m3)
Table 8: Summary of meta-analysis for impact on personal PM of stoves with chimneys
Studies included Model Number of studies (estimates)
I-squared Pooled effect (95% CI)
All (before-and-after) Random 3 (5) 74% -0.15 (-0.24, -0.06)
There was no statistical evidence of publication bias according to Begg’s (p=0.514) and Egger’s (p=0.356) tests, although this was based on only 3 before-and-after studies (5 estimates) (Figure 7). Figure 7: Funnel Plot for personal PM (solid fuels stoves with chimneys) by study design
All studies: Begg’s test: p=0.514 Egger’s test: p=0.356

27
Carbon monoxide Studies measuring personal CO are summarised in Table 9Table 9. These included three study designs: one RCT (2 estimates), two before-and-after studies (3 estimates), and two cross-sectional studies (3 estimates), with all but one being scored moderate or good for quality. Baseline levels ranged from 1.2 ppm (SD 1.0) to 4.8 ppm (SD 3.6), with post-intervention levels from 0.7 ppm (SD 0.7) to 2.3 ppm (SD 1.3). The percentage reduction in CO ranged from 16.7% to 69.1%. Weighted means at baseline for before-and-after studies and cross-sectional studies were 3.7 ppm and 3.3 ppm, respectively, and those post intervention were 1.8 ppm and 1.7 ppm, respectively. The weighted percentage reductions for before-and-after studies and cross-sectional studies were 51.3% and 46.9%, respectively.

28
Table 9: Solid fuel stoves with chimneys: Personal CO (ppm)
Author (year) and country
Baseline stove and fuel
Intervention stove and fuel if different
Duration of follow-up
Analytic or sampling approach
Number of homes
Units and averaging period
Baseline CO (ppm) (SD)
Intervention CO (ppm) (SD)
% reduct- ion from baseline
Absolute difference
$
(95%CI)
Global Quality assessment
Before and after designs
Smith 2009a(32) (mothers) Guatemala
Traditional stove, biomass
Plancha 18 months RCT Intention to treat
488 ppm 48-hr
4.8 (3.6) 2.2 (2.6) 54.2 -2.60 (-3.16, -2.04)
12 / 12 stars (100%)
Smith 2009b(32) (children) Guatemala
Traditional stove, biomass
Plancha 18 months RCT Intention to treat
500 ppm 48-hr
2.8 (2.5) 1.5 (1.9) 46.4 -1.30 (-1.69, -0.91)
12 / 12 stars (100%)
Li 2001a(13) Peru
Traditional stove, biomass
HNP 3-pot metal stove
3 weeks Intention to treat
26 ppm 24-hr
1.5 (1.0) 0.7 (0.7) 53.3 -0.80 (-1.26, -0.34)
8 / 12 stars (66.7%)
Li 2011b(13) Peru
Traditional stove, biomass
BGC 3-pot metal stove
3 weeks Intention to treat
19 ppm 24-hr
1.2 (1.0) 1.0 (0.7) 16.7 -0.23 (-0.79, +0.33)
8 / 12 stars (66.7%)
Cynthia 2008(19) Mexico
Traditional stove, biomass
Patsari 1 month RCT Per-protocol
24 ppm 24-hr
2.7 (2.1) 1.0 (1.6) 63.0 -1.70 (-2.76, -0.64)
11 / 16 stars (68.8%)
Weighted means
1012 3.7 1.8 51.3%
Author (year) and country
Baseline stove and fuel
Intervention stove and fuel if different
Duration of follow-up
Analytic or sampling approach
Number of homes (Trad/Int)
Units and averaging period
Baseline CO (ppm) (SD)
Intervention CO (ppm) (SD)
% reduct- ion from baseline
Absolute difference
$
(95%CI)
Global Quality assessment
Cross sectional designs
Bruce 2004(31) Guatemala
Traditional stove, biomass
Plancha Several years
Random sample
99/46 ppm 24-hr
3.3 (2.0) 2.3 (1.3) 32.6 -1.09 (1.64, -0.54)
8 / 11 stars (72.7%)
Naeher 2001a(23) (Children) Guatemala
Traditional stove, biomass
Plancha Several years
Selected stoves
25/28 ppm 24-hr
3.0 (3.3) 1.0 (1.1) 67.8 -2.02 (-3.39, -0.65)
5 / 9 stars (55.6%)
Naeher 2001b(23) (Mothers) Guatemala
Traditional stove, biomass
Plancha Several years
Selected stoves
25/26 ppm 24-hr
3.4 (3.4) 1.1 (1.7) 69.1 -2.38 (-3.85, -0.91)
5 / 9 stars (55.6%)
Weighted means 149/100 3.3 1.7 46.9 $ Difference = Intervention mean minus baseline mean

29
The pooled effect estimate (from random-effects meta-analysis) was -1.42 ppm (95%CI: -1.99, -0.85), Figure 8. The I2 value of 84% (p<0.001) indicated a high level of statistical heterogeneity. Figure 8: Random effects meta-analysis for absolute difference in personal CO (ppm)
Sensitivity analysis examining the three types of study design showed a larger effect in the cross-sectional studies (-1.60; -2.44, -0.76) and the only RCT (2 estimates: -1.93; -1.99, -0.85) than for the before-and-after studies (-0.79; -1.45, -0.13). There were insufficient studies for any further sensitivity analysis (Table 10). Table 10: Summary of meta-analysis for impact on personal CO of stoves with chimneys
Studies included Model Number of studies (estimates)
I-squared Pooled effect (95%CI)
All Random 5 (8) 84% -1.42 (-1.99, -0.85)
RCT Random 1 (2) 93% -1.93 (-3.21, -0.66)
Before-and-after Random 2 (3) 69% -0.79 (-1.45, -0.13)
Cross sectional Random 2 (3) 46% -1.60 (-2.44, -0.76)
As with personal PM, there was no statistical evidence of publication bias in studies of personal CO according to Begg’s (p=0.440) and Egger’s (p=0.212) tests (Figure 9). Overall strength of evidence: impacts of solid fuel stoves with chimney on personal PM and CO Particulate matter There were only three before-and-after studies reporting on personal PM. The GEPHI assessment downgraded these for heterogeneity, but upgraded for large effect (>50% reduction), resulting in an initial score of Moderate. No additional criteria could be applied, so the final assessment was Moderate, with an effect estimate of -0.15 (-0.06, -0.24) mg/m3. Carbon monoxide There was a slightly larger set of five studies available reporting on personal CO, with a mix of designs. The single RCT provided separate estimates for women and children and was scored high, but could not be used alone. The before-and-after studies were downgraded for heterogeneity, and upgraded for large effect (>50% reduction from baseline), resulting in an initial assessment of Moderate. The cross-sectional studies were not downgraded for heterogeneity, but did not have a large effect, so the initial assessment was Low. Given the small numbers of studies in each design group, the final assessment was based on all of the available studies, and rated Low; with an effect estimate of -1.42 (-0.90, -2.0) ppm.

30
Figure 9: Funnel Plot for personal CO (solid fuels stoves with chimneys) by study design
[
3.3 Solid fuel stoves (standard combustion type) without chimneys
Overall, 5 included studies, 3 and 2 studies conducted in Africa and Asia respectively, addressed impacts of solid fuel stoves using standard (i.e. not enhanced by forced draught or gasification) without chimneys; most of these were classified as moderate quality studies. These mainly used rocket-type combustion chambers, although a few used more traditional combustion chamber designs with a grate. Seven and eight estimates were available for kitchen PM and kitchen CO respectively.
3.3.1 Kitchen concentrations Particulate matter Studies measuring effects on kitchen PM are shown in Table 11. There were four studies (7 estimates), all studies were before-and-after designs and all but one scored moderate or good for quality. Baseline levels for kitchen PM range from 0.29 mg/m3 (SD 0.37) to 2.29 mg/m3 (SD 1.63), post-intervention levels from 0.28 mg/m3 (SD 0.26) to 1.18 mg/m3 (SD 1.54). The PM percentage reduction ranged from 33.6% to 54.3%. The weighted means for kitchen PM were 0.78 mg/m3 at baseline and 0.41 mg/m3 post-intervention, and the weighted percentage reduction was 47.6%.
All studies: Begg’s test: p=0.440 Egger’s test: p=0.212

31
Table 11: Solid fuel stoves without chimneys: Kitchen PM (mg/m3)
Author (year) and country
Baseline stove and fuel
Intervention stove and fuel if different
Duration of follow-up
Analytic or sampling approach
Number of homes
PM2.5 or PM4; period
Baseline PM
(mg/m3) SD)
Intervention PM
(mg/m3) (SD)
% reduct- ion from baseline
Absolute difference
$
(95%CI)
Global Quality assessment
Before and after studies (all studies)
Brant 2012a(17) India
Traditional stove, wood/ dung
B1100 - rocket
5-6 months
Per-protocol 39 PM2.5 24-hr
0.42 (0.43) 0.28 (0.26) 42.8 -0.14 (-0.30, +0.02)
9 / 12 stars (75.0%)
Brant 2012b(17) India
Traditional stove, wood/ dung
Mangala 1-pot no chimney
5-6 months
Per-protocol 22 PM2.5 24-hr
0.78 (0.70) 0.45 (0.44) 54.3 -0.33 (-0.68, +0.01)
9 / 12 stars (75.0%)
Brant 2012c(17) India
Traditional stove, wood/ dung
Mangala 2-pot no chimney
5-6 months
Per-protocol 25 PM2.5 24-hr
1.31 (1.15) 0.60 (0.74) 39.9 -0.71 (-1.25, -0.18)
9 / 12 stars (75.0%)
Brant 2012d(17) India
Traditional stove, wood/ dung
S2100 - rocket
5-6 months
Per-protocol 19 PM2.5 24-hr
0.29 (0.37) 0.17 (0.10) 33.6 -0.11 (-0.29, +0.06)
9 / 12 stars (75.0%)
CEIHD 2006(33) Ghana
Traditional stove, biomass
Enterprise works/ VITA Gyapa Rocket
<6 months
Intention to treat
36 PM2.5 24-hr
0.65 (0.49) 0.32 (0.24) 50.8 -0.33 (-0.51, -0.15)
8 / 12 stars (66.7%)
Dutta 2007(16) India
Traditional stove, wood/ dung
Bhagyalaxmi 12 months
Per-protocol 21 PM2.5 48-hr
0.95 (1.20) 0.48 (0.55) 49.5 -0.47 (-1.03, +0.09)
8 / 12 stars (66.7%)
Pennise 2007(34) Uganda
Traditional stove, wood/ dung
UCEODA Rocket wood stove
1 month to 1 year
Reverse order; selected users
7 PM2.5 24-hr
2.29 (1.63) 1.18 (1.54) 48.6 -1.11 (-2.77, +0.55)
6 / 12 stars (50.0%)
Weighted means 169 0.78 0.41 47.6 $ Difference = Intervention mean minus baseline mean

32
The main meta-analysis yielded a pooled effect estimate of -0.26 mg/m3 (95% confidence interval -0.39; -0.12) (Figure 10). Figure 10: Random effects meta-analysis (absolute difference in PM (mg/m3) in kitchen)
Whilst the p-value for heterogeneity was non-significant (p>0.1), the I2 statistic indicated some minor heterogeneity (36%) and random effects meta-analysis was used. Sensitivity analyses for intention-to-treat vs. per-protocol analysis did not show any major differences, Table 12. Table 12: Summary of sensitivity analysis for reductions in kitchen PM for stoves without chimneys
Studies included Model Number of studies I-squared Pooled effect
All Random 7 36% -0.26 (-0.39, -0.12)
Intention-to-treat analysis Random 1 - -0.33 (-0.51, -0.15)
Per-protocol analysis Random 6 34% -0.24 (-0.40, -0.08)
The funnel plot for kitchen PM shows some asymmetry, Figure 11. While the Begg’s test was not statistically significant, the Egger’s test showed borderline statistical significance, indicating the possibility of publication bias. Figure 11: Funnel Plot for reductions in kitchen PM for stoves without chimneys
All studies Begg’s test: p=0.288 Egger’s test: p=0.051

33
Carbon monoxide Studies reporting impacts on kitchen CO are shown in Table 13. There were five studies (8 estimates), all but one were before-and-after designs, and all scored moderate to good on quality. Baseline levels ranged from 6.6 ppm (SD 6.1) to 34.5 ppm (SD 33.5), post-intervention levels from 4.4 ppm (SD 4.0) to 15.7 ppm (SD 19.2). The percentage reduction ranged from 11.4% to 54.5%. The weighted means at baseline for before-and-after studies and cross-sectional studies were 10.8 ppm and 11.8 ppm, respectively and post-intervention 6.6 ppm and 7.3 ppm, respectively. The weighted percentage reductions for before-and-after studies and cross-sectional studies were 38.7% and 38.1%, respectively.

34
Table 13: Solid fuel stoves without chimneys: Kitchen CO (ppm)
Author (year) and country
Baseline stove and fuel
Intervention stove and fuel if different
Duration of follow-up
Analytic or sampling approach
Number of homes
Units and averaging period
Baseline CO (ppm) (SD)
Intervention CO (ppm) (SD)
% reduct- ion from baseline
Absolute difference
$
(95%CI)
Global Quality assessment
Before and after studies
Brant 2012a(17) India
Traditional stove, biomass
B1100 - rocket
5-6 months
Per-protocol
38 ppm 24-hr
9.6 (9.1) 6.2 (6.5) 35.4 -3.40 (-6.96, +0.16)
9 / 12 stars (75.0%)
Brant 2012b(17) India
Traditional stove, biomass
Mangala 1-pot no chimney
5-6 months
Per-protocol
24 ppm 24-hr
6.6 (6.1) 4.4 (4.0) 54.5 -2.20 (-5.12, +0.72)
9 / 12 stars (75.0%)
Brant 2012c(17) India
Traditional stove, biomass
Mangala 2-pot no chimney
5-6 months
Per-protocol
25 ppm 24-hr
10.5 (6.8) 5.9 (5.1) 43.8 -4.60 (-7.93, -1.27)
9 / 12 stars (75.0%)
Brant 2012d(17) India
Traditional stove, biomass
S2100 - rocket
5-6 months
Per-protocol
18 ppm 24-hr
7.0 (7.3) 6.2 (4.2) 11.4 -0.80 (-4.69, +3.09)
9 / 12 stars (75.0%)
CEIHD 2006(33) Ghana
Traditional stove, biomass
Enterprise works/ VITA Gyapa Rocket
<6 months
Intention to treat
36 ppm 24-hr
12.3 (9.9) 7.4 (6.1) 39.8 -4.90 (-8.70, -1.10)
8 / 12 stars (66.7%)
Dutta 2007(16) India
Traditional stove, biomass
Bhagyalaxmi 12 months
Per-protocol
22 ppm 24-hr
11.1 (7.8) 6.9 (7.0) 37.8 -4.20 (-8.59, +0.19)
8 / 12 stars (66.7%)
Pennise 2007(34) Uganda
Traditional stove, biomass
UCEODA Rocket wood stove
1 month to 1 year
Reverse order; selected
7 ppm 24-hr
34.5 (33.5)
15.7 (19.2) 54.5 -18.80 (-47.4, +9.80)
6 / 12 stars (66.7%)
All before and after studies
Weighted means
170 10.8 6.6 38.7
Author (year) and country
Baseline stove and fuel
Intervention stove and fuel if different
Duration of follow-up
Analytic or sampling approach
Number of homes (Trad/Int)
Units and averaging period
Baseline CO (ppm) (SD)
Intervention CO (ppm) (SD)
% reduct- ion from baseline
Absolute difference
$
(95%CI)
Global Quality assessment
Cross-sectional studies
Ochieng 2012(35) Kenya
Traditional stove, biomass
GIZ mud rocket stove
10 months (1-24)
Randomly selected adopters
94 ppm 48-hr
11.8 (15.0)
7.3 (7.2) 38.1 -4.50 (-9.32, +0.32)
7 / 9 stars (77.8%)
$ Difference = Intervention mean minus baseline mean

35
The pooled estimate in fixed effect meta-analysis was -3.4 ppm (95%CI -4.8, -2.0), with an I2 value of 0% showing no heterogeneity between included studies (Figure 12). In sensitivity analyses, a meta-analysis of the two intention-to-treat analysis studies showed somewhat greater CO reductions than the main meta-analysis but confidence intervals were very wide, Table 14. Neither the funnel plot nor Begg’s or Egger’s tests suggested a risk of publication bias, Figure 13. Figure 12: Fixed effect meta-analysis (absolute difference in CO (ppm) in kitchen)
Table 14: Sensitivity analysis for effects of non-chimney stoves on kitchen CO
Studies included Model Number of studies
I-squared
Pooled effect
All Random 8 0% -3.41 (-4.80, -2.02)
Intention-to-treat analysis Random 2 0% -4.75 (-7.73, -1.76)
Per-protocol analysis Random 6 0% -3.04 (-4.61, -1.48)
Figure 13: Funnel Plot for effects of studies of non-chimney stoves on CO
All studies Begg’s test: p=0.266 Egger’s test: p=0.158

36
Overall assessment of evidence on impact of non-chimney stoves on kitchen PM and CO Particulate matter: All studies reporting kitchen PM were before-and-after designs, and were downgraded for publication bias, so the initial assessment was Low. With only 4 studies, no other criteria were applied, and the final assessment was therefore also Low, with an effect size of -0.26 (-0.12, -0.39) mg/m3. Carbon monoxide: The same four studies were available for kitchen CO, and were not downgraded as there was no heterogeneity or publication bias, so the initial assessment was Moderate. No other criteria were applied so the final assessment was Moderate, and the effect size -3.32 (-1.86, -4.77) ppm.
3.3.2 Personal exposures None of the included studies contained data on personal exposure to PM and CO for solid fuel stoves without chimneys.
3.4 Advanced combustion solid fuel stoves
Only three studies addressed impacts of advanced combustion solid fuel stoves, all of which were conducted as a set by the same investigators in India (36); these were before-and-after studies and classified as of moderate quality. Stove models comprised free convection-, forced convection- and forced-convection combined with optimized fuel stoves. During the evaluation studies, users were reported not to be using the stove either fully or in an ideal fashion. All three studies measured kitchen PM and kitchen CO, but not personal exposure.
3.4.1 Kitchen exposures Particulate matter: The studies measuring kitchen PM are summarised in Table 15. Baseline levels for kitchen PM ranged from 0.32 mg/m3 (SD 0.42) to 1.55 mg/m3 (SD 2.97), and post-intervention levels from 0.18 mg/m3 (SD 0.18) to 1.11 mg/m3 (SD 3.32). The percentage reduction in PM ranged from 28.7% to 48.6%. The weighted means for kitchen PM for all studies were 0.65 mg/m3 at baseline and 0.38 mg/m3 post-intervention, with a weighted average percentage reduction from baseline of 41.4%.

37
Table 15: Advanced combustion solid fuel stoves: Kitchen PM (mg/m3)
Author (year) and country
Baseline stove and fuel
Intervention stove
Duration of follow-up
Analytic or sampling approach
Number of homes
PM2.5 or PM4; period
Baseline PM
(mg/m3)
(SD)
Intervention
PM (mg/m3)
(SD)
% reduct- ion from baseline
Absolute difference
$
(95%CI)
Global quality assessment
Before and after designs (all studies)
Balakrishnan 2012(36)
Traditional stove, biomass
Free convection N/A N/A 44 N/A 0.53 (0.60) 0.27 (0.26) 49.6 -0.26 (-0.46, -0.07)
8/12 stars 67%
Balakrishnan 2012(36)
Traditional stove, biomass
Forced convection and optimised fuel
N/A N/A 11 N/A 0.32 (0.42) 0.18 (0.18) 42.7 -0.14 (-0.41, +0.13)
8/12 stars 67%
Balakrishnan 2012(36)
Traditional stove, biomass
Forced convection
N/A N/A 10 N/A 1.55 (2.97) 1.12 (3.32) 28.7 -0.44 (-3.21, +2.32)
8/12 stars 67%
All studies
Weighted means 65 0.65 0.38 41.4 $ Difference = Intervention mean minus baseline mean
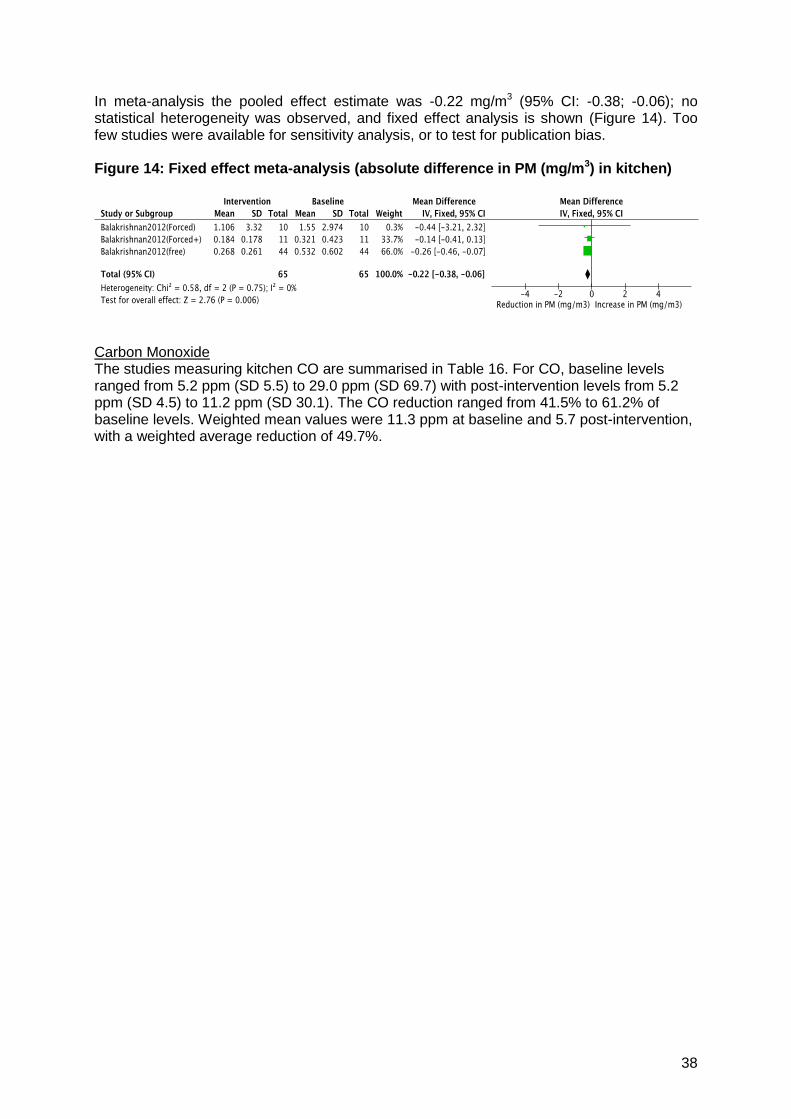
38
In meta-analysis the pooled effect estimate was -0.22 mg/m3 (95% CI: -0.38; -0.06); no statistical heterogeneity was observed, and fixed effect analysis is shown (Figure 14). Too few studies were available for sensitivity analysis, or to test for publication bias. Figure 14: Fixed effect meta-analysis (absolute difference in PM (mg/m3) in kitchen)
Carbon Monoxide The studies measuring kitchen CO are summarised in Table 16. For CO, baseline levels ranged from 5.2 ppm (SD 5.5) to 29.0 ppm (SD 69.7) with post-intervention levels from 5.2 ppm (SD 4.5) to 11.2 ppm (SD 30.1). The CO reduction ranged from 41.5% to 61.2% of baseline levels. Weighted mean values were 11.3 ppm at baseline and 5.7 post-intervention, with a weighted average reduction of 49.7%.

39
Table 16: Advanced combustion solid fuel stoves: Kitchen CO (ppm)
Author (year) and country
Baseline stove and
fuel
Intervention stove Duration of follow-up
Analytic or sampling approach
Number of
homes
Units and averaging
period
Baseline CO (ppm)
(SD)
Intervention CO (ppm)
(SD)
% reduct- ion from baseline
Absolute difference
$
(95%CI)
Global quality
assessment
Before and after designs (all studies)
Balakrishnan 2012(36)
Traditional stove, biomass
Free convection N/A N/A 45 N/A 8.9 (10.5) 5.2 (4.5) 41.5 -3.68 (-7.03, -0.33)
8/12 stars 67%
Balakrishnan 2012(36)
Traditional stove, biomass
Forced convection and optimised fuel
N/A N/A 11 N/A 5.2 (5.5) 2.7 (2.3) 47.1 -2.49 (-6.04, +1.06)
8/12 stars 67%
Balakrishnan 2012(36)
Traditional stove, biomass
Forced convection N/A N/A 10 N/A 29.0 (69.7) 11.2 (30.1) 61.2 -17.72 (-64.75, +29.31)
8/12 stars 67%
All studies
Weighted means 66 11.3 5.7 49.7 $ Difference = Intervention mean minus baseline mean

40
In fixed effects meta-analysis, the pooled estimate was -3.16 ppm (95%CI -5.59, -0.73), with an I2 value of 0%, Figure 15. Too few studies were available for sensitivity analysis, or to test for publication bias. Figure 15: Fixed effect meta-analysis (absolute difference in CO (ppm) in kitchen)
Overall strength of evidence for effect of advanced combustion stoves on kitchen PM and CO Particulate matter: Only one set of three before-and-after studies was available for kitchen PM, and was downgraded for risk of bias, resulting in an initial assessment of Low. This was unchanged in the final assessment, and the effect estimate was -0.22 (-0.06, -0.38) mg/m3. Carbon monoxide: The same set of studies was available for kitchen CO, and was similarly downgraded for risk of bias, resulting in an initial assessment of Low. This was unchanged in the final assessment, and the effect estimate was -3.16 (-0.73, -5.59) ppm.
3.4.2 Personal exposure None of the included studies contained data on personal exposure to PM and CO for advanced combustion solid fuel stoves.
3.5 Mixed interventions
Two studies reported on the effects of mixed interventions (hood, improved cook stove, venting, fireless cook and LPG) on HAP. The first was conducted in Kenya and measured PM and CO in two seasons (wet and dry) (11), and the second in Nepal, measured CO (11). Both studies used before- and after- designs and were of moderate quality. In Kenya, baseline levels for kitchen PM4 (24-hr) were 0.60 mg/m3 (SD 0.38) and 0.45 mg/m3 (SD 0.33) and post-intervention levels were 0.38 mg/m3 (SD 0.30) and 0.33 mg/m3 (SD 0.28) for wet and dry seasons respectively. The percentage reduction in PM was 49.9% for wet season and 37.7% for dry season. In Kenya and Nepal, baseline levels for kitchen CO (24-hr) ranged from 3.75 ppm (SD 2.49) to 9.05 ppm (SD 10.09) and post-intervention levels ranged from 3.55 ppm (SD 3.47) to 7.82 ppm (SD 5.22) across the three measurements (2 studies). The percentage reduction in CO ranged from 5.3% to 71.8%. Estimates of personal exposure (pre- and post- intervention) were not available.

41
3.6 Charcoal improved cook stoves
Two studies, conducted in Madagascar, reported on the effects of improved charcoal stoves on HAP (22). The first, conducted in Ambositra, identified a slight increase in kitchen PM2.5 (24hr) from a baseline mean of 0.35 mg/m3 (SD 0.36) to a post intervention mean of 0.40 mg/m3 (SD 0.38). For CO (24hr) there was a significant decline in emissions from a baseline mean of 42 ppm (SD 32) to a post-intervention mean of 8 ppm (SD 9). The second study, conducted in Vatomandry, identified decreases in both 24hr PM2.5 (baseline mean 1.06 mg/m3 (SD 4.18); post-intervention mean 0.28 mg/m3 (SD 0.27) and 24hr CO (baseline mean 11 ppm (SD 10; post-intervention mean 7.4 ppm (SD 6.1)). In Ambositra the percentage changes in kitchen concentrations were a 12% increase for PM2.5 (24hr) mg/m3 and 81% decrease in CO (24hr) ppm. In Vatomandry the percentage changes were a 74% decrease in PM2.5 (24hr) mg/m3 and a 33% decrease in CO (24hr) ppm. Estimates of personal exposure were not available.
3.7 Liquefied petroleum gas and natural gas
Only one study conducted in Sudan was identified that investigated the impact of an LPG stove intervention (11). The study used a before-and-after design and was classified as moderate quality. Follow-up measurement of exposure was conducted 12 months after installation of the intervention. Kitchen PM and CO were measured over two seasons (wet and dry). Baseline levels for kitchen PM2.5 (24-hr) were 1.15 mg/m3 (SD 1.22) and 0.63 mg/m3 (SD 0.54) and post-intervention levels were 0.23 mg/m3 (SD 0.14) and 0.33 mg/m3 (SD 0.07) for wet and dry seasons respectively. The percentage reduction in PM was 80% for wet season and 47.6% for dry season. Baseline levels for kitchen CO (24-hr) were 13.35 ppm (SD 12.54) and 9.62 ppm (SD 5.22) and post-intervention levels were 3.38 ppm (SD 2.49) and 1.96 ppm (SD 3.47) for wet and dry seasons respectively. The percentage reduction in CO was 74.7% for wet season and 79.6% for dry season. Estimates of personal exposure were not available.
3.8 Ethanol
Two before-and-after studies conducted in Africa addressed impacts of ethanol; one was classified as weak quality, the other high quality. Four estimates each were available for kitchen PM and CO.
3.8.1 Kitchen concentrations Particulate matter: Studies measuring kitchen PM are summarised in Table 17. Baseline levels for kitchen PM range from 0.39 mg/m3 (SD 0.49) to 2.17 mg/m3 (SD 1.63), post-intervention levels from 0.09 mg/m3 (SD 0.05) to 0.15 mg/m3 (SD 0.11). The percentage PM reduction ranged from 63.5% to 94.0%. The weighted means for kitchen PM for all studies were 0.72 mg/m3 at baseline and 0.12 mg/m3 post-intervention, with a weighted average reduction from baseline of 82.8%.

42
Table 17: Ethanol: Kitchen PM (mg/m3)
Author (year) and country
Baseline stove and fuel
Intervention stove
Duration of follow-up
Analytic or sampling approach
Number of homes
PM2.5 or PM4; period
Baseline PM
(mg/m3)
(SD)
Intervention
PM (mg/m3)
(SD)
% reduct- ion from baseline
Absolute difference (95%CI)
Global quality assessment
Before and after designs (all studies)
CEIHD 2007a(33) Kebribeyah Ethiopia
Traditional stove, biomass
Ethanol stove Not specified
Intention to treat
11 PM2.5 24-hr
2.17 (1.63)
0.13 (0.08)
94.0 -2.04 (-3.00, -1.08)
7 / 12 stars (58.3%)
CEIHD 2007b(33) Bonga Ethiopia
Traditional stove, biomass
Ethanol stove Not specified
Intention to treat
12 PM2.5 24-hr
0.96 (0.79)
0.15 (0.11) 84.4 -0.81 (-1.26, -0.36)
7 / 12 stars (58.3%)
PAC 2011a(22) Vatomandry Madagascar
Traditional charcoal stove
Cleancook ethanol
5 months Intention to treat
31 PM2.5 24-hr
0.39 (0.49)
0.14 (0.08) 63.5 -0.25 (-0.42, -0.07)
13 / 14 stars (92.9%)
PAC
2011b(22) Ambositra Madagascar
Traditional charcoal stove
Cleancook ethanol
7 months Intention to treat
31 PM2.5 24-hr
0.45 (0.43)
0.09 (0.05) 79.2 -0.36 (-0.51, -0.21)
13 / 14 stars (92.9%)
All studies
Weighted means 85 0.72 0.12 82.8

43
In random effects meta-analysis the pooled effect estimate was -0.58 mg/m3 (95% CI: -0.92; -0.24), with a large I2 value of 82% indicating considerable heterogeneity (Figure 16). There were insufficient studies for sensitivity analysis. Tests for publication bias were non-significant for Begg’s (p=0.308), but marginally significant for Egger’s (p=0.056). Figure 16: Random effects meta-analysis for absolute difference in PM (mg/m3) in kitchen
Carbon monoxide: Studies measuring kitchen CO are summarised in Table 18. Baseline levels ranged from 15.0 ppm (SD 23.0) to 70.5 ppm (SD 38.6) with post-intervention levels from 0.8 ppm (SD 1.0) to 14.6 ppm (SD 8.2). The percentage CO reduction ranged from 74.7% to 94.7%. The weighted means were 33.0 ppm at baseline and 5.9 ppm post-intervention, with a weighted average reduction from baseline of 82.2%.

44
Table 18: Ethanol: Kitchen CO (ppm)
Author (year) and country
Baseline stove and fuel
Intervention stove
Duration of follow-up
Analytic or sampling approach
Number of homes
CO (ppm); period
Baseline CO (ppm) (SD)
Intervention CO (ppm) (SD)
% reduction from baseline
Absolute difference (95%CI)
Global quality assessment
Before and after designs (all studies)
CEIHD 2007a(33) Kebribeyah Ethiopia
Traditional stove, biomass
Ethanol stove Not specified
Intention to treat
11 CO (ppm) 24-hr
70.5 (38.6)
14.6 (8.2) 79.3 -2.04 (-3.00, -1.08)
7 / 12 stars (58.3%)
CEIHD 2007b(33) Bonga Ethiopia
Traditional stove, biomass
Ethanol stove Not specified
Intention to treat
12 CO (ppm) 24-hr
22.1 (19.1)
5.6 (3.7) 74.7 -0.81 (-1.26, -0.36)
7 / 12 stars (58.3%)
PAC1
2011a(22) Vatomandry Madagascar
Traditional charcoal stove
Cleancook ethanol
5 months Intention to treat
31 CO (ppm) 24-hr
42.0 (30.0)
8.0 (9.0) 81.0 -0.25 (-0.42, -0.07)
13 / 14 stars (92.9%)
PAC1
2011b(22) Ambositra Madagascar
Traditional charcoal stove
Cleancook ethanol
7 months Intention to treat
31 CO (ppm) 24-hr
15.0 (23.0)
0.8 (1.0) 94.7 -0.36 (-0.51, -0.21)
13 / 14 stars (92.9%)
All studies
Weighted means 85 33.0 5.9 82.2

45
In random effects meta-analysis, the pooled estimate was -27.3 ppm (95% CI: -13.1, -41.5), also characterized by large heterogeneity with an I2 of 83%, (Figure 17). There were insufficient studies for sensitivity analysis. Tests for publication bias were non-significant for Begg’s (p=0.089) and Egger’s (p=0.161).
Figure 17: Random effects meta-analysis for absolute difference in CO (ppm) in kitchen
Overall strength of evidence for effect of ethanol stoves on kitchen PM and CO Particulate matter: Only two before-and-after studies (4 estimates) were available for kitchen PM, and these were downgraded for heterogeneity and the marginally significant Egger’s test, but upgraded for large effect (>50% reduction from baseline), resulting in an initial assessment of Low. This was unchanged in the final assessment, and the effect estimate was -0.58 (-0.24, -0.92) mg/m3. Carbon monoxide: The same two studies were available for kitchen CO, and was downgraded for heterogeneity and upgraded for large effect, resulting in an initial assessment of Moderate. This was unchanged in the final assessment, and the effect estimate was -27.3 (-13.1, -41.5) ppm.
3.8.2 Personal exposure Particulate Matter No studies directly measured personal exposure to particulate matter. One study conducted in Madagascar (22) estimated PM2.5 based on measurements of personal CO, and co-located CO and PM2.5 in homes however results are not reported here as only studies with direct measurements of pollutants were eligible for the review. Carbon Monoxide One quasi-experimental study conducted in Madagascar provided estimates for the impact of introducing an ethanol stove on women’s and children’s exposure to CO at the two study sites, Ambositra (highland) and Vatomandy (coastal) (22). Baseline and post-intervention averages are shown in Table 19 for both the ethanol cook stove intervention group and the control group for the study women and children. For both adults and children levels of CO ppm were greater in Ambositra then in Vatomandry, reflecting the higher altitude, colder conditions and more enclosed housing in the former site. In Ambositra baseline levels for children ranged from 5.6 ppm (SD 5.3) to 10.0 ppm (SD 6.7) and for adults levels ranged from 8.9ppm (SD 5.8) to 13.9 (SD 15.7). This compared to 0.6-0.8ppm and 1.3-2.5ppm in children and adults respectively in Vatomandry.

46
Table 19: Personal exposure measurements of CO ppm (24hr) for Madagascar quasi-experimental study
Ambositra
Intervention
Total
Baseline Intervention p-value mean sd mean sd
Personal exposure in children
Control 22 9.96 6.72 13.90 12.55 0.111
Ethanol 30 5.62 5.32 3.16 2.59 0.016
Personal exposure in adults
Control 18 13.91 15.66 12.78 10.48 0.678
Ethanol 26 8.87 5.78 4.19 7.01 0.001
Vatomandry
Intervention
Total
Baseline Intervention p-value mean sd mean sd
Personal exposure in children
Control 23 0.63 0.64 1.89 2.76 0.051
Ethanol 31 0.79 0.90 0.98 0.85 0.503
Personal exposure in adults
Control 21 2.48 1.99 5.11 2.22 0.665
Ethanol 30 1.30 1.02 0.97 1.55 0.458
In Ambositra the ethanol intervention had a significant impact on personal exposure to CO for both children (p=0.016) and adults (p=0.001). In children mean exposure reduced from 5.62ppm to 3.16ppm (56.2% reduction) and in adults from 8.87ppm to 4.19ppm (47.2% reduction) from baseline to post-intervention follow-up 5 months later. There was no such significant decrease in exposure in the control group, which showed a non-significant increase between baseline and follow-up. In Vatomandry, where baseline levels were considerably lower, the ethanol intervention did not appear to impact on exposure to CO ppm for either children (p=0.503) or adults (p=0.458). Both the adult and child control groups showed increases from baseline to follow-up, non-significant for adults, but marginally so (p=0.051) for children.
3.9 Electrification
Only one study carried out in three South African villages was identified that examined an intervention involving electricity for cooking (37). This cross-sectional study investigated the effects of electrification via the grid in one village (which was used for cooking along with a mix of other fuels including kerosene and solid fuel) compared to use of kerosene and solid fuel only on HAP (PM and CO) in two matched villages without grid access. The baseline level of kitchen PM4 (24-hr) was 0.16 mg/m3 (SD 0.26), the post-intervention level was 0.08 mg/m3 (SD 0.12), implying a 50.0% reduction in PM. The baseline and post-intervention levels for kitchen CO (24-hr) were 1.25 ppm (SD 0.69) and 0.69 ppm (SD 0.85) respectively, representing a percentage reduction in CO of 44.8%. Estimates of personal exposure were not available.
3.10 Other clean cooking interventions: biogas and solar
No studies with measurements of PM and/or CO meeting inclusion criteria were identified for other clean fuel options, such as biogas and solar cookers.

47
3.11 Behavioural and other types of intervention
A number of other structural and behavioural interventions have been proposed to contribute to reductions in HAP and personal exposure (1). The focus of this review was stoves and fuels, as these are seen as the most critical factor in achieving low levels of HAP and exposure. Search terms designed to identify studies that have reported on these other types of intervention were not included in the search. Consequently, systematic assessment of their use and impact is not included here. In most, if not all, programmes introducing new stoves and fuels will have included some measure of behavioural change through user training and advice. A few studies identified through the current review have studied behavioural change. Those by Barnes et al in South Africa did not include HAP or exposure data (38). A study carried out in three areas of China investigated a behavioural intervention in conjunction with an ICS intervention (39). This study was in fact excluded from the main meta-analyses of ICS interventions due to large discrepancies between numbers at baseline and follow-up, and this limitation applies to all the comparisons between behavioural interventions and the ICS.
4. Summary of impacts of interventions on kitchen PM and CO
The findings of the systematic review for kitchen PM (Table 20) and CO (Table 21) are shown below. More detailed information on the distribution of post-intervention concentrations of PM and CO are provided in Figures 12 and 13, respectively, and the accompanying discussion. Table 19: Summary of impacts on household air pollution, based on main pooled effect estimate (where available) for kitchen PM
Number of studies
Pooled effect estimate for absolute difference (95% CI)
Weighted mean % reduction in concentrations (range)
Post-intervention weighted mean
Improved solid fuel stoves
Improved solid fuel stoves with chimneys
18 (23 estimates)
-0.50 (-0.64; -0.35) -63.3 (+14.3% to -89.5%)
0.37
Improved solid fuel stoves without chimneys
4 (7 estimates)
-0.26 (-0.39; -0.12) -47.6 (-33.6 to -54.3%)
0.41
Advanced combustion solid fuel stoves
1 (3 estimates)
-0.22 (-0.38; -0.06) -41.4 (-28.7% to -49.6%)
0.38
Mixed interventions 1 (2 estimates)
-0.23 (-0.36; -0.10) -43.8 (-37.7% to -49.9%)
0.29
Cleaner fuels
LPG, natural gas 1 (2 estimates)
- -63.8 (-47.6% to -80.0%)
0.28
Ethanol 4 (4 estimates)
-0.58 (-0.92; -0.24) -82.8 (-63.5% to -94.0%)
0.12
Electrification 1 (1 estimate)
- -50.0% 0.08
Solar cookers - - -
Biogas - - -

48
Table 20: Summary of impacts on household air pollution, based on main pooled effect estimate (where available) for carbon monoxide
Number of studies
Pooled effect estimate for absolute difference (95% CI)
Weighted mean % reduction in concentrations (range)
Post-intervention weighted mean
Improved solid fuel stoves
Improved solid fuel stoves with chimneys
17 (22 estimates)
-5.39 (-6.92; -3.26) -62.8% (-23.3% to -87.5%)
4.2
Improved solid fuel stoves without chimneys
5 (8 estimates)
-3.41 (-4.80; -2.02) -38.7% (-11.4% to -54.5%)
6.6
Advanced combustion solid fuel stoves
1 (3 estimates)
-3.16 (-5.59; -0.73) -49.7% (-41.5% to -61.2%)
5.7
Mixed interventions 2 (3 estimates)
-1.53 (-3.05; -0.02) -47.7% (-5.3% to -71.8%)
4.1
Improved solid fuel stoves
LPG, natural gas 1 (2 estimates)
- -68.8% (-47.6% to -80.0%)
2.7
Ethanol 2 (4 estimates)
-21.9 (-27.4; -16.5) -82.2% (-74.7% to -94.7%)
5.9
Electrification 1 (1 estimate)
- -44.8% 0.7
Solar cookers - - -
Biogas - - -
The quantity of studies identified and quality of evidence supporting different interventions vary greatly. Studies of clean fuel were especially sparse: no studies were identified that document the impact of biogas or solar cooker interventions on HAP, and only one study each examined the impact of LPG/natural gas and electrification interventions. Only two studies were available for mixed interventions. In interpreting these summary findings, it is important to keep in mind the variable number of studies available across groups, and the specific circumstances (e.g. the baseline concentrations), especially where the summary data in Table 20 and Table 21 are based on very few studies. For these reasons, attention is focused on those stoves and fuels with at least three studies. Improved solid fuel stoves: For kitchen PM, improved solid fuel stoves with chimneys showed the largest absolute reductions of -0.50 mg/m3, which was around twice the reductions seen for non-chimney stoves and advanced combustion stoves. The range of reductions are, however, considerably wider for the chimney stoves. Post-intervention concentrations, are similar for all three groups of solid fuel stoves at 0.37 to 0.41 mg/m3, with the chimney stoves having marginally the lowest level. For kitchen CO, again the chimney stoves had the largest absolute reduction (-5.39 ppm), with non-chimney and advanced combustion stoves having reductions of about 60% of those for chimney stoves. The range of percentage reductions was similarly greatest for chimney stoves. Post-intervention weighted mean concentrations were 4.2 ppm for chimney stoves, which is below the WHO 24-hr guideline level. Non-chimney stoves by contrast had a post-

49
intervention weighted mean of 6.6, slightly above the WHO 24-hr guideline. The advanced combustion stoves had a value of 5.7, almost exactly the same as the guideline. Studies examining changes in personal exposure were only identified for improved solid fuel stoves with chimneys; it is noteworthy that pooled absolute reductions for personal exposure to PM (-0.15 mg/m3) and CO (- 1.4 ppm) were much lower than those for kitchen PM (-0.50 mg/m3) and CO (-5.39 ppm) (see section 3.2.2). Clean fuels Among clean fuels, ethanol was the only fuel with more than one study, and the absolute reduction in PM of -0.58 mg/m3 was the largest among all of the interventions studied. The post-intervention concentration of 0.12 mg/m3 was also the lowest achieved, with the exception of the single study of electrification for which there was also a relatively low baseline value. For kitchen CO, baseline levels were very high (for two of the four estimates the baseline fuel was charcoal): the ethanol stove resulted in a very large absolute reduction of -21.9 ppm, with a post-intervention weighted mean of 5.9 ppm just above the WHO 24-hr guideline which may reflect some continued mixed fuel use. Summary of studies reporting kitchen PM Baseline and post-intervention levels for kitchen PM reported from all studies grouped by intervention type are shown in Figure 18. For the purposes of comparison, the WHO Air Quality Interim Target 1 for annual PM2.5 of 0.035 mg/m3 is shown on the graph.

50
Figure 18: Baseline and intervention levels for kitchen PM (mg/m3) for all improved solid fuel stove and cleaner fuel interventions in relation to WHO Air Quality Guideline
Note: Reference line indicates the WHO Air Quality Guideline level (Interim Target 1) for annual PM2.5 of 0.035 mg/m
3.(40)

51
The very large discrepancies in baseline levels are clearly apparent, ranging from a high of 3.37 mg/m
3 (Nepal, followed by chimney stove intervention) to a relatively low minimum of 0.16 mg/m3 (South Africa, followed by electrification intervention). Although none of the solid fuel interventions reach levels at or below IT-1, those with chimneys come closest with values for the three best being 0.042. 0.053 and 0.062 mg/m3 (11, 14, 20). Across this group of stoves, post-intervention levels were highly variable, with some still above 1 mg/m3. None of the non-chimney stoves performed particularly well in terms of post-intervention levels, and again these were highly variable. Neither did the advanced stove perform well, although it was recognized that use was sub-optimal, and mixed with continued use of traditional stoves. For the clean fuels, all of the ethanol studies had relatively low post-intervention values (22, 34), the lowest being 0.09 mg/m3. The single study of electrification had a low baseline of 0.16 mg/m3, and a post-intervention value of 0.08 mg/m3 (37). The study of LPG (two estimates by season) reported relatively high post-intervention values of around 0.3 mg/m3. All of these clean fuel studies, however, reported some continued mixed fuel use during the intervention period. Figure 19 illustrates baseline and post-intervention levels for kitchen CO across all intervention types examined in the systematic review, and relates these to the WHO Air Quality Guideline level for 24-hour CO of 5.68 ppm. Baseline levels differ greatly, with some of these being below guideline levels (11, 13, 17, 26, 28, 36, 37). With respect to post-intervention levels, nearly two thirds of all improved solid fuel stoves with chimneys examined meet the CO guideline, whereas this proportion is only about one third for stoves without chimneys. The gas and electrification interventions consistently met the CO guideline, while the ethanol studies showed mixed results with large heterogeneity.
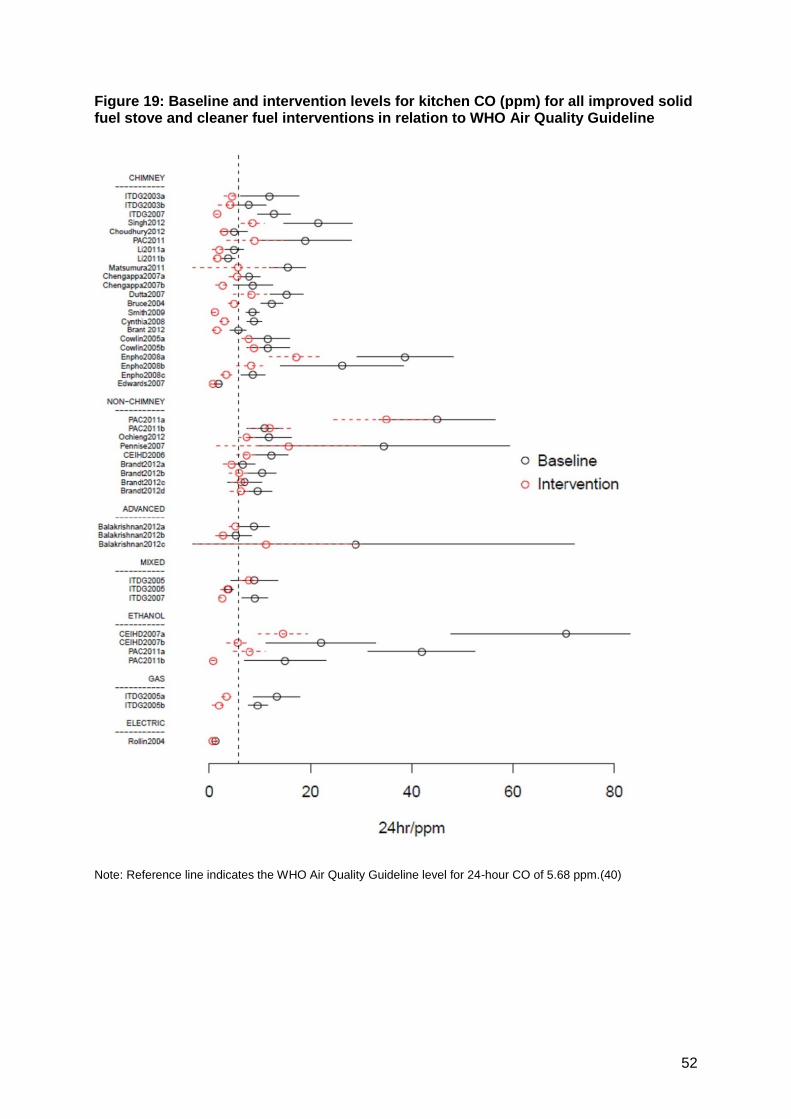
52
Figure 19: Baseline and intervention levels for kitchen CO (ppm) for all improved solid fuel stove and cleaner fuel interventions in relation to WHO Air Quality Guideline
Note: Reference line indicates the WHO Air Quality Guideline level for 24-hour CO of 5.68 ppm.(40)

53
5. Experience from stove interventions in industrialised countries and China
5.1 Industrialised countries
Biomass burning for residential heating is common in industrialized countries, particularly in rural communities. The term wood stove refers to enclosed residential space heaters. Most of these devices are vented, but stove designs can vary dramatically with respect to emissions. Conventional devices, accounting for more than 80% of wood stoves in the United States, have no emission reduction technologies or design features, and they emit 15 to 30 grams of PM2.5 per hour (g/h) (41). Improved models include both catalytic and non-catalytic stoves with greater combustion efficiencies and at least 50% lower PM2.5 emissions compared to conventional stoves (41). Pellet stoves, increasingly popular in Europe, burn processed wood or other biomass materials and yield even lower emissions. Of these various devices, conventional wood stoves are the primary target of several community-level interventions to address concerns of ambient air quality. For example, a small community in the Rocky Mountain region of the United States recently completed a large-scale programme to replace over 1100 older model wood stoves with newer technology stoves, resulting in a 27% reduction of ambient levels of PM2.5 during the cold temperature period (42). Few studies have evaluated the impact of wood stove technology upgrades on indoor air pollution levels in industrialized countries. Several factors are known to influence the effectiveness of a newly introduced wood stove. Indoor pollutant concentrations are the result of a combination of indoor-generated particulates and infiltration of particles in ambient air emitted from other sources. It is also generally understood, although poorly documented, that behavioural factors have a large impact on stove emissions, including wood sizing, fuel moisture content, ignition procedure, burn temperatures and maintenance. The settings and stove technologies in industrial countries are very different from those in most developing country communities. Nevertheless, further characterization of the sources of variability and the efficacy of biomass burning interventions can help to inform programmatic approaches in other settings. The limited findings suggest that stove interventions may require supplemental strategies such as training of residents on best burn practices and the use of low-technology assistive devices such as fuel moisture meters and stove thermometers. Where such assistive devices or user training are impractical, new technology stoves should be designed to be as user-independent as possible. Table 22 summarizes four recent North American studies that measured indoor PM2.5 concentrations before and after the introduction of a wood stove upgrade (43-46). Crude comparisons of baseline and intervention means suggest modest overall reductions in indoor PM2.5 but the outcomes were highly variable with one-third of homes showing no improvements in indoor air quality. After accounting for repeated measures and ambient factors three of the studies failed to demonstrate significant reductions in indoor PM2.5. Only one of the studies occurred within the context of a randomized trial, and it showed no reduction in indoor PM2.5 relative to control homes (mean percent reduction 1.0; 95% CI: -31, 34) (43, 44).
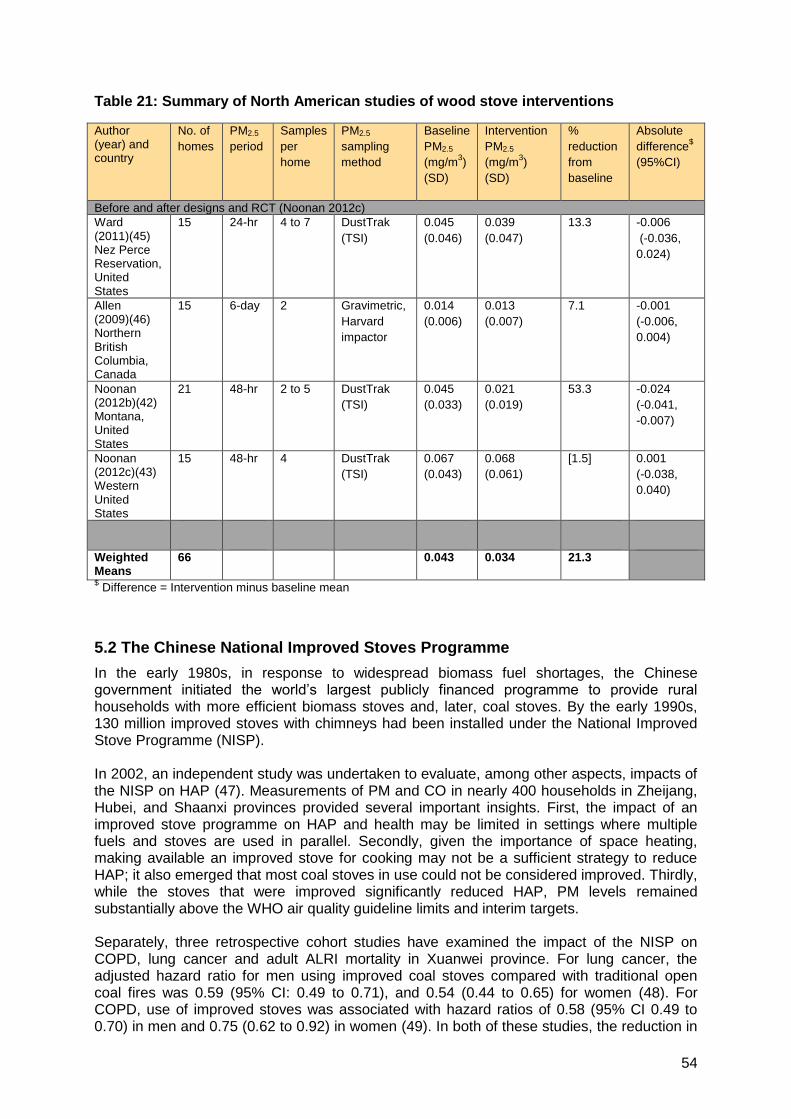
54
Table 21: Summary of North American studies of wood stove interventions
Author (year) and country
No. of
homes
PM2.5
period
Samples
per
home
PM2.5
sampling
method
Baseline
PM2.5
(mg/m3)
(SD)
Intervention
PM2.5
(mg/m3)
(SD)
%
reduction
from
baseline
Absolute
difference$
(95%CI)
Before and after designs and RCT (Noonan 2012c)
Ward (2011)(45) Nez Perce Reservation, United States
15 24-hr 4 to 7 DustTrak
(TSI)
0.045
(0.046)
0.039
(0.047)
13.3 -0.006
(-0.036,
0.024)
Allen (2009)(46) Northern British Columbia, Canada
15 6-day 2 Gravimetric,
Harvard
impactor
0.014
(0.006)
0.013
(0.007)
7.1 -0.001
(-0.006,
0.004)
Noonan (2012b)(42) Montana, United States
21 48-hr 2 to 5 DustTrak
(TSI)
0.045
(0.033)
0.021
(0.019)
53.3 -0.024
(-0.041,
-0.007)
Noonan (2012c)(43) Western United States
15 48-hr 4 DustTrak
(TSI)
0.067
(0.043)
0.068
(0.061)
[1.5] 0.001
(-0.038,
0.040)
Weighted Means
66 0.043 0.034 21.3
$ Difference = Intervention minus baseline mean
5.2 The Chinese National Improved Stoves Programme
In the early 1980s, in response to widespread biomass fuel shortages, the Chinese government initiated the world’s largest publicly financed programme to provide rural households with more efficient biomass stoves and, later, coal stoves. By the early 1990s, 130 million improved stoves with chimneys had been installed under the National Improved Stove Programme (NISP). In 2002, an independent study was undertaken to evaluate, among other aspects, impacts of the NISP on HAP (47). Measurements of PM and CO in nearly 400 households in Zheijang, Hubei, and Shaanxi provinces provided several important insights. First, the impact of an improved stove programme on HAP and health may be limited in settings where multiple fuels and stoves are used in parallel. Secondly, given the importance of space heating, making available an improved stove for cooking may not be a sufficient strategy to reduce HAP; it also emerged that most coal stoves in use could not be considered improved. Thirdly, while the stoves that were improved significantly reduced HAP, PM levels remained substantially above the WHO air quality guideline limits and interim targets. Separately, three retrospective cohort studies have examined the impact of the NISP on COPD, lung cancer and adult ALRI mortality in Xuanwei province. For lung cancer, the adjusted hazard ratio for men using improved coal stoves compared with traditional open coal fires was 0.59 (95% CI: 0.49 to 0.71), and 0.54 (0.44 to 0.65) for women (48). For COPD, use of improved stoves was associated with hazard ratios of 0.58 (95% CI 0.49 to 0.70) in men and 0.75 (0.62 to 0.92) in women (49). In both of these studies, the reduction in

55
risk became unequivocal around 10 years after stove improvement. The third study, on adult ALRI, also reported reduced hazard rations for improved stove users: among smoky coal users the HR was 0.52 (95% CI: 0.34, 0.80) and among smokeless coal users the HR was 0.45 (95% CI: 0.22, 0.94) (50). In conclusion, even though a large fraction of China’s rural population probably continues to be exposed to relatively high levels of HAP, the NISP appears to have resulted in important health benefits, at least for the three adult health outcomes studied in the Xuanwei area. Nevertheless, where studied, the multiple stoves and fuel use, heating needs, and poor condition of some stoves contribute to sub-optimal reductions in HAP and levels that still substantially exceed WHO air quality guidelines for PM2.5. The programme has successfully shifted norms: most solid fuel stoves now available on the market in China have flues and other technical features that classify them as improved.
6. Discussion and conclusions Overview This systematic review draws together for the first time all available studies providing data using consistent measurement protocols for estimates of long-term small PM (mostly PM2.5, a few having measured PM4) and CO, for both cooking area (kitchen) and personal exposure concentrations. The review covers solid fuel stoves (with and without chimneys, and advanced combustion stoves), clean fuels (LPG, ethanol, electricity) and mixed interventions. No studies were found for biogas or solar cooking. The key strength of this review is its comprehensive nature, drawing on a wide range of sources and reports, but applying consistent methods for data extraction, synthesis and summary, and for evidence grading. A variety of approaches are utilised to present the findings which allow appreciation of both group effects as well as individual study findings; this is important because of the generally high levels of heterogeneity between studies in baseline levels of pollution, the types of stove technology and circumstances of their use. A major limitation of this review is the paucity of studies on personal exposure, advanced combustion stoves, and clean fuels. It is also clear that there are a number of other factors that contribute to the post-intervention levels achieved, including mixed stove and fuel use, and other sources of pollution which may including lighting (especially from kerosene lamps) and various neighbourhood sources. While these are suspected to be important, and noted in some studies, none have carried out measurements that would allow a better understanding of the attribution of HAP to these various sources. Key findings A number of clear findings emerge. For PM, and consistent with the data reported in Review 5 (HAP and exposure), baseline levels are very high, but also very variable. All intervention groups, and most individual studies, find large percentage and absolute reductions in PM, with rather few reporting small reductions or even increases. Among solid fuel stoves, those with chimneys performed better than those without. Chimney stoves also performed better than advanced combustion stoves, but the latter group had only a small set of studies in which sub-optimal use of the new stove and combined use with traditional stoves were reported. For clean fuels, ethanol showed the largest reductions, but was the only clean fuel examined in more than one study. While findings on reductions are useful, it is the post-intervention levels which can be expected to be the most important determinant of health risk. Whilst there is a great deal of variation in the post-intervention levels, the majority of solid fuel stoves tested did not achieve levels even close to the WHO annual PM2.5 intermediate target 1 (IT-1) of 35 µg/m3. A few chimney stoves did, however, and this may warrant further examination of the

56
technology and circumstances of use in these examples. For clean fuels, studies of both ethanol and electricity reported levels of PM2.5below 100 µg/m3, although mixed fuel use was common. Personal exposure data for PM is restricted to the group of solid fuel stoves with chimneys, for which just three studies were available (five estimates) finding a 76% reduction to a post-intervention level of 70 µg/m3. This is encouraging, but is based on a very limited amount of evidence. The findings for kitchen CO have issues in common with those for PM as well as some important differences. Baseline levels also show a great deal of variability, many exceed the WHO 24-hr guideline, but a number do not; this is a reflection of the fact that CO levels are not generally as elevated above the guideline in comparison with the situation for PM2.5. A similar pattern of mostly large absolute and percentage reductions in CO, with the chimney stoves having the best performance among the solid fuel stoves, and ethanol among the clean fuels. The findings for the post-intervention levels, however, are quite different from PM: for CO, the majority of studies report levels below the WHO 24-hr guideline, including a majority of the chimney stoves. Personal exposure data for CO is available from a few more studies than for PM, reflecting the fact that personal CO is considerably easier to measure. Five studies (eight estimates) reported reductions of around 50% to a post-intervention mean of 1.77 ppm. While the findings for CO are encouraging, not all of the stoves and clean fuel studies achieved kitchen levels below the WHO guideline, and it is also important that all of the major pollutants are reduced to safe levels. Accordingly, while measuring CO is valuable, the major focus should remain on meeting guidelines for PM2.5. Strength of evidence The strength of evidence of intervention impact estimates as determined by the GEPHI assessments is Low to Moderate. This implies that we can have some confidence in these effect size estimates, but can expect some substantial changes with future studies, particular where few studies are currently available. The results of graded studies were very similar to the pooled estimates including all the studies and therefore estimates are reported for all studies including cross-sectional studies utilising all the data. The finding of significant publication bias for chimney stoves (kitchen PM and kitchen CO) is a concern, and seems to be mainly confined to before-and-after studies: In this group of studies, there may have been a tendency to not publish smaller studies with small effects, or to carry out small studies that focus on the stoves and homes with the better performance. This does suggest that for those sub-groups of studies for which publication bias was present, results could have been overestimated; on the other hand, continued mixed stove and fuel use and contributions from other sources in the home and neighbourhood will tend to underestimate the potential of these interventions. There was weak evidence for advanced combustion stoves, which is disappointing given the potential these technologies appear to have based on laboratory emissions testing (see Chapter 4). This group of technologies should be a priority for future evaluation work in the field if we are to find out whether this potential can be realised in everyday use. Summary of research needs The major research need is for more field-based studies of the most promising solid fuel stoves, including advanced combustion stoves, and also of the clean fuels. These studies need to use standardized methods, and it is encouraging that in recent years most of the studies have done so and have allowed this review to be conducted. It is also important that use of multiple stoves and other combustion devices in the home and immediate vicinity is

57
recorded, and their contributions to levels of HAP and exposure measured where possible. Similarly, levels of ambient air pollution resulting from household combustion of neighbours and other sources (which may include brick kilns, traffic, industry and power generation) should be measured to assess the contribution to household levels of and personal exposure to particulate matter and carbon monoxide. Conclusions This is the first systematic review to summarise reductions in household air pollution achieved by currently available and tested solid fuel and clean fuel interventions in community-based evaluation studies. For carbon monoxide many of the interventions (especially chimney stoves and clean fuels) achieve levels below the 24 hour WHO air quality guideline level of 5.7 ppm. However, for small particulate matter (most studies reporting PM2.5, a few PM4), none of the interventions – whether solid fuel stoves or clean fuels - have reached WHO annual AGQ IT-1 for PM2.5of 35 µg/m3, and consequently none reach the actual guideline value of 10 µg/m3. Indeed, the majority of studies reported post-intervention concentrations in homes of several hundred µg/m3 above the guideline IT-1 level, although a few solid fuel chimney stoves and clean fuels were within about 50 µg/m3. The evidence presented here on the effectiveness of interventions has typically come from small-scale evaluation studies and furthermore there was evidence of publication bias when pooling results, especially for before-and-after studies of chimney stoves. Consequently, some of these results may be biased somewhat in favour of the interventions, and HAP concentrations across larger, fully representative samples of homes may be somewhat higher. On the other hand, there may be contribution from neighbourhood sources of pollution and - as was discussed in the Methods - available results are based on means, not medians, and the distributions of individual measurements are almost always markedly positively skewed; median values would therefore generally be lower than those for means. That said, the WHO AQG and IT values are presented as annual (or 24-hr) means. In order to bring levels of household particulate air pollution down to the WHO guideline level across populations, efforts now need to be directed at development and testing of cleaner combustion solid fuel stoves, promotion of access to clean fuels, and adoption of clean household energy across communities to minimise neighbourhood contributions to HAP. While venting of stoves is to be encouraged to reduce indoor levels and personal exposures, reducing total emissions to the ambient environment are critical to achieving low neighbourhood levels, as well as in realising climate change benefits. While in the future solid fuel stoves will likely see further reductions in emissions, given the apparent limitations reported here in terms of post-intervention PM levels, more attention needs to be given to promoting access to clean fuels as widely and as rapidly as feasible.

58
Appendix 1: GEPHI Assessments The assessment of the quality of evidence available on intervention effect estimates follows the GEPHI assessment procedure, as described in ‘Methods used for evidence assessment’. These assessments have been carried out for the intervention groups as reported in this review, with the evidence for each group stratified by study design. Where ten or more RCTs or before-and-after studies were included to assess a given PM or CO outcome, only these higher quality study designs were included in the GEPHI assessments, with cross-sectional studies not contributing. The GEPHI assessment tables were applied as follows: 1. Study designs: quasi-experimental and before-and-after studies are entered into the
profile as moderate evidence. Although a few of the studies used quasi-experimental designs, only the intervention group data has been used for so that this was in a comparable form and would allow pooling of data in meta-analysis.
2. Publication bias: This has been assessed by funnel plot asymmetry where there were at least 5 studies (or estimates). Where feasible, this has been done separately by study design and reported in the tables accordingly. Where the number of studies was too few to permit this, the overall risk of publication bias was used.
3. Large effect: Where the reduction is more than 50% from baseline and statistically significant, studies were upgraded by +1; no additional upgrading was included for larger reductions.
4. Additional criterion 1 (Consistency across settings and study designs): This was applied where all or virtually all of the studies of different designs and across different settings and types of the technology in question show substantial reductions in the PM or CO, with studies being upgraded by +1.
5. Additional criterion 2 (Analogous evidence): This was not considered relevant and has not been applied to any of these assessments

59
A1.1 Solid fuel stoves with chimneys (kitchen measurements) Table A1.1(a): GEPHI assessment of findings for solid fuel stoves with chimneys: kitchen PM2.5 No of studies
Design Risk of bias
Inconsistency Indirectness Lack of Precision
Publication bias
Other No. of homes
Effect (µg/m3) 95% CI
Quality
Int Cont
12 (17 estimates)
Before-and-after studies
Low I2 = 69%
(-1) No No Yes (-1) Large effect (+1) 388 N/A -0.46 (-0.60;
-0.33)
Low
6 (7 estimates)
Cross-sectional studies
Yes (-1) I2 = 83%
(-1) No Yes (-1) No Non-significant
Large effect 227 217 -0.53 (-0.94;
+0.13)
Very low
Final score Based on Before-and-after studies
11/12 show reductions (+1 for consistency) -0.46 (-0.60; -0.33)
Moderate
Table A1.1(b): GEPHI assessment of findings for solid fuel stoves with chimneys: kitchen CO No of studies (estimates)
Design Risk of bias
Inconsistency Indirectness Lack of Precision
Publication bias
Other No. of subjects
Effect (ppm) 95% CI
Quality
Int Cont
1 (1 estimate) RCTs Low N/A No No N/A No 36 36 -7.5 (-6.1, -8.9)
High
10 (14 estimates) Before-and-after studies
Low I2 = 77%
(-1)
No No Yes (-1) Large effect (+1)
421 N/A -5.5 (-3.7, -7.3)
Low
6 (7 estimates) Cross-sectional studies Yes (-1)
I2 = 88%
No No No No 144 189 -4.7 (-1.7, -
7.6)
Very low
Final score Based on RCTs and Before-and-after studies
11/11 show reductions (+1 consistency) -5.7 (-3.9, -7.5)
Moderate
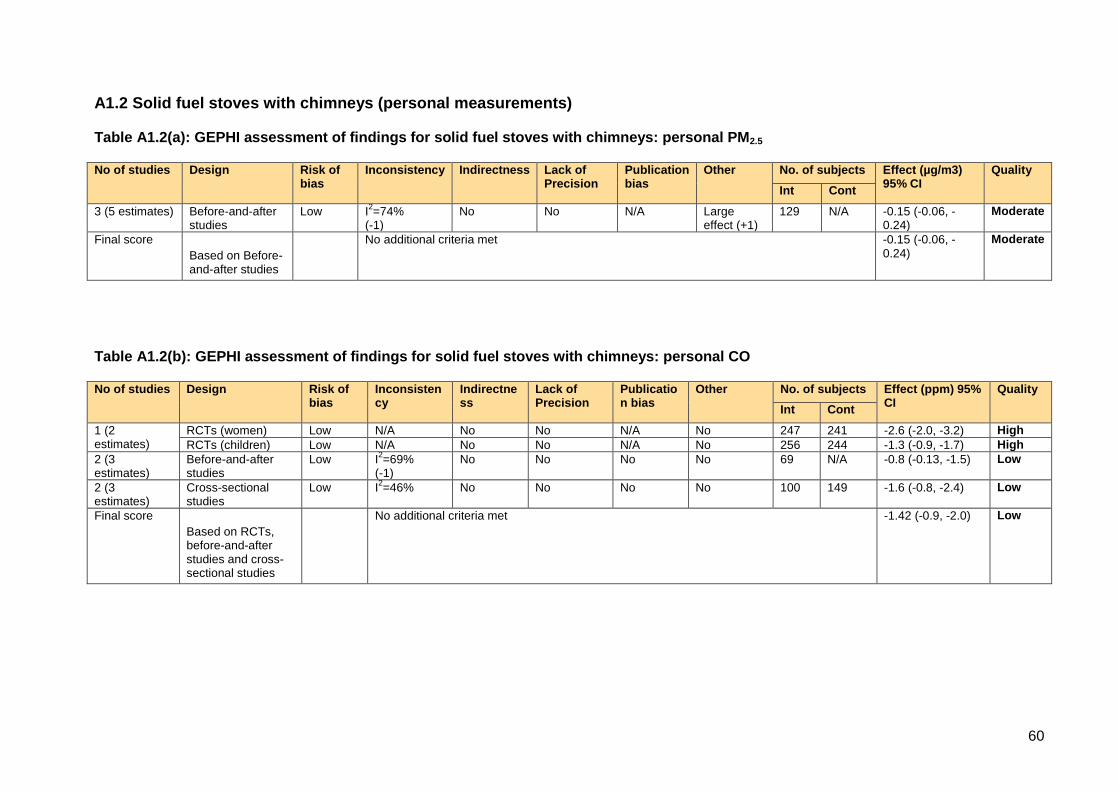
60
A1.2 Solid fuel stoves with chimneys (personal measurements) Table A1.2(a): GEPHI assessment of findings for solid fuel stoves with chimneys: personal PM2.5 No of studies Design Risk of
bias Inconsistency Indirectness Lack of
Precision Publication bias
Other No. of subjects Effect (µg/m3) 95% CI
Quality
Int Cont
3 (5 estimates) Before-and-after studies
Low I2=74%
(-1) No No N/A Large
effect (+1) 129 N/A -0.15 (-0.06, -
0.24)
Moderate
Final score
Based on Before-and-after studies
No additional criteria met -0.15 (-0.06, -0.24)
Moderate
Table A1.2(b): GEPHI assessment of findings for solid fuel stoves with chimneys: personal CO No of studies Design Risk of
bias Inconsistency
Indirectness
Lack of Precision
Publication bias
Other No. of subjects Effect (ppm) 95% CI
Quality
Int Cont
1 (2 estimates)
RCTs (women) Low N/A No No N/A No 247 241 -2.6 (-2.0, -3.2) High
RCTs (children) Low N/A No No N/A No 256 244 -1.3 (-0.9, -1.7) High
2 (3 estimates)
Before-and-after studies
Low I2=69%
(-1) No No No No 69 N/A -0.8 (-0.13, -1.5) Low
2 (3 estimates)
Cross-sectional studies
Low I2=46%
No No No No 100 149 -1.6 (-0.8, -2.4) Low
Final score
Based on RCTs, before-and-after studies and cross-sectional studies
No additional criteria met -1.42 (-0.9, -2.0) Low
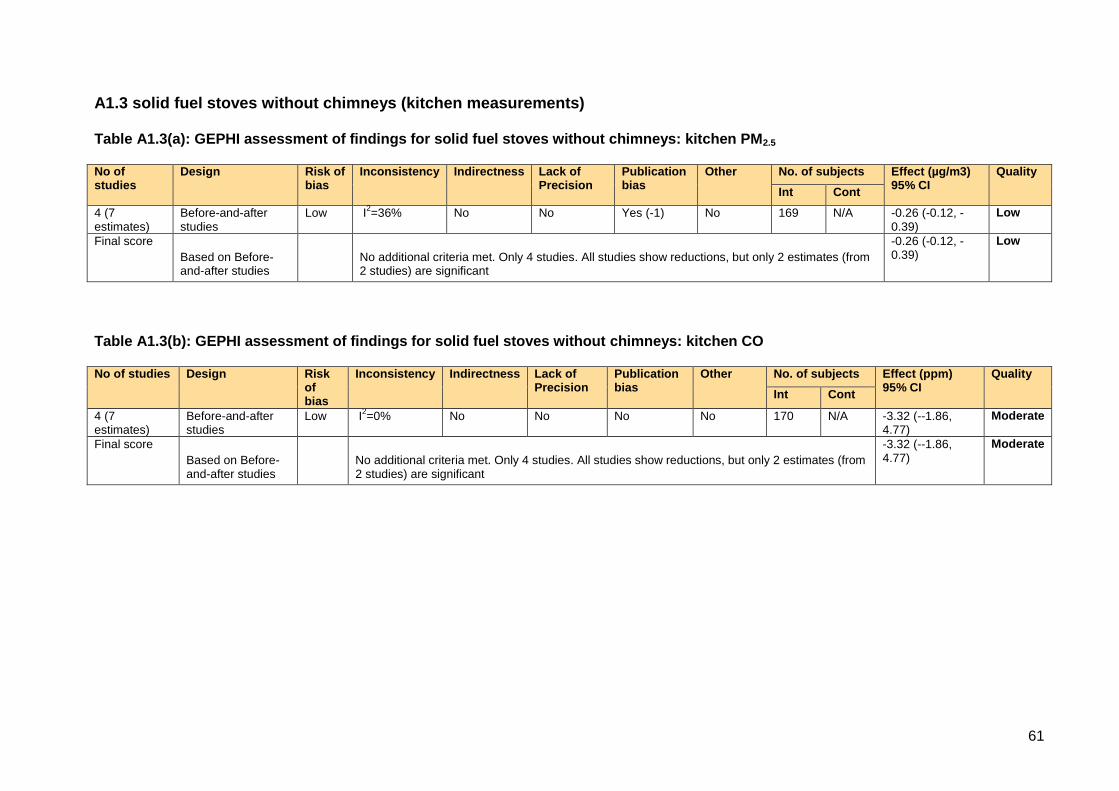
61
A1.3 solid fuel stoves without chimneys (kitchen measurements) Table A1.3(a): GEPHI assessment of findings for solid fuel stoves without chimneys: kitchen PM2.5 No of studies
Design Risk of bias
Inconsistency Indirectness Lack of Precision
Publication bias
Other No. of subjects Effect (µg/m3) 95% CI
Quality
Int Cont
4 (7 estimates)
Before-and-after studies
Low I2=36%
No No Yes (-1) No 169 N/A -0.26 (-0.12, -
0.39)
Low
Final score
Based on Before-and-after studies
No additional criteria met. Only 4 studies. All studies show reductions, but only 2 estimates (from 2 studies) are significant
-0.26 (-0.12, -0.39)
Low
Table A1.3(b): GEPHI assessment of findings for solid fuel stoves without chimneys: kitchen CO No of studies Design Risk
of bias
Inconsistency Indirectness Lack of Precision
Publication bias
Other No. of subjects Effect (ppm) 95% CI
Quality
Int Cont
4 (7 estimates)
Before-and-after studies
Low I2=0% No No No No 170 N/A -3.32 (--1.86,
4.77)
Moderate
Final score
Based on Before-and-after studies
No additional criteria met. Only 4 studies. All studies show reductions, but only 2 estimates (from 2 studies) are significant
-3.32 (--1.86, 4.77)
Moderate

62
A1.4 Advanced combustion solid fuel stoves without chimneys (kitchen measurements) Table A1.4(a): GEPHI assessment of findings for advanced combustion solid fuel stoves: kitchen PM2.5 No of studies Design Risk of
bias Inconsistency Indirectness Lack of
Precision Publication bias
Other No. of subjects Effect (µg/m3) 95% CI
Quality
Int Cont
1 (3 estimates) Before-and-after studies
Yes (-1)
I2=0%
No No N/A No 65 N/A -0.22 (-0.06, -
0.38)
Low
Final score
Based on Before-and-after studies
No other criteria met -0.22 (-0.06, -0.38)
Low
Table A1.4(b): GEPHI assessment of findings for advanced combustion solid fuel stoves: kitchen CO No of studies Design Risk of
bias Inconsistency Indirectness Lack of
Precision Publication bias
Other No. of subjects Effect (ppm) 95% CI
Quality
Int Cont
1 (3 estimates) Before-and-after studies
Yes (-1)
I2=0%
No No N/A No 66 N/A -3.16 (-0.73, -
5.59
Low
Final score
Based on Before-and-after studies
No other criteria met -3.16 (-0.73, -5.59
Low
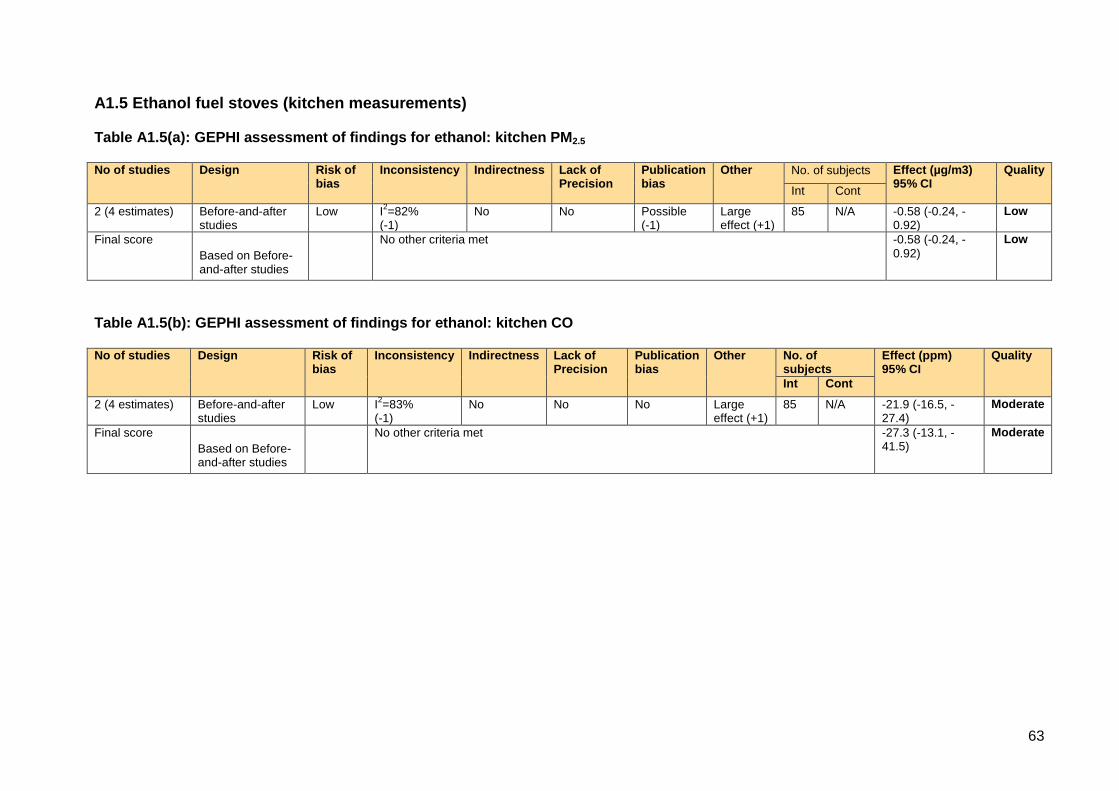
63
A1.5 Ethanol fuel stoves (kitchen measurements) Table A1.5(a): GEPHI assessment of findings for ethanol: kitchen PM2.5 No of studies Design Risk of
bias Inconsistency Indirectness Lack of
Precision Publication bias
Other No. of subjects Effect (µg/m3) 95% CI
Quality
Int Cont
2 (4 estimates) Before-and-after studies
Low I2=82%
(-1) No No Possible
(-1) Large effect (+1)
85 N/A -0.58 (-0.24, -0.92)
Low
Final score
Based on Before-and-after studies
No other criteria met -0.58 (-0.24, -0.92)
Low
Table A1.5(b): GEPHI assessment of findings for ethanol: kitchen CO No of studies Design Risk of
bias Inconsistency Indirectness Lack of
Precision Publication bias
Other No. of subjects
Effect (ppm) 95% CI
Quality
Int Cont
2 (4 estimates) Before-and-after studies
Low I2=83%
(-1) No No No Large
effect (+1) 85 N/A -21.9 (-16.5, -
27.4)
Moderate
Final score
Based on Before-and-after studies
No other criteria met -27.3 (-13.1, -41.5)
Moderate

64
References
1. Ballard-Tremeer G, Mathee A. Review of interventions to reduce the exposure of women and young children to indoor air pollution in developing countries. WHO/USAID consultation on Indoor Air Pollution and Health May 3-4, 2000; Washington, DC2000. 2. Rehfuess EA, Puzzolo E, Stanistreet D, Pope D, Bruce NG. Enablers and Barriers to Large-Scale Uptake of Improved Solid Fuel Stoves: A Systematic Review. Environ Health Perspect. 2014;122(2):120-30. 3. Wentzel M, Pouris A. The development impact of solar cookers: A review of solar cooking impact research in South Africa. Energy Policy. 2007;35(3):1909-19. 4. Pope DP, Irving G, Bruce NG, Rehfuess ER. Methodological Quality Assessment for Intervention and Observational Studies using standardised instruments: Liverpool Quality Assessment Tools (LQATs). 2013. 5. Dherani M, Pope D, Mascarenhas M, Smith KR, Weber M, Bruce NG. Indoor air pollution from unprocessed solid fuel use and pneumonia risk in under-5 children: systematic review and meta-analysis. Bulletin of the World Health Organisation. 2008;86(5):390-8. 6. Pope DP, Mishra V, Thompson L, Siddiqui AR, Rehfuess EA, Weber M, et al. Risk of low birth weight and stillbirth associated with indoor air pollution from solid fuel use in developing countries. Epidemiol Rev. 2010;32(1):70-81. 7. Voss PH, Rehfuess EA. Quality appraisal in systematic reviews of public health interventions: an empirical study on the impact of choice of tool on meta-analysis. J Epidemiol Community Health. 2012;67:98-104. 8. Der Simonian R, Laird N. Meta-analysis in clincial trials. Control Clin Trials. 1986;7:177-88. 9. StataCorp. Stata Statistical Software: Release 9. College Station, TX: Stata Corp LP; 2005. 10. RDevelopment-Core-Team. R: A language and environment for statistical computing. Vienna, Austria: R Foundation for Statistical Computing. 2011. 11. Bates E, Pope D, Bruce N. Smoke, health and household energy Volume 1:Participatory methods for design, installation, monitoring and assessment of smoke alleviation technologies. Rugby UK: ITDG, 2005. 12. Singh A, Tuladhar B, Bajracharya K, Pillarisetti A. Assessment of effectiveness of improved cook stoves in reducing indoor air pollution and improving health in Nepal. Energy for Sustainable Development. 2012;16:406-14. 13. Li , S din A, Romanoff LC, orton , itzgerald CL, Eppler A, et al. Evaluation of exposure reduction to indoor air pollution in stove intervention projects in Peru by urinary biomonitoring of polycyclic aromatic hydrocarbon metabolites. Environ International. 2011;37:1157-63. 14. Lam N, Africano S, Humphrey S, Pennise D. Indoor Air Quality Impact of an Improved Chimney Wood Stove in Peri- Urban Honduras. 2012. 15. Chengappa C, Edwards R, Bagpai R, Naumoff Shields K, Smith KR. Impact of improved cookstoves on indoor air quality in the Bundelkhand region in India. Energy for Sustainable Development. 2007;11(2):33-44. 16. Dutta K, Naumoff Shields K, Edwards R, Smith KR. Impact of improved biomass cookstoves on indoor air quality near Pune, India. Energy for Sustainable Development. 2007;11(2):19-32. 17. Brant S, Pennise D, Balakrishnan K, Sambandam S, Charron DH. Monitoring for Success: Program Evaluation for a New Generation of Biomass Cookstoves. 2012. 18. Winrock. Peru healthy kitchen/healthy stove pilot project. Arkansas, US: Winrock International, 2008. 19. Cynthia AA, Edwards RD, Johnson M, Zuk M, Rojas L, Jimenez RD, et al. Reduction in personal exposures to particulate matter and carbon monoxide as a result of the

65
installation of a Patsari improved cook stove in Michoacan Mexico. Indoor Air. 2008;18(2):93-105. 20. Terrado EN, Eitel B. Pilot Commercialization of Improved Cookstoves in Nicaragua. Washington DC: ESMAP, 2005. 21. ENPHO., Tuladhar B, Gurung I, Shrestha B, Singh A, al. e. Final Report on Assessment of Effectiveness of ICS in Reducing IAP and Improving Health. 2008. 22. PAC. Ethanol as a household fuel in Madagascar: health benefits, economic assessment and review of African lessons for scaling up. Vol II: Analysis of Household Air Pollution Interventions In Madagascar Rugby UK Practical Action, 2011. 23. Naeher L, Smith KR, Leaderer B, Neufeld L, Mage D. Carbon monoxide as a tracer for assessing exposures to particulate matter in wood and gas cookstove households in highland Guatemala. Environmental Science and Technology. 2001;35:575-81. 24. Albalak R, Bruce NG, McCracken JP, Smith KR, De Gallardo T. Indoor respirable particulate matter concentrations from an open fire, improved cookstove, and LPG/open fire combination in a rural Guatemalan community. Environmental Science and Technology. 2001;35(13):2650-5. 25. Cowlin S, Kaufmann RB, Edwards R, Smith KR. Impact of improved stoves on indoor air quality in Ulaanbaatar, Mongolia. Washington, DC: World Bank, 2005. 26. Edwards RD, Liu Y, He G, Yin Z, Sinton J, Peabody J, et al. Household CO and PM measured as part of a review of China's National Improved Stove Program. Indoor Air. 2007;17:189-203. 27. Matsumura K. Improved Stove Evaluation. Boulder, CO.: University of Colorado at Boulder, 2011. 28. Chowdhury Z, Le LT, Al Masud A, Chang KC, Alauddin M, Hossain M, et al. Quantification of indoor air pollution from using cookstoves and estimation of its health effects on adult women in northwest Bangladesh. Aerosol and air quality research. 2012;12:463-75. 29. Bates E PD, Rehfuess E, Bruce N. Smoke, health and household energy Volume 2: Researching pathways to scaling up sustainable and effective kitchen smoke alleviation Rugby UK,: ITDG, 2007. 30. Smith KR, McCracken JP, Weber MW, Hubbard A, Jenny A, Thompson LM, et al. Effect of reduction in household air pollution on childhood pneumonia in Guatemala (RESPIRE): a randomised controlled trial. Lancet. 2011;378(9804):1717-26. 31. Bruce NG, McCracken JP, Albalak R, Schei M, Smith KR, Lopez V, et al. The impact of improved stoves, house construction and child location on levels of indoor air pollution and exposure in young Guatemalan children. Journal of Exposure Analysis and Environmental Epidemiology. 2004;14 (Suppl 1):S110-S7. 32. Smith KR, McCracken JP, Thompson L, Edwards R, Sheilds KN, Canuz E, et al. Personal child and mother carbon monoxide exposures and kitchen levels: Methods and results from a randomized trial of woodfired chimney cookstoves in Guatemala (RESPIRE). J Expo Sci Environ Epidemiol. 2009;epub ahead of print. 33. Pennise D, Brant S, Agbeve SM, Quaye W, Mengesha F, Tadele W, et al. Indoor air quality impacts of an improved wood stove in Ghana and an ethanol stove in Ethiopia. Energy for Sustainable Development. 2009;13(2):71-6. 34. Pennise D, Haigler E, Ndemere J, Charron D. Indoor Air Pollution Monitoring Summary for Urban Community Development Association’s Wood Stove Pro ect. 2007. 35. Ochieng CA, Vardoulakis S, Tonne C. Are rocket mud stoves associated with lower indoor carbon monoxide and personal exposure in rural Kenya? Indoor Air. 2012;1:1-11. 36. Balakrishnan K. Advanced combusiotn solid fuel stoves - intervention studies in India. 2012. 37. Rollin H, Mathee A, Bruce NG, Levin J, von Schirnding YER. Comparison of indoor air quality in electrified and un-electrified dwellings in rural South African villages. Indoor Air. 2004;14:208-16. 38. Barnes B, Mathee A, Shafritz L, Krieger L, Zimicki S. A behavioural intervention to reduce child exposure to indoor air pollution:identifying possible target behaviours. Health Education and Behaviour. 2004.

66
39. Zhou Z, Jin Y, Liu F, Cheng Y, Liu J, Kang J, et al. Community effectiveness of stove and health education interventions for reducing exposure to indoor air pollution from solid fuels in four Chinese provinces. Environmental Research Letters. 2006;1(1). 40. WHO. WHO guidelines for indoor air quality: selected pollutants Bonn: World Health Organization; 2010 [Accessed: 17 July 2014]. Available from: http://www.euro.who.int/__data/assets/pdf_file/0009/128169/e94535.pdf. 41. USEPA. U.S. Environmental Protection Agency. Energy Efficiency and Wood-Burning Stoves and Fireplaces. Available at wwwepagov/burnwise/energyefficiencyhtml : Accessed 11/30/2011. 2011. 42. Noonan C, Ward T, Navidi W, Sheppard L. A rural community intervention targeting biomass combustion sources: effects on air quality and reporting of children’s respiratory outcomes. Occupational and Environmental Medicine. 2012;69:354-60. 43. Noonan C, Navidi W, Sheppard L, Palmer C, Bergauff M, Hooper K, et al. Residential indoor PM2.5 in wood stove homes: follow-up of the Libby changeout program. Indoor Air. 2012;22:492-500. 44. Semmens E, Noonan C, Hester C, Ward T. Are Indoor Air Filters a Sustainable Intervention for Reducing Indoor Particulate Exposures? Epidemiology. 2012;23(S(5)):S638. 45. Ward T, Boulafentis J, Simpson J, Hester C, Moliga T, Warden K, et al. Lessons learned from a woodstove changeout on the Nez Perce Reservation. Sci Total Environ. 2011;409:664-70. 46. Allen R, Leckie S, Miller G, Brauer M. The impact of wood stove technology upgrades on indoor residential air quality. Atmos Environ. 2009;43:5908-15. 47. Sinton JE, Smith KR, Peabody JW, Yaping L, Xiliang Z, Edwards R, et al. An assessment of programs to promote improved household stoves in China. Energy for Sustain Dev. 2004;8(3):33-52. 48. Shen M, Chapman R, Vermeulen R, Tian L, Zheng T, Chen B, et al. Coal use, stove improvement and adult pneumonia mortality in Xuanwei, China: a retrospective cohort study. Environmental Health Perspectives. 2009;117(2):261-6. 49. Lan Q, Chapman RS, Schreinemachers DM, Tian L, He X. Household stove improvement and risk of lung cancer in Xuanwei, China. Journal of the National Cancer Institute. 2002;94 826-35. 50. Chapman RS, He X, Blair AE, Lam Q. Improvement in household stoves and risk of chronic obstructive pulmonary disease in Xuanwei, China: retrospective cohort study. BMJ. 2005;331:1050.