who global database on child growth and malnutrition
DESCRIPTION
WHO Global Database on child growth and malnutritionTRANSCRIPT

i
WHO Global Database on Child Growth and Malnutrition
WHO GlobalDatabase
on Child Growthand Malnutrition
Compiled by
Mercedes de Onis and Monika BlössnerProgramme of Nutrition
World Health OrganizationGeneva, 1997

WHO/NUT/97.4
ii
The designations employed and the presentation of material do not imply the expressionof any opinion whatsoever on the part of the World Health Organization concerningthe legal status of any country, territory or area, its authorities, its current or formerofficial name or the delimitation of its frontiers or boundaries.
________________________________________________________________________________
Correspondence regarding the database should be addressed to:
Dr Mercedes de Onis or Ms Monika BlössnerProgramme of NutritionWorld Health OrganizationCH-1211 Geneva 27
Telephone: 41 22 791 3320 or 791 3410Facsimile: 41 22 791 4156 or 791 0746
_________________________________________________________________________________

iii
WHO Global Database on Child Growth and Malnutrition
We are guilty of many errors andmany faults, but our worst crimeis abandoning the children,neglecting the foundation of life.Many of the things we need can wait.The child cannot.Right now is the time his bones arebeing formed, his blood is being madeand his senses are being developed.To him we cannot answer “Tomorrow”.His name is “Today”.
Gabriela Mistral, 1948
We dedicate this work to the world’s children in the hopethat it will alert decision-makers to how much remains tobe done to ensure children’s healthy growth anddevelopment.
“
”

WHO/NUT/97.4
iv
Acknowledgements
The Programme of Nutrition appreciates the strong support fromnumerous individuals, institutions, governments, and nongovernmentaland international organizations, without whose continual collaborationthis compilation would not have been possible. A special note ofgratitude is due to all those who provided standardized information andreanalyses of original data sets to conform to the database requirements.Thanks to such international cooperation in keeping the GlobalDatabase up-to-date, the Programme of Nutrition is able to present thisvast compilation of data on worldwide patterns and trends in childgrowth and malnutrition.
The work was financially assisted by the German Government, whichfunded for a period of 3 years the work of Ms Monika Blössner at theProgramme of Nutrition of the World Health Organization.
Abbreviations and Definitions
NCHS National Center for Health Statistics
SD Standard deviation
WHO World Health Organization
Z-score (or SD-score) The deviation of an individual’s value from themedian value of a reference population, dividedby the standard deviation of the referencepopulation.

v
WHO Global Database on Child Growth and Malnutrition
Contents
Preface .................................................................................................1
1 Introduction ...................................................................................1
2 The importance of global nutritional surveillance ........................2
3 Rationale for promoting healthy growth and development ..........4
4 The global picture ............................................................................4.1 Coverage of the database4.2 Overview of national surveys4.3 Regional and global estimates of underweight, stunting,
wasting, and overweight ............................................................4.4 Nutritional trends ......................................................................
5 Methods and standardized data presentation ..................................5.1 Child growth indicators and their interpretation .....................5.2 The international reference population ....................................5.3 The Z-score or standard deviation classification system ...........5.4 Cut-off points and summary statistics .......................................
6 How to read the database printouts .................................................6.1 Data. ..........................................................................................6.2 References..................................................................................
7 Bibliography. ....................................................................................
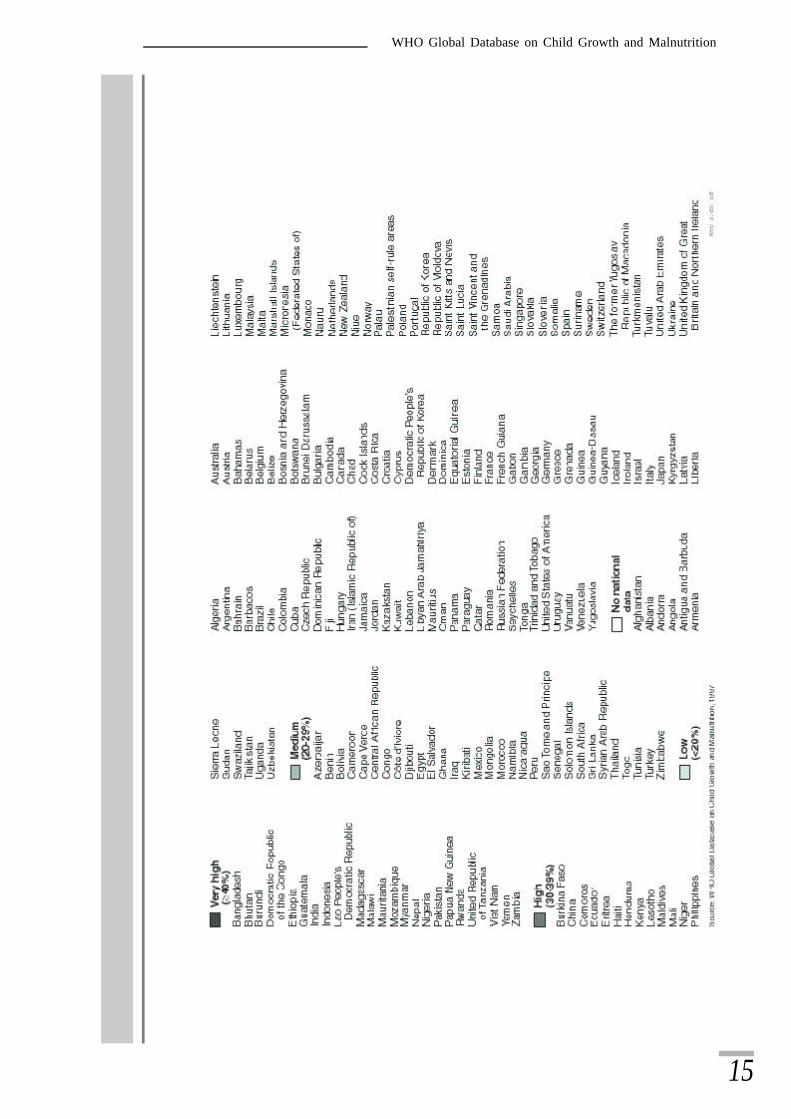
8 List of countries ................................................................................8.1 UN regions and subregions .......................................................8.2 WHO regions ............................................................................8.3 Level of development ................................................................
9 Country data and references .............................................................AfghanistanAlbaniaAlgeriaAmerican SamoaAngolaAntigua and BarbudaArgentinaArmeniaArubaAustraliaAzerbaijanBahrainBangladeshBarbadosBelgium
BelizeBeninBhutanBoliviaBosnia and HerzegovinaBotswanaBrazilBulgariaBurkina FasoBurundiCambodiaCameroonCanadaCape VerdeCentral African Republic

WHO/NUT/97.4
ChadChileChinaColombiaComorosCongoCook IslandsCosta RicaCôte d’IvoireCroatiaCubaCzech RepublicDemocratic Republic of the CongoDenmarkDjiboutiDominicaDominican RepublicEcuadorEgyptEl SalvadorEquatorial GuineaEritreaEthiopiaFijiFinlandFranceFrench GuianaFrench PolynesiaGabonGambiaGermanyGhanaGreeceGuatemalaGuineaGuinea-BissauGuyanaHaitiHondurasHong KongHungaryIndiaIndonesiaIran (Islamic Republic of)IraqIrelandIsraelItalyJamaicaJapanJordan
KazakstanKenyaKiribatiKuwaitKyrgyzstanLao People’s Democratic RepublicLebanonLesothoLiberiaLibyan Arab JamahiriyaLithuaniaMadagascarMalawiMalaysiaMaldivesMaliMauritaniaMauritiusMexicoMongoliaMoroccoMozambiqueMyanmarNamibiaNepalNetherlandsNew ZealandNicaraguaNigerNigeriaNiueNorwayOmanPakistanPalestinian self-rule areasPanamaPapua New GuineaParaguayPeruPhilippinesPolandPortugalPuerto RicoQatarRepublic of KoreaReunionRomaniaRussian FederationRwandaSaint Kitts and NevisSaint Lucia
v i

vii
WHO Global Database on Child Growth and Malnutrition
Saint Vincent and the GrenadinesSamoaSao Tome and PrincipeSaudi ArabiaSenegalSeychellesSierra LeoneSingaporeSolomon IslandsSomaliaSouth AfricaSpainSri LankaSudanSurinameSwazilandSwedenSwitzerlandSyrian Arab RepublicTajikistan
ThailandTogoTongaTrinidad and TobagoTunisiaTurkeyTurks and Caicos IslandsUgandaUnited Kingdom of Great Britainand Northern IrelandUnited Republic of TanzaniaUnited States of AmericaUruguayUzbekistanVanuatuVenezuelaViet NamYemenYugoslaviaZambiaZimbabwe

1
WHO Global Database on Child Growth and Malnutrition
Preface
I t was nearly 20 years ago that a group of scientists met under theaegis of the World Health Organization to examine ways to useanthropometry for assessing the nutritional status of children. In
their report (1) the group suggested new parameters allowinginternational comparisons of nutritional data. This marked thebeginning of WHO’s organized collection and standardization ofinformation on the nutritional status of the world’s under-five population.Initial results, published in 1983 (2), were followed in 1989 (3) and1993 (4) by updated global reviews of the magnitude of impaired childgrowth. WHO’s present database vastly expands the informationpresented in these earlier reports, both in terms of geographical spread,and the scope and quality of available data.
Numerous, usually small-scale, anthropometric surveys had of coursebeen previously undertaken in a number of countries. Interest wasconsiderably heightened in 1976, however, with the introduction bythe United States National Center for Health Statistics (NCHS) of theresults of a compilation of large-scale child-growth studies, whichestablished a reference for comparing anthropometric data. Theadoption of the working group’s recommendation (1) that the NCHSdata set become the common yardstick led to its being referred to as the“WHO/NCHS international reference population”. In the space of twodecades, child growth monitoring, to assess health and nutritional status,has become a powerful tool for identifying those individuals and groupsfor which particular nutrition interventions are needed.
The WHO/NCHS reference has been the subject of close technicalscrutiny, and a number of limitations have been identified, for exampleits limited geographical coverage. It is now probable that a new referencewill be developed by incorporating new data on the growth of healthychildren from several countries (5). Meanwhile, a major question ofprinciple remains: Is it appropriate to compare the growth of childrenliving in deprived environments with their counterparts in the radicallydifferent environment of affluent populations? If, as is frequently pointedout, a reference is no more than a comparison-making tool–as opposedto a standard to be upheld or a target to be attained–does this reallyanswer the question or merely evade the larger issue?
The WHO/NCHS reference relates to healthy children. It is now widely,if not universally, accepted that children the world over have much thesame growth potential, at least to seven years of age. Environmentalfactors, including infectious diseases, inadequate and unsafe diet, andall the handicaps of poverty appear to be far more important than geneticpredisposition in producing deviations from the reference.
We are more aware than ever before that the underlying causes ofimpaired growth are deeply rooted in poverty and lack of education. To

2
WHO/NUT/97.4
continue to allow underprivileged environments to affect children’sdevelopment not only perpetuates the vicious cycle of poverty; it alsocontributes to an enormous waste of human potential–a waste whichno society can afford.
The achievement of growth potential can be regarded as a basic humanright, part of the right of everyone to full development of theirpersonality, enshrined in two United Nations covenants (6,7). WHO’sGlobal Database on Child Growth and Malnutrition provides anexcellent objective index of the encouraging progress being made towardsachieving this goal in so far as it relates to physical development andnutritional status. It is also a stark reminder of just how much workremains to be done.
John C. WaterlowLondon, 1997
References
(1) Waterlow JC, Buzina R, Keller W, Lane JM, Nichaman MZ, Tanner JM. Thepresentation and use of height and weight data for comparing nutritional statusof groups of children under the age of 10 years. Bulletin of the World HealthOrganization 1977;55:489-498.
(2) Keller W and Fillmore CM. Prevalence of protein-energy malnutrition. WorldHealth Statistics Quarterly 1983;36:129-167.
(3) Global nutritional status, anthropometric indicators update 1989. NUT/ANTREF/1/89. Geneva: World Health Organization, 1989.
(4) de Onis M, Monteiro C, Akré J, Clugston G. The worldwide magnitude of protein-energy malnutrition: an overview from the WHO Global Database on ChildGrowth. Bulletin of the World Health Organization 1993;71:703-712.
(5) Physical status the use and interpretation of anthropometry. Report of a WHO ExpertCommittee. Technical Report Series No. 854. Geneva: World Health Organization,1995.
(6) Convention of the Rights of the Child. New York, United Nations Assemblydocument A/RES/25, 20 November 1989.
(7) Human rights: the international bill of human rights, Universal declaration ofhuman rights, International covenant on economic, social, and cultural rights,International covenant on civil and political rights and optional protocol. NewYork: United Nations, 1988.

3
WHO Global Database on Child Growth and Malnutrition
1 Introduction
Malnutrition is frequently part of a vicious cycle that includes povertyand disease. These three factors are interlinked in such a way that eachcontributes to the presence and permanence of the others.Socioeconomic and political changes that improve health and nutritioncan break the cycle; as can specific nutrition and health interventions.The WHO Global Database on Child Growth and Malnutrition seeksto contribute to the transformation of this cycle of poverty, malnutritionand disease into a virtuous one of wealth, growth and health.
Malnutrition usually refers to a number of diseases, each with a specificcause related to one or more nutrients, for example protein, iodine,vitamin A or iron. In the present context malnutrition is synonymouswith protein-energy malnutrition, which signifies an imbalance betweenthe supply of protein and energy and the body’s demand for them toensure optimal growth and function. This imbalance includes bothinadequate and excessive energy intake; the former leading tomalnutrition in the form of wasting, stunting and underweight, and thelatter resulting in overweight and obesity.
Malnutrition in children is the consequence of a range of factors, thatare often related to poor food quality, insufficient food intake, and severeand repeated infectious diseases, or frequently some combinations ofthe three. These conditions, in turn, are closely linked to the overallstandard of living and whether a population can meet its basic needs,such as access to food, housing and health care. Growth assessmentthus not only serves as a means for evaluating the health and nutritionalstatus of children but also provides an indirect measurement of the qualityof life of an entire population.
The WHO Global Database on Child Growth and Malnutritionillustrates malnutrition’s enormous challenge and provides decision-makers and health workers alike with the baseline information necessaryto plan, implement, and monitor and evaluate nutrition and publichealth intervention programmes aimed at promoting healthy growthand development. Since the Global Database is a dynamic surveillancesystem and new information is continually being collected, screenedand entered, data collection can never be considered complete. Despitethe considerable effort made to compile all available information, gapsin knowledge are inevitable. Users are therefore encouraged to sendadditional information to the following address:
WHO Global Database on Child Growth and MalnutritionProgramme of Nutrition/ World Health Organization
CH - 1211 Geneva 27

4
WHO/NUT/97.4
2 The importance of global nutritionalsurveillance
Nutritional surveillance has commonly been defined as the continualmonitoring of the nutritional status of a population, based on repeatednutritional surveys or on data from child health or growth-monitoringprogrammes. However, with its emphasis on the nature of measurementactivities, this is a rather narrow definition. A broader concept wouldemphasize the use of nutritional information to promote, manage, andevaluate programmes aimed at improving health and nutritional status.This broader view includes programmes and interventions as essentialcomponents of nutritional surveillance, with the data collection andmonitoring system being only one part of the overall surveillanceactivities.
Nutritional surveillance should thus be understood as a major operationalapproach for population-based applications, including targetinginterventions and assessing their effectiveness, as well as research onthe determinants and consequences of malnutrition. All these specificactivities are essential for the planning, implementation, andmanagement of nutrition programmes. Decision-makers need to knowon which geographic area and socioeconomic group to focus theirdevelopment programmes, just as the success of timely warning andintervention programmes depends on accurate data to trigger appropriateaction. Continual monitoring of nutritional status helps to detect earlyon health or nutrition problems in a population. Early detection inturn permits quick response and intervention, which can prevent furtherdeterioration and help re-establish sound nutritional status.
There are two principal approaches to the collection of nutritionalsurveillance information: special surveys (single or repeated), andcontinual monitoring systems based on child growth data from existingprogrammes. The WHO Global Database on Child Growth andMalnutrition concentrates on the former, population-based nutritionsurveys of under-5-year-olds, based on representative samples, applyingstandardized procedures. The major objectives of these nutrition surveysare (1):
n To characterize nutritional status: to measure the overall prevalenceof growth retardation as well as variations with age, sex,socioeconomic status, and geographical area.
n Targeting: to identify populations and sub-populations withincreased nutritional need.
n Evaluation of interventions: to collect baseline data before and atthe end of programmes aimed at improving nutrition.
n Monitoring: to monitor secular trends in nutritional status.n Advocacy: to raise awareness of nutritional problems, define policy,
and promote programmes.n Training and education: to motivate and train local teams to
undertake nutritional assessment.

5
WHO Global Database on Child Growth and Malnutrition
3 Rationale for promoting healthy growth anddevelopment
The health and social consequences of the current high prevalence ofimpaired child growth in developing countries are severe. The majoroutcomes of malnutrition during childhood may be classified in termsof morbidity (incidence and severity), mortality, and psychological andintellectual development; there are also important consequences in adultlife in terms of body size, work and reproductive performances, and riskof chronic diseases.
Childhood morbidity
Several authors have examined the association between anthropometryand morbidity. While there is some debate about whether malnutritionleads to a higher incidence of diarrhoea, there is little doubt thatmalnourished children tend to have more severe diarrhoeal episodes—in terms of duration, risk of dehydration or hospital admission—andassociated growth faltering (2-5). The risk of pneumonia is also increasedin these children (6).
Childhood mortality
A number of studies carried out during emergency and non-emergencysituations have demonstrated the association between increasedmortality and increasing severity of anthropometric deficits (7,8). Datafrom six longitudinal studies on the association between anthropometricstatus and mortality of children aged 6-59 months revealed a strong log-linear or exponential association between the severity of weight-for-agedeficits and mortality rates (9). Indeed, out of the 11.6 million deathsamong children under-five in 1995 in developing countries, it has beenestimated that 6.3 million—or 54% of young child mortality—wereassociated with malnutrition, the majority of which is due to thepotentiating effect of mild-to-moderate malnutrition as opposed to severemalnutrition (10)(Figure 1).
Child development and school performance
There is strong evidence that poor growth or smaller size is associatedwith impaired development (11), and a number of studies have alsodemonstrated a relationship between growth status and schoolperformance and intellectual achievement (12,13). However, thiscannot be regarded as a simple causal relationship because of the complexenvironmental or socioeconomic factors that affect both growth anddevelopment. An intervention study in Jamaica indicates that thedevelopmental status of underweight children can be partly improvedby food supplementation or by intellectual stimulation, but that greatestimprovements are achieved through a combination of both (14).
Adult-life consequences
Childhood stunting leads to a significant reduction in adult size, asdemonstrated by a follow-up of Guatemalan infants who, two decades

6
WHO/NUT/97.4
earlier, had been enrolled in a supplementation programme (13). Oneof the main consequences of small adult size resulting from childhoodstunting is reduced work capacity (15), which in turn has an impact oneconomic productivity.
In addition, maternal size is associated with specific reproductiveoutcomes. Short women, for example, are at greater risk for obstetriccomplications because of smaller pelvic size (1). There is also a strongassociation between maternal height and birth weight which isindependent of maternal body mass (16). There is thus an inter-generational effect (17), since low-birth-weight babies are themselveslikely to have anthropometric deficits at later ages (18). On the otherend of the spectrum, limited evidence is available linking overweight inchildhood to adult morbidity and mortality (19-21).
Given the importance of the health consequences associated withimpaired child growth, what will be the potential benefits of a strategyto promote healthy growth? As stated by Reynaldo Martorell (22), aleading scientist in this area, most benefits of achieving healthy growthare indirect and arise because the interventions necessary to improvegrowth also affect other functional domains. A child who is growingwell will most likely be more physically active and interact more withhis or her environment than one who is growing poorly. Apathy, whetherinduced by energy dietary deficits or infection, place a child at risk ofdevelopmental retardation. The conditions that improve growth willalso improve cognitive development, especially if emphasis is placed oninterventions to promote behavioural stimulation.
Based on data taken from Bailey K, de Onis M, Blössner M. Protein-energy malnutrition in: Murray CJL, Lopez AD, eds.Malnutrition and the Burden of Disease: the global epidemiology of protein-energy malnutrition, anaemias and vitamindeficiencies. Volume 8, The Global Burden of Disease and Injury Series, 1998 (in press), and Pelletier DL, Frongillo EA andHabicht JP, Epidemiologic evidence for a potentiating effect of malnutrition on child mortality, Am J Public Health 1993; 83:1130-1133.
Figure 1Distribution of 11.6 million deaths among children less than 5years old in all developing countries, 1995

7
WHO Global Database on Child Growth and Malnutrition
A child who is growing well is likely to have healthy immunologicaldefences against infection. Healthy growth thus means decreased riskof severe infections, case fatality rates, and child mortality. In effect, afocus on the quality of life will lead to lower infant and child mortalityrates and extend the gains made by child survival programmes.
Over the long term, youths who have been growing adequately duringchildhood will perform better in school than those who grew poorly.Again, this is not a causal relationship but simply a reflection of the factthat altering the environment to promote healthy growth also enhancesdevelopment and learning capacity which will result in youths with agreater potential for being productive members of society.
Youths and adults, as a result of improved growth in early childhood,will have enhanced working capacity leading to increased productivity.Another important benefit of larger body size in women is lower risk ofdelivering low-birth-weight infants and, hence, lower risk of infantmortality as well as other health consequences associated with thiscondition (23). Improved maternal stature will also lead to fewer deliverycomplications and thus, most likely to lower maternal mortality rates.
In summary, if we want to improve child health and survival on a globalscale, priority should be given to the identification and/or developmentof effective community-based strategies to improve child growth anddevelopment. The greatest impact can be expected when targeting allchildren in populations at risk and not just those individuals below aspecific cut-off point. This is what ultimately will break the cycle thatleads to malnutrition and increased morbidity and mortality.
4 The global picture4.1 Coverage of the database
At present, the Global Database covers 95% of the total population ofunder-5-year-olds (about 510 million children) living in developingcountries in 1995, or 84% of this age group worldwide. These percentagesof coverage refer only to nationally representative surveys and thus donot take into account the large number of other surveys at regional,province, state, district or local levels included in the database andpresented in the country data printouts in section 9.
Table 1 shows the population coverage attained by the database relativeto national surveys performed between 1980 and 1996. Coverage isvery high—95% or more—for northern, eastern, western and southernAfrica; eastern, south-central and south-eastern Asia; central and southAmerica; and Melanesia. Coverage is around 80% for middle Africa,western Asia, and the Caribbean. Micronesia and Polynesia are theonly two subregions in developing countries that remain inadequatelyrepresented by national surveys. Overall, regional coverage is as follows:Africa (93.6%), Asia (94.1%), Latin America (98.9%) and Oceania(82.6%).

8
WHO/NUT/97.4
It is important to recall that the Global Database is a dynamic datacollection system which is updated regularly. This implies that by thetime this section is read coverage will in fact be more comprehensivethan when it was prepared.
Table 1Population coverage in the WHO Global Database on Child Growth andMalnutrition based on available national surveys, 1980-1996.
UN-regions and Total Population coveragesubregions populat ion surveyed (%) covered total
(in millions)a
Africa 1 2 1 , 9 4 1 1 1 4 , 1 2 5 9 3 . 6 4 3 5 3
Eastern Africa 40,452 38,502 95.2 16 17
Middle Africa 15,632 12,130 77.6 5 9
Northern Africa 21,010 20,972 99.8 6 6
Southern Africa 6,605 6,372 96.5 4 5
Western Africa 38,242 36,149 94.5 12 16
Asiab 363,270 342,004 94.1 29 46
Eastern Asiab 109,920 103,902 94.5 2 4
South-central Asia 174,385 165,770 95.1 9 14
South-eastern Asia 57,012 55,011 96.5 7 10
Western Asia 21,953 17,321 78.9 11 18
Latin America & Caribbean 54,265 53,685 98.9 25 33
Caribbean 3,750 3,237 86.3 6 13
Central America 16,100 16,099 100.0 8 8
South America 34,415 34,349 99.8 11 12
Oceaniac 966 798 82.6 6 15
Melanesia 823 778 94.5 4 5
Micronesia 72 20 27.8 1 5
Polynesia 70 0 0.0 1 5
Developing countries 540,439 510,612 94.5 103 147
Global 611,559 511,639 83.7 107 192
a Under-5-year-old population estimates refer to 1995 based on the United NationsWorld Population Prospects - The 1996 Revision.
b Excluding Japan.c Excluding Australia and New Zealand.
No. of countries

9
WHO Global Database on Child Growth and Malnutrition
Coverage in Africa. Currently the Global Database has national datafor 43 out of 53 African countries, covering 93.6% of the under-5-year-olds in this region. Compared to the previous overview (24), 9 morecountries have national data, which represents a 16% increase inpopulation coverage. National surveys are still lacking from Somalia ineastern Africa; Angola, Chad, Equatorial Guinea, and Gabon in middleAfrica; Botswana in southern Africa; and Gambia, Guinea, Guinea-Bissau, and Liberia in western Africa.
Coverage in Asia. There have been many changes in this region duringthe last five years. New countries such as Azerbaijan, Kazakstan,Tajikistan, and Turkmenistan have joined the newly created south-central Asian subregion and, consequently, the total number of countriesin the region has increased from 37 to 46. At present the coverageattained by the database for Asia as a whole (excluding Japan) is 94.1%,which represents a 5% increase from the previous overview (24).Compared to 1992 data are now available for 10 more countries, or atotal of 29 out of 46 countries. The countries for which information isstill lacking are Afghanistan, Kyrgyzstan, Tajikistan, and Turkmenistan,in south-central Asia; Armenia, Cyprus, Georgia, Israel, Palestinian self-rule areas, Saudi Arabia, and the United Arab Emirates in western Asia;Brunei Darussalam, Cambodia, and Singapore in south-eastern Asia;and Democratic People’s Republic of Korea, Japan, and Republic of Koreain eastern Asia.
Coverage in Europe. Paradoxically, there is relatively little informationfrom Europe (25% coverage), with national nutrition data available foronly 4 out of 40 countries in this region. Low coverage does not imply,however, that information on child growth status is lacking; rather thatfor most countries data are not available in the required standardizedformat. National data are currently available for the Czech Republic,Hungary, Romania, and the Russian Federation.
Coverage in Latin America. There are national survey data for 25 outof 33 countries, covering 98.9% of the region’s total under-5-year-olds.Coverage is almost complete (³100%) for central and south America;it is 86.3% for the Caribbean, where 7 out of 13 countries still lacknational data. Since 1992 two additional countries (Argentina andBelize) have provided national nutrition data, while many others haveupdated previous national surveys. Data are still missing for Antiguaand Barbuda, Bahamas, Dominica, Grenada, Saint Kitts and Nevis, SaintLucia, and Saint Vincent and the Grenadines in the Caribbean, and forSuriname in south America.
Coverage in Oceania. Coverage in Oceania (excluding Australia andNew Zealand) is quite high (82.6%) mainly reflecting the very highcoverage for Melanesia (94.5%), the most populous subregion inOceania. However, compared to the last overview (24), Micronesiaremains inadequately represented by national surveys (27.8%), and noPolynesian country has provided data thus far. Since 1992, results of

10
WHO/NUT/97.4
national nutrition surveys from two countries in Melanesia (Fiji andSolomon Islands) have been added to the database. The followingdeveloping countries are still not included in the database: Cook Islands,Niue, Tuvalu, and Samoa in Polynesia; the Marshall Islands, FederatedStates of Micronesia, Nauru, and Palau in Micronesia; and NewCaledonia in Melanesia. Data are also missing from the two developedcountries in this region, Australia and New Zealand. However, in 1995Australia conducted a national nutrition survey, and the results will beincluded in the database as soon as they are released.
4.2 Overview of national surveys
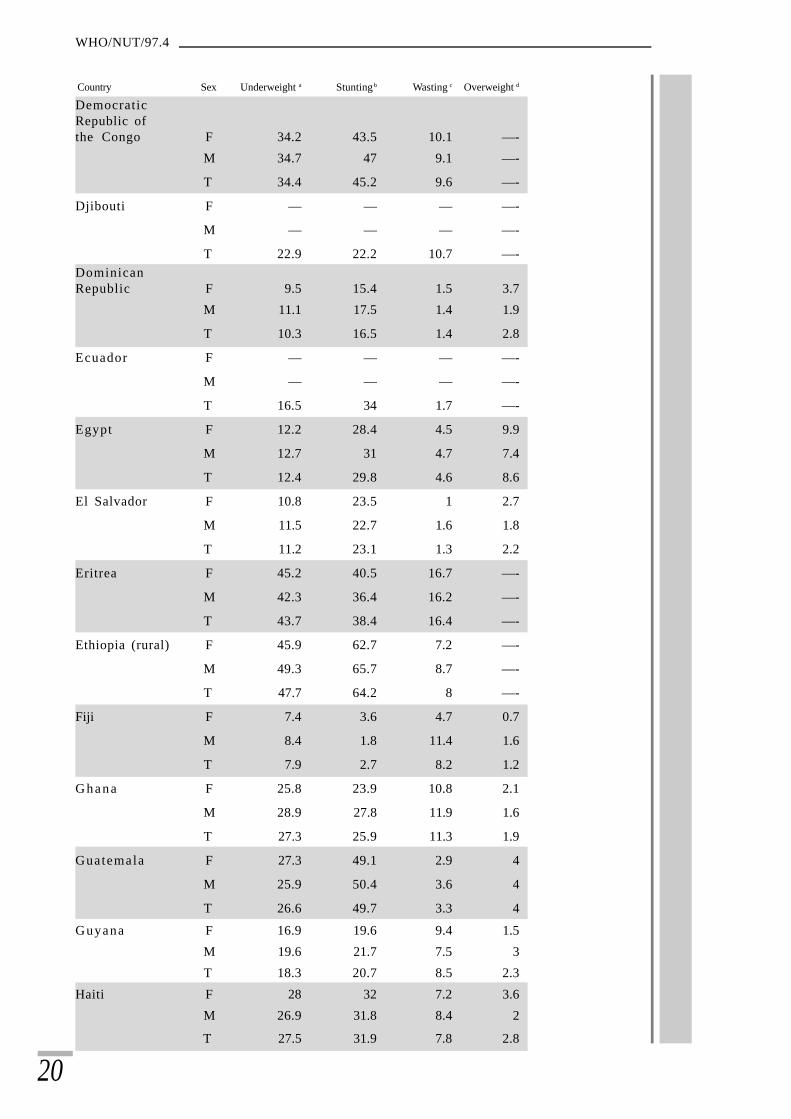
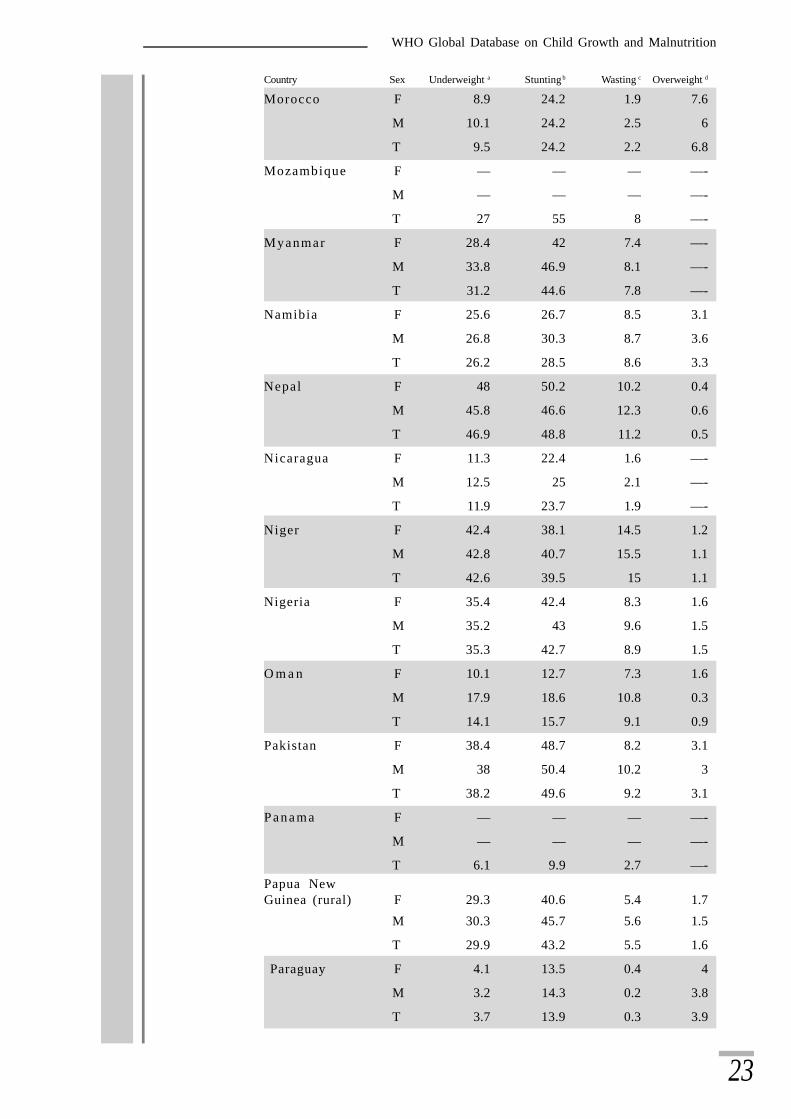
Table 2 presents the prevalence of underweight, stunting, wasting, andoverweight for boys, girls, and both sexes combined, based on nationalsurveys (latest year available) from 111 countries. It is important todisaggregate data by sex to monitor gender differences in child growthand malnutrition. As shown in Table 2, no consistent differences arefound between prevalence rates for boys and girls. However, prevalencerates are consistently higher in rural than in urban areas, and can varyconsiderably by age and region within countries. Detailed informationon national surveys, i.e. data disaggregated by age, sex, urban/ruralresidence, and region, can be found in the country data printouts insection 9.
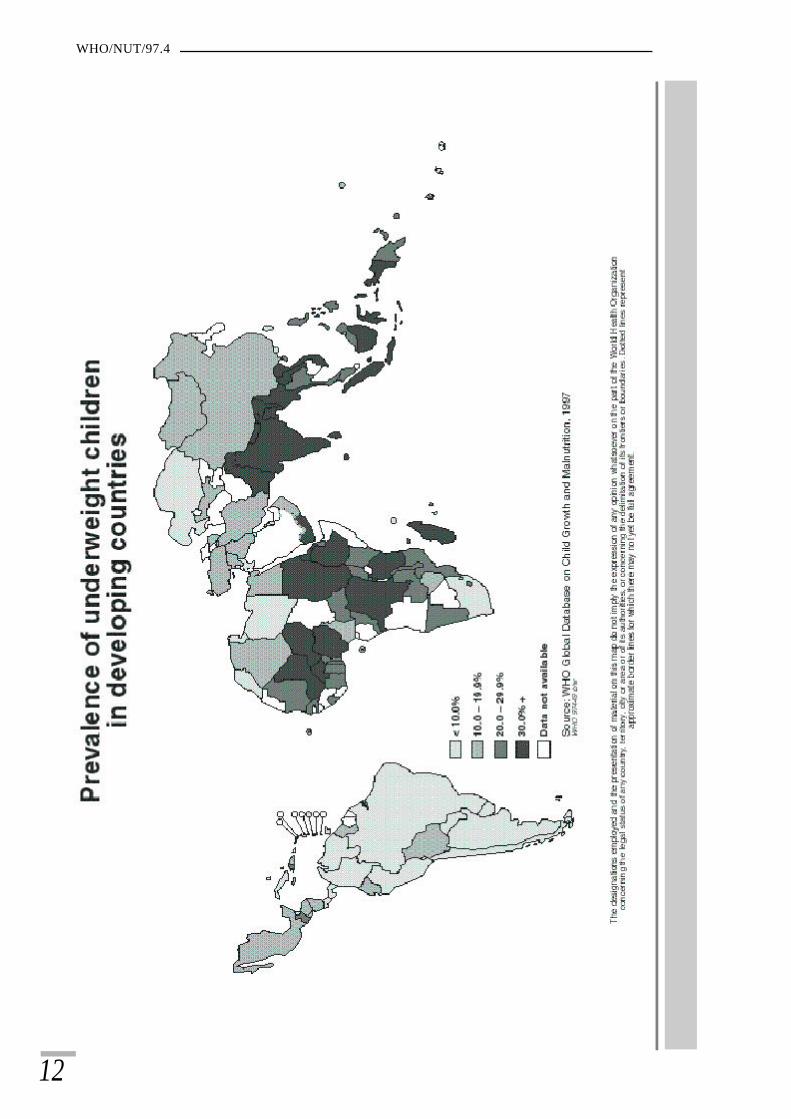
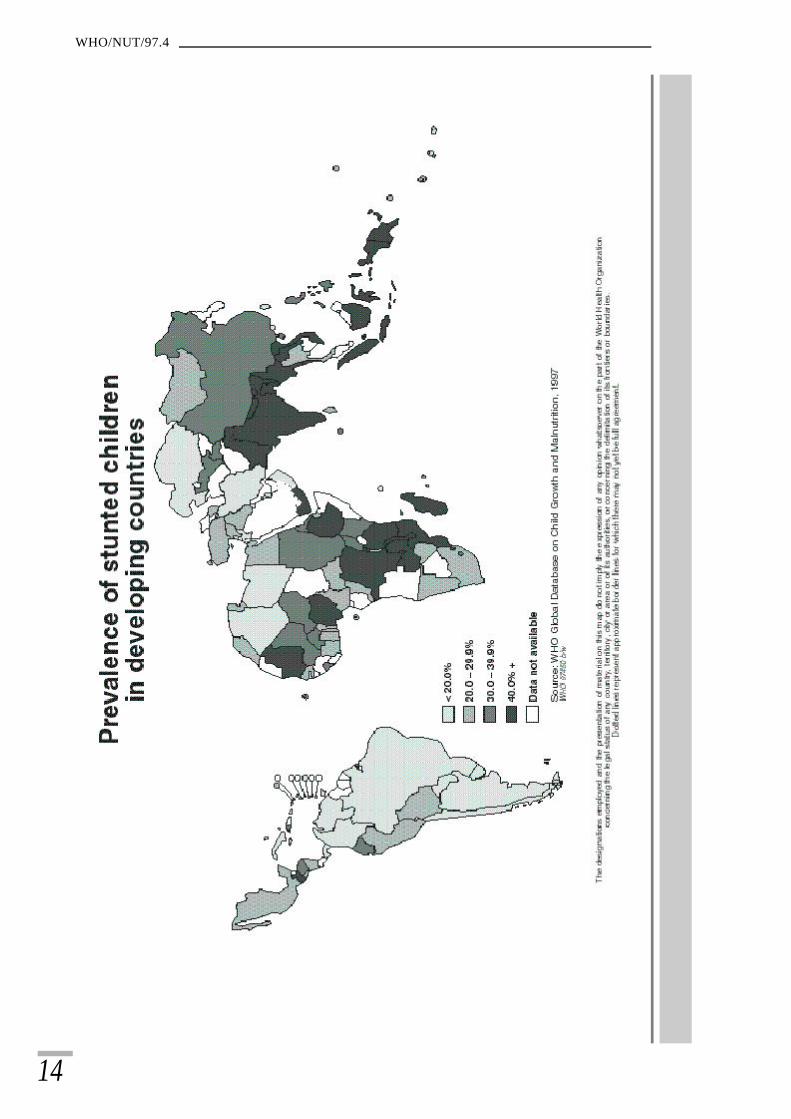
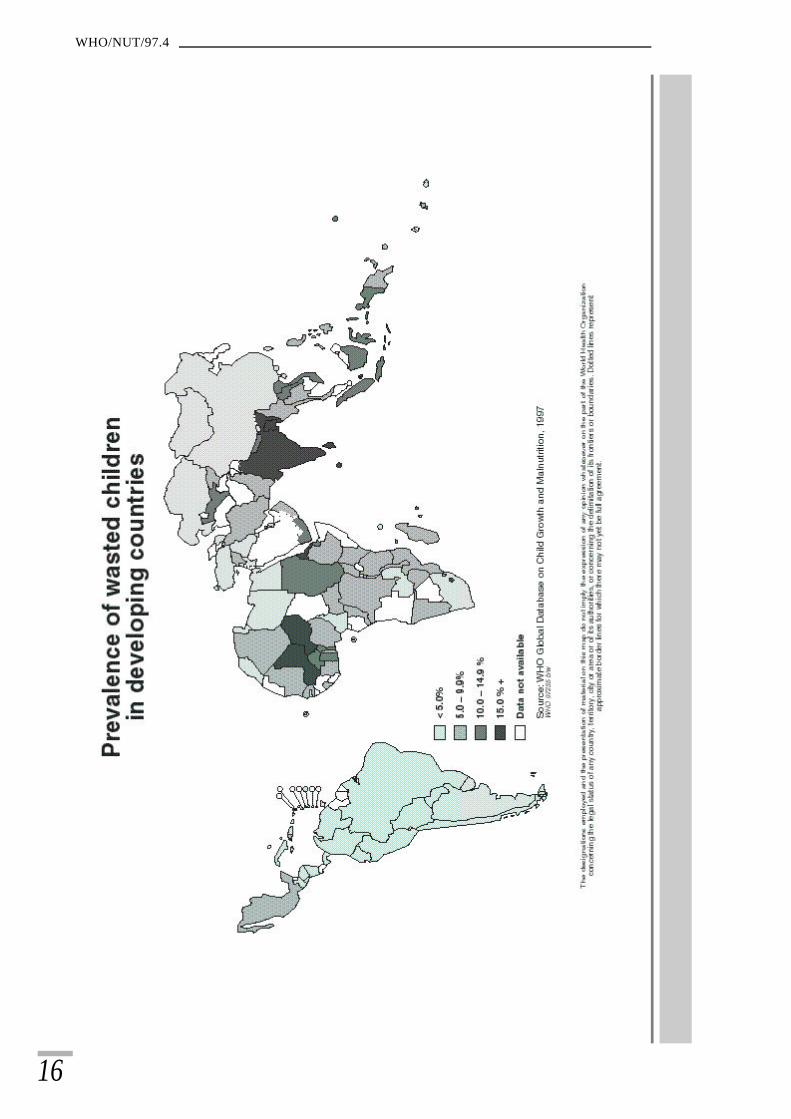
Figures 2-4 show the geographical distribution of countries according totheir prevalence of underweight, stunting, and wasting (percentage below-2 SD from the reference median value). Prevalences have been groupedaccording to the “trigger” levels of public health importance (seesection 5.4).
Distribution of underweight (Figure 2). Overall, there is a wide rangeof prevalence levels across countries ranging from 1% in Chile to 56%in Bangladesh. However, there are generally low to medium underweightprevalence levels in Latin America, with the exception of Guatemalaand Haiti where high rates of underweight children are found. Africapresents high variability with low and medium levels in the northernand southern subregions, but primarily high to very high prevalencerates in other countries of the continent. In Asia there is also a greatvariability between countries, with countries in the eastern subregionshowing low and medium levels, whereas the countries in the south-central and south-eastern subregion continue to have high to very highprevalences of underweight. Western Asia has mainly low to mediumprevalence levels, with the exception of Yemen whose rate is very high.
Distribution of stunting (Figure 3). In Latin America the severity ofstunting is low for the majority of countries but a number of countrieshave medium (Bolivia, El Salvador, Mexico, and Sao Tome and Principe)or high (Ecuador, Haiti, Honduras, and Peru) prevalence rates, and onlyone (Guatemala) has a very high prevalence rate. In Africa thevariability of prevalence rates is high for stunting as it is for underweight;

11
WHO Global Database on Child Growth and Malnutrition
however, the distribution differs slightly: low prevalence rates forstunting can be found only in the north, while all other sub-Saharancountries show medium, high and very high prevalences of stunting. InAsia, the south-central and south-eastern subregions primarily show highto very high rates of stunting; Thailand and Sri Lanka are the onlycountries in these subregions with medium prevalence rates. China,with a national prevalence rate of 31.4% is in the high range category.
Distribution of wasting (Figure 4). There is little variation in LatinAmerica as regards wasting, with most countries having low or mediumprevalence rates. In Africa the variability across countries is high forthis indicator, with low rates found in some northern and southerncountries, whereas medium, high and very high prevalences prevail incountries in eastern, middle, and western Africa. In Asia all levels ofseverity can be found, with lower levels primarily in eastern and westernAsia, and a dominance of medium, high and very high levels in theother subregions.
WHO/NUT/97.4
12

13
WHO Global Database on Child Growth and Malnutrition
14
WHO/NUT/97.4
15
WHO Global Database on Child Growth and Malnutrition
16
WHO/NUT/97.4

17
WHO Global Database on Child Growth and Malnutrition

18
WHO/NUT/97.4
Table 2Latest national prevalence of underweight, stunting, wasting andoverweight in preschool children by country and sex1.
Country Sex Underweight a Stunting b Wasting c Overweight d
Algeria F 12.5 18.2 8.8 9.8
M 13 18.3 9 8.5
T 12.8 18.3 8.9 9.2
Argentina F 0.5 2.2 0.3 9.6
M 3.4 7.4 1.8 4.8
T 1.9 4.7 1.1 7.3
Azerbaijan F 10.5 20 2.5 3.2
M 9.7 24 3.3 4
T 10.1 22.2 2.9 3.7
Bahrain F 6.7 9.6 5.2 5.9
M 7.8 10.3 5.7 3.5
T 7.2 9.9 5.5 4.7
Bangladesh F 58 55 16.9 0.4
M 54.6 54.2 18.6 0
T 56.3 54.6 17.8 0.2
Barbados F 7.4 7.4 4.9 4.9
M 4.5 6.7 4.8 2.9
T 5.9 7 4.9 3.9
Belize F — — — —-
M — — — —-
T 6.2 — — —-
Benin F 26.2 22.7 12.6 1.4
M 32.1 27.2 16 1.1
T 29.2 25 14.3 1.3
Bhutan F 38.3 54.9 4.2 1.9
M 37.6 57.2 4 2.2
T 37.9 56.1 4.1 2
Bolivia F 14.7 27 3.1 4.9
M 15 26.6 5.2 3.8
T 14.9 26.8 4.2 4.3
Brazil F 5.4 9.4 2.4 5.1
M 5.9 11.5 2.3 4.7
T 5.7 10.5 2.3 4.9
Burkina Faso F 32.2 32.1 13.2 1.4
M 33.2 34.5 13.2 1.7
T 32.7 33.3 13.2 1.6

19
WHO Global Database on Child Growth and Malnutrition
Country Sex Underweight a Stunting b Wasting c Overweight d
Burundi F 38 47.1 5.1 1.1
M 37.1 47.7 6.2 1.1
T 37.5 47.4 5.7 1.1
Cameroon F 16.5 24.6 2.8 3
M 13.8 27.3 3 2.8
T 15.1 26 2.9 2.9
Cape Verde F 18 24.1 3.5 —-
M 19.6 27.5 3.1 —-
T 18.8 25.8 3.3 —-Central AfricanRepublic F 23.7 29.5 6.2 1.1
M 22.6 27.2 6.6 0.6
T 23.2 28.4 6.4 0.8
Chile F — — — —-
M — — — —-
T 0.9 2.4 0.3 7.2
China F 18.1 30.7 3.3 4.4
M 16.7 32 3.5 4.1
T 17.4 31.4 3.4 4.3
Colombia F 7.6 13.7 1.3 3
M 9.1 16.2 1.4 2.3
T 8.4 15 1.4 2.6
Comoros F 24 31.7 7 4.3
M 27.6 35.7 9.4 3.3
T 25.8 33.8 8.3 3.8
Congo (rural) F 23.2 26.2 4.6 —-
M 24.7 28.8 6.4 —-
T 23.9 27.5 5.5 0.7
Costa Rica F — — — —-
M — — — —-
T 2.2 — — —-
Côte d’Ivoire F 21.1 23.6 6.7 1.8
M 26.4 25.2 9.7 1.3
T 23.8 24.4 8.3 1.5
Croatia F — — — —-
M — — — —-
T 0.6 0.8 0.8 5.9
Czech Republic F 0.9 1.8 1.8 4.2
M 1.1 2.1 2.4 4.1
T 1 1.9 2.1 4.1
20
WHO/NUT/97.4
Country Sex Underweight a Stunting b Wasting c Overweight d
DemocraticRepublic ofthe Congo F 34.2 43.5 10.1 —-
M 34.7 47 9.1 —-
T 34.4 45.2 9.6 —-
Djibouti F — — — —-
M — — — —-
T 22.9 22.2 10.7 —-DominicanRepublic F 9.5 15.4 1.5 3.7
M 11.1 17.5 1.4 1.9
T 10.3 16.5 1.4 2.8
Ecuador F — — — —-
M — — — —-
T 16.5 34 1.7 —-
Egypt F 12.2 28.4 4.5 9.9
M 12.7 31 4.7 7.4
T 12.4 29.8 4.6 8.6
El Salvador F 10.8 23.5 1 2.7
M 11.5 22.7 1.6 1.8
T 11.2 23.1 1.3 2.2
Eritrea F 45.2 40.5 16.7 —-
M 42.3 36.4 16.2 —-
T 43.7 38.4 16.4 —-
Ethiopia (rural) F 45.9 62.7 7.2 —-
M 49.3 65.7 8.7 —-
T 47.7 64.2 8 —-
Fiji F 7.4 3.6 4.7 0.7
M 8.4 1.8 11.4 1.6
T 7.9 2.7 8.2 1.2
G h a n a F 25.8 23.9 10.8 2.1
M 28.9 27.8 11.9 1.6
T 27.3 25.9 11.3 1.9
Guatemala F 27.3 49.1 2.9 4
M 25.9 50.4 3.6 4
T 26.6 49.7 3.3 4
Guyana F 16.9 19.6 9.4 1.5
M 19.6 21.7 7.5 3
T 18.3 20.7 8.5 2.3
Haiti F 28 32 7.2 3.6
M 26.9 31.8 8.4 2
T 27.5 31.9 7.8 2.8

21
WHO Global Database on Child Growth and Malnutrition
Country Sex Underweight a Stunting b Wasting c Overweight d
Honduras F 17.8 39.8 1.9 —-
M 18.8 39.4 2.1 —-
T 18.3 39.6 2 —-
Hungary F 2 2.7 1.4 2.2
M 2.4 3.1 1.8 1.8
T 2.2 2.9 1.6 2
India F 53.4 51.7 16.1 —-
M 53.3 52.3 18.8 —-
T 53.4 52 17.5 —-
Indonesia F 33.5 41.3 12.1 4.1
M 34.4 43 13.6 4
T 34 42.2 12.9 4Iran (IslamicRepublic of) F 16.3 18.4 7.1 —-
M 15 19.5 6.1 —-
T 15.7 18.9 6.6 —-
Iraq F — — — —-
M — — — —-
T 11.9 21.8 3.4 —-
Jamaica F — — — —-
M — — — —-
T 10.2 9.6 3.5 6
J o r d a n F 6.2 15.5 2.5 6.2
M 6.6 16.2 3.7 5.1
T 6.4 15.8 3.1 5.7
Kazakstan F 6.6 14.1 2.3 3.5
M 10.3 17.8 4.4 5.2
T 8.3 15.8 3.3 4.3
Kenya F 20.7 32 6.7 4.2
M 24.3 35.3 8.9 2.8
T 22.5 33.6 7.8 3.5
Kiribati F 11 27.5 9.3 12.6
M 14.7 29.1 12.4 9.7
T 12.9 28.3 10.8 11.1
Kuwait F — — — —-
M — — — —-
T 6.4 12.2 2.6 —-
Kyrgyzstan F — — 8.4 —-
M — — 8.7 —-
T — — 8.6 —-

22
WHO/NUT/97.4
Country Sex Underweight a Stunting b Wasting c Overweight d
Lao People’sDemocraticRepublic F 39.8 46.5 9.4 —-
M 40.1 48 11.5 —-
T 40 47.3 10.5 —-
Lebanon F 2.8 11.8 2.8 —-
M 3.3 12.6 3 —-
T 3 12.2 2.9 —-
Lesotho F — — — —-
M — — — —-
T 21.4 32.9 15.8 —-Libyan ArabJamahiriya F 4.4 13.8 2.7 —-
M 5 16.4 2.7 —-
T 4.7 15.1 2.7 —-
Madagascar F 33.7 48.4 7.3 1
M 34.6 51.2 7.4 0.9
T 34.1 49.8 7.4 1
Malawi F 27.1 47 5.6 7.3
M 32.7 49.7 8.5 6.1
T 29.9 48.3 7 6.7
Malaysia F — — — —-
M — — — —-
T 20.1 — — —-
Maldives F 39.2 29.8 14.3 —-
M 38.5 29.2 17.2 —-
T 39 29.6 16 —-
Mali F 40.3 29.2 22.2 1.3
M 39.7 31 24.5 1.3
T 40 30.1 23.3 1.3
Mauritania F — — — —-
M — — — —-
T 23 44 7.2 —-
Mauritius F — — — —-
M — — — —-
T 14.9 9.7 13.7 4
Mexico F 13.8 22.7 6.5 3.8
M 14.7 22.8 5.6 3.6
T 14.2 22.8 6 3.7
Mongolia F 12 27.1 1.7 —-
M 12.7 25.8 1.8 —-
T 12.3 26.4 1.7 —-
23
WHO Global Database on Child Growth and Malnutrition
Country Sex Underweight a Stunting b Wasting c Overweight d
Morocco F 8.9 24.2 1.9 7.6
M 10.1 24.2 2.5 6
T 9.5 24.2 2.2 6.8
Mozambique F — — — —-
M — — — —-
T 27 55 8 —-
Myanmar F 28.4 42 7.4 —-
M 33.8 46.9 8.1 —-
T 31.2 44.6 7.8 —-
Namibia F 25.6 26.7 8.5 3.1
M 26.8 30.3 8.7 3.6
T 26.2 28.5 8.6 3.3
Nepal F 48 50.2 10.2 0.4
M 45.8 46.6 12.3 0.6
T 46.9 48.8 11.2 0.5
Nicaragua F 11.3 22.4 1.6 —-
M 12.5 25 2.1 —-
T 11.9 23.7 1.9 —-
Niger F 42.4 38.1 14.5 1.2
M 42.8 40.7 15.5 1.1
T 42.6 39.5 15 1.1
Nigeria F 35.4 42.4 8.3 1.6
M 35.2 43 9.6 1.5
T 35.3 42.7 8.9 1.5
O m a n F 10.1 12.7 7.3 1.6
M 17.9 18.6 10.8 0.3
T 14.1 15.7 9.1 0.9
Pakistan F 38.4 48.7 8.2 3.1
M 38 50.4 10.2 3
T 38.2 49.6 9.2 3.1
P a n a m a F — — — —-
M — — — —-
T 6.1 9.9 2.7 —-Papua NewGuinea (rural) F 29.3 40.6 5.4 1.7
M 30.3 45.7 5.6 1.5
T 29.9 43.2 5.5 1.6
Paraguay F 4.1 13.5 0.4 4
M 3.2 14.3 0.2 3.8
T 3.7 13.9 0.3 3.9

24
WHO/NUT/97.4
Country Sex Underweight a Stunting b Wasting c Overweight d
Peru F 7.4 25.1 1.1 7
M 8.1 26.4 1.2 5.9
T 7.8 25.8 1.1 6.4
Philippines F 28.6 31.3 6.8 1.1
M 30.5 33.9 8 0.6
T 29.6 32.7 7.5 0.8
Qatar F 4.7 8.4 1.4 8.6
M 6.9 8.3 1.7 5.3
T 5.5 8.1 1.5 6.8
Romania F 5.6 7.6 2 2.5
M 5.7 8 3 2.2
T 5.7 7.8 2.5 2.3
Russian Federation F 3.3 13.2 4 23
M 2.8 12.1 3.8 18.6
T 3 12.7 3.9 20.9
Rwanda F 29.8 47.4 3.2 2
M 29 50 4.4 2.1
T 29.4 48.7 3.8 2.1Sao Tome andPrincipe F — — — —-
M — — — —-
T 16.6 25.9 4.8 —-
Senegal F 21.1 23.5 7.2 3
M 23.4 25.9 9.7 2.2
T 22.2 24.7 8.4 2.6
Seychelles F 5.9 4.2 1.5 3.4
M 5.4 6 2.3 3.7
T 5.7 5.1 2 3.5
Sierra Leone F — — — —-
M — — — —-
T 28.7 34.7 8.5 —-
Solomon Islands F 19.9 26.3 5.5 1.3
M 22.6 28.2 7.7 1
T 21.3 27.3 6.6 1.1
South Africa F 8.7 21.5 2.3 7.4
M 9.8 24.1 2.6 5.9
T 9.2 22.8 2.5 6.7
Sri Lanka F 40.9 25.1 15.4 0.1
M 34.8 22.7 15.6 0.2
T 37.7 23.8 15.5 0.1

25
WHO Global Database on Child Growth and Malnutrition
Country Sex Underweight a Stunting b Wasting c Overweight d
S u d a n F 35.4 34.4 13.8 —-
M 32.3 34.3 12.4 —-
T 33.9 34.3 13.1 —-
Swaziland F 8.6 27.5 0.6 —-
M 10.6 31.1 1.1 —-
T 9.7 30.3 0.9 —-Syrian ArabRepublic F 11.3 25.8 7.7 —-
M 12.9 27.8 8.5 —-
T 12.1 26.6 8.1 —-
Thailand F 25.4 21.1 5.3 1.5
M 25.3 21.9 5.3 1
T 25.3 21.5 5.3 1.2
Togo F 23.5 26.4 4.3 2.1
M 25.3 31.9 6.3 2.9
T 24.5 29.2 5.3 2.5
Tonga F — — — —-
M — — — —-
T — 1.3 0.9 —-
Trinidad and Tobago F 7.4 4.6 3.7 3
M 5.9 4.9 3.7 3
T 6.7 4.8 3.7 3
Tunisia F 9.3 22.6 4.3 4.2
M 8 22.3 3.5 2.8
T 9 22.5 3.9 3.5
Turkey F 10.5 19.8 2.5 2.7
M 10.3 21.1 3.3 3
T 10.4 20.5 2.9 2.9
Uganda F 24.1 36.7 4.6 2.6
M 27.1 40 6.1 3
T 25.5 38.3 5.3 2.8United Republicof Tanzania F 30.4 41.9 6.4 2.9
M 30.8 44.9 8.1 2.2
T 30.6 43.4 7.2 2.5United Statesof America F 1.5 2 0.5 4.9
M 1.3 2.1 0.7 3.5
T 1.4 2.1 0.6 4.1
Uruguay F 4.5 8.7 1.4 6.6
M 4.3 10.2 1.4 5.9
T 4.4 9.5 1.4 6.2
26
WHO/NUT/97.4
Country Sex Underweight a Stunting b Wasting c Overweight d
Uzbekistan F 16.8 28.5 10.6 —-
M 20.7 33.9 12.6 —-
T 18.8 31.3 11.6 —-
Vanuatu F — — — —-
M — — — —-
T 19.7 19.1 — —-
Venezuela F 4.3 11.8 2.9 2.8
M 4.7 14.5 2.9 3.2
T 4.5 13.2 2.9 3
Viet Nam F 46 46.8 11.6 —-
M 43.8 46.9 11.6 —-
T 44.9 46.9 11.6 —-
Yemen F 29.8 49.2 11.4 —-
M 30.3 38.6 14.3 —-
T 30 44.1 12.7 —-
Yugoslavia F 1.4 6.8 2 5.6
M 1.8 6.8 2.3 4.5
T 1.6 6.8 2.1 5
Zambia F 22.5 41.7 3.3 3.5
M 24.5 43.1 5 3
T 23.5 42.4 4.2 3.3
Zimbabwe F 13.8 21.1 4.5 4.6
M 17.3 21.7 6.5 3.8
T 15.5 21.4 5.5 4.2
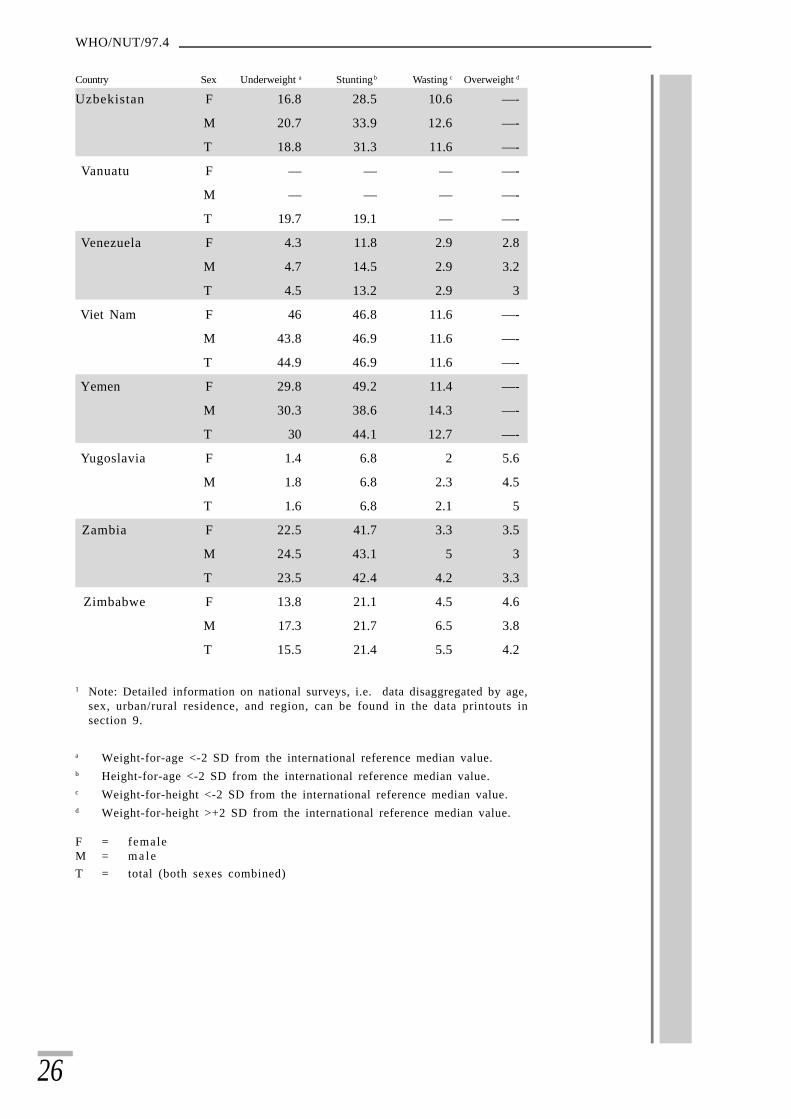
1 Note: Detailed information on national surveys, i.e. data disaggregated by age,sex, urban/rural residence, and region, can be found in the data printouts insection 9.
a Weight-for-age <-2 SD from the international reference median value.b Height-for-age <-2 SD from the international reference median value.c Weight-for-height <-2 SD from the international reference median value.d Weight-for-height >+2 SD from the international reference median value.
F = femaleM = m a l eT = total (both sexes combined)

27
WHO Global Database on Child Growth and Malnutrition
4.3 Regional and global estimates of underweight, stunting,wasting, and overweight
Tables 3-5 present regional and global estimates for the prevalence andnumber of underweight, stunted, wasted and overweight under-5-year-old children by UN regions, WHO regions and level of development.These estimates are derived from nationally representative data usingthe same methodology applied in the past (24), therefore these estimatesupdate earlier assessments on the basis of recent data. The distributionof countries according to the different classifications can be found insections 8.1 (UN regions), 8.2 (WHO regions), and 8.3 (Level ofdevelopment).
Based on data available as of September 1997, it is estimated that about31% of children under 5 years of age in developing countries, or 167million, are malnourished when measured according to weight-for-age;about 38%, or 206 million, are stunted; and 9%, or 49 million, are wasted.Asia is the most affected region for all three indicators. Based on theestimates shown in Table 3, the risk of being malnourished as measuredby underweight is 1.2 times higher in Asia than in Africa, and 3 timeshigher in Africa than in Latin America. The number of under-5-year-olds living in each geographical area—54 million in Latin America,121 million in Africa, and 363 million in Asia—renders the regionaldistribution even more unequal. Currently, over two-thirds (76%) ofthe world’s malnourished (underweight) children live in Asia—especiallysouth-central Asia—while 21% are found in Africa and 3% in LatinAmerica. Oceania, despite its high prevalence of underweight andstunting, contributes very little to the absolute number of malnourishedchildren, since there are fewer than 1 million under-5-year-olds livingin the developing countries in this region.
Estimates of underweight, stunting, and wasting have also been madefor all subregions in Africa, Asia, and Latin America (Table 3). South-central Asia has by far the highest malnutrition levels, both in terms ofprevalence rates and absolute numbers. In this subregion alone, about50%, or 86 million under-fives are malnourished, accounting for half ofthe total number of malnourished children in developing countries.Within Asia, the south-eastern subregion follows next, also with veryhigh rates of malnutrition. Its contribution in terms of absolute numbersis considerably less, however, since there are much fewer under-5-year-olds living in this subregion (174 million in south-central and 57 millionin south-eastern Asia).
Eastern and western Africa rank next highest in prevalence and numbersof malnourished children. About 26 million, or 33% of children underfive, are underweight in these two subregions. Within Africa, middleAfrica ranks third with about 30% of affected children, or 5 million.Northern and southern Africa have considerably lower underweight ratesand jointly these two subregions account for only 4 million affectedchildren. Significantly lower levels are found in Latin America with anaverage prevalence level of 9.5% or around 5 million malnourishedchildren.

28
WHO/NUT/97.4
Table 3 provides also regional and global estimates of stunting andwasting. Although stunting levels are higher than underweight, thepattern of regional differences is quite similar; wasting levels, bycomparison, are significantly lower. It should be noted that wasting isvery sensitive to seasonal changes, food availability, and infectious diseaseprevalence, and can change rapidly in response to these factors. Thewasting estimates reported here may not reflect these rapid changes andshould therefore be interpreted with caution.
Table 3Regional and global prevalence and numbers of underweight, stunted,wasted and overweight children under five years of age by UN regionsand subregions in 1995.
UN regions and subregions underweight a stunting b wasting c overweight d
Africa 28.4 (34.7) e 38.6 (47.0) 8.0 (9.7) 3.2 (3.9)Eastern Africa 33.0 (13.3) 48.0 (19.4) 7.1 (2.9) 2.8 (1.1)Middle Africa 29.9 (4.7) 40.2 (6.3) 8.1 (1.3) NAf
Northern Africa 15.5 (3.3) 26.6 (5.6) 6.5 (1.4) 6.8 (1.4)Southern Africa 10.5 (0.7) 23.7 (1.6) 3.4 (0.2) 6.3 (0.4)Western Africa 33.2 (12.7) 37.1 (14.2) 10.5 (4.0) 1.6 (0.6)
Asiag 35.0 (127.2) 41.0 (149.1) 10.3 (37.4) 2.6 (9.6)Eastern Asiag 17.4 (19.1) 31.4 (34.5) 3.4 (3.7) 4.3 (4.7)South-central Asia 49.3 (86.0) 49.6 (86.5) 15.2 (26.5) 1.6 (2.8)South-eastern Asia 33.5 (19.1) 39.7 (22.6) 10.4 (5.9) 2.5 (1.4)Western Asia 13.8 (3.0) 24.9 (5.5) 5.5 (1.2) NAf
Latin America & Caribbean 9.5 (5.2) 17.9 (9.7) 3.0 (1.6) 4.4 (2.4)Caribbean 13.7 (0.5) 17.3 (0.6) 3.6 (0.1) 3.7 (0.1)Central America 15.1 (2.4) 26.7 (4.3) 5.0 (0.8) 3.5 (0.6)South America 6.5 (2.2) 13.8 (4.7) 2.0 (0.7) 4.9 (1.7)
Oceaniah 22.8 (0.2) 31.4 (0.3) 5.0 (0.05) 1.3 (0.0)Developing countries 31.0 (167.3) 38.1 (206.2) 9.0 (48.8) 2.9 (15.9)Global 27.4 (167.9) 34.0 (208.1) 8.1 (49.4) NAf
a Weight-for-age <-2 SD from the international reference median value.b Height-for-age <-2 SD from the international reference median value.c Weight-for-height <-2 SD from the international reference median value.d Weight-for-height >+2 SD from the international reference median value.e Figures in parentheses are millions of children.f NA = Not available (insufficient population coverage to derive estimates).g Excluding Japan.h Excluding Australia and New Zealand.
For the first time an attempt is made to quantify the magnitude ofoverweight in children. In general, overweight prevalences during earlychildhood are low, although some countries and geographical subregionsare already starting to present medium prevalence levels (Tables 2 and3). These preliminary estimates show that careful attention should bepaid to monitoring trends and patterns of levels of overweight in childrenso as to establish early preventive measures where needed. This, however,should not be done at the expense of decreasing internationalcommitment to alleviating child undernutrition; growth impairmentwill remain for many years to come a major public health problemworldwide.

29
WHO Global Database on Child Growth and Malnutrition
Table 4Regional and global prevalence and numbers of underweight, stunted,wasted and overweight children under five years of age by WHO regionsin 1995.
WHO regions underweight a stunting b wasting c overweight d
Africa 30.4 (31.2) e 40.2 (41.3) 8.3 (8.5) 2.8 (2.9)
Americas 7.6 (5.8) 13.5 (10.3) 2.8 (2.1) 4.8 (3.6)
Eastern Mediterranean 24.9 (17.3) 34.3 (23.9) 7.5 (5.2) 4.2 (2.9)
South-East Asia 50.1 (82.7) 50.2 (82.9) 15.9 (26.3) 1.7 (2.8)
Western Pacific 20.6 (28.9) 32.8 (46.0) 4.4 (6.2) 3.8 (5.3)
All WHO regions 27.8 (169.5) 34.9 (213.1) 8.4 (50.2) NA f
a Weight-for-age <-2 SD from the international reference median value.b Height-for-age <-2 SD from the international reference median value.c Weight-for-height <-2 SD from the international reference median value.d Weight-for-height >+2 SD from the international reference median value.e Figures in parentheses are millions of children.f NA = Not available (insufficient population coverage to derive estimates).
The European region does not have sufficient population coverageto present overall estimates. However, it is anticipated that thereare very low levels of underweight, stunting and wasting in thisregion. On the other hand, overweight levels are expected to bequite high in these populations.
For the complete list of countries included in the different WHOregions, please refer to section 8.2.
Table 5Regional and global prevalence and numbers of underweight, stunted,wasted and overweight children under five years of age by level ofdevelopment in 1995.
Level of development underweight a stunting b wasting c overweight d
2 29.3 (128.1) e 36.2 (158.2) 8.8 (38.5) 3.2 (14.0)
3 40.4 (38.4) 48.8 (46.4) 10.5 (10.0) 1.7 (1.6)
4 4.3 (1.1) 13.4 (3.6) 3.6 (1.0) NAf
All 27.5 (168.7) 34.1 (208.2) 8.1 (49.4) NAf
a Weight-for-age <-2 SD from the international reference median value.b Height-for-age <-2 SD from the international reference median value.c Weight-for-height <-2 SD from the international reference median value.d Weight-for-height >+2 SD from the international reference median value.e Figures in parentheses are millions of children.f NA = Not available (insufficient population coverage to derive estimates).Level 1 =Developed market economies. This level does not have sufficientpopulation coverage to present overall estimates. However, it is anticipated thatthere are very low levels of underweight, stunting and wasting in this group ofcountries. On the other hand, overweight levels are expected to be quite high inthese populations.Level 2 = Other developing countries.Level 3 = Least developed countries.Level 4 = Economies in transition.
For the WHO list of countries included in each of the four levels of development,please refer to section 8.3.
Notes:

30
WHO/NUT/97.4
4.4 Nutritional trends
Historical nutritional trends (i.e. 1975-1985) have been derived byusing a regression model based on nutritional survey data and otheravailable data (e.g. per capita calorie supply, infant mortality rate,population density) for each country and year. The rationale for applyingstatistical models is that there are insufficient nationally representativedata points within a reasonable time span to calculate population-weighted averages. Given the inherent limitations of estimates derivedusing mathematical models, historical trends are presented only in agraphic format. A description of the methods and variables used in theregression model is available on request from the Programme ofNutrition.
Recent nutritional trends (i.e. 1990-1995) have been derived as apopulation-weighted average for countries with nationally representativedata as of September 1997. Estimates of countries’ under-5-year-oldpopulations in 1990 and 1995 were obtained from the 1996 revision ofthe World Population Prospects prepared by the United NationsPopulation Division. Estimates of underweight and stunting have beencalculated only for those subregions where the proportion of childrencovered by national surveys was at least ž75%, and in most cases >85%.A detailed description of the methodology used is presented elsewhere(24).
The prevalence of malnutrition in children under 5 years of age, asmeasured by low weight-for-age, has progressively fallen in developingcountries from 42.6% in 1975 to 31.0% in 1995. However, the latestevidence shows a deceleration in improved nutritional status in manyregions, and in some regions of Africa the previous decreasing trend hasactually begun to reverse itself. The stagnation of nutritionalimprovement combined with a rapid rise in population has resulted inan increase in the total number of malnourished children in all subregionsof Africa. Recent trends (1990-1995) in underweight and stunting byUN regions are presented in Tables 6 and 7. Table 8 presents recenttrends (1990-1995) in underweight by WHO regions. Global andregional historical trends (1975-1995) in underweight and stunting arefound in Figures 5-9.
The global rate of progress in overcoming malnutrition among under-fives is entirely inadequate for achieving the year-2000 goal of a 50%reduction in 1990 prevalence levels of moderate and severe malnutrition(Figures 10a and 10b). If current trends continue, Latin America willbe the only region possibly to reach the year-2000 goal. For Asia andAfrica, if the goal is to be approached, the current prevalence ofmalnutrition needs to be reduced by about half, i.e. from 28.4% to 13.0%(35 million to approximately 17 million children) in Africa, and from35.0% to 18.6% (127 million to approximately 68 million children) inAsia.

31
WHO Global Database on Child Growth and Malnutrition
0
50
100
150
200
1975 1980 1985 1990 1995
million
Africa
Asia
Latin America
Developing countries
Global
0
50
100
150
200
1975 1980 1985 1990 1995
million
Africa
Asia
Latin America
Developing countries
Global
0
10
20
30
40
50
1975 1980 1985 1990 1995
%
Africa
Asia
Latin America
Developing countries
Global
0
10
20
30
40
50
1975 1980 1985 1990 1995
%
Africa
Asia
Latin America
Developing countries
Global
Figure 5a: Global trends in prevalences of underweight inchildren under five years of age, 1975-1995
Figure 5b: Global trends in numbers of underweight inchildren under five years of age, 1975-1995

32
WHO/NUT/97.4
10
20
30
40
50
1975 1980 1985 1990 1995
%
Africa
Asia
Latin America
Developing countries
Global
10
20
30
40
50
1975 1980 1985 1990 1995
%
Africa
Asia
Latin America
Developing countries
Global
0
50
100
150
200
250
1975 1980 1985 1990 1995
million
Africa
Asia
Latin America
Developing countries
Global
0
50
100
150
200
250
1975 1980 1985 1990 1995
million
Africa
Asia
Latin America
Developing countries
Global
Figure 6a: Global trends in prevalences of stunting inchildren under five years of age, 1975-1995
Figure 6b: Global trends in numbers of stuntedchildren under five years of age, 1975-1995

33
WHO Global Database on Child Growth and Malnutrition
0
10
20
30
40
1975 1980 1985 1990 1995
%
Africa
Eastern Africa
Northern Africa
Western Africa
0
10
20
30
40
1975 1980 1985 1990 1995
%
Africa
Eastern Africa
Northern Africa
Western Africa
Note: The regions of middle and southern Africa have insufficient coverage to produce trend estimates
0
10
20
30
40
1975 1980 1985 1990 1995
million
Africa
Eastern Africa
Northern Africa
Western Africa
0
10
20
30
40
1975 1980 1985 1990 1995
million
Africa
Eastern Africa
Northern Africa
Western Africa
Note: The regions of middle and southern Africa have insufficient coverage to produce trend estimates
Figure 7a: Trends in Africa of prevalences of underweightchildren under five years of age, 1975-1995
Figure 7b: Trends in Africa of numbers of underweightchildren under five years of age, 1975-1995
34
WHO/NUT/97.4
0
10
20
30
40
50
60
70
1975 1980 1985 1990 1995
%
Asia
Eastern Asia
South-central Asia
South-eastern Asia
Western Asia
0
10
20
30
40
50
60
70
1975 1980 1985 1990 1995
%
Asia
Eastern Asia
South-central Asia
South-eastern Asia
Western Asia
Note: Estimates for Asia and south-eastern Asia exclude Japan.
0
50
100
150
200
1975 1980 1985 1990 1995
million
Asia
Eastern Asia
South-central Asia
South-eastern Asia
Western Asia
0
50
100
150
200
1975 1980 1985 1990 1995
million
Asia
Eastern Asia
South-central Asia
South-eastern Asia
Western Asia
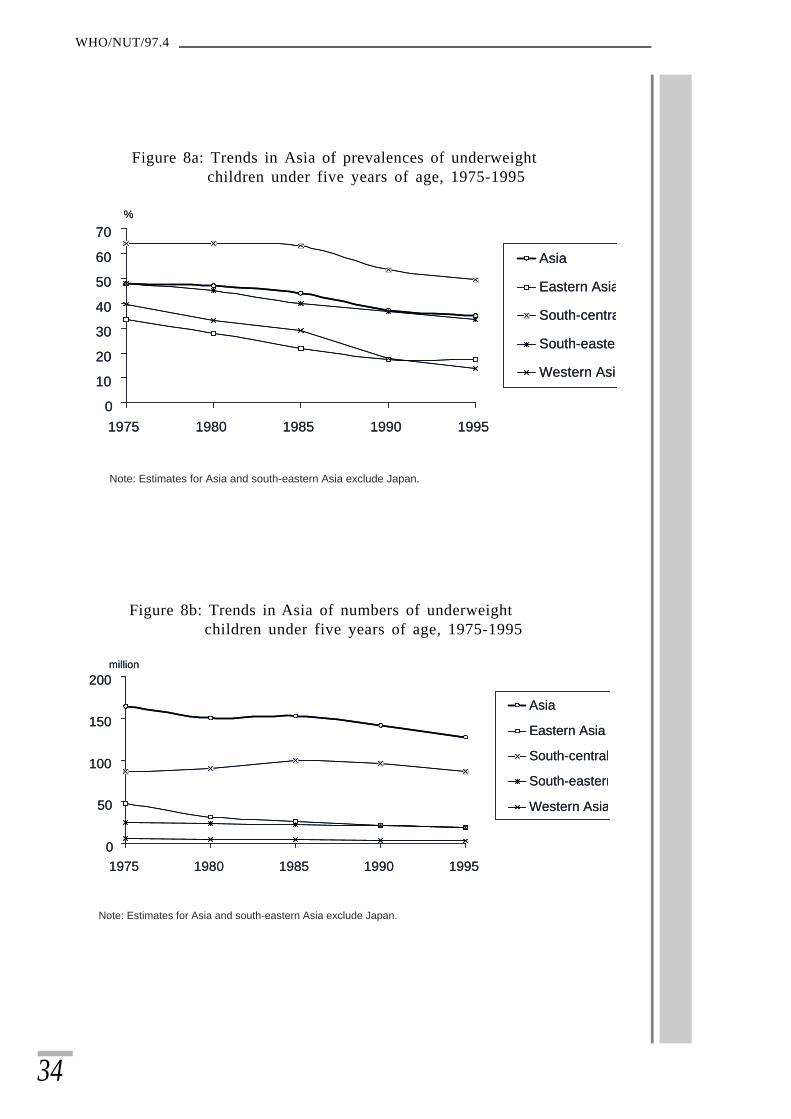
Note: Estimates for Asia and south-eastern Asia exclude Japan.
Figure 8a: Trends in Asia of prevalences of underweightchildren under five years of age, 1975-1995
Figure 8b: Trends in Asia of numbers of underweightchildren under five years of age, 1975-1995

35
WHO Global Database on Child Growth and Malnutrition
0
10
20
30
1975 1980 1985 1990 1995
%
Latin America
Caribbean
South America
0
10
20
30
1975 1980 1985 1990 1995
%
Latin America
Caribbean
South America
Note: The subregion of central America has insufficient data to producetrend estimates.
0
10
1975 1980 1985 1990 1995
million
Latin America
Caribbean
South America
0
10
1975 1980 1985 1990 1995
million
Latin America
Caribbean
South America
Note: The subregion of central America has insufficient data to producetrend estimates.
Figure 9a: Trends in Latin America of prevalences of underweightchildren under five years of age, 1975-1995
Figure 9b: Trends in Latin America of numbers of underweightchildren under five years of age, 1975-1995

36
WHO/NUT/97.4
OceaniaAsia0
25
50
Africa Latin America Developing countries
%1990 1995 Year-2000 Goal
OceaniaAsia0
25
50
Africa Latin America Developing countries
%1990 1995 Year-2000 Goal
OceaniaAsia0
25
50
Africa Latin America Developing countries
%1990 1995 Year-2000 Goal
OceaniaAsia0
25
50
Africa Latin America Developing countries
%1990 1995 Year-2000 Goal
Figure 10a: Progress in achieving the year-2000 Goal to halve 1990levels of malnutrition prevalence: underweight
Figure 10b: Progress in achieving the year-2000 Goal to halve 1990levels of malnutrition prevalence: stunting

37
WHO Global Database on Child Growth and Malnutrition
Progress towards reducing malnutrition varies widely across countries.Trend information for those countries with multiple national surveydata are presented in Table 9 for underweight (62 countries) and Table10 for stunting (59 countries). In the fourth column of the tables, theoverall trend is presented as rising, static or falling. Some 26 countriesshow significant declines in malnutrition since the 1980s; they are mainlyin Latin America and south-central and south-east Asia. Malnutritionhas notably increased in 10 other countries, all in Africa. Given theimpact of population growth on the total number of malnourishedchildren, data for some of the 10 countries apparently showing no changeshould perhaps be interpreted as rising due to population growth. For16 countries no obvious trend can be derived from the availablenutritional survey data.
In summary, the importance of malnutrition cannot be overemphasized;it is a major determinant of human development because of its impacton child survival and poor physical and cognitive development. Anydebate about the precise extent of malnutrition is secondary to the urgentneed to do something meaningful about it; the numbers, whatever theyare exactly, are simply unacceptable. What actions should be takenand in what order, nevertheless remains fertile ground for discussion inview of the limited success of traditional nutrition education and foodsupplementation programmes.
Given the complexity of the malnutrition problem, new efforts must bemade to understand the specific economic, behavioural, dietary, andother factors affecting child growth and development. There is an urgentneed for developing and/or identifying effective community-basedinterventions for improving child growth and development. A goodtechnical package has proved to be insufficient by itself; a distinguishingfeature of successful programmes is community involvement inidentifying problems and in mobilizing action to resolve them. Futureinterventions designed to combat malnutrition should thus be stronglycommunity-based. Furthermore it is vital that these programmes includeappropriate monitoring and evaluation systems. Special effort shouldbe made to improve the situation of women—as primary childcaregivers—with particular attention to their health and nutritionthroughout the life cycle. Similarly, a focus on complementary feeding,combined with continued attention to the protection, promotion andsupport of breast-feeding, remains a key component for reducingmalnutrition. Finally, population-wide interventions aimed atpreventing intrauterine growth retardation are urgently required (23).

38
WHO/NUT/97.4
Table 6Trends based on regional estimates for 1990 and 1995 in prevalence andnumbers of underweight children (<-2 SD weight-for-age) and the Year-2000 Goal
UN regions and 1990 1995 Year-2000 Goal subregions % millionsa % millions %
Africa 26.0 28.7 28.4 34.7 13.0 Eastern Africa 31.7 11.5 33.0 13.3 15.8 Middle Africa NAb NAb 29.9 4.7 NAb
Northern Africa 14.2 3.0 15.5 3.3 7.1 Southern Africa NAb NAb 10.5 0.7 NAb
Western Africa 32.3 10.9 33.2 12.7 16.2
Asiac 37.2 141.6 35.0 127.2 18.6 Eastern Asia c 17.4 21.6 17.4 19.1 8.7 South-central Asia 53.4 95.4 49.3 86.0 26.7 South-eastern Asia 36.7 20.9 33.5 19.1 18.4 Western Asia NAb NAb 13.8 3.0 NAb
Latin America & Caribbean 11.4 6.2 9.5 5.2 5.7 Caribbean 16.7 0.6 13.7 0.5 8.4 Central America 17.3 2.7 15.1 2.4 8.7 South America 8.2 2.9 6.5 2.2 4.1
Oceania d 25.8 0.2 22.8 0.2 12.9 Developing countries 32.3 176.7 31.0 167.3 16.2 Global 28.5 177.6 27.4 167.9 14.3
a Total population under five years of age based on the World Population Prospects- The 1996 Revision.b NA = Not available (insufficient population coverage to derive estimates).c Excluding Japan.d Excluding Australia and New Zealand.

39
WHO Global Database on Child Growth and Malnutrition
Table 7Trends based on regional estimates for 1990 and 1995 in prevalenceand numbers of stunted children (<-2 SD height-for-age) and theYear-2000 Goal
UN regions and 1990 1995 Year-2000 Goal% millionsa % millions %
Africa 36.8 40.6 38.6 47.0 18.4 Eastern Africa 48.3 17.5 48.0 19.4 24.2 Middle Africa NAb NAb 40.2 6.3 NAb
Northern Africa 25.4 5.3 26.6 5.6 12.7 Southern Africa NAb NAb 23.7 1.6 NAb
Western Africa 36.8 12.4 37.1 14.2 18.4
Asiac 42.6 162.2 41.0 149.1 21.3 Eastern Asiac 31.4 39.1 31.4 34.5 15.7 South-central Asia 52.7 94.2 49.6 86.5 26.4 South-eastern Asia 40.8 23.2 39.7 22.6 20.4 Western Asia NAb NAb 24.9 5.5 NAb
Latin America & Caribbean 21.9 11.9 17.9 9.7 11.0 Caribbean 22.2 0.8 17.3 0.6 11.1 Central America 30.4 4.7 26.7 4.3 15.2 South America 18.1 6.4 13.8 4.7 9.1
Oceaniad 36.4 0.3 31.4 0.3 18.2 Developing countries 39.4 215.0 38.1 206.2 19.7 Global 34.6 216.0 34.0 208.1 17.3
a Total population under five years of age based on the World Population Prospects- The 1996 Revision.b NA = Not available (insufficient population coverage to derive estimates).c Excluding Japan.d Excluding Australia and New Zealand.
Table 8Recent trends in prevalence and absolute numbers of underweightchildren below 5 years of age by WHO regions.
Region Underweighta
1990 1995
Africa 30.1 (27.4)b 30.4 (31.2)
Americas 8.9 (6.7) 7.6 (5.8)
Eastern Mediterranean 27.4 (17.9) 24.9 (17.3)
South-east Asia 51.4 (89.0) 50.1 (82.7)
Western Pacific 20.4 (31.4) 20.6 (28.9)
All WHO regions 28.1 (174.9) 27.8 (169.5)
a Weight-for-age below -2 SD from the international reference median value.b Figures in parentheses are millions of children.

40
WHO/NUT/97.4
Table 9National country survey data on trends of underweight (<-2 SD weight-for-age) in children under five years of age
Country Year of survey % <-2 SD Trend Rateweight-for-age (pp/yr)
Algeria 1987, 1992, 1995 9.1, 9.2, 12.8 Rising +0.46
Bangladesh 1982-83, 1985-86, 68.0, 70.9, Rising, +0.971989-90, 1992, 1996-97 65.8, 68.3, 56.3 falling, -1.28
rising, +1.25falling -3.00
Bolivia 1981, 1988, 1989, 14.5, 11.2, 13.2, Falling, -0.381990, 1991, 1992, 11.1, 11.7, 12.0, rising +0.95
1993-94 14.9
Brazil 1975, 1989, 1996 18.4, 7.0, 5.7 Falling -0.60
Cameroon 1977-78, 1991 17.3, 15.1 Static -0.17
Cape Verde 1983, 1985 19.5, 18.8 Falling -0.35
Central African 1994-95, 1995 27.3, 23.2 Falling -4.10 Republic
Chile 1984, 1985, 1986, 1993, 2.1, 2.3, 2.5, 1.6, Static, -0.121994, 1995 0.9, 0.9 static 0.00
Colombia 1965-66, 1977-80, 21.1, 16.8, Falling -0.441986, 1989, 1995 12.0, 10.1, 8.4
Comoros 1991-92, 1995-96 18.5, 25.8 Rising +2.43
Costa Rica 1982, 1989, 1990, 1991, 6.0, 2.7, 2.8, 2.5, Falling -0.321992, 1993, 1994 2.3, 2.3, 2.2
Côte d’Ivoire 1986, 1994 12.4, 23.8 Rising +1.43
Dominican Republic 1986, 1991 12.4, 10.3 Falling -0.42
Egypt 1978, 1988, 1990, 15.9, 13.4, 10.4, Falling, -0.401992-93, 1994-95, 9.9, 16.8, 12.4 rising, +3.45
1995-96 falling -4.40
El Salvador 1988, 1993 15.2, 11.2 Falling -0.80
Ethiopia (rural) 1983, 1992 37.3, 47.7 Rising +1.16
Ghana 1987-88, 1988, 1993-94 27.1, 30.3, 27.3 Rising, +3.20falling -0.50
Guatemala 1987, 1995 33.2, 26.6 Falling -0.83
Guyana 1971, 1981, 1993 24.9, 22.1, 18.3 Static -0.30
Haiti 1978, 1990, 1994-95 37.4, 26.8, 27.5 Falling, -0.88static +0.14
Honduras 1987, 1991-92, 1993-94 20.6, 18.0, 18.3 Falling, -0.52static +0.15
India (rural) 1974-79, 1988-90, 71.3, 63.9, 61.0 Falling -0.791991-92
Indonesia 1987, 1995 39.9, 34.0 Falling -0.74

41
WHO Global Database on Child Growth and Malnutrition
Country Year of survey % <-2 SD Trend Rateweight-for-age (pp/yr)
Jamaica 1978, 1989, 1991, 1992, 9.3, 7.2, 4.6, 8.0, Falling, -0.361993 10.2 rising +2.80
Kenya 1993, 1994 22.6, 22.5 Static -0.10
Lao People’s 1993, 1994 44.0, 40.0 Falling -4.00Democratic Republic
Lesotho 1976, 1992, 1994 17.3, 15.8, 21.4 Static, -0.09rising +2.80
Madagascar 1983-84, 1992, 1993- 33.3, 40.9, 45.2, Rising, +1.1994, 1995 34.1 falling -11.10
Malawi 1981, 1992, 1995 23.9, 27.6, 29.9 Rising +0.43
Malaysia 1990, 1991, 1992, 25.0, 26.1, 25.6, Falling -0.981993, 1994, 1995 23.3, 22.4, 20.1
Mali 1987, 1995-96 30.6, 40.0 Rising +1.18
Mauritania 1990-91, 1995-96 47.6, 23.0 Falling -4.92
Mauritius 1985, 1995 23.9, 14.9 Falling -0.81
Mexico (rural) 1974, 1979, 1988, 1989 17.4, 21.9, 20.3, Rising, +0.9019.0 static -0.29
Morocco 1987, 1992 12.1, 9.5 Falling -0.52
Myanmar 1980-81, 1983-85, 46.5, 38.0, 32.4, Falling, -1.571990, 1991, 1994, 1995 36.7, 31.2, 42.9 rising, +4.30
falling, -1.83rising +11.7
Nepal 1975, 1995, 1996 69.1, 48.7, 46.9 Falling -1.06
Nicaragua 1980-82, 1993 10.0, 11.9 Static +0.17
Niger 1985, 1992 49.4, 42.6 Falling -0.97
Nigeria 1990, 1993 35.3, 39.1 Rising +1.27
Oman 1991, 1994-95 24.3, 14.1 Falling -2.55
Pakistan 1977, 1985-86, 1990- 52.8, 48.8, 40.2, Falling -0.8191, 1995 38.2
Panama 1980, 1992 15.8, 6.1 Falling -0.81
Peru 1975, 1984, 1991-92, 16.1, 13.4, 10.7, Static, -0.301996 7.8 falling -0.47
Philippines 1971-75, 1982, 1987, 49.9, 33.2, 32.9, Falling -1.131989-90, 1992, 1993 33.5, 33.4, 29.6
Rwanda 1976, 1992 27.9, 29.4 Static +0.09

42
WHO/NUT/97.4
Country Year of survey % <-2 SD Trend Rateweight-for-age (pp/yr)
Russian Federation 1993, 1995 4.2, 3.0 Falling -0.60
Senegal 1986, 1991-92, 1992-93 22.0, 21.6, 22.2 Static +0.03
Sierra Leone 1974-75, 1977-78, 28.2, 23.2, 26.8, Falling, -1.671989, 1990 28.7 rising +0.46
Solomon Islands 1970, 1989 21.1, 21.3 Static +0.01
Sri Lanka 1977-78, 1987, 1993 54.3, 37.3, 37.7 Falling, -1.89static +0.07
Togo 1976-77, 1988 26.1, 24.6 Static -0.14
Trinidad and Tobago 1976, 1987 16.3, 6.7 Falling -0.87
Tunisia 1973-75, 1988, 1994-95 20.2, 10.3, 9.0 Falling -0.56
Turkey 1993, 1995 10.4, 10.3 Static -0.05
Uganda 1988-89, 1995 23.0, 25.5 Rising +0.42
United Republic of 1991-92, 1996 28.9, 30.6 Rising +0.43 Tanzania
Uruguay 1987, 1992-93 7.4, 4.4 Falling -0.50
Venezuela 1981-82, 1987, 1990, 10.2, 4.5, 7.7, 6.2, Falling, -1.141991, 1992, 1993, 5.1, 4.6, 4.5 rising, +1.07
1994 falling -0.80
Viet Nam 1983-84, 1987-89, 1994 51.5, 45.0, 44.9 Falling, -1.30static -0.02
Zambia 1992, 1996-97 25.2, 23.5 Falling -0.43
Zimbabwe 1988, 1994 11.5, 15.5 Rising +0.67
Table 10National country survey data on trends of stunting (<-2 SD height-for-age) in children under five years of age
Country Year of survey % <-2 SD Trend Rateheight-for-age (pp/yr)
Algeria 1987, 1992, 1995 12.4, 18.1, 18.3 Rising, +1.14static +0.07
Bangladesh 1982-83, 1985-86, 67.7, 67.5, Falling, -0.441989-90, 1992, 1996-97 64.6, 64.2, 54.6 falling -1.43
Bolivia 1981, 1989, 1993-94 42.7, 37.7, 26.8 Falling, -1.60falling -2.18
Brazil 1975, 1989, 1996 32.0, 15.4, 10.5 Falling, -1.19falling -0.70
Cameroon 1977-78, 1991 35.6, 26.0 Falling -0.74
Cape Verde 1983, 1985 15.3, 25.8 Rising +5.25
Central African 1994-95, 1995 33.6, 28.4 Falling -5.20 Republic

43
WHO Global Database on Child Growth and Malnutrition
Country Year of survey % <-2 SD Trend Rateheight-for-age (pp/yr)
Chile 1984, 1985, 1986, 1993, 9.9, 9.5, 9.6, 6.6, Falling, -0.731994, 1995 2.6, 2.4 static -0.20
Colombia 1965-66, 1977-80, 31.9, 22.4, Falling, -0.791986, 1989, 1995 25.3, 16.6, 15.0 rising, +0.32
falling, -2.90static -0.26
Comoros 1991-92, 1995 33.0, 33.8 Static +0.27
Costa Rica (1st grade 1979, 1981, 1983, 20.4, 15.4, 12.7, Falling -1.12 schoolchildren) 1985, 1989 11.3, 9.2
Côte d’Ivoire 1986, 1994 17.2, 24.4 Rising +0.90
Dominican Republic 1986, 1991 20.6, 16.5 Falling -0.82
Egypt 1978, 1988, 1990, 37.7, 30.9, 30.0, Falling, -0.951992-93, 1994-95, 26.0, 21.6, 29.8 rising +8.20
1995-96
El Salvador 1988, 1993 29.9, 23.1 Falling -1.36
Ethiopia (rural) 1983, 1992 59.8, 64.2 Rising +0.49
Ghana 1987-88, 1988, 1993-94 30.5, 29.4, 25.9 Falling -0.77
Guatemala 1987, 1995 57.7, 49.7 Falling -1.00
Guyana 1971, 1981 23.7, 20.7 Static -0.30
Haiti 1978, 1990, 1994-95 39.6, 33.9, 31.9 Falling -0.45
Honduras 1987, 1991-92, 1993-94 37.2, 36.3, 39.6 Static, -0.18rising +1.65
India (rural) 1974-79, 1988-90, 72.3, 62.1, 61.2 Falling -0.851991-92
Jamaica 1978, 1989, 1991, 12.1, 8.7, 6.2, Falling, -0.451992, 1993 10.6, 9.6 rising, +4.40
falling -1.00
Kenya 1978-79, 1993, 1994 35.4, 33.3, 33.6 Static -0.12
Lao People’s 1993, 1994 48.0, 47.3 Falling -0.70Democratic Republic
Lesotho 1976, 1992, 1994 41.4, 33.0, 32.9 Falling, -0.53static -0.05
Madagascar 1983-84, 1992, 33.8, 54.1, Rising, +2.541993-94, 1995 48.6, 49.8 falling, -2.75
rising +0.60
Malawi 1981, 1992, 1995 56.4, 49.2, 48.3 Falling, -0.65static -0.30
Mali 1987, 1995-96 23.8, 30.1 Rising +0.70
Mauritania 1988, 1990-91, 1995-96 34.0, 56.9, 44.0 Rising, +7.63falling -2.58

44
WHO/NUT/97.4
Country Year of survey % <-2 SD Trend Rateheight-for-age (pp/yr)
Mauritius 1985, 1995 21.5, 9.7 Falling -1.18
Mexico (rural) 1974, 1979, 1988, 42.6, 26.7, 36.4, Falling, -3.181989 35.1 rising, +1.08
falling -1.30
Morocco 1987, 1992 24.9, 24.2 Static -0.14
Myanmar 1980-81, 1983-85, 48.0, 49.7, 40.0, Rising, +0.431991, 1994 44.6 falling, -1.62
rising +1.53
Nepal 1975, 1995, 1996 69.4, 63.5, 48.8 Falling -0.98
Nicaragua 1980-82, 1993 21.7, 23.7 Static +0.18
Niger 1985, 1992 37.7, 39.5 Static +0.26
Nigeria 1990, 1993 42.7, 39.0 Falling -1.23
Oman 1991, 1994-95 20.7, 15.7 Falling -1.25
Pakistan 1977, 1985-87, 1990-91, 67.0, 57.9, 49.6 Falling -1.24
Panama 1980, 1992 22.0, 9.9 Falling -1.01
Peru 1975, 1984, 1991-92, 39.7, 37.8, 31.8, Falling -0.661996 25.8
Philippines 1971-75, 1982, 1987, 55.3, 42.8, 38.6, Falling -1.261989-90, 1992, 1993 37.2, 34.7, 32.7
Rwanda 1976, 1992 36.6, 48.7 Rising +0.76
Russian Federation 1993, 1995 17.0, 12.7 Falling -2.15
Senegal 1986, 1991-92, 1992-93 23.0, 29.1, 24.7 Rising, +1.02falling -4.40
Sierra Leone 1974-75, 1977-78, 34.1, 42.8, Rising, +2.901989, 1990 35.2, 34.7 falling -0.69
Solomon Islands 1970, 1989 25.7, 27.3 Static +0.08
Sri Lanka 1975-76, 1977-78, 49.9, 44.6, Falling -1.541980-82, 1987, 1993 36.2, 27.2, 23.8
Togo 1976-77, 1988 33.7, 33.6 Static -0.01
Trinidad and Tobago 1976, 1987 12.4, 4.8 Falling -0.69
Tunisia 1973-75, 1988, 1994-95 39.5, 17.9, 22.5 Falling, -1.66rising +0.66
Uganda 1988-89, 1995 44.4, 38.3 Falling -1.02
United Republic of 1991-92, 1996 43.2, 43.4 Static +0.20 Tanzania
Uruguay 1987, 1992-93 15.9, 9.5 Falling -1.07
Venezuela 1981-82, 1987, 1990, 6.4, 4.6, 13.8, Falling, -0.361991, 1992, 1993, 1994 13.5, 13.6, 12.8, rising, +3.07
13.2 static -0.15

45
WHO Global Database on Child Growth and Malnutrition
5 Methods and standardized datapresentation
The information included in the WHO Global Database on ChildGrowth and Malnutrition complies with the following standardizedformat:
n systematic use of the NCHS/WHO international referencepopulation (25);
n display of growth retardation prevalence for under-5-year-olds, asmeasured by the proportion of weight-for-age, height-for-age andweight-for-height below -2 and -3 standard deviations (SDs) (Z-scores);
n display of the prevalence of overweight, as measured by theproportion of children with weight-for-height above +2 Z-scores;
n display of Z-score means and SDs for the three indices; andn stratification of the results according to age, sex, region, and rural/
urban strata.
The required criteria for entering surveys in the database are:
n A clearly defined population-based sampling frame, permittinginferences to be drawn about an entire population;
n A probabilistic sampling procedure involving at least 400 children(allowing for an estimation of prevalence with a random error of5% at a confidence level of 95%);
n Use of appropriate equipment and standard measurement techniques(25);
n Presentation of results as Z-scores in relation to the NCHS/WHOreference population.
For those surveys where results are presented using a differentclassification system, reference population, or prevalence cut-offs, theprincipal investigators are contacted and encouraged to re-analyze theirdata sets following WHO standardized presentation or, otherwise, toprovide the raw data to the WHO Programme of Nutrition for re-analysis.Survey results are systematically checked for inconsistencies and theseare brought to the attention of the investigators, with a request forclarification. A hard copy of the survey documentation, together withany corrigendum or additional item of information received from the
Country Year of survey % <-2 SD Trend Rateheight-for-age (pp/yr)
Viet Nam 1983-84, 1987-89, 1994 59.7, 56.5, 46.9 Falling -1.28
Zambia 1992, 1996-97 39.8, 42.4 Rising +0.65
Zimbabwe 1988, 1994 29.0, 21.4 Falling -1.27

46
WHO/NUT/97.4
authors is filed under the survey reference number. The aim is to keepthe database as fully documented and comprehensive as possible, so thatqueries concerning compiled data can be answered quickly.
5.1 Child growth indicators and their interpretation
In children the three most commonly used anthropometric indices toassess their growth status are weight-for-height, height-for-age andweight-for-age. These anthropometric indices can be interpreted asfollows:
Low weight-for-height: Wasting or thinness indicates in most cases arecent and severe process of weight loss, which is often associated withacute starvation and/or severe disease. However, wasting may also bethe result of a chronic unfavourable condition. Provided there is nosevere food shortage, the prevalence of wasting is usually below 5%,even in poor countries. The Indian subcontinent, where higherprevalences are found, is an important exception. A prevalenceexceeding 5% is alarming given a parallel increase in mortality thatsoon becomes apparent (7). On the severity index, prevalences between10-14% are regarded as serious, and above or equal 15% as critical.Typically, the prevalence of low weight-for-height shows a peak in thesecond year of life. Lack of evidence of wasting in a population doesnot imply the absence of current nutritional problems: stunting andother deficits may be present (26).
High weight-for-height: «Overweight» is a preferred term for describinghigh weight-for-height. Even though there is a strong correlationbetween high weight-for-height and obesity as measured by adiposity,greater lean body mass can also contribute to high weight-for-height.On an individual basis, therefore, «fatness» or «obesity» should not beused to describe high weight-for-height. However, on a population-wide basis, high weight-for-height can be considered as an adequateindicator of obesity, because the majority of individuals with high weight-for-height are obese. Strictly speaking, the term obesity should be usedonly in the context of adiposity measurements, for example skinfoldthickness.
Low height-for-age: Stunted growth reflects a process of failure to reachlinear growth potential as a result of suboptimal health and/or nutritionalconditions. On a population basis, high levels of stunting are associatedwith poor socioeconomic conditions and increased risk of frequent andearly exposure to adverse conditions such as illness and/or inappropriatefeeding practices. Similarly, a decrease in the national stunting rate isusually indicative of improvements in overall socioeconomic conditionsof a country. The worldwide variation of the prevalence of low height-for-age is considerable, ranging from 5% to 65% among the less developedcountries (24). In many such settings, prevalence starts to rise at theage of about three months; the process of stunting slows down at aroundthree years of age, after which mean heights run parallel to the reference.Therefore, the age of the child modifies the interpretation of the findings:for children in the age group below 2-3 years, low height-for-age probably
47
WHO Global Database on Child Growth and Malnutrition
reflects a continuing process of “failing to grow” or “stunting”; for olderchildren, it reflects a state of “having failed to grow” or “being stunted”.It is important to distinguish between the two related terms, length andstature: length refers to the measurement in recumbent position, therecommended way to measure children below 2 years of age or less than85 cm; whereas stature refers to standing height measurement. Forsimplification, the term height is used all throughout the database tocover both measurements.
Low weight-for-age: Weight-for-age reflects body mass relative tochronological age. It is influenced by both the height of the child(height-for-age) and his or her weight (weight-for-height), and itscomposite nature makes interpretation complex. For example, weight-for-age fails to distinguish between short children of adequate bodyweight and tall, thin children. However, in the absence of significantwasting in a community, similar information is provided by weight-for-age and height-for-age, in that both reflect the long-term health andnutritional experience of the individual or population. Short-termchange, especially reduction in weight-for-age, reveals change in weight-for-height. In general terms, the worldwide variation of low weight-for-age and its age distribution are similar to those of low height-for-age.
5.2 The international reference population
The designation of a child as having impaired growth implies some meansof comparison with a «reference» child of the same age and sex. Thus,in practical terms, anthropometric values need to be compared acrossindividuals or populations in relation to an acceptable set of referencevalues. This need has made the choice of a growth reference populationan important issue that has received considerable attention in the lastdecades (1).
The database uses as a basis for comparison across countries the NationalCenter for Health Statistics (NCHS) growth reference, the so-calledNCHS/WHO international reference population. The internationalreference growth curves were formulated in the 1970s by combininggrowth data from two distinct data sets, which were originally plannedto serve as a reference for the USA. The reference for ages 0 to 23months is based on a group of children in the Ohio Fels Research InstituteLongitudinal Study which was conducted from 1929 to 1975. The heightcurves for this part of the reference are based on recumbent lengthmeasurements. The reference from 2 to 18 years of age is based on dataof three cross-sectional USA representative surveys conducted between1960 and 1975. The height curves for this part of the reference arebased on standing height measurements. All samples consisted of healthywell-nourished US children. A detailed account of the historicalbackground of the NCHS/WHO growth charts can be found elsewhere(1, 27).
The World Health Organization adopted the reference curves of theNCHS for international use in the late 1970s (28) based on the then

48
WHO/NUT/97.4
growing evidence that the growth patterns of well-fed, healthy preschoolchildren from diverse ethnic backgrounds are very similar (29).Differences of genetic origin are evident for some comparisons; however,these variations are relatively minor compared with the large worldwidevariation in growth related to health and nutrition (30).
The adoption by WHO of the NCHS-based growth curves resulted intheir wide international dissemination. Throughout the 1980s, severalmicrocomputer-based software versions of the NCHS/WHOinternational growth reference were developed and supported by CDCand WHO (27). These software-based references have contributed tothe wide acceptance of the concept of the international growth referencebecause they simplified the handling of anthropometric data fromsurveys, surveillance, and clinical studies.
Although the NCHS/WHO international growth curves have servedmany useful purposes throughout these years, because of a number ofserious drawbacks, the suitability of these curves for internationalpurposes has recently been challenged (1,31). Work supported by WHOhas demonstrated that the current international reference is sufficientlyflawed as to interfere with the sound health and nutritional managementof infants and young children. These flaws arise from both technicaland biological considerations. In particular, the current reference maylead to the early introduction of complementary foods in exclusivelybreast-fed infants, which often has adverse consequences for the healthand nutritional well-being of infants (32,33). As a result, aninternational effort is currently underway to develop a new internationalgrowth reference (34). Until the new reference is developed, the NCHS/WHO growth reference curves will remain the reference valuesrecommended for international use.
General issues that need to be considered when using internationalreference values are discussed elsewhere (31). One essentialconsideration is the appropriate use of the reference data. The way inwhich a reference is interpreted and the clinical and public healthdecisions that will be based upon it are often more important than thechoice of reference. The reference should be used as a general guide forscreening and monitoring and not as a fixed standard that can be appliedin a rigid fashion to individuals from different ethnic, socioeconomic,and nutritional and health backgrounds. For clinical or individual-basedapplication, reference values should be used as a screening tool to detectindividuals at greater risk of health or nutritional disorders; and theyshould not be viewed as a self-sufficient diagnostic tool. For population-based application, the reference values should be used for comparisonand monitoring purposes. In a given population, a high prevalence ofanthropometric deficit will be indicative of significant health andnutritional problems, however, it is not only those individuals belowthe cut-off point who are at risk; the entire population is at risk, and thecut-off point should be used only to facilitate the application of theindicator.

49
WHO Global Database on Child Growth and Malnutrition
5.3 The Z-score or standard deviation classification system
There are three different systems by which a child or a group of childrencan be compared to the reference population: Z-scores (standarddeviation scores), percentiles, and percent of median. For population-based assessment—including surveys and nutritional surveillance—theZ-score is widely recognized as the best system for analysis andpresentation of anthropometric data because of its advantages comparedto the other methods (1). At the individual level, however, althoughthere is substantial recognition that Z-score is the most appropriatedescriptor of malnutrition, health and nutrition centers (e.g.supplementary feeding programmes in refugee camps) have been inpractice reluctant to adopt its use for individual assessment. A detaileddescription of the three systems, including a discussion of their strengthsand weaknesses, can be found elsewhere (1,35).
In this database, weight-for-height, height-for-age and weight-for-ageare interpreted by using the Z-score classification system. The Z-scoresystem expresses the anthropometric value as a number of standarddeviations or Z-scores below or above the reference mean or medianvalue. A fixed Z-score interval implies a fixed height or weight differencefor children of a given age. For population-based uses, a major advantageis that a group of Z-scores can be subjected to summary statistics such asthe mean and standard deviation (see section 5.4). The formula forcalculating the Z-score is (1):
Z-score (or SD-score) = observed value - median value of the reference population standard deviation value of reference population
Interpreting the results in terms of Z-scores has several advantages:
(1) The Z-score scale is linear and therefore a fixed interval of Z-scoreshas a fixed height difference in cm, or weight difference in kg, forall children of the same age. For example, on the height-for-agedistribution for a 36-month-old boy, the distance from a Z-score of-2 to a Z-score of -1 is 3.8 cm. The same difference is found betweena Z-score of 0 and a Z-score of +1 on the same distribution. In otherwords, Z-scores have the same statistical relation to the distributionof the reference around the mean at all ages, which makes resultscomparable across ages groups and indicators.
(2) Z-scores are also sex-independent, thus permitting the evaluationof children’s growth status by combining sex and age groups.
(3) These characteristics of Z-scores allow further computation ofsummary statistics such as means, standard deviations, and standarderror to classify a population’s growth status.

50
WHO/NUT/97.4
5.4 Cut-off points and summary statistics
For population-based assessment, there are two ways of expressing childgrowth survey results using Z-scores. One is the commonly used cut-off-based prevalence; the other includes the summary statistics of theZ-scores: mean, standard deviation, standard error, and frequencydistribution.
Prevalence-based reporting:For consistency with clinical screening, prevalence-based data arecommonly reported using a cut-off value, often <-2 and >+2 Z-scores.The rationale for this is the statistical definition of the central 95% of adistribution as the “normal” range, which is not necessarily based onthe optimal point for predicting functional outcomes.
The WHO Global Database on Child Growth and Malnutrition uses aZ-score cut-off point of <-2 SD to classify low weight-for-age, low height-for-age and low weight-for-height as moderate and severe undernutrition,and <-3 SD to define severe undernutrition. The cut-off point of >+2SD classifies high weight-for-height as overweight in children.
The use of -2 Z-scores as a cut-off implies that 2.3% of the referencepopulation will be classified as malnourished even if they are truly“healthy” individuals with no growth impairment. Hence, 2.3% can beregarded as the baseline or expected prevalence. To be precise thereported values in the surveys would need to subtract this baseline valuein order to calculate the prevalence above normal. It is important tonote, however, that the 2.3% figure is customarily not subtracted fromthe observed value. In reporting underweight and stunting rates this isnot a serious problem because prevalences in deprived populations areusually much higher than 2.3%. However, for wasting, with much lowerprevalence levels, not subtracting this baseline level undoubtedly affectsthe interpretation of findings.
Summary statistics of the Z-scores:A major advantage of the Z-score system is that a group of Z-scores canbe subjected to summary statistics such as the mean and standarddeviation. The mean Z-score, though less commonly used, has theadvantage of describing the nutritional status of the entire populationdirectly without resorting to a subset of individuals below a set cut-off.A mean Z-score significantly lower than zero—the expected value forthe reference distribution—usually means that the entire distributionhas shifted downward, suggesting that most, if not all, individuals havebeen affected. Using the mean Z-score as an index of severity for healthand nutrition problems results in increased awareness that, if a conditionis severe, an intervention is required for the entire community, not justthose who are classified as “malnourished” by the cut-off criteria (36).
The observed SD value of the Z-score distribution is very useful forassessing data quality. With accurate age assessment and anthropometric

51
WHO Global Database on Child Growth and Malnutrition
measurements, the SD of the observed height-for-age, weight-for-age,and weight-for-height Z-score distributions should be relatively constantand close to the expected value of 1.0 for the reference distribution.An SD that is significantly lower than 0.9 describes a distribution thatis more homogenous, or one that has a narrower spread, compared tothe distribution of the reference population. If the surveyed standarddeviation of the Z-score ranges between 1.1 and 1.2, the distribution ofthe sample has a wider spread than the reference. Any standard deviationof the Z-scores above 1.3 suggests inaccurate data due to measurementerror or incorrect age reporting. The expected ranges of standarddeviations of the Z-score distributions for the three anthropometricindicators are as follows (1):
n height-for-age Z-score: 1.10 to 1.30
n weight-for-age Z-score: 1.00 to 1.20
n weight-for-height Z-score: 0.85 to 1.10
Available means and SDs of Z-scores of survey data are included in theGlobal Database. However, as this has been possible only for a numberof surveys, these summary statistics do not appear in the printouts thatfollow in section 9. Given the importance of the mean and SD of Z-scores, it is hoped that an increasing number of survey reports will includethem in the future.
‘Trigger-levels’ as a basis of public health decisionsExperience with surveillance has contributed to emphasizing theusefulness of identifying prevalence ranges to assess the severity of asituation as the basis for making public health decisions. For example,when 10% of a population is below the -2SD cut-off for weight-for-height, is that too much, too little, or average? The intention of the so-called ‘trigger-levels’ is to assist in answering this question by givingsome kind of guideline for the purpose of establishing levels of publichealth importance of a situation. Such classifications are very helpfulfor summarizing prevalence data and can be used for targeting purposeswhen establishing intervention priorities.
The prevalence ranges shown in Table 11 are those currently used byWHO to classify levels of stunting, underweight, and wasting. It shouldbe borne in mind, however, that this classification is largely arbitraryand simply reflects a convenient statistical grouping of prevalence levelsworldwide. Moreover, the designations of a prevalence as “low” or“medium” should be interpreted cautiously and not be taken as groundsfor complacency. Since only 2.3% of the children in a well-nourishedpopulation would be expected to fall below the cut-off, the “low” weight-for-age group, for example, includes communities with up to four timesthat expected prevalence, and the “medium” group communities withup to an eightfold excess.

52
WHO/NUT/97.4
Table 11Classification for assessing severity of malnutrition by prevalence rangesamong children under 5 years of age
Indicator Severity of malnutrition by prevalence ranges (%)
Low Medium High Very high
Stunting <20 20-29 30-39 ž40
Underweight <10 10-19 20-29 ž30
Wasting < 5 5-9 10-14 ž15
From reference (1)
6 How to read the database printouts
The country printouts, i.e. data and references, of the WHO GlobalDatabase on Child Growth and Malnutrition are found on pages 67 to710.
6.1 Data
The data printouts are structured in tabular form (see Figure 11) with atop row bearing the name of the country and 11 columns containingthe following information:
Column 1 Administrative level. Country data are specifiedas national, regional, province, district or local,depending on where the survey took place and forwhich administrative level it is representative:
National: A nationally representative sample.
Regional: The survey covers several sub-national levels.
Province: The survey was performed in aprovince or state (name presentedin the Notes column).
District: The survey is representative of adistrict (name presented in theNotes column).
Local: A community, a village or a townwas surveyed (name presented in theNotes column).
Column 2 Dates of survey. This column gives the monthand year during which the survey took place.
Column 3 Area. URBAN and RURAL specify the setting.If no specification is given, data refer to both urbanand rural areas.

53
WHO Global Database on Child Growth and Malnutrition
Column 4 Sex. Male is signified as M and female as F. If nospecification is given, data refer to both sexes.
Column 5 Age group (years). Every data entry refers to aspecific age group, specified in years using thedecimal system, i.e. the month ranges have beentransformed into the decimal system and arepresented in years with two decimals. Thefollowing age groups appear in the printouts:
0. -4.99 years meaning 0-59 completed months;0.00-0.49 years meaning 0-5 completed months;0.50-0.99 years meaning 6-11 completed months;0.00-0.99 years meaning 0-11 completed months;1 year meaning 12-23 completed months;2 years meaning 24-35 completed months;3 years meaning 36-47 completed months;4 years meaning 48-59 completed months;5 years meaning 60-71 completed months.Several survey reports contain also smaller agegroup breakdowns, e.g.:0.00-0.24 years meaning 0-2 completed months;0.25-0.49 years meaning 3-5 completed months.
Column 6 Sample size. This column contains the sample sizesfor all disaggregations of the data presented.
Column 7 Percentage below/above the median: WEIGHT/HEIGHT. Prevalence for the cut-offs below -3 SD,below -2 SD (including the % below -3 SD) andabove +2 SD are presented. Prevalence data forthe three nutritional indicators are presented aspercentages with one decimal.
Column 8 Percentage below the median: HEIGHT/AGE.Prevalence for the cut-offs below -3 SD and below-2 SD (including the % below -3 SD) are presented.
Column 9 Percentage below the median: WEIGHT/AGE.Prevalence for the cut-offs below -3 SD and below-2 SD (including the % below -3 SD) are presented.
Column 10 Notes. Any additional information or clarificationof the data are presented.
Column 11 Ref.No. Which stands for reference number, isused to identify data sources (see section 6.2), whichare listed in the reference sections following eachcountry’s data printout.
54
WHO/NUT/97.4
Figure 11 Tabular form of data printouts

55
WHO Global Database on Child Growth and Malnutrition
6.2 References
Data are derived from a variety of sources, e.g. published articles in thescientific press, government health statistics, and survey reports frominternational and nongovernmental organizations. To complement thescarce nutritional information from some countries data from nationalsurveillance systems, e.g. Chile, Uruguay and Zimbabwe, are alsoincluded. For a few countries, e.g. Ecuador and South Africa, heightcensuses of school children have been included because little other dataare available to describe the child growth status. When the data sourceis either a surveillance system or a height census, this is stated in theNOTES column of the data printout.
Data references follow immediately after the data printout, providingthe user with the necessary information to easily trace data sources.Within each country’s reference printout there are two separate sections:1) «data references», i.e. those related to the data included in the dataprintout, and 2) «additional references», i.e. those that providesupplementary information about status of child growth in the country.These «additional references» contain nutritional data that do not fulfilthe database entry criteria but which might, nevertheless, providerelevant information for interested researchers.
Finally, whenever survey data have been reanalysed, either by responsiblenational authorities or by WHO, this is clearly indicated in the referencesection by the words «and additional analysis».

56
WHO/NUT/97.4
7 Bibliography
(1) Physical status: the use and interpretation of anthropometry. Report ofa WHO Expert Committee. WHO Technical Report Series No.854. Geneva: World Health Organization, 1995.
(2) Tomkins A and Watson F. Malnutrition and infection: a review.ACC/SCN State-of-the-Art Series, Nutrition Policy DiscussionPaper No. 5. Geneva: Administrative Committee onCoordination/Subcommittee on Nutrition, 1989.
(3) Lutter CK, Mora JO, Habicht JP et al. Nutrition supplementation:effects on child stunting because of diarrhea. American Journal ofClinical Nutrition 1989;50:1-8.
(4) Victora CG, Barros FC, Kirkwood BR, Vaughan JP. Pneumonia,diarrhea and growth in the first four years of life. A longitudinalstudy of 5,914 Brazilian infants. American Journal of ClinicalNutrition 1990;52:391-396.
(5) Briend A. Is diarrhoea a major cause of malnutrition among theunder-fives in developing countries? A review of availableevidence. European Journal of Clinical Nutrition 1990;44:611-628.
(6) Victora CG, Fuchs SC, Flores A, Fonseca W, Kirkwood BR. Riskfactors for pneumonia in a Brazilian metropolitan area. Pediatrics1994;93(6 Pt 1);977-985.
(7) Toole MJ, Malkki RM. Famine-affected refugee and displacedpopulations: Recommendations for public health issues. Morbidityand Mortality Weekly Report 1992;41:1-25.
(8) Pelletier D. Relationships between child anthropometry and mortalityin developing countries. Monograph 12, Cornell Food and NutritionPolicy Program. Ithaca: Cornell University Press, 1991.
(9) Pelletier D, Frongillo JrA, Habicht JP. Epidemiologic evidencefor a potentiating effect of malnutrition on child mortality.American Journal of Public Health 1993;83:1130-1133.
(10) Bailey K, de Onis M, Blössner M. Protein-energy malnutrition. In:Murray CJL, Lopez AD, eds. Malnutrition and the Burden ofDisease: the global epidemiology of protein-energy malnutrition,anemias and vitamin deficiencies. Vol 8. The Global Burden ofDisease and Injury Series. Cambridge, MA: Harvard UniversityPress, 1998 (in press).
(11) Pollitt E, Gorman KS, Engle PL, Martorell R, Rivera J. Earlysupplementary feeding and cognition. Monographs of the Societyfor Research in Child Development 1993;58:1-99.

57
WHO Global Database on Child Growth and Malnutrition
(12) McGuire JS, Austin JE. Beyond survival: children’s growth fornational development. Assignment Children 1987;2:3-52.
(13) Martorell R, Rivera J, Kaplowitz H, Pollitt E. Long-termconsequences of growth retardation during early childhood. In:Hernandez M, Argente J, eds. Human Growth: Basic and clinicalaspects. Amsterdam: Elsevier Science Publishers B.V., 1992143-149.
(14) Grantham-McGregor SM, Powell CA, Walker SP, Himes JH.Nutritional supplementation, psychosocial stimulation, andmental development of stunted children: the Jamaican study.Lancet 1991;338:1-5.
(15) Spurr GB, Barac-Nieto M, Maksud MG. Productivity and maximaloxygen consumption in sugar cane cutters. American Journal ofClinical Nutrition 1977;30:316-321.
(16) Kramer MS. Determinants of low birth weight: methodologicalassessment and meta-analysis. Bulletin of the World HealthOrganization 1987;65:663-737.
(17) Klebanoff MA, Yip R. Influence of maternal birth weight on rateof fetal growth and duration of gestation. Journal of Pediatrics1987;111:287-292.
(18) Binkin NJ, Yip R, Fleshood L, Trowbridge FL. Birthweight andchildhood growth. Pediatrics 1988;82:828-834.
(19) Nieto FJ, Szklo M, Comstock GW. Childhood weight and growthrate as predictors of adult mortality. American Journal ofEpidemiology 1992;136:201-213.
(20) Mossberg HO. 40-year follow-up of overweight children. Lancet1989;2:491-493.
(21) Abraham S, Collins G, Nordsieck M. Relationship of childhoodweight status to morbidity in adults. HSMHA Health Reports1971;86:273-284.
(22) Martorell R. Promoting Healthy Growth: Rationale and Benefits. In:Pinstrup-Andersen P, Pelletier D, Alderman H, eds. Child Growthand Nutrition in Developing Countries.- Priorities for Action.Ithaca: Cornell University Press, 1995;15-31.
(23) de Onis M, Blössner M, Villar J. Levels and patterns of intrauterinegrowth retardation in developing countries. European Journal ofClinical Nutrition 1997; 52: S1,5-15.
(24) de Onis M, Monteiro C, Akré J, Clugston G. The worldwidemagnitude of protein-energy malnutrition: an overview from the

58
WHO/NUT/97.4
WHO Global Database on child growth. Bulletin of the WorldHealth Organization 1993;71:703-712.
(25) Measuring change in nutritional status. Geneva: World HealthOrganization, 1983.
(26) Victora CG. The association between wasting and stunting: aninternational perspective. Journal of Nutrition 1992;122:1105-1110.
(27) de Onis M, Yip R. The WHO growth chart: historicalconsiderations and current scientific issues. Bibliotheca Nutritio etDieta 1996;53:74-89.
(28) Waterlow JC, Buzina R, Keller W, Lane JM, Nichaman MZ, TannerJM. The presentation and use of height and weight data forcomparing nutritional status of groups of children under the ageof 10 years. Bulletin of the World Health Organization 1977;55:489-98.
(29) Habicht JP, Martorell R, Yarbrough C, Malina RM, Klein RE.Height and weight standards for preschool children; how relevantare ethnic differences in growth potential. Lancet 1974;1:611-615.
(30) Martorell R. Child growth retardation: a discussion of its causes andits relationship to health. In: Blaxter KL, Waterlow JC, eds.Nutritional adaptation in man. London: John Libbey, 1985:13-30.
(31) de Onis M, Habicht JP. Anthropometric reference data forinternational use: recommendations from a World HealthOrganization Expert Committee. American Journal of ClinicalNutrition 1996;64:650-658.
(32) WHO Working group on infant growth. An evaluation of infantgrowth: the use and interpretation of anthropometry in infants.Bulletin of the World Health Organization 1995; 73:165-174.
(33) WHO Working group on infant growth. An evaluation of infantgrowth. Geneva: World Health Organization, 1994.
(34) de Onis M, Garza C, Habicht JP. Time for a new growth reference.Pediatrics 1997; 100 (5). URL: http://www.pediatrics.org/cgi/content/full/100/5/e8;
(35) Gorstein J, Sullivan K, Yip R, de Onis M, Trowbridge F, Fajans Pet al. Issues in the assessment of nutritional status usinganthropometry. Bulletin of the World Health Organization1994;72:273-283.
(36) Yip R, Scalon K. The burden of malnutrition: a populationperspective. Journal of Nutrition 1994;124:2043S-2046S.

59
WHO Global Database on Child Growth and Malnutrition
Further recommended reading:
n ACC/SCN. Appropriate uses of anthropometric indices in children.ACC/SCN State-of-the-Art Series, Nutrition Policy DiscussionPaper No. 7. Geneva: Administrative Committee on Coordination/Subcommittee on Nutrition, 1990.
n ACC/SCN. Second Report on the World Nutrition Situation. Vol. I.Geneva: Administrative Committee on Coordination/Subcommittee on Nutrition, 1992.
n ACC/SCN. How Nutrition Improves. ACC/SCN State-of-the-ArtSeries, Nutrition Policy Discussion Paper No. 15. Geneva:Administrative Committee on Coordination/ Subcommittee onNutrition, 1996.
n de Onis M, Yip R, Mei Z. The development of MUAC-for-agereference data recommended by a WHO Expert Committee. Bulletinof the World Health Organization 1997;75:11-18.
n Dibley MJ, Goldsby JB, Staehling NW, Trowbridge FL. Developmentof normalized curves for international growth reference historicaland technical considerations. American Journal of Clinical Nutrition1987;46:736-748.
n Dibley MJ, Staehling N, Nieburg P, Trowbridge FL. Interpretationof Z-score anthropometric indicators derived from the internationalgrowth reference. American Journal of Clinical Nutrition 1987;46:749-762.
n Eveleth BP and Tanner JM. Worldwide variation in human growth.Cambridge: Cambridge University Press, 1990.
n FAO/WHO. World Declaration and Plan of Action for Nutrition.International Conference on Nutrition, Rome, December, 1992.
n FAO. The Sixth World Food Survey. Rome: Food and AgricultureOrganization, 1996.
n Gorstein J. Assessment of nutritional status: effects of differentmethods to determine age on the classification of undernutrition.Bulletin of the World Health Organization 1989;67:143-150.
n Mei Z, Grummer-Strawn LM, de Onis M, Yip R. The developmentof a MUAC-for-height reference, inlcuding a comparison to othernutritional status screening indicators. Bulletin of the World HealthOrganization 1997;75:333-342.
n Pinstrup-Andersen P, Pelletier D and Alderman H, eds. Child Growthand Nutrition in Developing Countries. -Priorities for Action. Ithaca:Cornell University Press, 1995.

60
WHO/NUT/97.4
n UNDP. Human Development Report 1996. New York: OxfordUniversity Press, 1996.
n Van den Broeck J, Meulemanns W, Eeckels R. Nutritionalassessment: the problem of clinical-anthropometrical mismatch.European Journal of Clinical Nutrition 1994;48:60-65.
n Waterlow JC. Protein Energy Malnutrition. London: Edward Arnold,1992.
n The Growth Chart.- A tool for use in infant and child health care.Geneva: World Health Organization, 1986.
n WHO Working Group. Use and interpretation of anthropometricindicators of nutritional status. Bulletin of the World HealthOrganization 1986;64:929-941.
n WHO. Management of severe malnutrition. A manual for physiciansand other senior health workers. Geneva: World Health Organization,1998.
n WHO. Integrated management of childhood illness. Document WHO/CHD/95.14.A-K. Geneva: World Health Organization, 1995.
n Yip R. Expanded usage of anthropometry Z-scores for assessing populationnutritional status and data quality. Abstract of the 15th InternationalCongress of Nutrition; 1993 Sep 26-Oct 1; Adelaide: Smith Gordon,1993;297.

61
WHO Global Database on Child Growth and Malnutrition
8 List of countries
8.1 UN regions and subregions
AfricaEastern Africa Middle Africa Northern Africa Southern Africa Western Africa
Burundi Angola Algeria Botswana BeninComoros Cameroon Egypt Lesotho Burkina FasoDjibouti Central African Libyan Arab Namibia Cape VerdeEritrea Republic Jamahiriya South Africa Côte d’IvoireEthiopia Chad Morocco Swaziland GambiaKenya Congo Sudan GhanaMadagascar Democratic Tunisia GuineaMalawi Republic of Western Sahara ‡ Guinea-BissauMauritius the Congo LiberiaMozambique Equatorial Guinea MaliRéunion (F) Gabon MauritaniaRwanda Sao Tome and NigerSeychelles Principe NigeriaSomalia St Helena (UK)Uganda SenegalUnited Republic Sierra Leone of Tanzania TogoZambiaZimbabwe
AsiaEastern Asia South-central South-eastern Western Asia
Asia AsiaChina Afghanistan Brunei Armenia Syrian ArabDemocratic Bangladesh Darussalam Azerbaijan Republic People’s Bhutan Cambodia Bahrain Turkey Republic India East Timor Cyprus United Arab of Korea Iran (Islamic Indonesia Georgia EmiratesJapan Republic of) Lao People’s Iraq YemenMacau† Kazakstan Democratic IsraelMongolia Kyrgyzstan Republic JordanRepublic of Maldives Malaysia Kuwait Korea Nepal Myanmar Lebanon
Pakistan Philippines OmanSri Lanka Singapore Palestinian self-Tajikistan Thailand rule areasTurkmenistan Viet Nam QatarUzbekistan Saudi Arabia
EuropeEastern Europe Northern Europe Southern Europe Western Europe
Belarus Channel Albania AustriaBulgaria Islands (UK) Andorra BelgiumCzech Republic Denmark Bosnia and FranceHungary Estonia Herzegovina GermanyPoland Faeroe Croatia LiechtensteinRepublic of Islands (DK) Gibraltar (UK) Luxembourg Moldova Finland Greece MonacoRomania Iceland Holy See NetherlandsRussian Ireland Italy Switzerland Federation Isle of Man (UK) MaltaSlovakia Latvia PortugalUkraine Lithuania San Marino
Norway SloveniaSweden Spain

62
WHO/NUT/97.4
Europe (continued)Northern Europe Southern EuropeUnited Kingdom The former of Great Britain Yugoslav and Northern Republic ofIreland Macedonia
Yugoslavia
Latin America and the CaribbeanCaribbean Central America South America
Anguilla (UK) Jamaica Belize ArgentinaAntigua and Martinique (F) Costa Rica Bolivia Barbuda Montserrat (UK) El Salvador BrazilAruba (NE) Netherlands Guatemala ChileBahamas Antilles (NE) Honduras ColombiaBarbados Puerto Rico (US) Mexico EcuadorBritish Virgin St Kitts and Nevis Nicaragua Falkland Islands Island (UK) St Lucia Panama (Malvinas) (UK)Cayman St Vincent and the French Guiana (F) Islands (UK) Grenadines GuyanaCuba Trinidad and ParaguayDominica Tobago PeruDominican Turks and Caicos Suriname Republic Islands (UK) UruguayGrenada US Virgin VenezuelaGuadeloupe (F) Islands (US)Haiti
Northern America
Bermuda (UK)CanadaGreenland (DK)St Pierre and Miquelon (F)United States of America
OceaniaAustralia- New Melanesia Micronesia PolynesiaZealand
Australia Fiji Guam (US) AmericanNew Zealand New Caledonia (F) Kiribati Samoa (US)
Papua New Marshall Islands Cook Islands Guinea Micronesia FrenchSolomon Islands (Federated Polynesia (F)Vanuatu States of ) Niue
Nauru Pitcairn (NZ)Northern Mariana Western Samoa Islands (US) Tokelau (NZ)Palau Tonga
Tuvalu (UK)Wallis and Futuna Islands (F)
Source: World Populations Prospects 1994. New York: United Nations, 1995.
(F) Overseas Departments of France, French territorial collectivity,(UK) UK crown dependent territory, British colony, or British protectorate(US) United States of America† Overseas territory of Portugal‡ recognized by the Organization of African Unity(DK) Kingdom of Denmark(NE) Netherlands(NZ) Overseas territory of New Zealand

63
WHO Global Database on Child Growth and Malnutrition
8.2 WHO regions
Africa
Algeria Democratic Republic Malawi South AfricaAngola of the Congo Mali SwazilandBenin Equatorial Guinea Mauritania TogoBotswana Eritrea Mauritius UgandaBurkina Faso Ethiopia Mozambique United Republic ofBurundi Gabon Namibia TanzaniaCameroon Gambia Niger ZambiaCape Verde Ghana Nigeria ZimbabweCentral African Guinea Rwanda Republic Guinea Bissau Sao Tome andChad Kenya PrincipeComoros Lesotho SenegalCongo Liberia SeychellesCôte d’Ivoire Madagascar Sierra Leone
Americas
Antigua and Barbuda Costa Rica Honduras SurinameArgentina Cuba Jamaica Trinidad andBahamas Dominica Mexico TobagoBarbados Dominican Republic Nicaragua United States ofBelize Ecuador Panama AmericaBolivia El Salvador Paraguay UruguayBrazil Grenada Peru VenezuelaCanada Guatemala St Kitts and NevisChile Guyana St LuciaColombia Haiti St Vincent and the
Grenadines
South-East Asia
Bangladesh Indonesia Sri LankaBhutan Maldives ThailandDemocratic People’s Myanmar Republic of Korea NepalIndia
Europe
Albania France Malta SwitzerlandArmenia Georgia Monaco TajikistanAustria Germany Netherlands The formerAzerbaijan Greece Norway Yugoslav RepublicBelarus Hungary Poland of MacedoniaBelgium Iceland Portugal TurkeyBosnia and Ireland Republic of Moldova Turkmenistan Herzegovina Israel Romania UkraineBulgaria Italy Russian Federation United Kingdom ofCroatia Kazakstan San Marino Great Britain andCzech Republic Kyrgyzstan Slovakia Northern IrelandDenmark Latvia Slovenia UzbekistanEstonia Lithuania Spain YugoslaviaFinland Luxemburg Sweden

64
WHO/NUT/97.4
Eastern Mediterranean
Afghanistan Iraq Oman TunisiaBahrain Jordan Pakistan Unite Arab EmiratesCyprus Kuwait Qatar YemenDjibouti Lebanon Saudi ArabiaEgypt Libyan Arab SomaliaIran (Islamic Jamahiriya Sudan Republic of) Morocco Syrian Arab Republic
Western PacificAustralia Lao People’s New Zealand Solomon IslandsBrunei Darussalam Democratic Republic Niue TongaCambodia Malaysia Palau TuvaluChina Marshall Islands Papua New Guinea VanuatuCook Islands Micronesia, Federated Philippines Viet NamFiji States of Republic of KoreaJapan Mongolia SamoaKiribati Nauru Singapore
8.3 Level of development
Developed market economy countries (Level 1)
Andorra Greece NorwayAustralia Iceland PortugalAustria Ireland San MarinoBelgium Italy SpainCanada Japan SwedenDenmark Luxembourg SwitzerlandFinland Monaco United Kingdom of GreatFrance Netherlands Britain and Northern IrelandGermany New Zealand United States of America
Developing countries (excluding least developed countries) (Level 2)
Algeria Fiji NigeriaAntigua and Barbuda Gabon NiueArgentina Ghana OmanBahamas Grenada PakistanBahrain Guatemala PalauBarbados Guyana PanamaBelize Honduras Papua New GuineaBolivia India ParaguayBosnia and Herzegovina Indonesia PeruBotswana Iran, Islamic Republic of PhilippinesBrazil Iraq QatarBrunei Darussalam Israel Republic of KoreaCôte d’Ivoire Jamaica St Kitts and NevisCameroon Jordan St LuciaChile Kenya St Vincent and theChina Kuwait GrenadinesColombia Lebanon Saudi ArabiaCongo Libyan Arab Jamahiriya SenegalCook Islands Malaysia SeychellesCosta Rica Malta SingaporeCroatia Marshall Islands SloveniaCuba Mauritius South AfricaCyprus Mexico Sri LankaDemocratic People’s Micronesia, Federated Suriname Republic of Korea States of SwazilandDominica Mongolia Syrian Arab RepublicDominican Republic Morocco Thailand

65
WHO Global Database on Child Growth and Malnutrition
Developing countries (continued)Ecuador Namibia The former YugoslavEgypt Nauru Republic of MacedoniaEl Salvador Nicaragua Tonga
Trinidad and TobagoTunisiaTurkeyUnited Arab EmiratesUruguayVenezuelaViet NamZimbabwe
Least developed countries (Level 3)
Afghanistan Haiti SudanAngola Kiribati TogoBangladesh Lao People’s TuvaluBenin Democratic Republic UgandaBhutan Lesotho United RepublicBurkina Faso Liberia of TanzaniaBurundi Madagascar VanuatuCambodia Malawi YemenCape Verde Maldives ZambiaCentral African Republic MaliChad MauritaniaComoros MozambiqueDemocratic Republic of Myanmar the Congo NepalDjibouti NigerEquatorial Guinea RwandaEritrea SamoaEthiopia Sao Tome and PrincipeGambia Sierra LeoneGuinea Solomon IslandsGuinea-Bissau Somalia
Economies in transition (Level 4)
Albania Kazakstan TajikistanArmenia Kyrgyzstan TurkmenistanAzerbaijan Latvia UkraineBelarus Lithuania UzbekistanBulgaria PolandCzech Republic Republic of MoldovaEstonia RomaniaGeorgia Russian FederationHungary Slovakia

66
WHO/NUT/97.4
67
WHO Global Database on Child Growth and Malnutrition
9 Country data and references