whither goest calpers? - csmfo · whither goest calpers? csmfo annual conference . richard...
TRANSCRIPT

Whither Goest CalPERS? CSMFO Annual Conference
Richard Costigan, Board Member
Marcie Frost, CEO Scott Terando, Chief Actuary
February 8, 2017

2
WELCOME
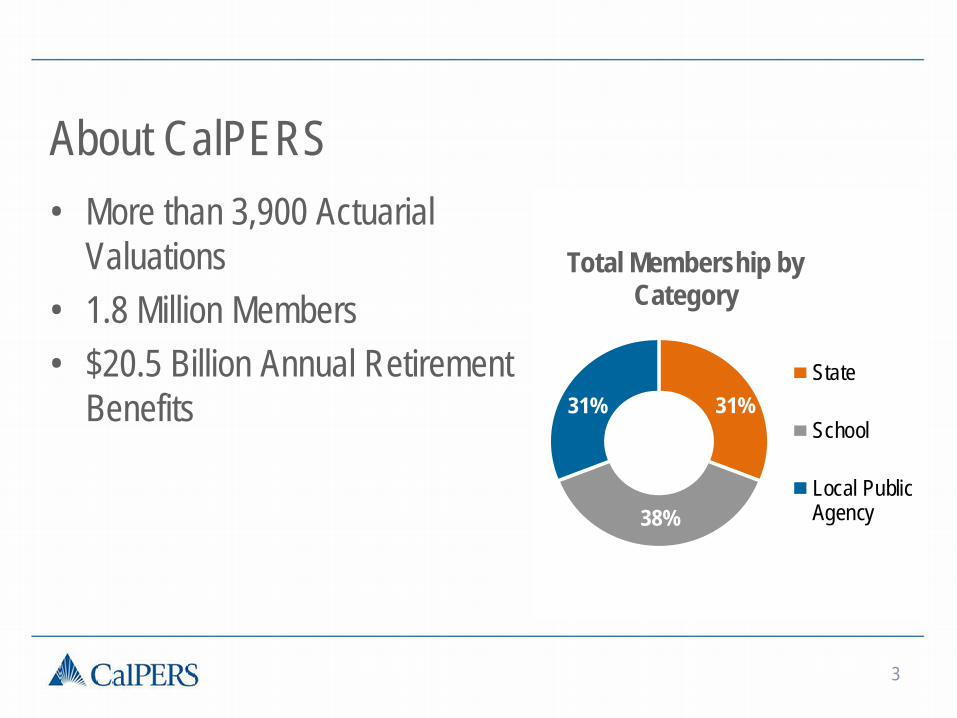
About CalPERS • More than 3,900 Actuarial
Valuations • 1.8 Million Members • $20.5 Billion Annual Retirement
Benefits
3
Total Membership by Category
State
School
Local PublicAgency
31%
38%
31%

Financial Highlights
4
$300 B
.61% 5.1%
ASSETS UNDER MANAGEMENT
7.03% 2015/16 PORTFOLIO
RETURN 10 – YR ANNUALIZED
RETURN 20 – YR ANNUALIZED
RETURN
5
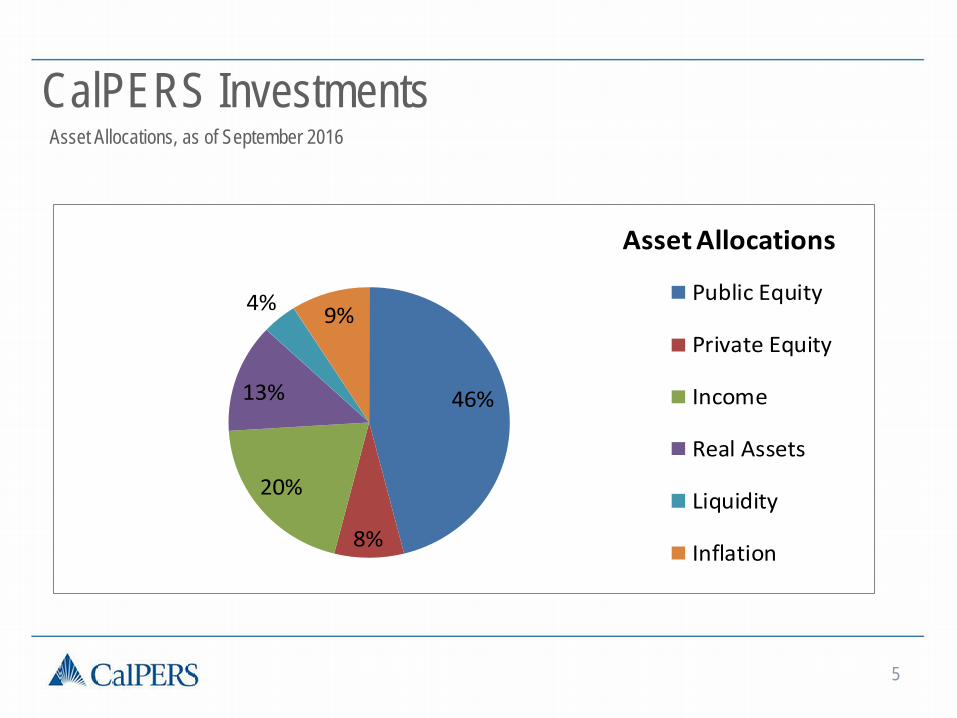
46%
8%
20%
13%
4% 9%
Asset Allocations
Public Equity
Private Equity
Income
Real Assets
Liquidity
Inflation
Asset Allocations, as of September 2016
CalPERS Investments

6
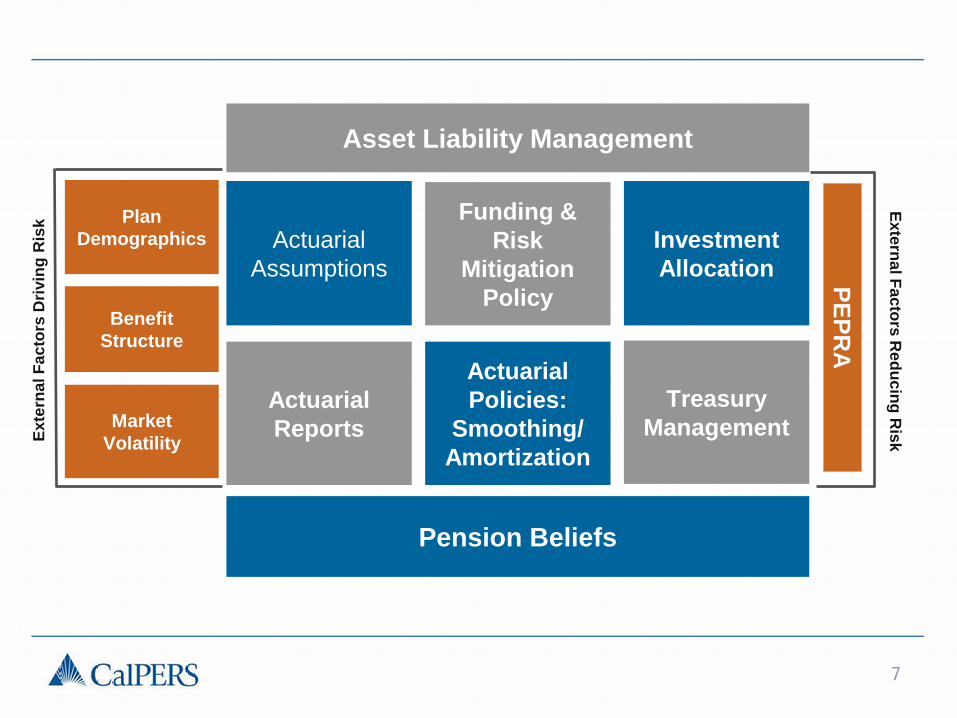
ASSET LIABILITY MANAGEMENT
7
Actuarial Reports
Actuarial Policies:
Smoothing/ Amortization
Asset Liability Management
Pension Beliefs
Funding & Risk
Mitigation Policy
Treasury Management
Actuarial Assumptions
Investment Allocation
Plan Demographics
Benefit Structure
Market Volatility Ex
tern
al F
acto
rs D
rivin
g R
isk
External Factors Reducing R
isk
PEPRA

8
WHAT IS DRIVING RISK?
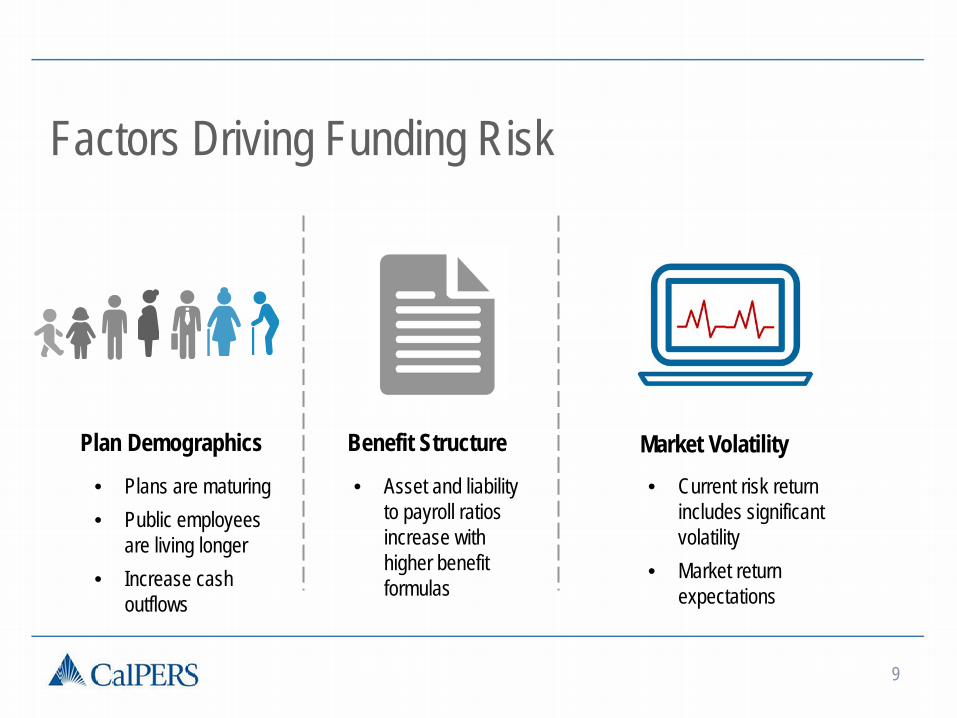
Factors Driving Funding Risk
9
Plan Demographics Benefit Structure Market Volatility • Current risk return
includes significant volatility
• Market return expectations
• Asset and liability to payroll ratios increase with higher benefit formulas
• Plans are maturing • Public employees
are living longer • Increase cash
outflows

10
PLAN DEMOGRAPHICS
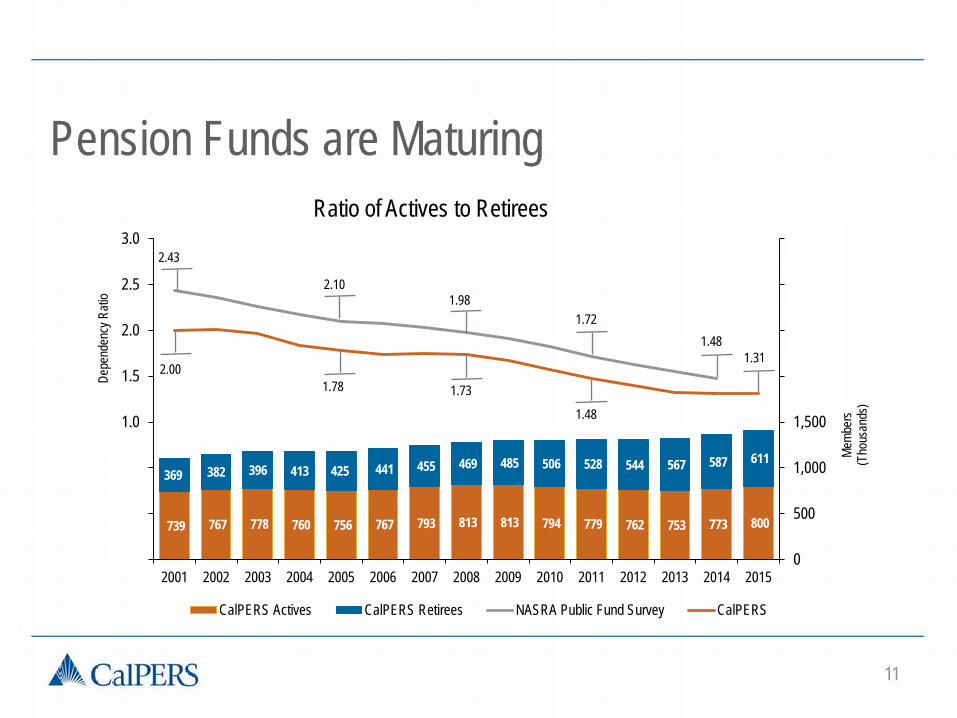
Pension Funds are Maturing
11
739 767 778 760 756 767 793 813 813 794 779 762 753 773 800
369 382 396 413 425 441 455 469 485 506 528 544 567 587 611
2.43
2.10 1.98
1.72 1.48
2.00 1.78 1.73
1.48
1.31
0
500
1,000
1,500
2,000
2,500
3,000
3,500
-0.5
0.0
0.5
1.0
1.5
2.0
2.5
3.0
2001 2002 2003 2004 2005 2006 2007 2008 2009 2010 2011 2012 2013 2014 2015
Memb
ers
(Tho
usan
ds)
Depe
nden
cy R
atio
Ratio of Actives to Retirees
CalPERS Actives CalPERS Retirees NASRA Public Fund Survey CalPERS
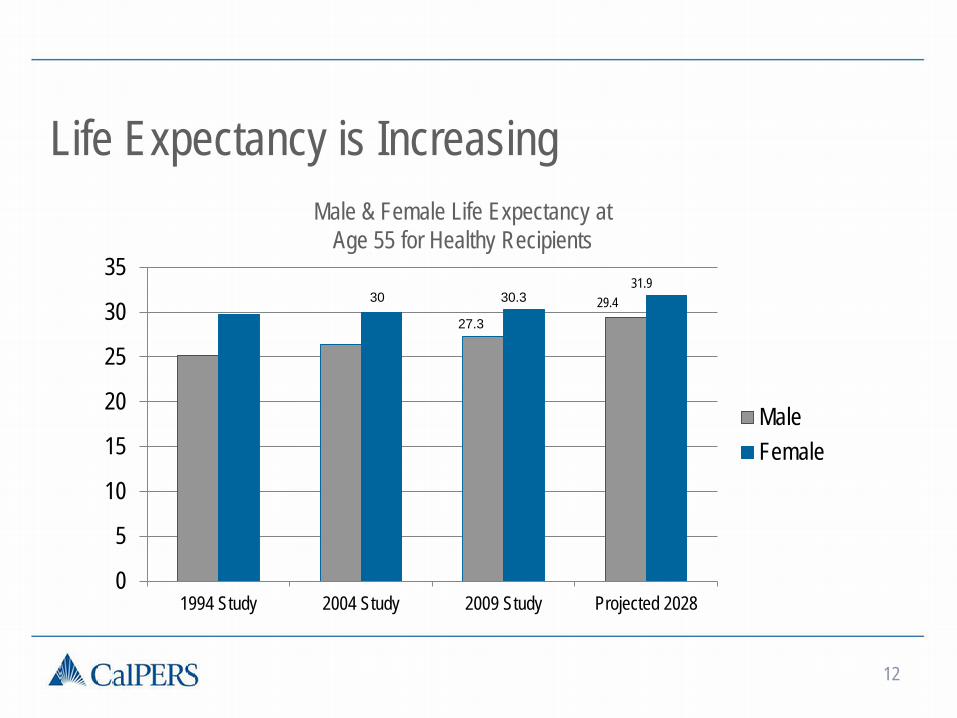
Life Expectancy is Increasing
12
0
5
10
15
20
25
30
35
1994 Study 2004 Study 2009 Study Projected 2028
MaleFemale
30
27.3
30.3 29.4 31.9
Male & Female Life Expectancy at Age 55 for Healthy Recipients
Plan Demographics Mitigation • Actuarial Experience Study • Change in Actuarial Assumptions • Funding Level & Risk Report
13

14
BENEFIT STRUCTURE
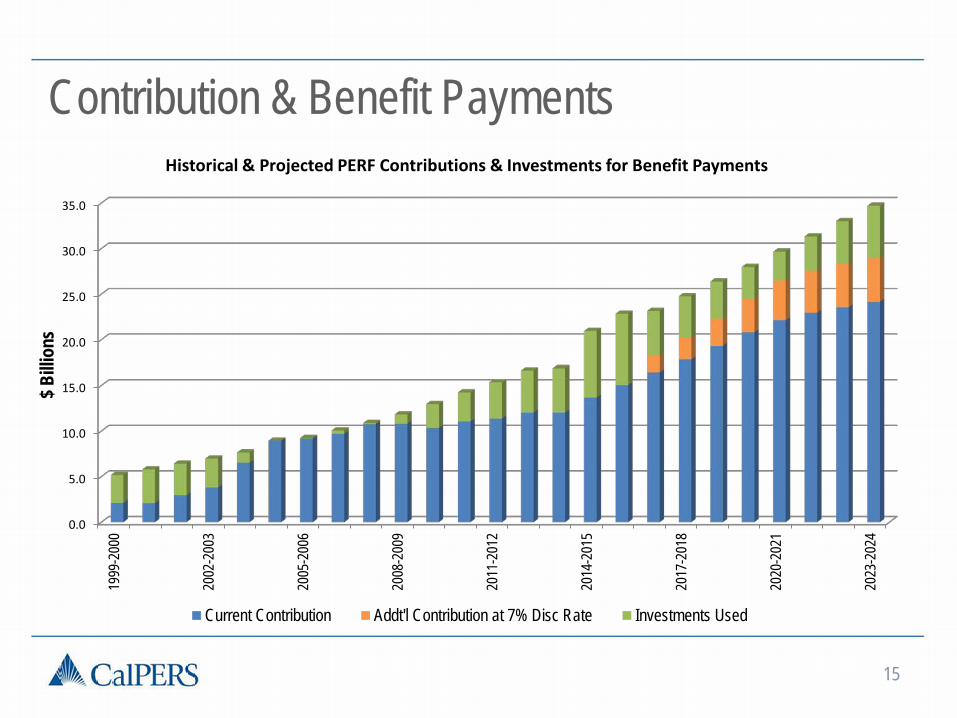
Contribution & Benefit Payments
15
0.0
5.0
10.0
15.0
20.0
25.0
30.0
35.0
1999
-200
0
2002
-200
3
2005
-200
6
2008
-200
9
2011
-201
2
2014
-201
5
2017
-201
8
2020
-202
1
2023
-202
4
$ Billi
ons
Historical & Projected PERF Contributions & Investments for Benefit Payments
Current Contribution Addt'l Contribution at 7% Disc Rate Investments Used
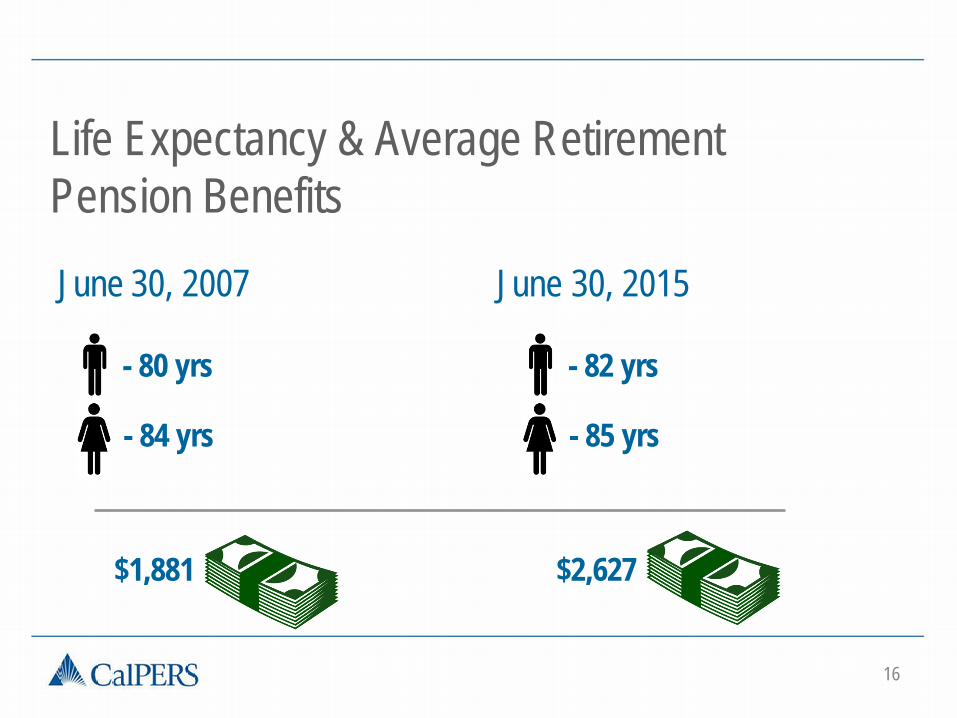
Life Expectancy & Average Retirement Pension Benefits
June 30, 2007 June 30, 2015
16
- 80 yrs
- 84 yrs
- 82 yrs
- 85 yrs
$1,881
$2,627
Benefit Structure Mitigation • Funding Level & Risk Report • New actuarial policies • Smoothing • Amortization • Treasury Management
17
18
MARKET VOLATILITY
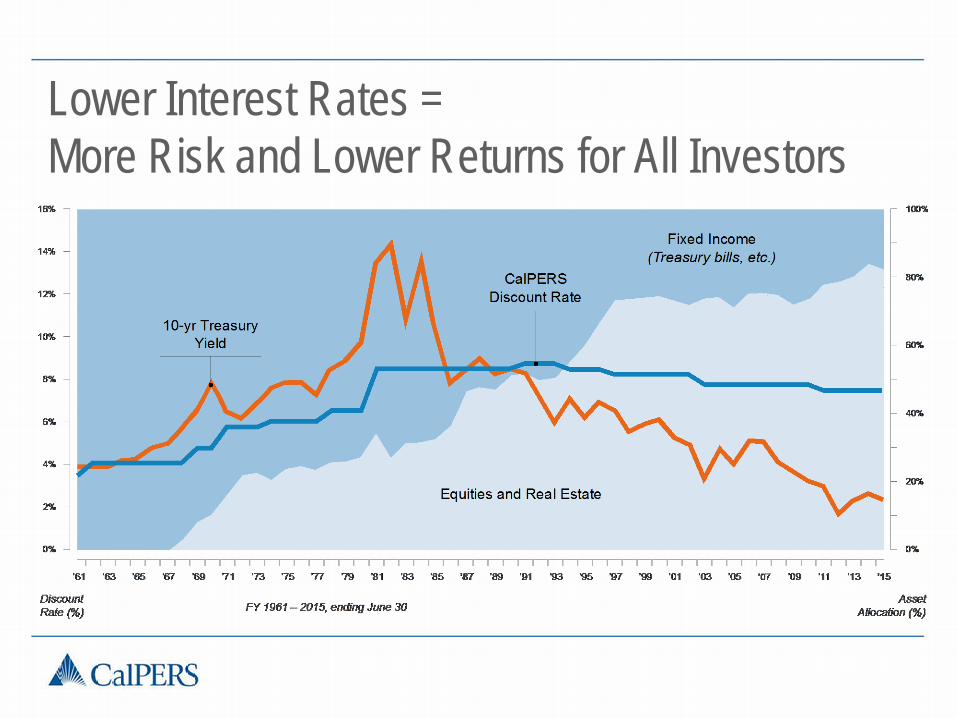
Lower Interest Rates = More Risk and Lower Returns for All Investors

Funded Status & Investment Returns
20
-25
-20
-15
-10
-5
0
5
10
15
20
25
0
20
40
60
80
100
120
05 06 07 08 09 10 11 12 13 14 15 16
Investment Returns Funded Status
Fiscal Year Ending June 30
Investment R
eturns by %
Fund
ed S
tatu
s by
%
Market Volatility Mitigation
• Actuarial Valuation Report • Investment Allocation • New Actuarial Policies: Smoothing/ Amortization • Funding Risk Mitigation Policy
21
22
WHY A DISCOUNT RATE CHANGE NOW?
Why a Discount Rate Change Now? • ALM cycle requires us to recognize changing conditions • Market conditions have changed • Seeing more uncertainty in the forecast • Next 10 years are consequential • To close the cash flow funding gap • Risks in system continue to grow
24
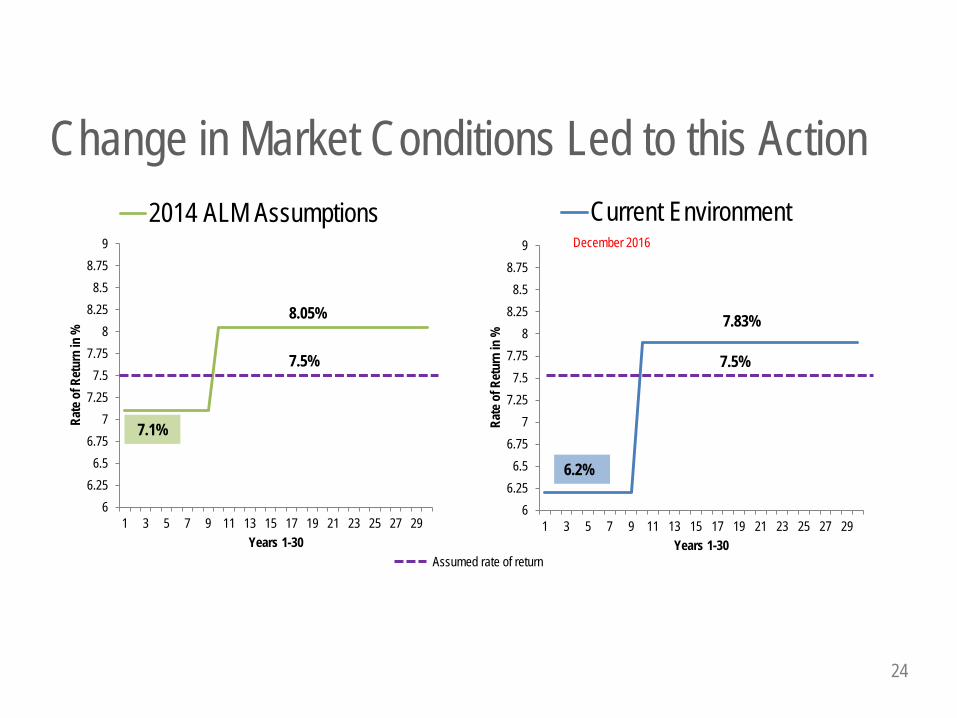
Change in Market Conditions Led to this Action
66.25
6.56.75
77.25
7.57.75
88.25
8.58.75
9
1 3 5 7 9 11 13 15 17 19 21 23 25 27 29
Rate
of R
etur
n in
%
Years 1-30
2014 ALM Assumptions
8.05%
7.5%
66.25
6.56.75
77.25
7.57.75
88.25
8.58.75
9
1 3 5 7 9 11 13 15 17 19 21 23 25 27 29
Rate
of R
etur
n in
%
Years 1-30
Current Environment
7.83%
7.5%
Assumed rate of return
6.2%
7.1%
December 2016
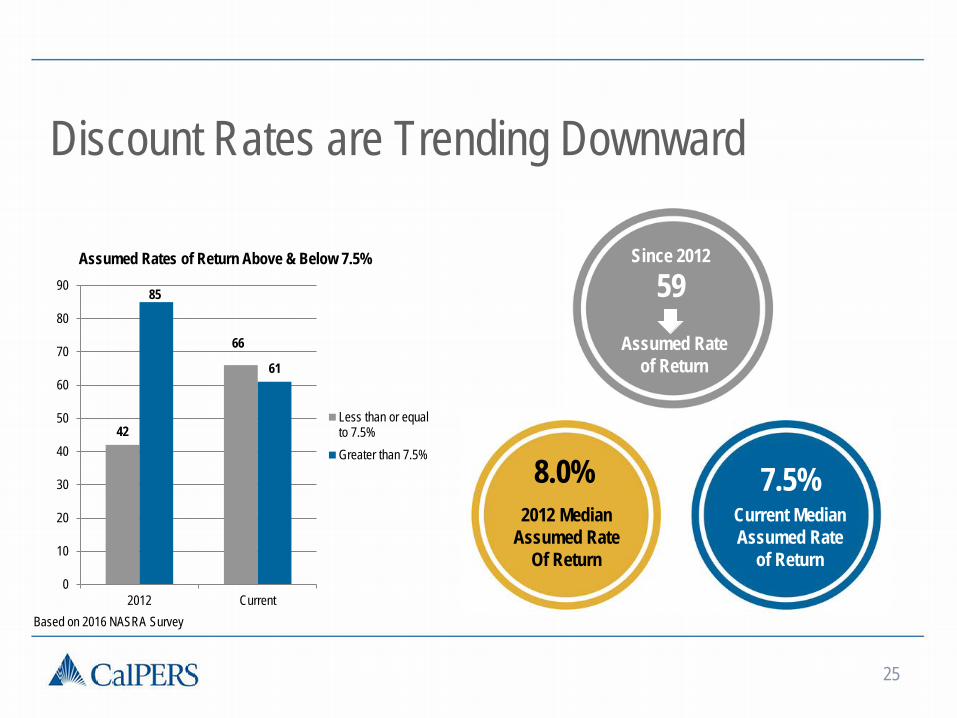
Discount Rates are Trending Downward
42
66
85
61
0
10
20
30
40
50
60
70
80
90
2012 Current
Less than or equalto 7.5%Greater than 7.5%
25
Assumed Rates of Return Above & Below 7.5%
7.5% Median
Discount Rate
Based on 2016 NASRA Survey
59 Assumed Rate
of Return
Since 2012
8.0% 2012 Median
Assumed Rate Of Return
7.5% Current Median Assumed Rate
of Return
• Market conditions have changed • Seeing more uncertainty in the forecast • Next 10 years are consequential • To close the cash flow funding gap • Risks in system continue to grow
26
Other Driving Factors

27
WHAT DID THE BOARD ADOPT AND HOW WILL IT BE
IMPLEMENTED?
28
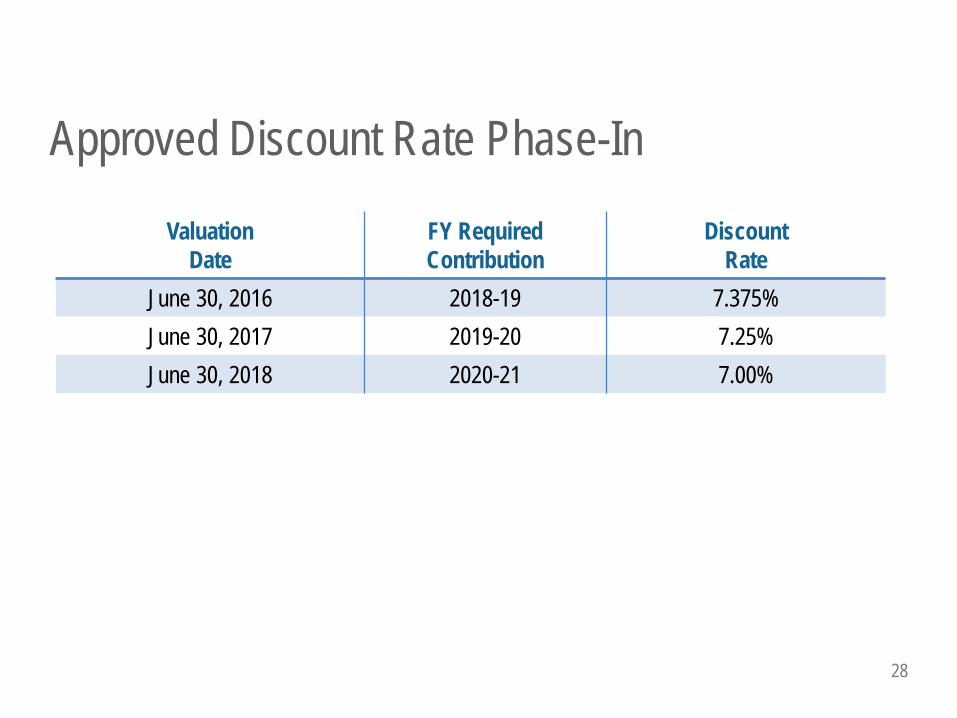
Approved Discount Rate Phase-In
Valuation Date
FY Required Contribution
Discount Rate
June 30, 2016 2018-19 7.375% June 30, 2017 2019-20 7.25% June 30, 2018 2020-21 7.00%
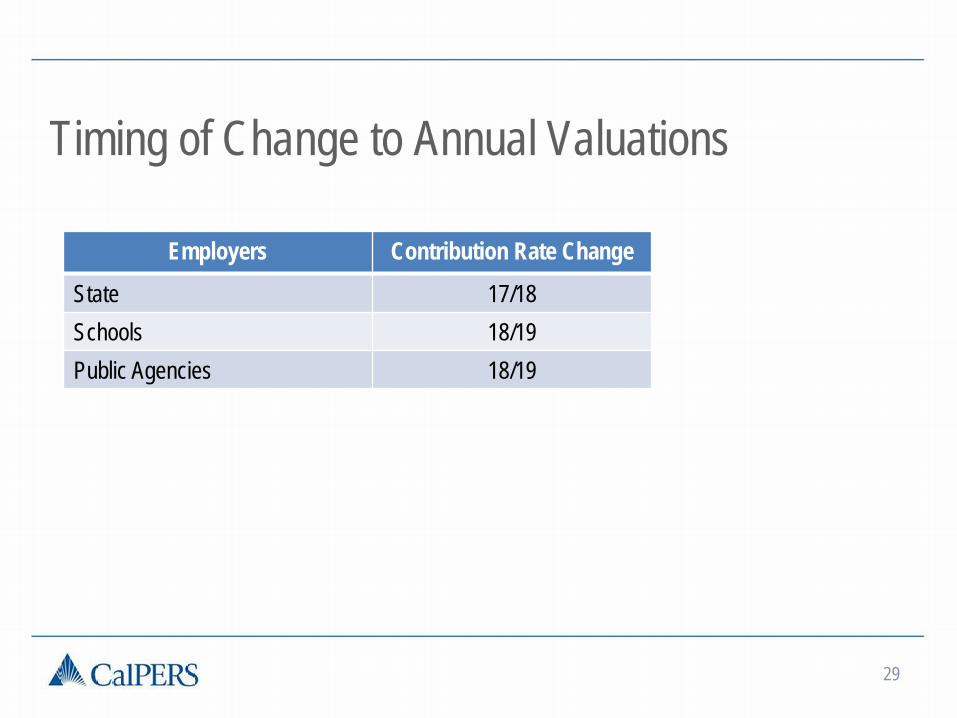
Timing of Change to Annual Valuations
29
Employers Contribution Rate Change
State 17/18 Schools 18/19 Public Agencies 18/19
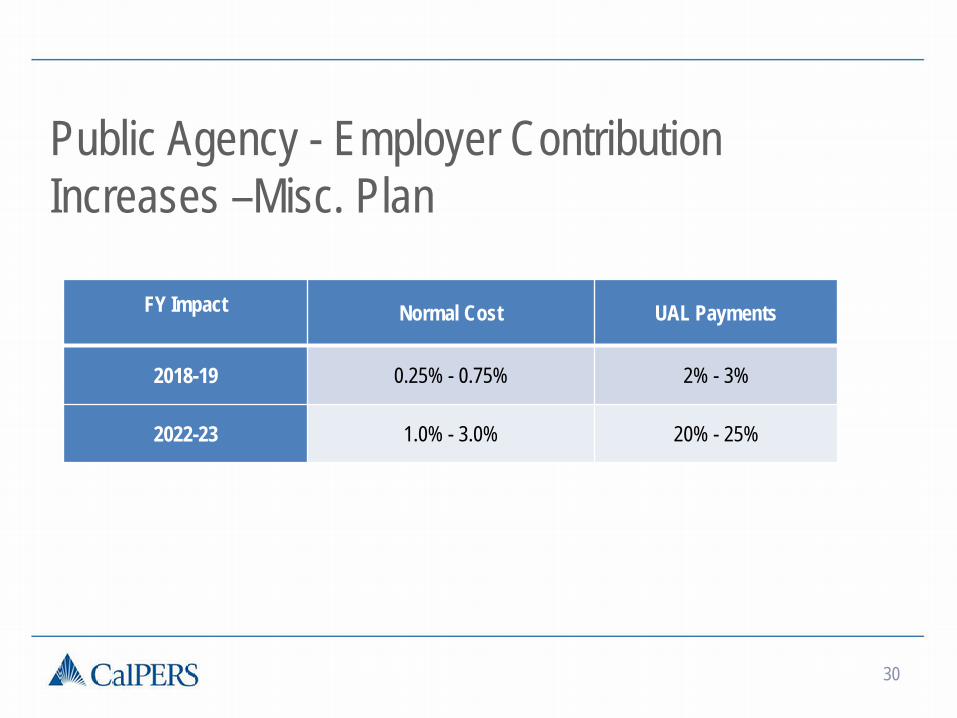
Public Agency - Employer Contribution Increases –Misc. Plan
FY Impact Normal Cost UAL Payments
2018-19 0.25% - 0.75% 2% - 3%
2022-23 1.0% - 3.0% 20% - 25%
30
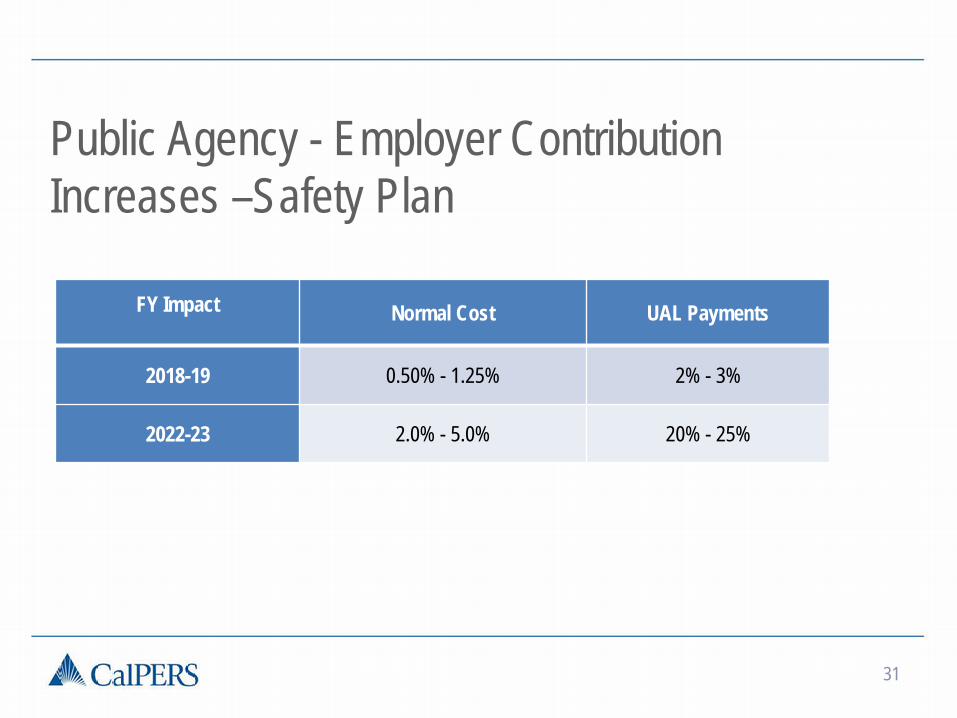
Public Agency - Employer Contribution Increases –Safety Plan
31
FY Impact Normal Cost UAL Payments
2018-19 0.50% - 1.25% 2% - 3%
2022-23 2.0% - 5.0% 20% - 25%
Benefits of Reducing the Discount Rate • Strengthens long-term sustainability of the fund to pay
promised benefits • Reduces negative cash flow; additional contributions will
help to offset growing pension payments • Reduces the long-term chances of falling below a 50%
or 60% funded status that would weaken the sustainability of the fund
• Reduces the risk of contribution increases in the future from volatile investment markets

33
LOOKING AHEAD

Next Steps • Public Agency valuations distributed in July 2017 • Begin Asset Liability Management cycle of reviews
- Asset allocation - Capital market assumptions - Experience study
• Reconsider discount rate in February 2018