whiteside & associates – billings, montana
DESCRIPTION
Rail Transportation In the U.S. - Impacts Presentation to AASHTO – Standing Committee on Rail Transportation – September 8, 2014 Denver. Whiteside & Associates – Billings, Montana. Four Briefing Items. U.S. Rail Maps and Rail Concentration - PowerPoint PPT PresentationTRANSCRIPT

Whiteside & Associates – Billings, Montana
Rail Transportation In the U.S. - Impacts Presentation to AASHTO – Standing Committee on Rail Transportation – September 8, 2014 Denver
1. U.S. Rail Maps and Rail Concentration
2. Rail Captivity and its effects on State and their economies
3. Coal/Oil/Intermodal – Growth Traffic - Movements on Rail
4. Role of Communities/Government in assisting with upcoming impacts of increasing rail traffic
Four Briefing Items
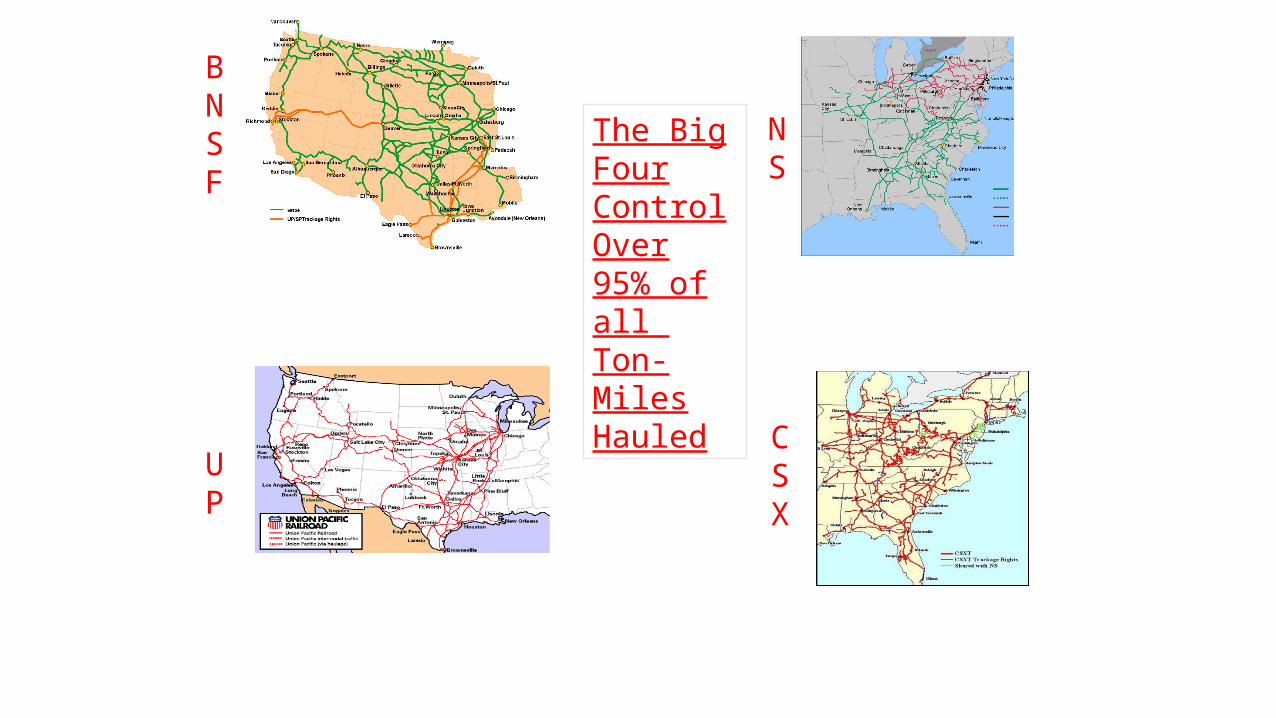
BNSF
UP
NS
CSX
The Big Four Control Over 95% of all Ton-Miles Hauled

Burlington Northern/Santa Fe

UPSP
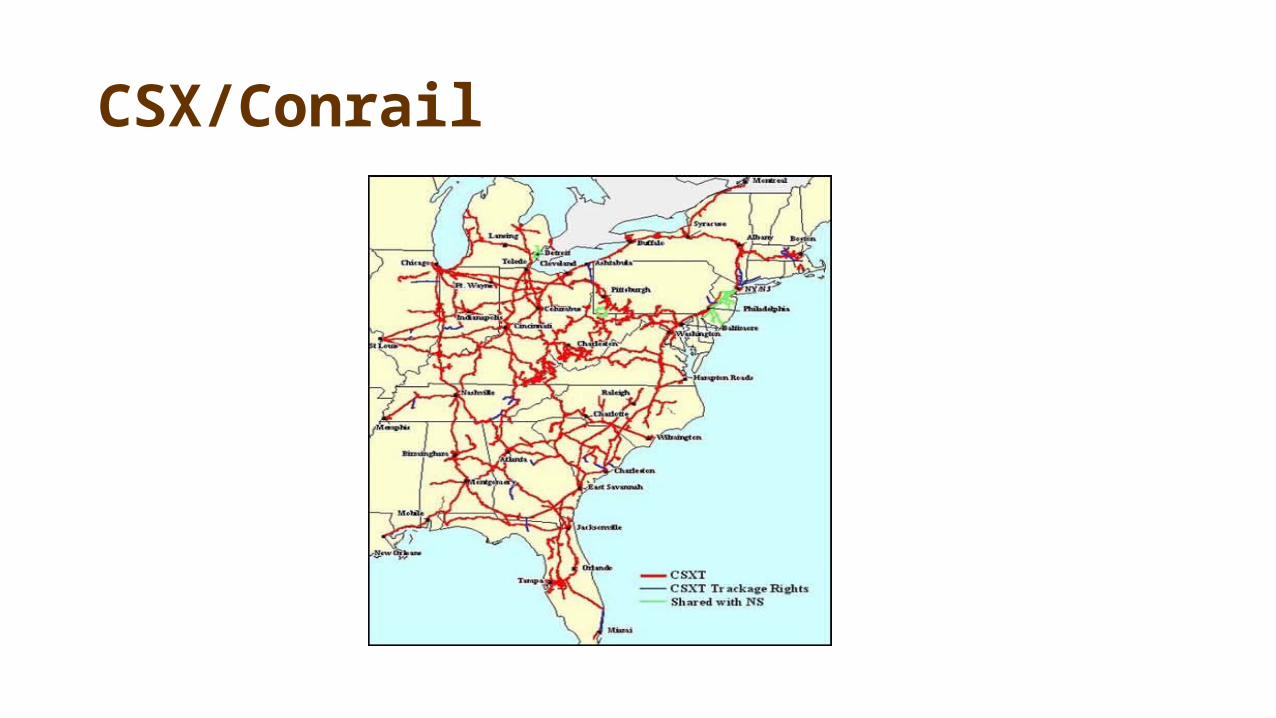
CSX/Conrail

Norfolk Southern/Conrail

Did HASBRO, in 1935, Get It Right About Railroads?
They said, “if you own all four of the railroads….you are allowed to charge
8 times the rates that you can charge if you only own one railroad”!
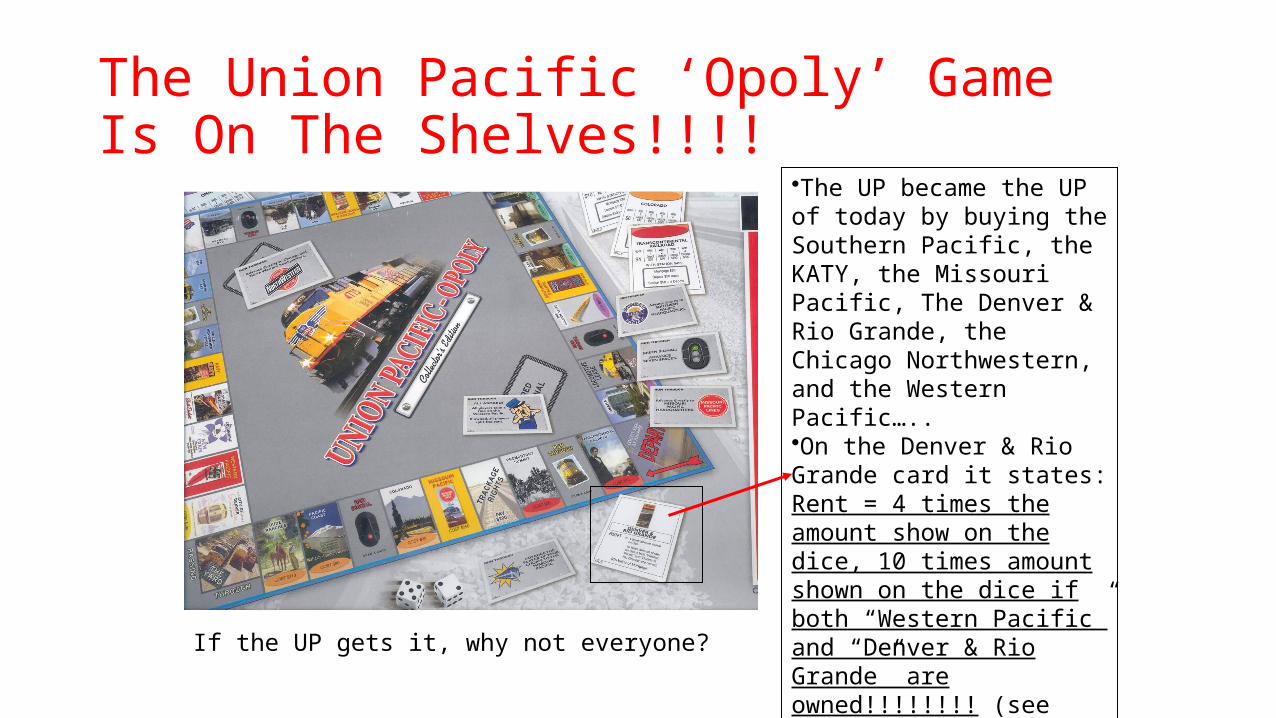
The Union Pacific ‘Opoly’ Game Is On The Shelves!!!!
•The UP became the UP of today by buying the Southern Pacific, the KATY, the Missouri Pacific, The Denver & Rio Grande, the Chicago Northwestern, and the Western Pacific…..•On the Denver & Rio Grande card it states: Rent = 4 times the amount show on the dice, 10 times amount shown on the dice if both “Western Pacific” and “Denver & Rio Grande” are owned!!!!!!!! (see lower right hand corner)
If the UP gets it, why not everyone?

1. Combination of ineffective regulation and ineffective competition2. Monopoly railroads control essential facilities of commerce3. Railroad negotiating position is too often “Take it or leave it” or even “No, we
won’t allow that”4. STB rail regulation is too expensive, too slow and too rarely actually helps.
Railroads are not penalized when they act unlawfully. At most, they are merely required to undo the damage they caused (e.g., refund excess rates after the rare successful shipper rate challenge)
5. In U.S., rail short lines are neutralized and antitrust laws are largely inapplicable due to erroneous assumption of effective regulation
WHAT IS THE CAPTIVE SHIPPER RAILROAD PROBLEM IN U.S.?
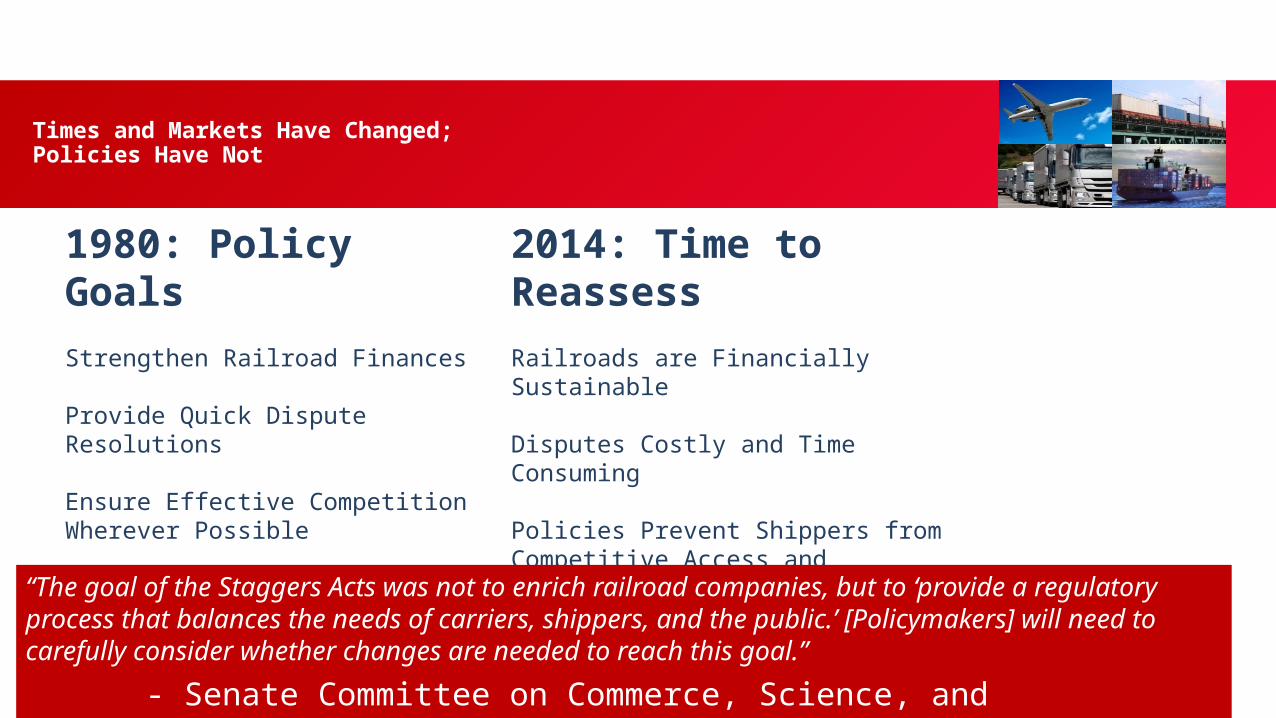
Times and Markets Have Changed; Policies Have Not
1980: Policy Goals
Strengthen Railroad Finances
Provide Quick Dispute Resolutions
Ensure Effective Competition Wherever Possible Maintain Reasonable Rates EvenWithout Effective Competition
2014: Time to Reassess
Railroads are Financially Sustainable
Disputes Costly and Time Consuming
Policies Prevent Shippers from Competitive Access and Reasonable Rates
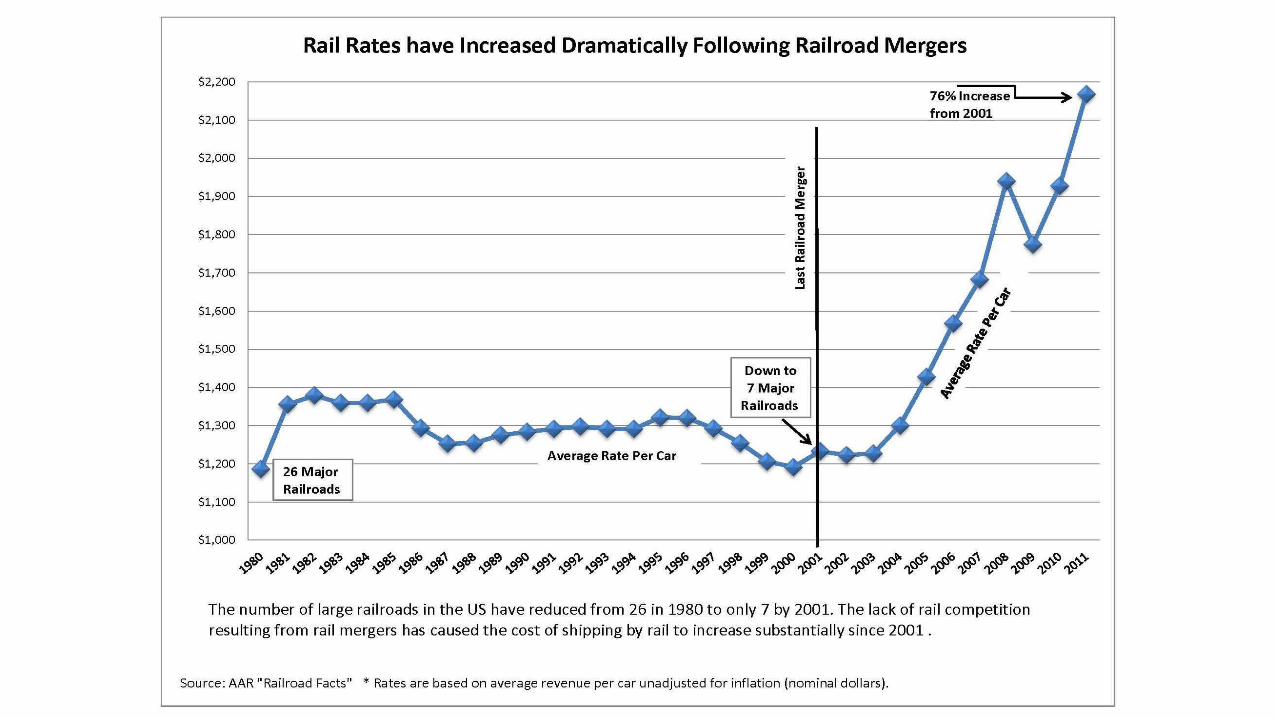
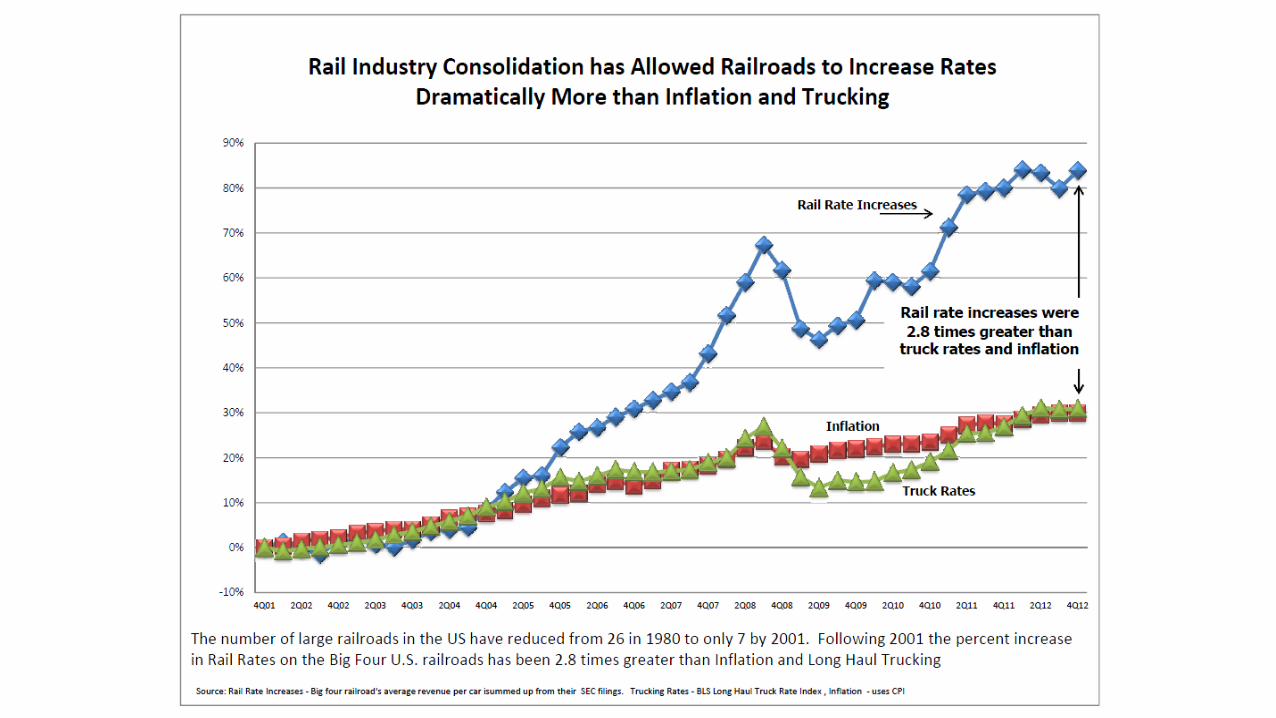
Rail Mergers Significantly Reduced Competition and Rates Soared
“The goal of the Staggers Acts was not to enrich railroad companies, but to ‘provide a regulatory process that balances the needs of carriers, shippers, and the public.’ [Policymakers] will need to carefully consider whether changes are needed to reach this goal.”
- Senate Committee on Commerce, Science, and Transportation; 2013
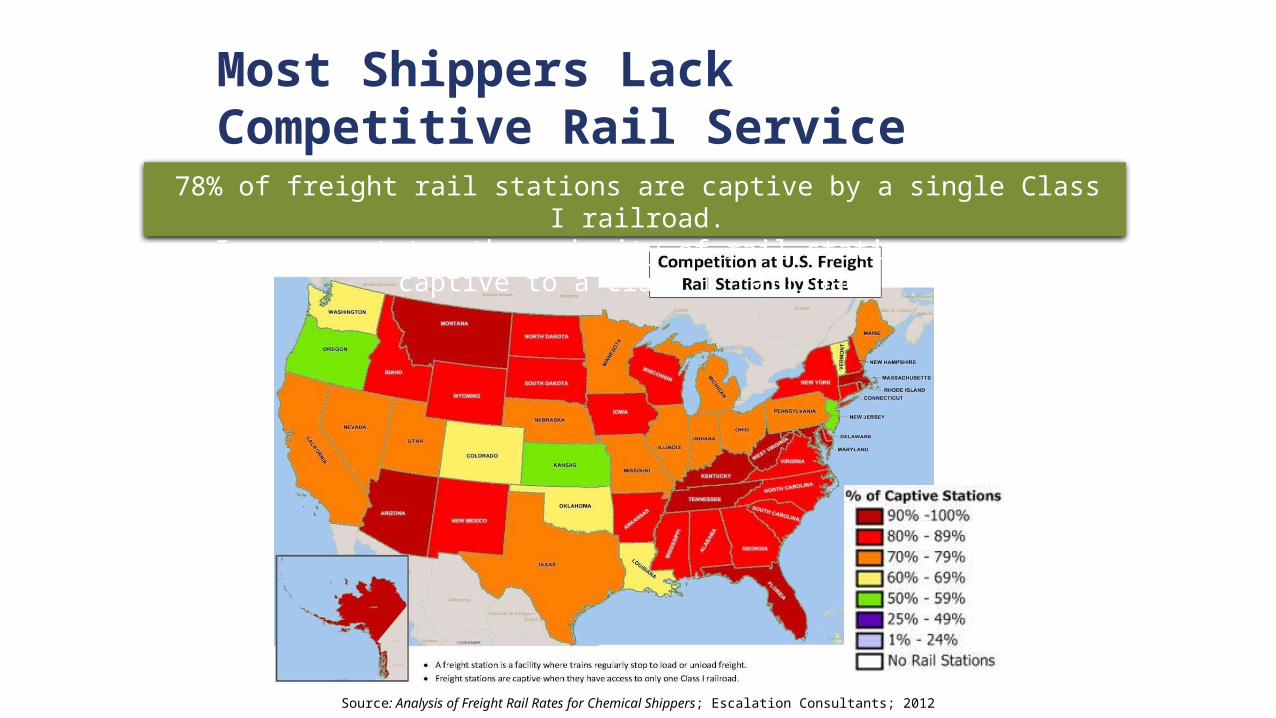
78% of freight rail stations are captive by a single Class I railroad.In every state, the majority of rail stations are now captive to a Class I railroad.
Source: Analysis of Freight Rail Rates for Chemical Shippers; Escalation Consultants; 2012
Most Shippers Lack Competitive Rail Service

• There are two components of any cost – fixed and variable• STB for regulatory purposed measures and models RR Variable Costs based
upon an allocation model called the Uniform Rail Costing System (URCS)• To measure relative profitability – a ratio of Revenue/Variable Cost (called RVC)
of a movement is developed100% RVC is exactly what you would think – those 100% of costs that vary with output120-140% RVC is where most economists believe are the full cost of railroad for its
operations < 180% RVC – the STB does not have jurisdiction to adjudicate the fairness of a rail rate>180% RVC is the Congressionally mandated threshold where the STB can adjudicate the
fairness of a rail rate the degree to which a rate is above 180% is the degree of ‘Premium’ the railroad is
exacting from the movement
How Rail Rates Are Measured by The Surface Transportation Board (STB)
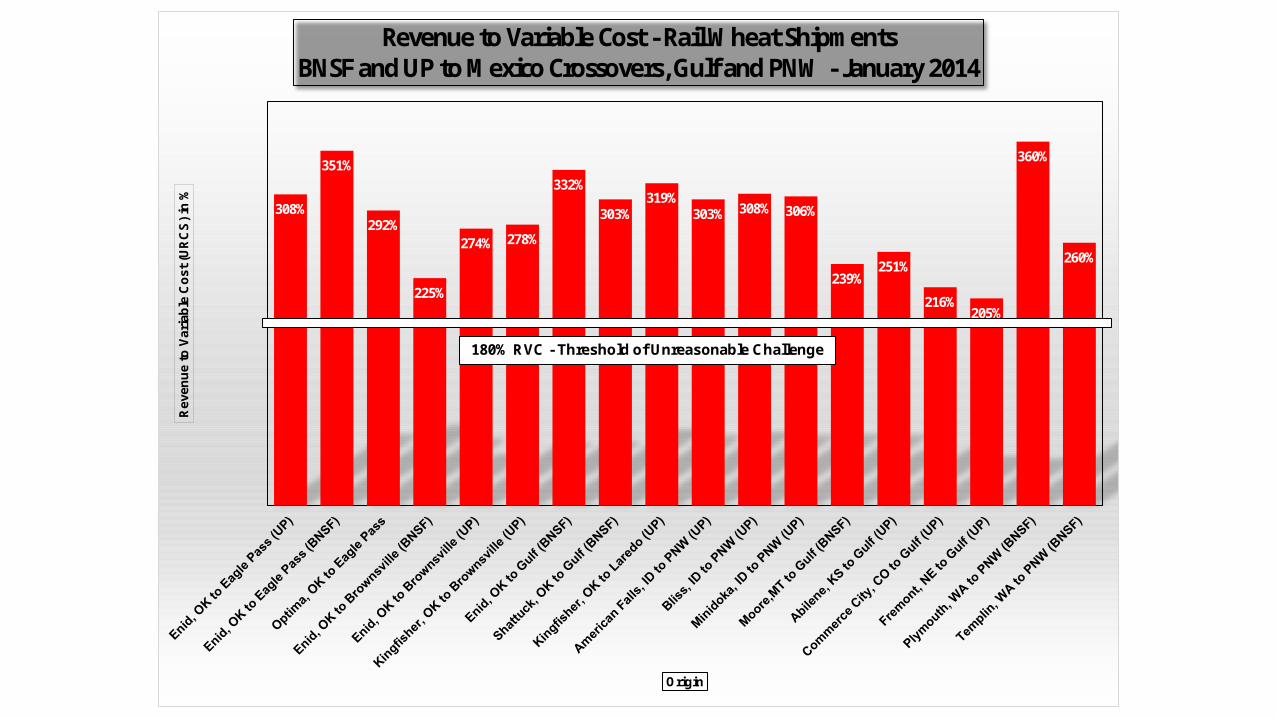
308%
351%
292%
225%
274% 278%
332%
303%319%
303% 308% 306%
239%251%
216%205%
360%
260%
Re
ven
ue
to
Va
ria
ble
Co
st
(UR
CS
) in
%
Origin
Revenue to Variable Cost - Rail Wheat Shipments BNSF and UP to Mexico Crossovers, Gulf and PNW - January 2014
180% RVC - Threshold of Unreasonable Challenge
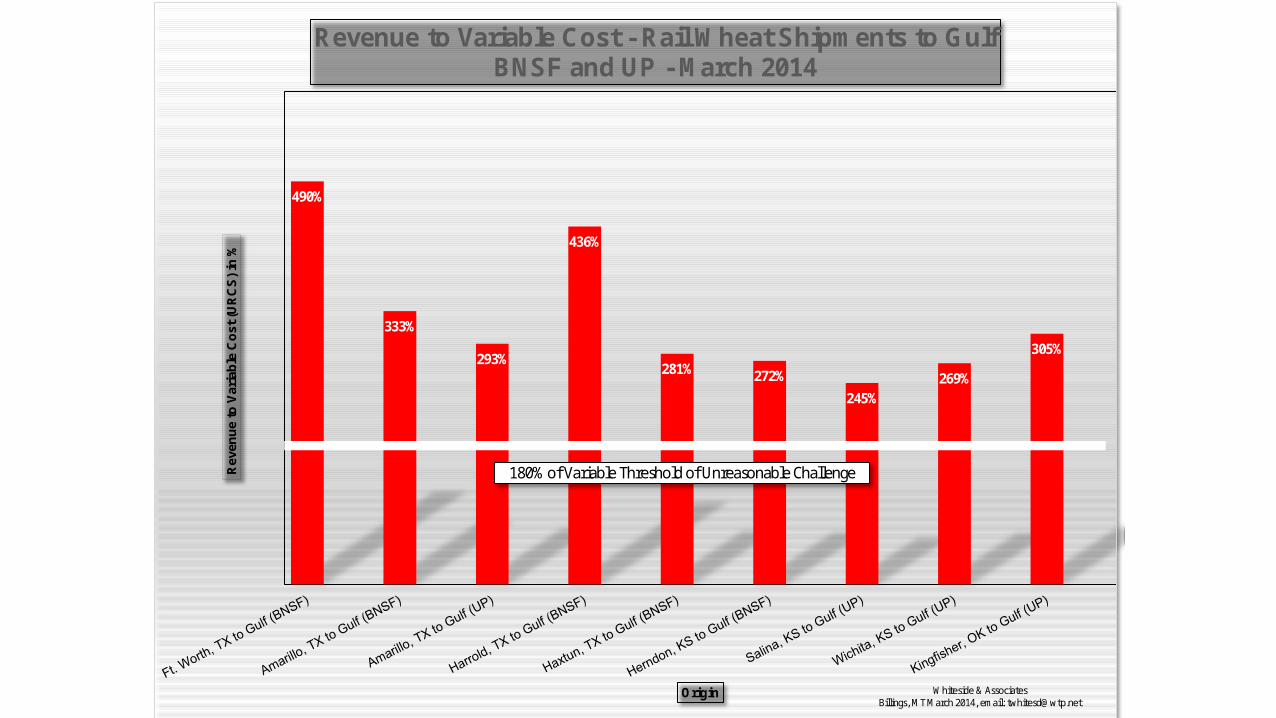
Rates to Gulf on Wheat (BNSF and UP) Are Well-above the Threshold of Unreasonableness490%
333%
293%
436%
281% 272%
245%269%
305%
Rev
enu
e to
Var
iab
le C
ost
(U
RC
S)
in %
Origin
Revenue to Variable Cost - Rail Wheat Shipments to Gulf BNSF and UP - March 2014
Whiteside & AssociatesBillings, MT March 2014, email: [email protected]
180% of Variable Threshold of Unreasonable Challenge
Two Avenues to Address High Rate Structures
1.The Surface Transportation Board adjudicates railroad rate and service railroad cases
• The Alliance for Rail Competition and individual states (Commissions, Committees, Attorney Generals, etc.) can and do participate in STB cases or at the STB bar on behalf of the growers, merchandisers and their constituents
2.To change policy at the STB, requires legislative action• There is a Rail Customer Coalition operating in DC of which
the Alliance for Rail Competition, NAWG and the ACC together with other groups, actively participating and working to educate policymakers about the rail shipper problems and regulatory/competition issues
• The “final solution” – i.e., east-west trans-con mergers (e.g., BN-NS and UP-CSXT or BN-CSXT and UP-NS).
• UP and CSXT cannot sustain billion dollar losses per year from the reduction in coal traffic. They will look to merge to create synergies (e.g., more efficient and less costly intermodal traffic) to help off-set these losses.
• Big Hurdles to accomplish this – may occur with working agreements first
• Result: Duopoly over the whole country
What I Worry About Re: Future Rail Mergers
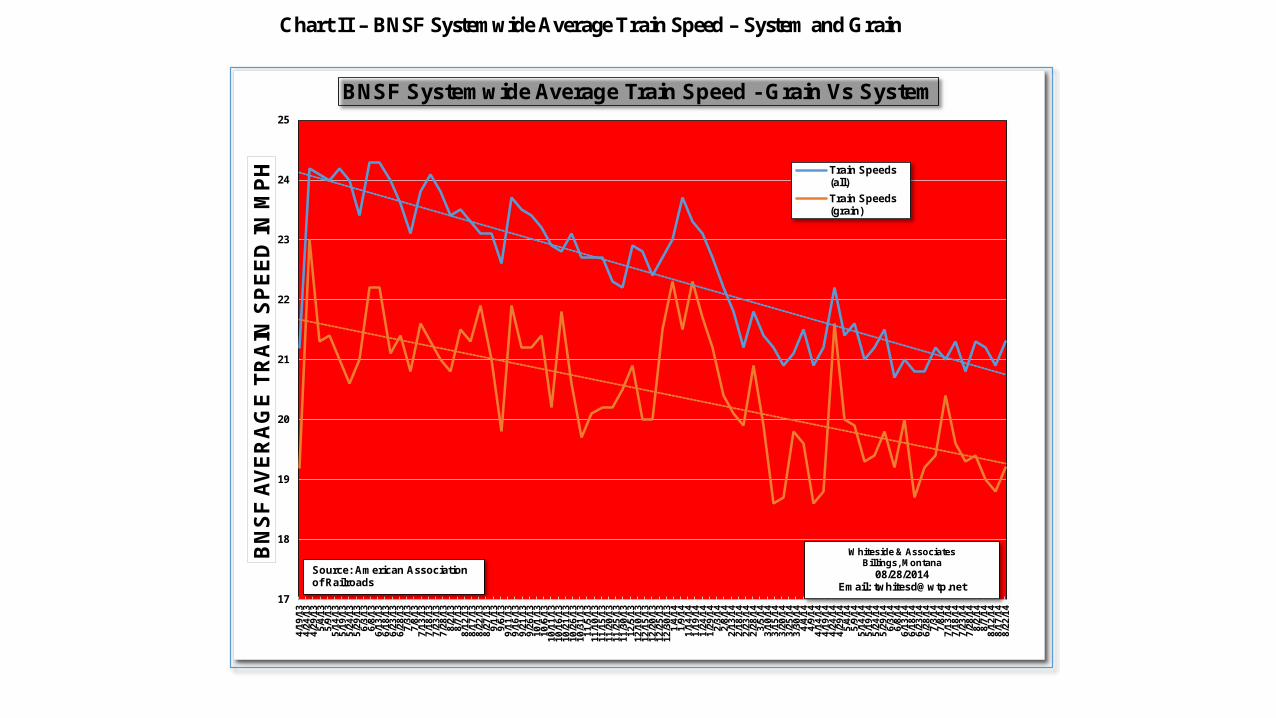
Chart II – BNSF Systemwide Average Train Speed – System and Grain
17
18
19
20
21
22
23
24
25
4/19
/13
4/24
/13
4/29
/13
5/4/
135/
9/13
5/14
/13
5/19
/13
5/24
/13
5/29
/13
6/3/
136/
8/13
6/13
/13
6/18
/13
6/23
/13
6/28
/13
7/3/
137/
8/13
7/13
/13
7/18
/13
7/23
/13
7/28
/13
8/2/
138/
7/13
8/12
/13
8/17
/13
8/22
/13
8/27
/13
9/1/
139/
6/13
9/11
/13
9/16
/13
9/21
/13
9/26
/13
10/1
/13
10/6
/13
10/1
1/1
310
/16/
13
10/2
1/1
310
/26/
13
10/3
1/1
311
/5/1
311
/10/
13
11/1
5/1
311
/20/
13
11/2
5/1
311
/30/
13
12/5
/13
12/1
0/1
312
/15/
13
12/2
0/1
312
/25/
13
12/3
0/1
31/
4/14
1/9/
141/
14/1
41/
19/1
41/
24/1
41/
29/1
42/
3/14
2/8/
142/
13/1
42/
18/1
42/
23/1
42/
28/1
43/
5/14
3/10
/14
3/15
/14
3/20
/14
3/25
/14
3/30
/14
4/4/
144/
9/14
4/14
/14
4/19
/14
4/24
/14
4/29
/14
5/4/
145/
9/14
5/14
/14
5/19
/14
5/24
/14
5/29
/14
6/3/
146/
8/14
6/13
/14
6/18
/14
6/23
/14
6/28
/14
7/3/
147/
8/14
7/13
/14
7/18
/14
7/23
/14
7/28
/14
8/2/
148/
7/14
8/12
/14
8/17
/14
8/22
/14
BN
SF
AV
ER
AG
E T
RA
IN S
PE
ED
IN
MP
H
BNSF Systemwide Average Train Speed - Grain Vs System
Train Speeds(all)
Train Speeds(grain)
Whiteside & AssociatesBillings, Montana
08/28/2014 Email: [email protected]
Source: American Association of Railroads

Poor Service =
Tighter Capacity =
Higher Prices for Traditional Commodities
Increasing Coal, Oil and Intermodal Spell Capacity Problems
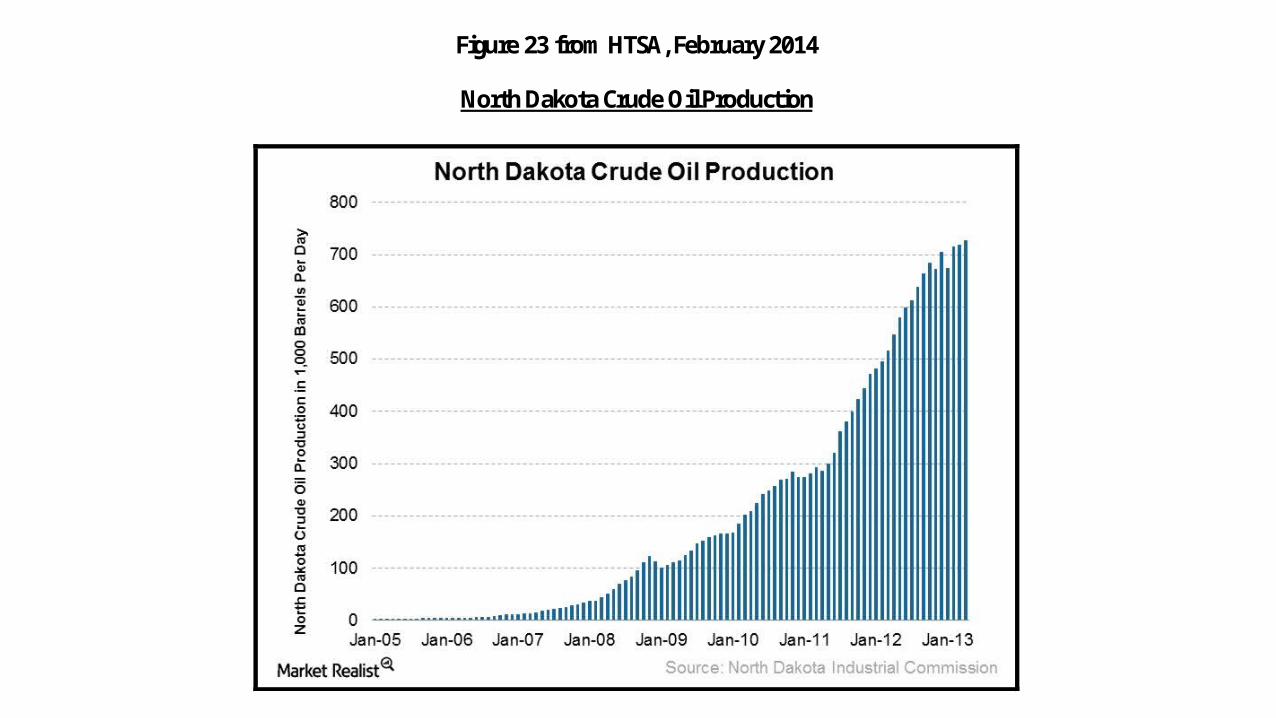
Figure 23 from HTSA, February 2014
North Dakota Crude Oil Production
23
0
20,000
40,000
60,000
80,000
100,000
120,000
140,000
160,000
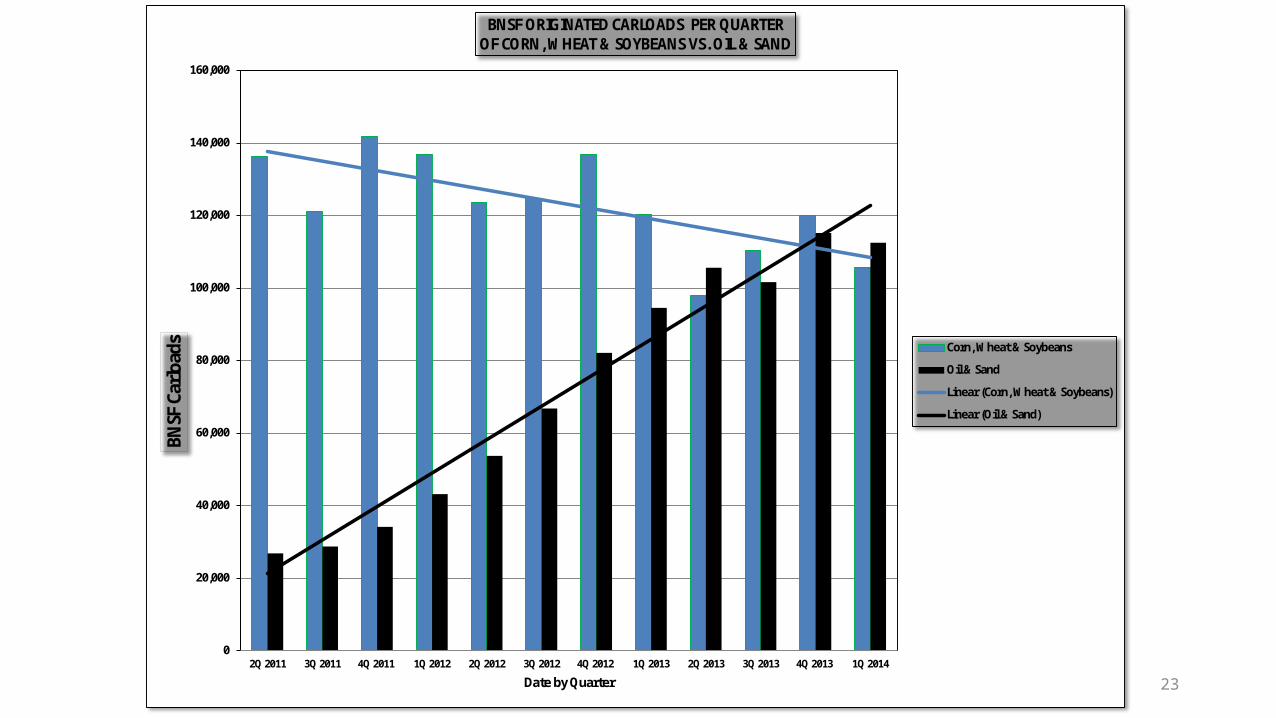
2Q 2011 3Q 2011 4Q 2011 1Q 2012 2Q 2012 3Q 2012 4Q 2012 1Q 2013 2Q 2013 3Q 2013 4Q 2013 1Q 2014
BNSF
Car
load
s
Date by Quarter
BNSF ORIGINATED CARLOADS PER QUARTEROF CORN, WHEAT & SOYBEANS VS. OIL & SAND
Corn, Wheat & Soybeans
Oil & Sand
Linear (Corn, Wheat & Soybeans)
Linear (Oil & Sand)
24
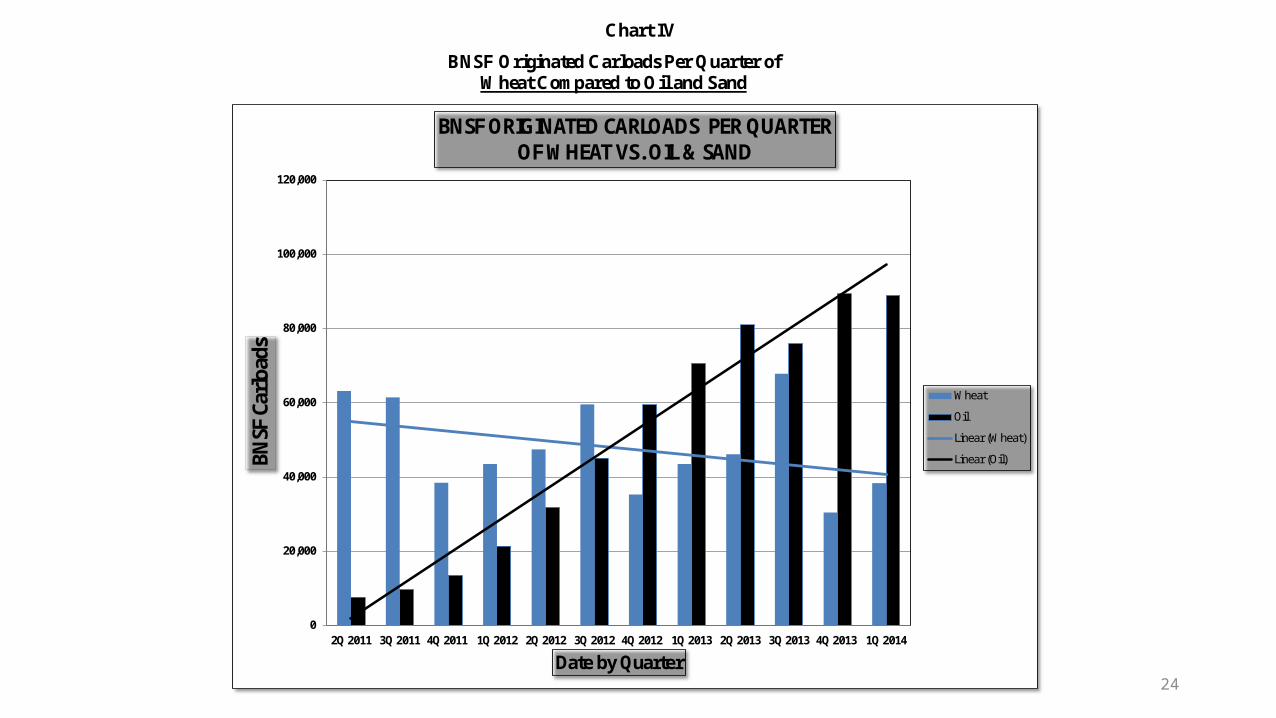
Chart IV
BNSF Originated Carloads Per Quarter of Wheat Compared to Oil and Sand
0
20,000
40,000
60,000
80,000
100,000
120,000
2Q 2011 3Q 2011 4Q 2011 1Q 2012 2Q 2012 3Q 2012 4Q 2012 1Q 2013 2Q 2013 3Q 2013 4Q 2013 1Q 2014
BNSF
Car
load
s
Date by Quarter
BNSF ORIGINATED CARLOADS PER QUARTEROF WHEAT VS. OIL & SAND
Wheat
Oil
Linear (Wheat)
Linear (Oil)
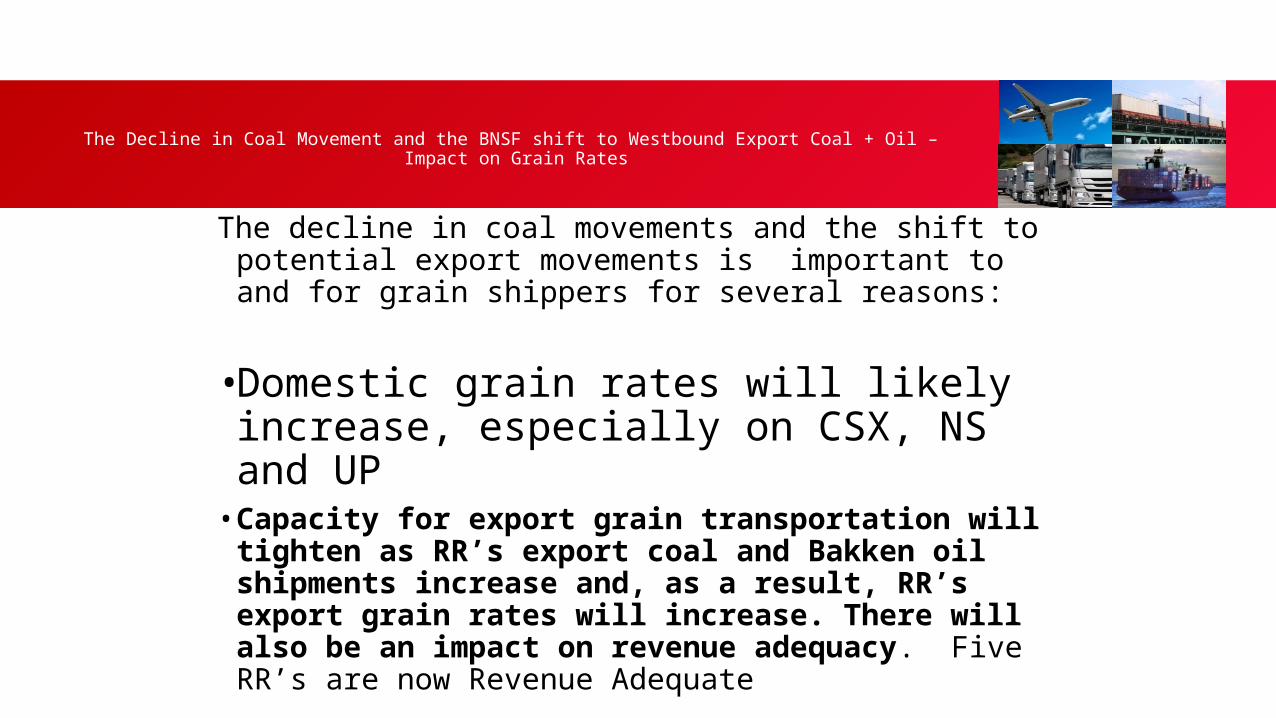
The decline in coal movements and the shift to potential export movements is important to and for grain shippers for several reasons:
•Domestic grain rates will likely increase, especially on CSX, NS and UP
• Capacity for export grain transportation will tighten as RR’s export coal and Bakken oil shipments increase and, as a result, RR’s export grain rates will increase. There will also be an impact on revenue adequacy. Five RR’s are now Revenue Adequate
The Decline in Coal Movement and the BNSF shift to Westbound Export Coal + Oil – Impact on Grain Rates
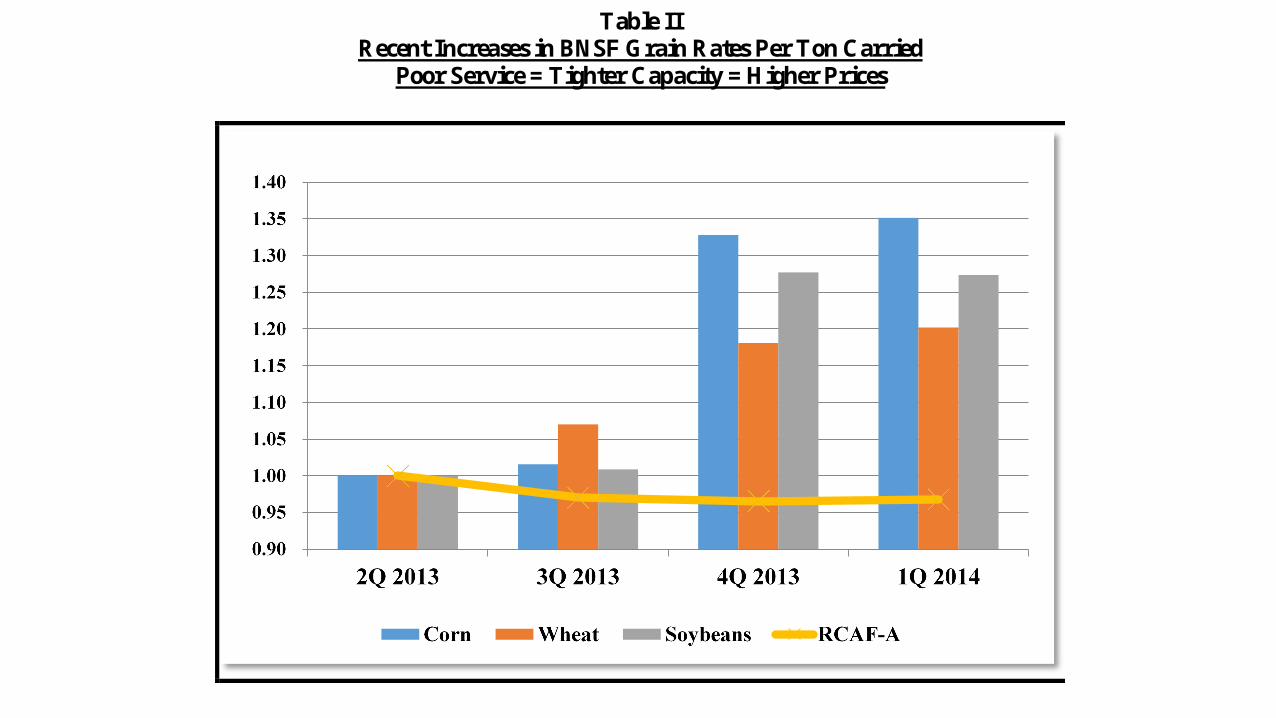
Table II Recent Increases in BNSF Grain Rates Per Ton Carried
Poor Service = Tighter Capacity = Higher Prices

The Danger is Ever PresentAll Oil Fires in Past 2 Years Bakken Oil
What Can The Communities/Government Do To Provide Mitigation/Planning?
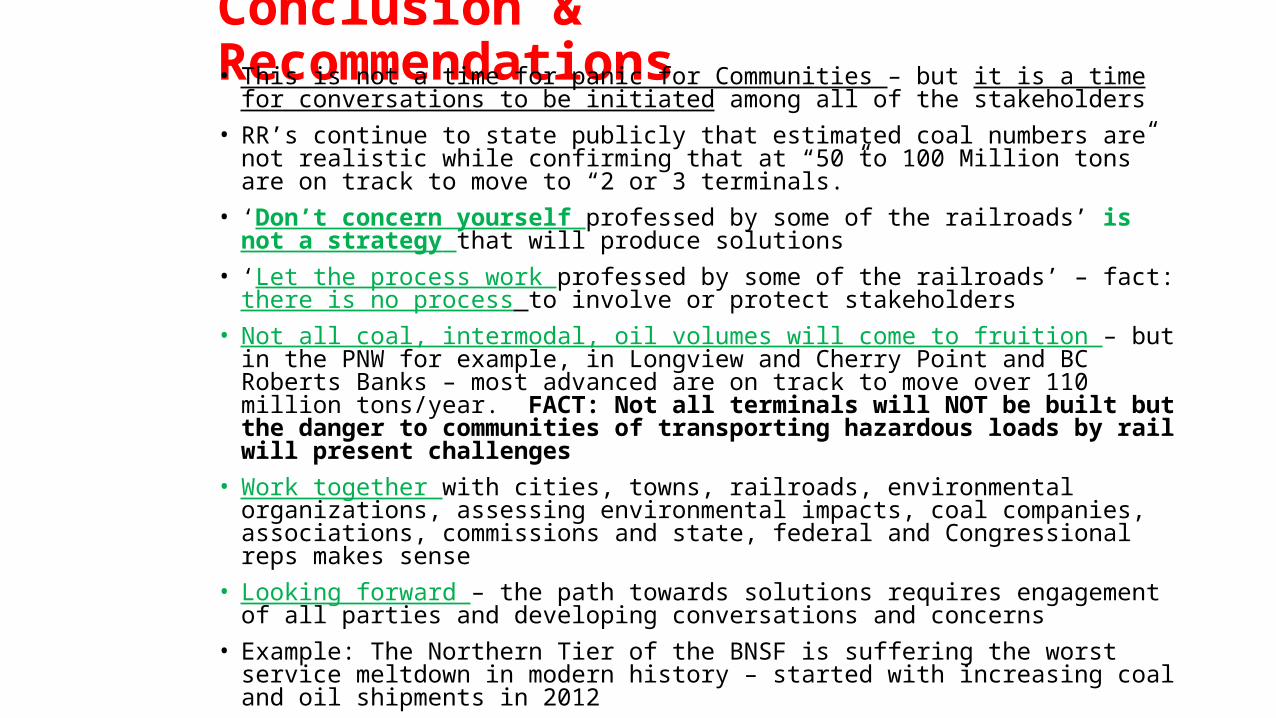
Conclusion & Recommendations• This is not a time for panic for Communities – but it is a time for conversations to be
initiated among all of the stakeholders
• RR’s continue to state publicly that estimated coal numbers are not realistic while confirming that at “50 to 100 Million tons” are on track to move to “2 or 3 terminals.”
• ‘Don’t concern yourself professed by some of the railroads’ is not a strategy that will produce solutions
• ‘Let the process work professed by some of the railroads’ – fact: there is no process to involve or protect stakeholders
• Not all coal, intermodal, oil volumes will come to fruition – but in the PNW for example, in Longview and Cherry Point and BC Roberts Banks – most advanced are on track to move over 110 million tons/year. FACT: Not all terminals will NOT be built but the danger to communities of transporting hazardous loads by rail will present challenges
• Work together with cities, towns, railroads, environmental organizations, assessing environmental impacts, coal companies, associations, commissions and state, federal and Congressional reps makes sense
• Looking forward – the path towards solutions requires engagement of all parties and developing conversations and concerns
• Example: The Northern Tier of the BNSF is suffering the worst service meltdown in modern history – started with increasing coal and oil shipments in 2012
• Cities and communities need to develop data or what impacts/solutions they need
• State DOT’s need to be pro-active with communities, transportation providers to help develop solutions and collaboration to mitigate expected impacts