white paper | procurement spend management: key elements ... · 25% white paper | procurement 3 1....
TRANSCRIPT

White Paper | Procurement
Spend Management: Key Elements for Realising Cost Savings in Procurement
Spend analysis creates an understanding of the organisation’s spend structure and enables decisions and actions to be based on facts rather than intuition.
White Paper | Procurement
Content
1. What is Spend Management? 3
2. How are Organisations Managing Spend? 3
3. Key Elements of Spend Analysis 4
4. Realising Spend Analysis Business Cases 5
5. Examples of our Experiences in Spend Management 7
in the Nordics
2 White Paper | Procurement
Introduction
Spend analysis forms a solid foundation for sourcing initiatives. It creates an
understanding of the organisation’s spend structure and enables actions to be based on
facts rather than intuition. However, spend analysis does not create a return on
investment itself: it just provides the necessary insight for focusing management’s
attention on the procurement projects that appear to promise the highest return on
investment.
In this white paper we discuss spend management and the actions that enable realising
the saving potential revealed by spend analysis. We describe leading practices in use
today, and present a path for achieving measurable cost savings in procurement.
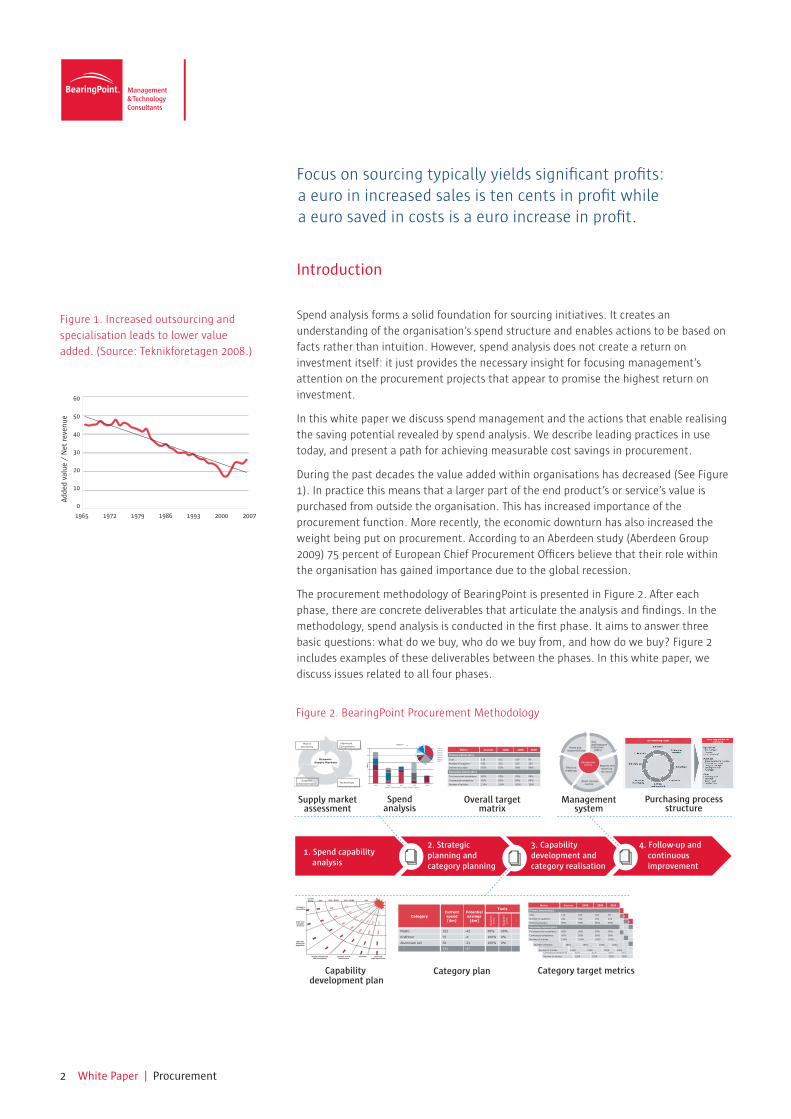
During the past decades the value added within organisations has decreased (See Figure
1). In practice this means that a larger part of the end product’s or service’s value is
purchased from outside the organisation. This has increased importance of the
procurement function. More recently, the economic downturn has also increased the
weight being put on procurement. According to an Aberdeen study (Aberdeen Group
2009) 75 percent of European Chief Procurement Officers believe that their role within
the organisation has gained importance due to the global recession.
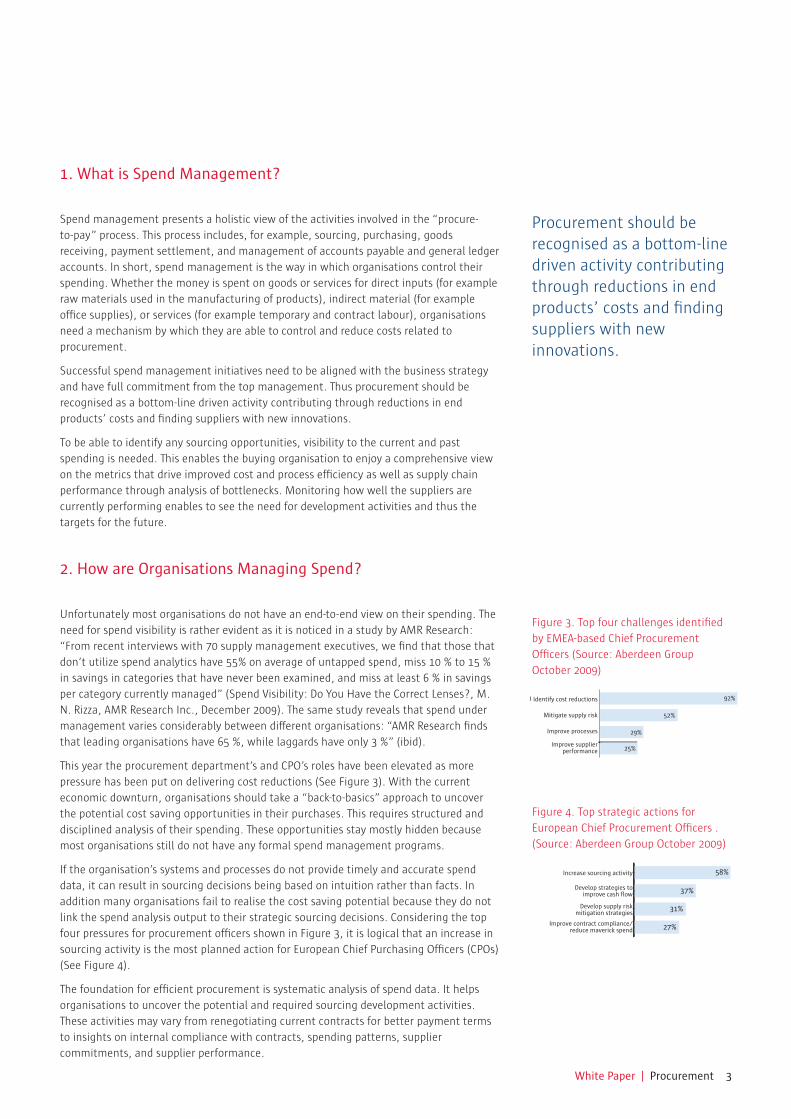
The procurement methodology of BearingPoint is presented in Figure 2. After each
phase, there are concrete deliverables that articulate the analysis and findings. In the
methodology, spend analysis is conducted in the first phase. It aims to answer three
basic questions: what do we buy, who do we buy from, and how do we buy? Figure 2
includes examples of these deliverables between the phases. In this white paper, we
discuss issues related to all four phases.
Figure 2. BearingPoint Procurement Methodology
Figure 1. Increased outsourcing and
specialisation leads to lower value
added. (Source: Teknikföretagen 2008.)
1965 1972 1979 1986 1993 2000 2007
60
50
40
30
20
10
0
Adde
d va
lue
/ N
et r
even
ue
Focus on sourcing typically yields significant profits: a euro in increased sales is ten cents in profit while a euro saved in costs is a euro increase in profit.
1. Spend capability analysis
3. Capability development and category realisation
4. Follow-up and continuous improvement
Supply marketassessment
Spendanalysis
Overall targetmatrix
Managementsystem
Purchasing processstructure
MacroEconomy
Market & Competition
SupplierCharacteristics Technology
DynamicSupply Markets
Category C
0
5
10
15
20
25
Unit A Unit B Unit C Unit D Unit E
MSEK
Supplier A Supplier B Supplier C Supplier D Supplier E Supplier F
32%
4%
25%
8%
5%
10%
13%
3%
Category ACategory BCategory CCategory DCategory ECategory FCategory GCategory H
Metric Current 2008 2009 2010
Primary metrics [$m]
Cost 110 105 100 90
Number of suppliers 420 350 250 200
Delivery accuracy 95% 95% 98% 98%
Secondary metrics [$m]
Purchase order compliance 85% 95% 95% 98%
Contractual compliance 90% 95% 99% 99%
Number of articles 1504 1504 1000 1000
Key performance indicators (KPIs)
Reports and reporting structure
Effective meetings
Roles and responsibilities
Management System
Short interval control
Capability development plan
Category plan Category target metrics
Metric Current 2008 2009 2010
Primary metrics [$m]
Cost 110 105 100 90
Number of suppliers 420 350 250 200
Delivery accuracy 95% 95% 98% 98%
Secondary metrics [$m]
Purchase order compliance 85% 95% 95% 98%
Contractual compliance 90% 95% 99% 99%
Number of articles 1504 1504 1000 1000
Metric Current 2008 2009 2010
Primary metrics [$m]
Cost 110 105 100 90
Number of suppliers 420 350 250 200
Delivery accuracy 95% 95% 98% 98%
Secondary metrics [$m]
Purchase order compliance 85% 95% 95% 98%
Contractual compliance 90% 95% 99% 99%
Number of articles 1504 1504 1000 1000
Metric Current 2008 2009 2010
Primary metrics [$m]
Cost 110 105 100 90
Number of suppliers 420 350 250 200
Delivery accuracy 95% 95% 98% 98%
Secondary metrics [$m]
Purchase order compliance 85% 95% 95% 98%
Contractual compliance 90% 95% 99% 99%
Number of articles 1504 1504 1000 1000
Metric Current 2008 2009 2010
Primary metrics [$m]
Cost 110 105 100 90
Number of suppliers 420 350 250 200
Delivery accuracy 95% 95% 98% 98%
Secondary metrics [$m]
Purchase order compliance 85% 95% 95% 98%
Contractual compliance 90% 95% 99% 99%
Number of articles 1504 1504 1000 1000
CategoryCurrent spend [$m]
Potential savings
[$m]
Tools
Volu
me
cons.
Supplie
r cons.
...
Plastic 102 -42 50% 50%
Kraftliner 75 -4 100% 0%
Aluminium coil 54 -21 100% 0%
" 231 -67
SMA, New Channels & Negotiation
Supplier Management and Development
Personnel
Strategy & Organization
Risks and Legal/Agreements
Current Reality 2009 2010 – Q1/Q2 2011
Value Chain & Supplier Structure
Systems, Tools &Measurement
WantedPosition
2010 – Q3/Q4
2. Strategicplanning and category planning
Identify cost reductions
Mitigate supply risk
Improve processes
Improve supplier performance
92%
52%
29%
25%
White Paper | Procurement 3
1. What is Spend Management?
Spend management presents a holistic view of the activities involved in the “procure-
to-pay” process. This process includes, for example, sourcing, purchasing, goods
receiving, payment settlement, and management of accounts payable and general ledger
accounts. In short, spend management is the way in which organisations control their
spending. Whether the money is spent on goods or services for direct inputs (for example
raw materials used in the manufacturing of products), indirect material (for example
office supplies), or services (for example temporary and contract labour), organisations
need a mechanism by which they are able to control and reduce costs related to
procurement.
Successful spend management initiatives need to be aligned with the business strategy
and have full commitment from the top management. Thus procurement should be
recognised as a bottom-line driven activity contributing through reductions in end
products’ costs and finding suppliers with new innovations.
To be able to identify any sourcing opportunities, visibility to the current and past
spending is needed. This enables the buying organisation to enjoy a comprehensive view
on the metrics that drive improved cost and process efficiency as well as supply chain
performance through analysis of bottlenecks. Monitoring how well the suppliers are
currently performing enables to see the need for development activities and thus the
targets for the future.
2. How are Organisations Managing Spend?
Unfortunately most organisations do not have an end-to-end view on their spending. The
need for spend visibility is rather evident as it is noticed in a study by AMR Research:
“From recent interviews with 70 supply management executives, we find that those that
don’t utilize spend analytics have 55% on average of untapped spend, miss 10 % to 15 %
in savings in categories that have never been examined, and miss at least 6 % in savings
per category currently managed” (Spend Visibility: Do You Have the Correct Lenses?, M.
N. Rizza, AMR Research Inc., December 2009). The same study reveals that spend under
management varies considerably between different organisations: “AMR Research finds
that leading organisations have 65 %, while laggards have only 3 %” (ibid).
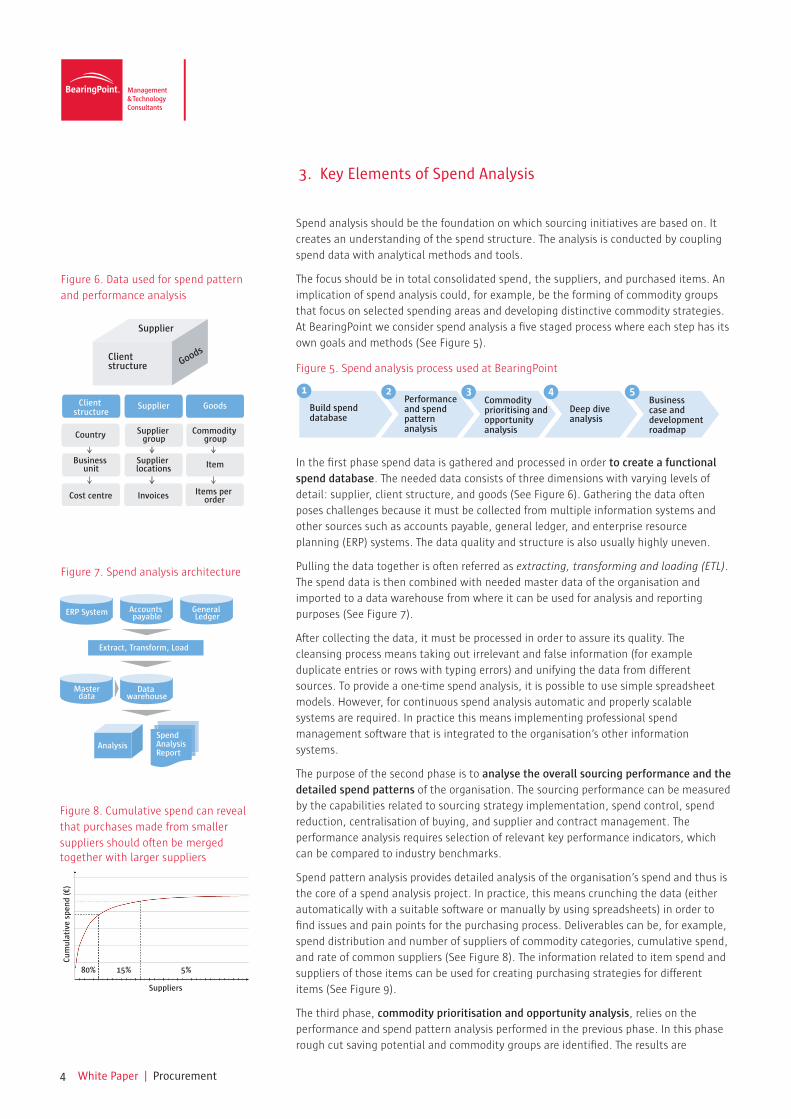
This year the procurement department’s and CPO’s roles have been elevated as more
pressure has been put on delivering cost reductions (See Figure 3). With the current
economic downturn, organisations should take a “back-to-basics” approach to uncover
the potential cost saving opportunities in their purchases. This requires structured and
disciplined analysis of their spending. These opportunities stay mostly hidden because
most organisations still do not have any formal spend management programs.
If the organisation’s systems and processes do not provide timely and accurate spend
data, it can result in sourcing decisions being based on intuition rather than facts. In
addition many organisations fail to realise the cost saving potential because they do not
link the spend analysis output to their strategic sourcing decisions. Considering the top
four pressures for procurement officers shown in Figure 3, it is logical that an increase in
sourcing activity is the most planned action for European Chief Purchasing Officers (CPOs)
(See Figure 4).
The foundation for efficient procurement is systematic analysis of spend data. It helps
organisations to uncover the potential and required sourcing development activities.
These activities may vary from renegotiating current contracts for better payment terms
to insights on internal compliance with contracts, spending patterns, supplier
commitments, and supplier performance.
Figure 3. Top four challenges identified
by EMEA-based Chief Procurement
Officers (Source: Aberdeen Group
October 2009)
Figure 4. Top strategic actions for
European Chief Procurement Officers .
(Source: Aberdeen Group October 2009)
Procurement should be recognised as a bottom-line driven activity contributing through reductions in end products’ costs and finding suppliers with new innovations.
58%
37%
31%
27%
Increase sourcing activity
Develop strategies to improve cash flow
Develop supply riskmitigation strategies
Improve contract compliance/reduce maverick spend
Identify cost reductions
Mitigate supply risk
Improve processes
Improve supplier performance
Increase sourcing activity
Develop strategies toimprove cash flow
Develop supply riskmitigation strategies
Improve contract compliance/reduce maverick spend
4 White Paper | Procurement
3. Key Elements of Spend Analysis
Spend analysis should be the foundation on which sourcing initiatives are based on. It
creates an understanding of the spend structure. The analysis is conducted by coupling
spend data with analytical methods and tools.
The focus should be in total consolidated spend, the suppliers, and purchased items. An
implication of spend analysis could, for example, be the forming of commodity groups
that focus on selected spending areas and developing distinctive commodity strategies.
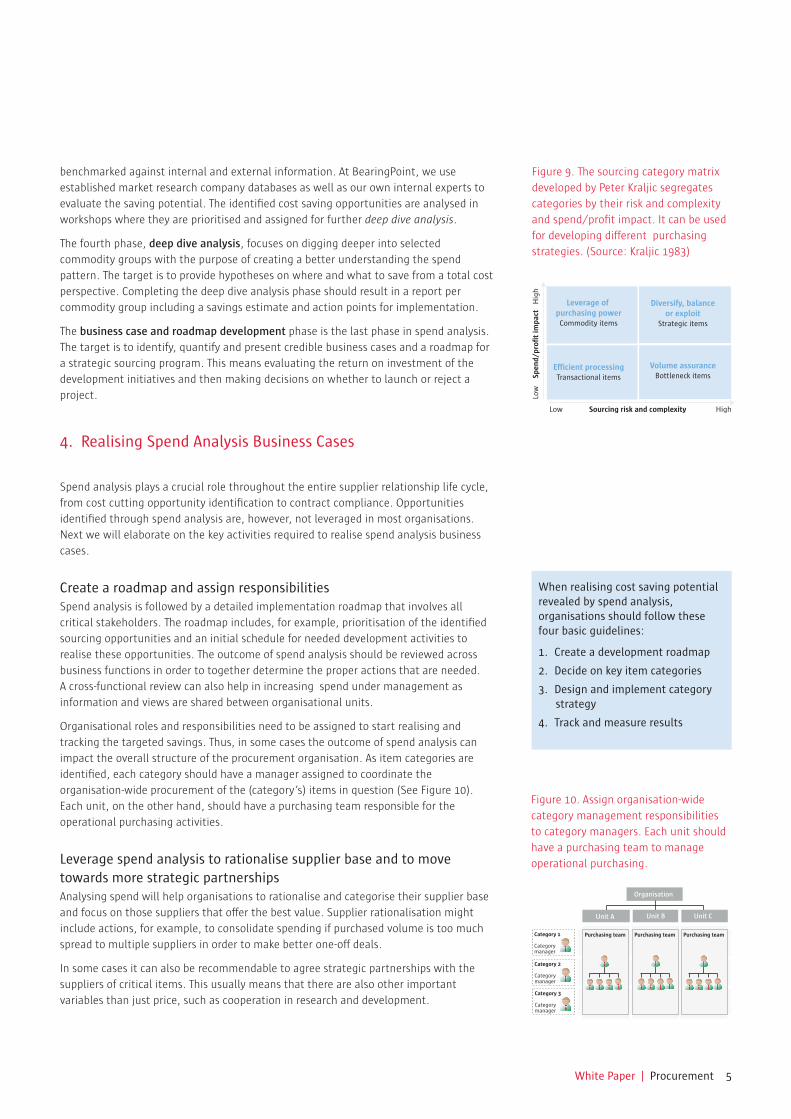
At BearingPoint we consider spend analysis a five staged process where each step has its
own goals and methods (See Figure 5).
In the first phase spend data is gathered and processed in order to create a functional spend database. The needed data consists of three dimensions with varying levels of
detail: supplier, client structure, and goods (See Figure 6). Gathering the data often
poses challenges because it must be collected from multiple information systems and
other sources such as accounts payable, general ledger, and enterprise resource
planning (ERP) systems. The data quality and structure is also usually highly uneven.
Pulling the data together is often referred as extracting, transforming and loading (ETL).
The spend data is then combined with needed master data of the organisation and
imported to a data warehouse from where it can be used for analysis and reporting
purposes (See Figure 7).
After collecting the data, it must be processed in order to assure its quality. The
cleansing process means taking out irrelevant and false information (for example
duplicate entries or rows with typing errors) and unifying the data from different
sources. To provide a one-time spend analysis, it is possible to use simple spreadsheet
models. However, for continuous spend analysis automatic and properly scalable
systems are required. In practice this means implementing professional spend
management software that is integrated to the organisation’s other information
systems.
The purpose of the second phase is to analyse the overall sourcing performance and the detailed spend patterns of the organisation. The sourcing performance can be measured
by the capabilities related to sourcing strategy implementation, spend control, spend
reduction, centralisation of buying, and supplier and contract management. The
performance analysis requires selection of relevant key performance indicators, which
can be compared to industry benchmarks.
Spend pattern analysis provides detailed analysis of the organisation’s spend and thus is
the core of a spend analysis project. In practice, this means crunching the data (either
automatically with a suitable software or manually by using spreadsheets) in order to
find issues and pain points for the purchasing process. Deliverables can be, for example,
spend distribution and number of suppliers of commodity categories, cumulative spend,
and rate of common suppliers (See Figure 8). The information related to item spend and
suppliers of those items can be used for creating purchasing strategies for different
items (See Figure 9).
The third phase, commodity prioritisation and opportunity analysis, relies on the
performance and spend pattern analysis performed in the previous phase. In this phase
rough cut saving potential and commodity groups are identified. The results are
Figure 5. Spend analysis process used at BearingPoint
Figure 6. Data used for spend pattern
and performance analysis
Figure 7. Spend analysis architecture
Figure 8. Cumulative spend can reveal
that purchases made from smaller
suppliers should often be merged together with larger suppliers
80% 15% 5%
Suppliers
Cum
ulat
ive
spen
d (€
)
Extract, Transform, Load
AnalysisSpendAnalysisReport
Data warehouse
Masterdata
ERP System Accounts payable
General Ledger
Supplier
Clientstructure Goods
Client structure
Country
Cost centre
Business unit
Supplier
Supplier group
Invoices
Supplier locations
Goods
Commodity group
Items per order
Item
Build spenddatabase
Performanceand spendpattern analysis
Commodityprioritising andopportunityanalysis
Deep diveanalysis
Businesscase anddevelopmentroadmap
1 2 3 4 5
White Paper | Procurement 5
benchmarked against internal and external information. At BearingPoint, we use
established market research company databases as well as our own internal experts to
evaluate the saving potential. The identified cost saving opportunities are analysed in
workshops where they are prioritised and assigned for further deep dive analysis.
The fourth phase, deep dive analysis, focuses on digging deeper into selected
commodity groups with the purpose of creating a better understanding the spend
pattern. The target is to provide hypotheses on where and what to save from a total cost
perspective. Completing the deep dive analysis phase should result in a report per
commodity group including a savings estimate and action points for implementation.
The business case and roadmap development phase is the last phase in spend analysis.
The target is to identify, quantify and present credible business cases and a roadmap for
a strategic sourcing program. This means evaluating the return on investment of the
development initiatives and then making decisions on whether to launch or reject a
project.
4. Realising Spend Analysis Business Cases
Spend analysis plays a crucial role throughout the entire supplier relationship life cycle,
from cost cutting opportunity identification to contract compliance. Opportunities
identified through spend analysis are, however, not leveraged in most organisations.
Next we will elaborate on the key activities required to realise spend analysis business
cases.
Create a roadmap and assign responsibilities Spend analysis is followed by a detailed implementation roadmap that involves all
critical stakeholders. The roadmap includes, for example, prioritisation of the identified
sourcing opportunities and an initial schedule for needed development activities to
realise these opportunities. The outcome of spend analysis should be reviewed across
business functions in order to together determine the proper actions that are needed.
A cross-functional review can also help in increasing spend under management as
information and views are shared between organisational units.
Organisational roles and responsibilities need to be assigned to start realising and
tracking the targeted savings. Thus, in some cases the outcome of spend analysis can
impact the overall structure of the procurement organisation. As item categories are
identified, each category should have a manager assigned to coordinate the
organisation-wide procurement of the (category’s) items in question (See Figure 10).
Each unit, on the other hand, should have a purchasing team responsible for the
operational purchasing activities.
Leverage spend analysis to rationalise supplier base and to move towards more strategic partnershipsAnalysing spend will help organisations to rationalise and categorise their supplier base
and focus on those suppliers that offer the best value. Supplier rationalisation might
include actions, for example, to consolidate spending if purchased volume is too much
spread to multiple suppliers in order to make better one-off deals.
In some cases it can also be recommendable to agree strategic partnerships with the
suppliers of critical items. This usually means that there are also other important
variables than just price, such as cooperation in research and development.
Figure 9. The sourcing category matrix
developed by Peter Kraljic segregates
categories by their risk and complexity
and spend/profit impact. It can be used
for developing different purchasing
strategies. (Source: Kraljic 1983)
When realising cost saving potential revealed by spend analysis, organisations should follow these four basic guidelines:
1. Create a development roadmap
2. Decide on key item categories
3. Design and implement category strategy
4. Track and measure results
Figure 10. Assign organisation-wide
category management responsibilities
to category managers. Each unit should
have a purchasing team to manage
operational purchasing.
Leverage of purchasing powerCommodity items
Efficient processingTransactional items
Diversify, balanceor exploit
Strategic items
Volume assuranceBottleneck items
Low Sourcing risk and complexity High
Low
S
pend
/pro
fit im
pact
H
igh
Organisation
Unit BUnit A
Category 1
Categorymanager
Category 2
Categorymanager
Category 3
Categorymanager
Unit C
Purchasing team Purchasing team Purchasing team

6 White Paper | Procurement
Gather facts to enable effective contract negotiationsTo be prepared for contract negotiations, organisations should estimate their bargaining
position and saving opportunities. Spend analysis is used to gather information of items’
purchasing volumes throughout the organisation as well as prices demanded by
different suppliers. The overall spend volume per supplier should be identified across all
business units. Revealing the complete spend volume and value helps to strengthen the
organisation’s position in the contract negotiations.
Getting the best price in the market requires also analysis on the supplier’s pricing
policy. In some cases the ordering policy might incur additional costs. For example,
transaction costs of ordering can be relatively higher if orders are made either too often
or in too small amounts. The organisation might also be bearing costs due to poor
delivery accuracy or, on the other hand, overly high reliability that is really not required.
Tightening credit access across industries due to the financial crisis is showing the
importance of cash availability. Therefore new and current contracts should be
renegotiated to gain better payment terms. In general, market knowledge is essential in
creating the right benchmark onto which the current contracts can be compared to.
Link spend analysis tightly with contract compliance and contract lifecycle managementStrategic sourcing can be viewed as a process that begins with spend analysis and
continues through contract execution to tracking of contract compliance. History has
repeatedly shown that even the best purchasing contracts deliver no savings if the
organisation and suppliers do not comply with them. Spend analysis and performance
management can help the procurement organisation to track compliance, identify
spending irregularities, and take needed corrective actions. Contract compliance
tracking can also help to identify potential product or service related issues that need to
be addressed by the supplier or through internal training.
Create metrics across all spend categories and utilise reports and dashboards to track changeBuilding key metrics for all spend categories helps to monitor progress and thus ensure
success in realising the cost saving targets and sourcing opportunities. The measures
range from understanding the current performance of a category to detailed specific
supplier performance metrics. It is also critical for procurement professionals to
maintain trustworthiness by tracking actual savings. Management often complains that
savings are identified but never realised or same savings are claimed for several projects.
Enhance the internal category, supply market, and sourcing process expertise Leveraging spend data to enable more informed sourcing decisions requires commodity
expertise within entire procurement organisation. Understanding the historical buying
patterns, accurate demand information, and clear purchasing requirements can enable
sourcing professionals to develop requests for proposals and negotiate better contracts.
This can lead to price discoveries and hence cost savings.
Building key metrics for all spend categories helps to monitor progress and thus ensure success in realising the cost saving targets and sourcing opportunities.
White Paper | Procurement 7
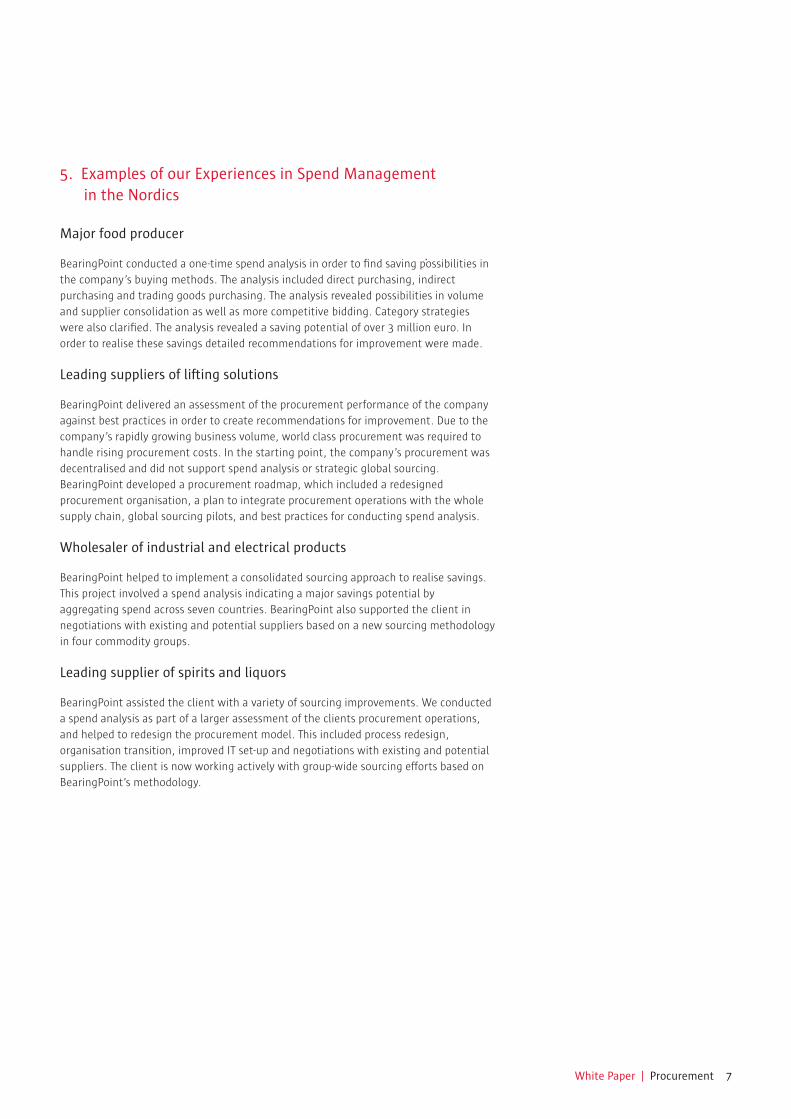
5. Examples of our Experiences in Spend Management in the Nordics
Major food producer
BearingPoint conducted a one-time spend analysis in order to find saving possibilities in
the company’s buying methods. The analysis included direct purchasing, indirect
purchasing and trading goods purchasing. The analysis revealed possibilities in volume
and supplier consolidation as well as more competitive bidding. Category strategies
were also clarified. The analysis revealed a saving potential of over 3 million euro. In
order to realise these savings detailed recommendations for improvement were made.
Leading suppliers of lifting solutions
BearingPoint delivered an assessment of the procurement performance of the company
against best practices in order to create recommendations for improvement. Due to the
company’s rapidly growing business volume, world class procurement was required to
handle rising procurement costs. In the starting point, the company’s procurement was
decentralised and did not support spend analysis or strategic global sourcing.
BearingPoint developed a procurement roadmap, which included a redesigned
procurement organisation, a plan to integrate procurement operations with the whole
supply chain, global sourcing pilots, and best practices for conducting spend analysis.
Wholesaler of industrial and electrical products
BearingPoint helped to implement a consolidated sourcing approach to realise savings.
This project involved a spend analysis indicating a major savings potential by
aggregating spend across seven countries. BearingPoint also supported the client in
negotiations with existing and potential suppliers based on a new sourcing methodology
in four commodity groups.
Leading supplier of spirits and liquors
BearingPoint assisted the client with a variety of sourcing improvements. We conducted
a spend analysis as part of a larger assessment of the clients procurement operations,
and helped to redesign the procurement model. This included process redesign,
organisation transition, improved IT set-up and negotiations with existing and potential
suppliers. The client is now working actively with group-wide sourcing efforts based on
BearingPoint’s methodology.
White Paper | Procurement
BearingPoint Finland Oy
Porkkalankatu 20
00180 Helsinki
www.bearingpoint.fi
© 2010 BearingPoint. All rights reserved. Printed in Finland.
We are BearingPoint. Management and Technology ConsultantsBearingPoint is an independent management and technology consultancy managed
and owned by its Partners throughout Europe. Serving commercial, financial and public
services clients, BearingPoint focuses on offering its clients the best possible value in
terms of tangible, measurable results by leveraging business and technology expertise.
Its seamless cross-border approach, an entrepreneurial culture, long-standing relations
with reputable organisations, profound industry and functional knowledge as well as
solutions customised to clients specific needs make the company a truly trusted
adviser. BearingPoint has European roots, but operates with a global reach.
To get there. Together.
Contact personsRiku Santala
Partner, BearingPoint
+358 40 532 2135
Samuli Syrjänen
Senior Consultant, BearingPoint
+358 40 708 8613