white paper on characteristics of emerging growth companies · about certain characteristics of...
TRANSCRIPT

Page 1
White Paper on Characteristics of Emerging Growth Companies
as of November 15, 20161
Kevin Murphy, CPA Manager Office of Research and Analysis Public Company Accounting Oversight Board
Tosha Williams Manager Office of Research and Analysis Public Company Accounting Oversight Board Harsha Samaraweera Senior Manager Office of Research and Analysis Public Company Accounting Oversight Board
1 This white paper was prepared by PCAOB staff and provides general information about certain characteristics of emerging growth companies. The views expressed herein are those of the authors and do not necessarily reflect the views of the Board, individual Board members, or PCAOB staff.

Page 2
SUMMARY
This white paper provides general information about certain characteristics of emerging growth companies ("EGCs")—a group defined by the Jumpstart Our Business Startups Act ("JOBS Act"). The information is derived from the most recent available U.S. Securities and Exchange Commission ("SEC") filings and data from third-party vendors through November 15, 2016, the most recent measurement date.
The white paper includes the following key observations as of November 15, 2016: There were 1,951 companies that identified themselves as EGCs in at least one
SEC filing since 2012 and have filed audited financial statements with the SEC in the 18 months preceding the measurement date ("EGC filers").2
There were 742 EGC filers (or 38%) that have common equity securities listed on
a U.S. national securities exchange ("exchange-listed"). These EGC filers represented 15% of the 4,797 exchange-listed companies and approximately 1% of total market capitalization of exchange-listed companies.
Many EGC filers that were not exchange-listed had limited operations.
Approximately 50% of the non-listed EGC filers reported zero revenue in their most recent filing with audited financial statements and 23% of non-listed EGCs that filed periodic reports disclosed that they were shell companies.
Approximately 51% of EGC filers, including 74% of those that were not
exchange-listed, received an explanatory paragraph in their most recent auditor's report expressing substantial doubt about the company's ability to continue as a going concern.
Among the 1,951 EGC filers, 1,262 provided a management report on internal
control over financial reporting in their most recent annual filing. Of those 1,262 companies, approximately 47% reported material weaknesses.
Approximately 96% of EGC filers were audited by accounting firms that also
audited issuers that are not EGC filers, including 39% of EGC filers that were audited by firms that provided audit reports for more than 100 issuers and were required to be inspected on an annual basis by the PCAOB.
2 The 1,951 EGC filers do not include companies that were not reporting as EGCs as of the measurement date, as follows:
(i) 200 companies that ceased to qualify as EGCs because of their annual revenue
or large accelerated filer status, (ii) 465 companies that ceased to be SEC registrants, and (iii) 414 companies that did not file audited financial statements with the SEC in the
18 months preceding the measurement date ("inactive EGCs").

Page 3
CONTENTS
I. BACKGROUND & METHODOLOGY .................................................................................................. 4
BACKGROUND ............................................................................................................................................. 4 METHODOLOGY ........................................................................................................................................... 5
II. GROWTH IN THE NUMBER OF EGC FILERS AND INACTIVE EGCS ............................................. 7
III. SECURITIES REGISTRATION AND EQUITY OFFERINGS BY EGC FILERS .................................. 9
PERIODIC REPORTING ................................................................................................................................. 9 EXCHANGE-LISTED EGC FILERS ................................................................................................................ 10
IV. INDUSTRY AND FINANCIAL CHARACTERISTICS OF EGC FILERS ............................................ 11
INDUSTRY ................................................................................................................................................. 11 ASSETS AND REVENUE .............................................................................................................................. 12 INTERNAL CONTROL OVER FINANCIAL REPORTING ...................................................................................... 13
V. SHELL COMPANIES AND LIMITED OPERATIONS AMONG EGC FILERS .................................. 13
EGC FILERS THAT REPORTED ZERO REVENUE IN 2013: WHERE ARE THEY NOW? ...................................... 14
VI. GOING CONCERN PARAGRAPHS IN AUDIT REPORTS OF EGC FILERS .................................. 15
VII. AUDITORS OF EGC FILERS ............................................................................................................. 16
APPENDIX A: ADDITIONAL INFORMATION ON EGC FILERS .............................................................. 17
APPENDIX B: INACTIVE EGCS ................................................................................................................ 21
APPENDIX C: COMPANIES THAT ARE NO LONGER EGC FILERS BECAUSE OF THEIR ANNUAL REVENUE OR LARGE ACCELERATED FILER STATUS ....................................................................... 22
APPENDIX D: COMPANIES THAT ARE NO LONGER EGC FILERS BECAUSE THEY ARE NO LONGER SEC REGISTRANTS ................................................................................................................. 23

Page 4
I. BACKGROUND & METHODOLOGY
Background Title I of the JOBS Act focuses on reducing regulatory burdens on EGCs in order to
facilitate capital raising through public markets.3 As relevant to this white paper, the JOBS Act generally provides that new PCAOB standards will not apply to the audits of EGCs unless the SEC determines that applying such additional requirements is necessary or appropriate in the public interest, after considering the protection of investors, and whether the action will promote efficiency, competition, and capital formation.4 To implement this provision, upon adoption of a rule subject to this determination, the PCAOB recommends to the SEC whether the rule should apply to audits of EGCs, and submits information and analysis in its adopting release to assist the SEC in making a determination. This white paper provides general data about EGCs to inform the analysis contained in PCAOB rulemaking releases regarding the impact of applying new standards to the audits of EGCs.
PCAOB staff anticipates updating the white paper semiannually, based on the most
recent data available as of May 15 and November 15 in each year.
Generally, a company qualifies as an EGC if it had less than $1 billion in annual revenues in its most recently completed fiscal year and had not sold common equity securities on or before December 8, 2011, pursuant to a registration statement under the Securities Act of 1933 ("Securities Act").5 The company retains its EGC status until the earliest of:
(i) the last day of the first fiscal year in which the company's annual gross revenues are $1 billion6 or more;
3 Pub. L. No. 112-106 (April 5, 2012). See Section 103(a)(3)(C) of the Sarbanes-Oxley Act of 2002 ("Sarbanes-Oxley Act"), 15 U.S.C. 7213(a)(3), as added by Section 104 of the JOBS Act.
4 See Section 103(a)(3)(C) of the Sarbanes-Oxley Act of 2002, as added by Section 104 of the JOBS Act, which provides:
Any rules of the Board requiring mandatory audit firm rotation or a supplement to the auditor’s report in which the auditor would be required to provide additional information about the audit and the financial statements (auditor discussion and analysis) shall not apply to an audit of an emerging growth company, as defined in section 3 of the Securities Exchange Act of 1934. Any additional rules adopted by the Board after [April 5, 2012] shall not apply to an audit of an emerging growth company, unless the Commission determines that the application of such additional requirements is necessary or appropriate in the public interest, after considering the protection of investors, and whether the action will promote efficiency, competition, and capital formation. 5 See Section 3(a)(80) of the Securities Exchange Act of 1934 ("Exchange Act")
and Section 101(d) of the JOBS Act. 6 The $1 billion annual gross revenue threshold is indexed for inflation every five
years to reflect the change in the Consumer Price Index.

Page 5
(ii) the date on which the company is deemed to be a "large accelerated filer" under the Exchange Act (generally, an issuer with a public float of $700 million or more that has been subject to Exchange Act periodic reporting requirements for at least one year and has filed at least one annual report);
(iii) the date on which the company has issued more than $1 billion in non-convertible debt during the prior three year period; or
(iv) the last day of the fiscal year after the fifth anniversary of the company's first sale of common equity securities under an effective Securities Act registration statement.
Methodology
PCAOB staff identified the population of EGCs using commercial vendor data about companies that, as of the most recent measurement date, self-identified as EGCs in at least one SEC filing since 2012.7 The analysis excludes 465 companies that, as of the most recent measurement date, had (i) terminated their Exchange Act registration, (ii) had their Exchange Act registration revoked, or (iii) withdrawn their registration statement before effectiveness, and, in each case, did not subsequently file audited financial statements with the SEC. The analysis also excludes 200 companies that were identified in a later SEC filing as no longer qualifying as EGCs (for example those that reported $1 billion or more in annual revenues) and companies whose financial statements may be, but are not required to be, audited under PCAOB standards. Using this methodology, the PCAOB staff identified 1,951 companies that have identified themselves as EGCs in at least one SEC filing since 2012 and have filed audited financial statements with the SEC in the 18 months preceding the measurement date ("EGC filers"). An additional 414 companies had previously identified themselves as EGCs but did not file audited financial statements with the SEC in the 18 months preceding the measurement date ("inactive EGCs").
The financial information presented is derived from the most recent annual financial
statements filed with the SEC as of the measurement date. This data is obtained using commercial vendor data, supplemented with manually collected data from SEC filings, when necessary.
The white paper describes characteristics of EGC filers and inactive EGCs separately. The analysis focuses primarily on EGC filers, for which information is more current and reflects a more recent experience of an audit conducted under PCAOB standards. Because available information regarding inactive EGCs is potentially stale, the analysis of these is more limited.
The growth in the number of EGC filers and inactive EGCs is presented in Section II. Sections III through VII address EGC filers. Appendix A provides additional information about the population of EGC filers, while Appendix B provides additional information about inactive
7 The PCAOB staff used commercial vendor data to identify the population of EGCs from SEC filings. SEC filings used to determine the population of companies that self-identified as an EGC include all Securities Act registration statements, Regulation A offering statements where a concurrent Exchange Act registration is filed, Exchange Act registration statements, and Exchange Act periodic reports. Not all companies that are EGCs identify as EGCs in all SEC filings.

Page 6
EGCs. Appendix C provides information about companies that are no longer EGC filers because of annual revenue in excess of $1 billion or large accelerated filer status. Appendix D provides information about companies that are no longer EGC filers (or inactive EGCs) because they are no longer SEC registrants.
In various cross sectional analyses in this document, the population of EGC filers is further divided between companies that have at least one class of common equity securities listed on a U.S. national securities exchange ("exchange-listed" EGC filers)8 and those that do not ("non-listed" EGC filers).9 PCAOB staff identified 742 exchange-listed EGC filers and 1,209 non-listed EGC filers as of November 15, 2016.
To compare the exchange-listed EGC filer population with the broader public equity market, the analysis below also presents a benchmark derived from commercial vendor data on other exchange-listed companies. The benchmark population is limited to exchange-listed companies that are not investment companies10 and that have filed audited financial statements with the SEC in the 18 months preceding the most recent measurement date. From a total population of 4,797 exchange-listed companies, the 742 exchange-listed EGC filers are excluded to allow for comparison of companies that are EGCs to those that are not. Using this methodology, PCAOB staff identified 4,055 companies in the benchmark population ("other exchange-listed companies") as of November 15, 2016. These exchange-listed companies tend to be larger and generally have a longer reporting history than EGC filers; these attributes may also correlate with other characteristics described in this paper.
The paper does not present a similar benchmark population or data on market capitalization for non-listed EGC filers. Market data may not be reliable or even regularly available with respect to issuers whose securities are quoted on the over-the-counter market or are otherwise illiquid. In addition, issuers whose only publicly-traded securities are debt securities do not have equity market capitalizations. These inherent limitations of available data limit our ability to make useful comparisons among non-listed EGC filers.
The above methodology is applied as of each measurement date. This paper focuses on data as of the most recent measurement date (November 15, 2016) but also provides time series data about the population of EGCs as of previous measurement dates.
8 The PCAOB staff obtained exchange-listed company information as of the measurement date derived from Standard & Poor’s Xpressfeed data on all active issue types of "common-ordinary," "units with a common share component," and "depository receipts" where the exchange is a U.S. national securities exchange with available market capitalization data. As of November 15, 2016, EGC filers had primary listings of common equity securities on the following U.S. national securities exchanges: the New York Stock Exchange LLC, Nasdaq Stock Market LLC, NYSE MKT LLC, and NYSE Arca, Inc.
9 Non-listed EGC filers include companies whose securities are traded over-the-counter or have no public market.
10 Registered investment companies (other than business development companies) do not qualify as emerging growth companies. See SEC Division of Corporation Finance, Jumpstart Our Business Startups Act Frequently Asked Questions, Q. 20.

Page 7
As previously indicated, the EGC filer and inactive EGC populations are derived using data from a commercial vendor based on companies' self-identification as EGCs in filings with the SEC. Self-identification data may understate or overstate these populations if companies fail to self-identify or self-identify erroneously. In addition, the populations will be overstated if there are companies that no longer qualify as EGCs but are not excluded from the population of EGCs identified by the third-party vendor (for example, because of a lack of known information about a change in status). Accordingly, the population of companies that meet the statutory definition of "emerging growth company" as of a specific measurement date may be larger or smaller than the population analyzed in this white paper.
II. GROWTH IN THE NUMBER OF EGC FILERS AND INACTIVE EGCS
The number of EGC filers has grown since the enactment of the JOBS Act, but has stabilized recently. The number of inactive EGCs has also grown. Figure 1 depicts each of these populations at specific measurement dates used by PCAOB staff to analyze the populations between June 2012 and November 2016. The sum of EGC filers and inactive EGCs, as of each measurement date, is also presented.
Changes in the populations of self-identified EGCs depicted above are affected by EGCs entering the population and EGCs leaving the population. From April 5, 2012 through November 15, 2016 there were 200 companies that ceased to qualify as EGCs because of their annual

Page 8
revenue or large accelerated filer status.11 Further information on the industries of these companies is included in Appendix C. Additionally, there were 465 companies that previously identified as EGCs but then ceased to be SEC registrants. Specifically, these 465 companies had (i) terminated their Exchange Act registration, (ii) had their Exchange Act registration revoked, or (iii) withdrawn their registration statement before effectiveness, and, in each case, did not subsequently file audited financial statements with the SEC. Further information on the industries of these companies is included in Appendix D.
The number of EGC filers has stabilized recently – it increased by less than 1% at the November 15, 2016 measurement date. Between May 15, 2016 and November 15, 2016, 207 companies became EGC filers12 and 203 ceased to be EGC filers. The 203 companies include:
136 companies that became inactive EGCs, 4 companies that ceased to qualify as EGCs because of their annual revenue or
large accelerated filer status, and 63 companies that previously identified as EGCs but then ceased to be SEC
registrants.
The trend in the rates of change between successive measurement dates is depicted in Figure 2.
11 PCAOB staff observed that the overwhelming majority of SEC registrants that ceased to qualify as EGCs did so because their annual revenue exceeded $1 billion or they became a large accelerated filer rather than only because of issuance of more than $1 billion in non-convertible debt.
12 See Table A.7 in Appendix A for information on form types used to identify the 207 new EGC filers.

Page 9
As of November 15, 2016, there were 414 inactive EGCs, compared to 312 as of May 15, 2016.
The discussion in sections III through VII and Appendix A focuses primarily on EGC filers.
III. SECURITIES REGISTRATION AND EQUITY OFFERINGS BY EGC FILERS
Periodic Reporting The population of EGC filers includes both (i) EGCs that have filed periodic reports with
the SEC and (ii) EGCs that have filed registration statements but have not yet filed periodic reports. As shown in Figure 3, the percentage of EGC filers that have filed periodic reports has been increasing.13 As of November 15, 2016, approximately 87% of the 1,951 EGC filers have filed periodic reports. The remaining 13% (or 248) have filed audited financial statements in registration statements but have not yet filed periodic reports.
As of November 15, 2016, 75% of EGC filers had filed their first periodic report in 2012 or later. (See Table 1.) The length of time an EGC has been filing periodic reports provides an approximation of the length of time since the EGC completed a public offering.14
13 For the purpose of identifying EGCs that filed periodic reports as noted in Figure 3, PCAOB staff used commercial vendor data to identify companies that filed the following SEC Form submission types: 10-K, 10-Q, 20-F, and 40-F.
14 Companies that completed a registered public offering of equity securities on or before December 8, 2011, are not eligible to be EGCs. A company that qualifies as an EGC may have filed periodic reports prior to December 8, 2011 if the company had previously

Page 10
Exchange-Listed EGC Filers Approximately 38%, or 742, of the 1,951 EGC filers are exchange-listed. These 742
EGC filers represent 15% of all exchange-listed companies. As Figure 4 shows, total market capitalization for exchange-listed EGC filers has fluctuated with changes in the population of exchange-listed EGC filers and changes in their market value. All references to market capitalization represent global market capitalization in the case of companies that are listed on exchanges in multiple countries.
As of November 15, 2016, the 742 exchange-listed EGC filers had $350 billion in market
capitalization. These exchange-listed EGC filers represented 1% of the market capitalization of all exchange-listed companies. The market capitalization of exchange-listed EGC filers increased from $243 billion at May 15, 2016 to $350 billion at November 15, 2016. The 207 companies that became EGC filers between May 15, 2016 and November 15, 2016 accounted for approximately 14% of the total market capitalization of exchange-listed EGC filers.
Additional information on the number of EGC filers and exchange-listed companies by filer status under SEC rules (e.g., accelerated filer and large accelerated filer) is included in Table A.1 in Appendix A.
registered its securities under the Exchange Act without completing a public offering or had publicly issued only debt securities.

Page 11
IV. INDUSTRY AND FINANCIAL CHARACTERISTICS OF EGC FILERS
Industry EGCs operate in many industries. Overall, the five most common Standard Industrial
Classification ("SIC") codes reported for EGC filers as of the measurement date are: (i) pharmaceutical preparations; (ii) blank check companies;15 (iii) real estate investment trusts; (iv) prepackaged software; and (v) surgical/medical instruments and apparatus. The proportion of EGC filers reporting the five most common SIC codes is summarized in Figure 5. Sixty-eight percent of EGC filers did not report being in these top five industries, including 65% of EGC filers that reported other SIC codes and 3% that did not report a SIC code in their SEC filings.
See Table A.2 in Appendix A for more detailed industry data on exchange-listed EGC filers, non-listed EGC filers, and other exchange-listed companies. Exchange-listed EGC filers are more concentrated in their top five industries than other exchange-listed companies. Larger proportions of exchange-listed EGC filers, as compared to other EGC filers and other exchange-listed companies, are concentrated in SIC codes related to health and life sciences, including: (i) pharmaceutical preparations and (ii) biological products.
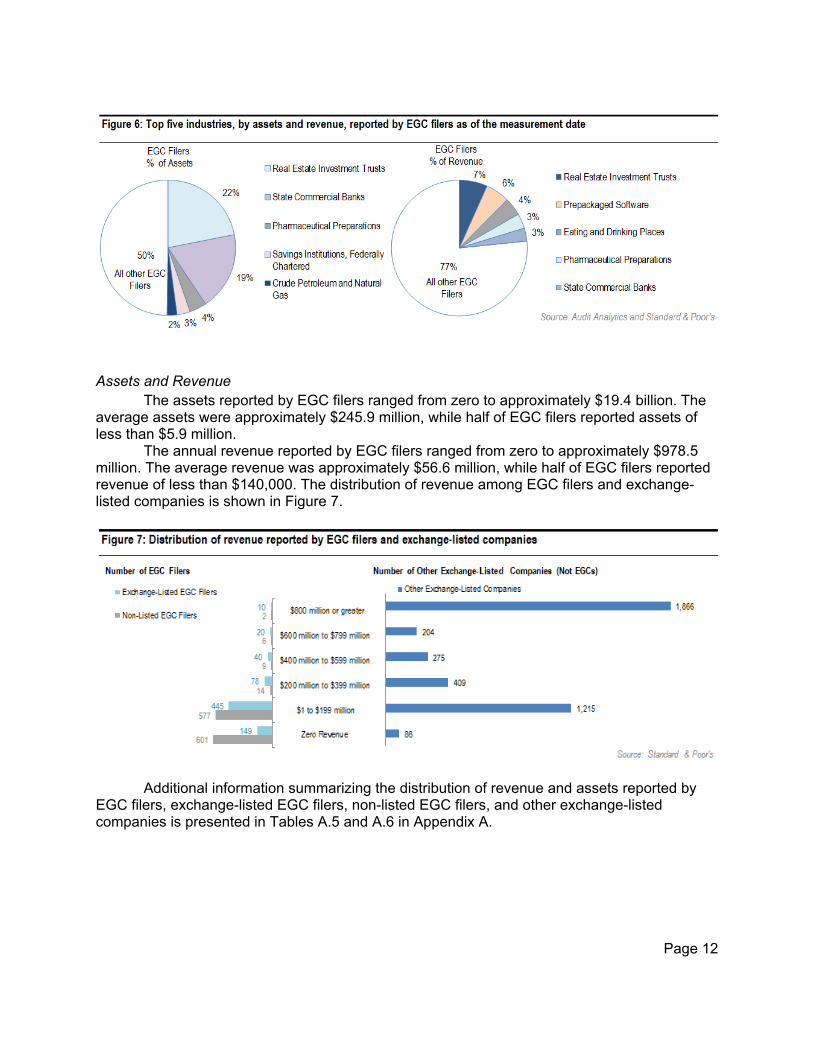
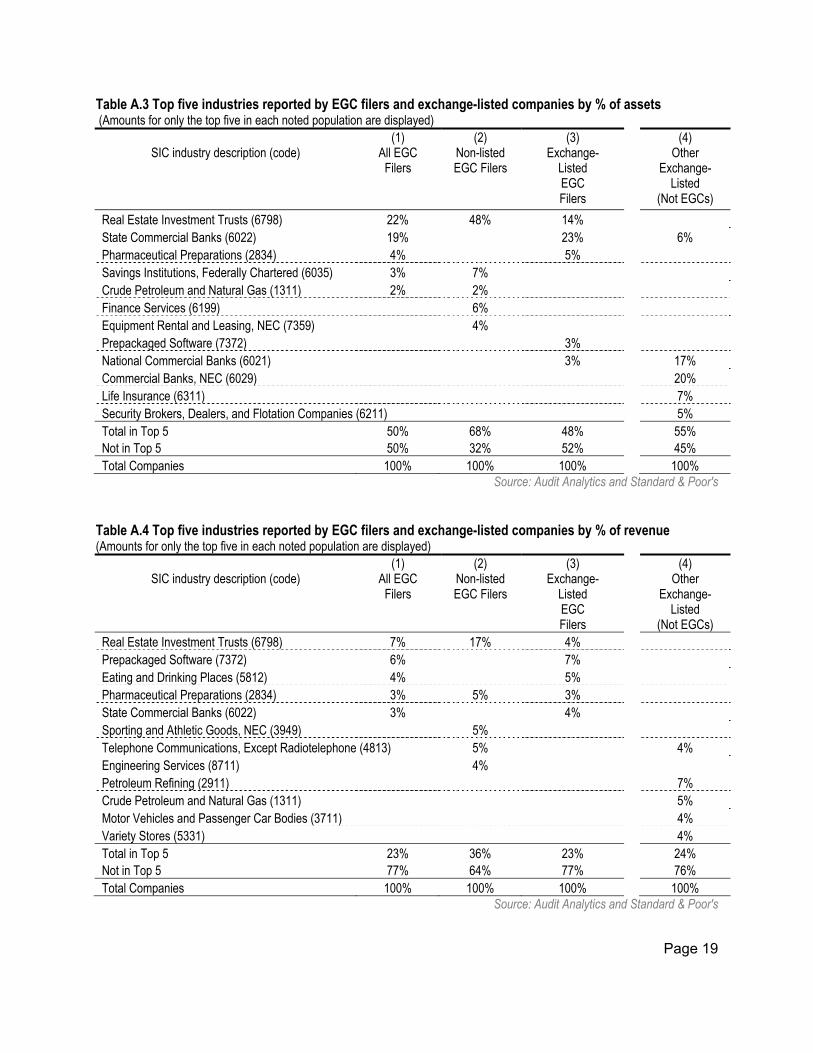
The five SIC codes with the highest total assets as a percentage of the total assets for the EGC filer population as of the measurement date are: (i) real estate investment trusts; (ii) state commercial banks; (iii) pharmaceutical preparations; (iv) federally chartered savings institutions; and (v) crude petroleum and natural gas. Total assets of EGC filers reporting these five SIC codes represent approximately 50% of the total assets of EGC filers. Figure 6 provides a summary of this information as well as an analogous summary by revenue. See Tables A.3 and A.4 in Appendix A for more detailed industry data for EGC filers, exchange-listed EGC filers, non-listed EGC filers, and other exchange-listed companies.
15 The classification of "blank check company" generally means a development stage company that has no specific business plan or purpose or has indicated that its business plan is to engage in a merger or acquisition with an unidentified company or companies, or other entity or person. See Securities Act Rule 419, 17 CFR 230.419.
Page 12
Assets and Revenue
The assets reported by EGC filers ranged from zero to approximately $19.4 billion. The average assets were approximately $245.9 million, while half of EGC filers reported assets of less than $5.9 million.
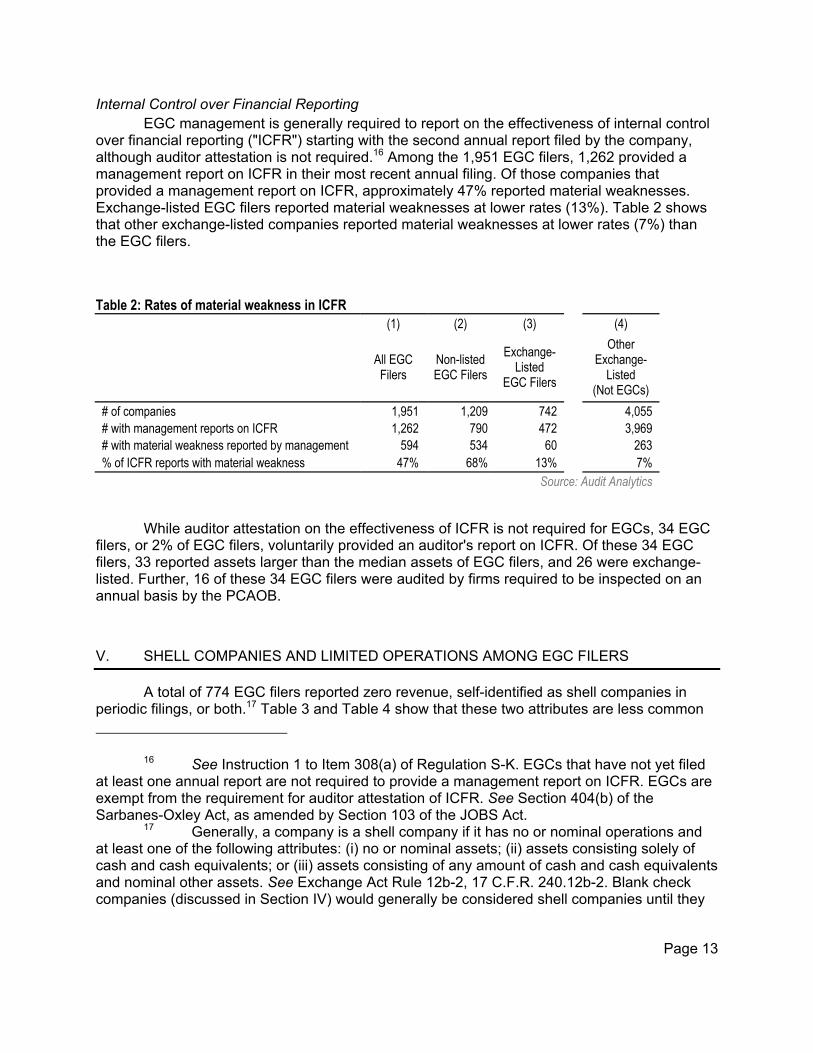
The annual revenue reported by EGC filers ranged from zero to approximately $978.5 million. The average revenue was approximately $56.6 million, while half of EGC filers reported revenue of less than $140,000. The distribution of revenue among EGC filers and exchange-listed companies is shown in Figure 7.
Additional information summarizing the distribution of revenue and assets reported by EGC filers, exchange-listed EGC filers, non-listed EGC filers, and other exchange-listed companies is presented in Tables A.5 and A.6 in Appendix A.
Page 13
Internal Control over Financial Reporting EGC management is generally required to report on the effectiveness of internal control
over financial reporting ("ICFR") starting with the second annual report filed by the company, although auditor attestation is not required.16 Among the 1,951 EGC filers, 1,262 provided a management report on ICFR in their most recent annual filing. Of those companies that provided a management report on ICFR, approximately 47% reported material weaknesses. Exchange-listed EGC filers reported material weaknesses at lower rates (13%). Table 2 shows that other exchange-listed companies reported material weaknesses at lower rates (7%) than the EGC filers.
Table 2: Rates of material weakness in ICFR (1) (2) (3) (4)
All EGC Filers
Non-listed EGC Filers
Exchange-Listed
EGC Filers
Other Exchange-
Listed (Not EGCs)
# of companies 1,951 1,209 742 4,055 # with management reports on ICFR 1,262 790 472 3,969 # with material weakness reported by management 594 534 60 263 % of ICFR reports with material weakness 47% 68% 13% 7%
Source: Audit Analytics
While auditor attestation on the effectiveness of ICFR is not required for EGCs, 34 EGC filers, or 2% of EGC filers, voluntarily provided an auditor's report on ICFR. Of these 34 EGC filers, 33 reported assets larger than the median assets of EGC filers, and 26 were exchange-listed. Further, 16 of these 34 EGC filers were audited by firms required to be inspected on an annual basis by the PCAOB.
V. SHELL COMPANIES AND LIMITED OPERATIONS AMONG EGC FILERS
A total of 774 EGC filers reported zero revenue, self-identified as shell companies in periodic filings, or both.17 Table 3 and Table 4 show that these two attributes are less common
16 See Instruction 1 to Item 308(a) of Regulation S-K. EGCs that have not yet filed at least one annual report are not required to provide a management report on ICFR. EGCs are exempt from the requirement for auditor attestation of ICFR. See Section 404(b) of the Sarbanes-Oxley Act, as amended by Section 103 of the JOBS Act.
17 Generally, a company is a shell company if it has no or nominal operations and at least one of the following attributes: (i) no or nominal assets; (ii) assets consisting solely of cash and cash equivalents; or (iii) assets consisting of any amount of cash and cash equivalents and nominal other assets. See Exchange Act Rule 12b-2, 17 C.F.R. 240.12b-2. Blank check companies (discussed in Section IV) would generally be considered shell companies until they

Page 14
among exchange-listed EGC filers as compared to non-listed EGC filers. The tables also show that these attributes are even less common among other exchange-listed companies.
Table 3 below presents data on the proportion of companies that reported zero revenue in their most recent annual audited financial statements included in SEC filings, which include Securities Act registration statements, Exchange Act registration statements, and Exchange Act periodic reports.
Table 3: Reporting of zero revenue (1) (2) (3) (4)
All EGC Filers
Non-listed EGC Filers
Exchange-Listed
EGC Filers
Other Exchange-
Listed (Not EGCs)
Total # of companies 1,951 1,209 742 4,055 # reporting zero revenue 750 601 149 86 % reporting zero revenue 38% 50% 20% 2%
Source: Standard & Poor's
Table 4 presents shell company disclosure by companies that have filed periodic reports, some of which also reported zero revenue.
Table 4: Shell company disclosure in periodic reports
(1) (2) (3) (4)
All EGC Filers
Non-listed EGC Filers
Exchange-Listed
EGC Filers
Other Exchange-
Listed (Not EGCs)
Total # of companies that filed periodic reports 1,704 991 713 4,043 # with shell company disclosure in periodic reports 266 231 35 6 % with shell company disclosure in periodic reports 16% 23% 5% 0%
Source: Audit Analytics
EGC Filers That Reported Zero Revenue in 2013: Where are They Now? As shown in Table 3, 38% of EGC filers reported zero revenue as of November 15,
2016. The population of EGC filers reporting zero revenue has changed over the last three years. Specifically, the percentage of EGC filers reporting zero revenue decreased from 50% at November 20, 2013 to 38% at November 15, 2016. (See Figure A.1 in Appendix A.) The following analysis explores the extent to which the declining trend in reporting zero revenue reflects EGC filers that began to generate revenue and EGC filers that left the EGC population.
acquire an operating business or more than nominal assets. See SEC Release 33-8407, Use of Form S-8 and Form 8-K by Shell Companies (Apr. 15, 2004) at n. 20.
Page 15
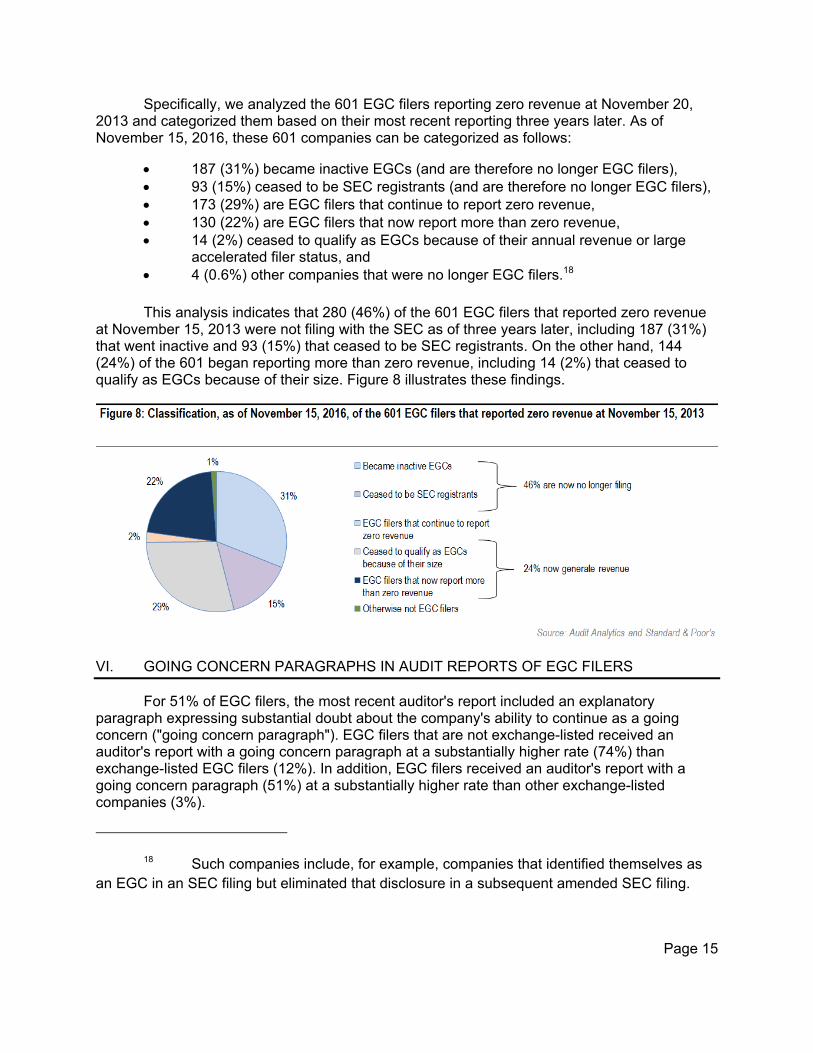
Specifically, we analyzed the 601 EGC filers reporting zero revenue at November 20, 2013 and categorized them based on their most recent reporting three years later. As of November 15, 2016, these 601 companies can be categorized as follows:
187 (31%) became inactive EGCs (and are therefore no longer EGC filers), 93 (15%) ceased to be SEC registrants (and are therefore no longer EGC filers), 173 (29%) are EGC filers that continue to report zero revenue, 130 (22%) are EGC filers that now report more than zero revenue, 14 (2%) ceased to qualify as EGCs because of their annual revenue or large
accelerated filer status, and 4 (0.6%) other companies that were no longer EGC filers.18
This analysis indicates that 280 (46%) of the 601 EGC filers that reported zero revenue at November 15, 2013 were not filing with the SEC as of three years later, including 187 (31%) that went inactive and 93 (15%) that ceased to be SEC registrants. On the other hand, 144 (24%) of the 601 began reporting more than zero revenue, including 14 (2%) that ceased to qualify as EGCs because of their size. Figure 8 illustrates these findings.
VI. GOING CONCERN PARAGRAPHS IN AUDIT REPORTS OF EGC FILERS
For 51% of EGC filers, the most recent auditor's report included an explanatory paragraph expressing substantial doubt about the company's ability to continue as a going concern ("going concern paragraph"). EGC filers that are not exchange-listed received an auditor's report with a going concern paragraph at a substantially higher rate (74%) than exchange-listed EGC filers (12%). In addition, EGC filers received an auditor's report with a going concern paragraph (51%) at a substantially higher rate than other exchange-listed companies (3%).
18 Such companies include, for example, companies that identified themselves as an EGC in an SEC filing but eliminated that disclosure in a subsequent amended SEC filing.

Page 16
Table 5: Rate of going concern paragraphs
(1) (2) (3) (4)
All EGC Filers
Non-listed EGC Filers
Exchange-Listed
EGC Filers
Other Exchange-
Listed (Not EGCs)
Companies with going concern paragraphs 987 (51%) 900 (74%) 87 (12%) 131 (3%) Source: Audit Analytics
The data in Table 6 shows that 58% of the EGC filers with going concern paragraphs in
their auditor’s report reported zero revenue. Only 15% of other exchange-listed companies with going concern paragraphs reported zero revenue.
Table 6: Going concern paragraphs and revenue information
(1) (2) (3) (4)
All EGC Filers
Non-listed EGC Filers
Exchange-Listed EGC Filers
Other Exchange-
Listed (Not EGCs)
# reporting zero revenue with going concern paragraphs 575 (58%) 536 (60%) 39 (45%) 20 (15%)
# reporting revenue >0 with going concern paragraphs 412 (42%) 364 (40%) 48 (55%) 111 (85%)
Total companies with going concern paragraphs 987 (100%) 900 (100%) 87 (100%) 131 (100%) Source: Audit Analytics
VII. AUDITORS OF EGC FILERS
The 1,951 EGC filers were audited by 273 registered public accounting firms. Approximately 96% of EGC filers were audited by accounting firms that also audit issuers that are not EGC filers.
Approximately 39% of the 1,951 EGC filers were audited by firms required to be inspected on an annual basis by the PCAOB.19 The remaining 61% were audited by firms required to be inspected at least once in every three years.20
Approximately 14% of EGC filers were audited by non-U.S. firms, including 9% that were audited by affiliates of annually inspected firms.
19 These are firms that have issued auditor's reports for more than 100 issuer audit clients in a given year and therefore are required to be inspected on an annual basis by the PCAOB.
20 These are firms that have issued auditor's reports for 100 or fewer issuer audit clients in a given year and therefore are required to be inspected at least once every three years by the PCAOB.

Page 17
Appendix A: Additional Information on EGC Filers
This appendix includes tables with more detailed information on attributes discussed in the paper.
Table A.1 Filer status from periodic reports21
(1) All EGC Filers
(2) Non-listed EGC
Filers
(3) Exchange-
Listed EGC Filers
(4) Other
Exchange-Listed
(Not EGCs) Large accelerated filers 0 0 0 2168 Accelerated filers 317 21 296 1,119 Non-accelerated filers 1,387 970 417 756 Total companies that filed periodic reports 1,704 991 713 4,043 Companies that did not file periodic reports22 247 218 29 12 Total companies 1,951 1,209 742 4,055
21 This data is derived from periodic reports with check boxes to indicate filer status, primarily Form 10-K, Form 10-Q, and Form 20-F. In general, "large accelerated filer" means an issuer with a public float of $700 million or more that has been subject to Exchange Act periodic reporting requirements for at least one year and has filed at least one annual report and "accelerated filer" means an issuer with a public float of $75 million or more, but less than $700 million, that has been subject to Exchange Act periodic reporting requirements for at least one year and has filed at least one annual report. See Exchange Act Rule 12b-2, 17 CFR 240.12b-2. The subset of companies summarized in Table A.1 as "non-accelerated filers" are those that filed periodic reports and did not identify themselves as "large accelerated filers" or "accelerated filers."
22 As of the measurement date, there were 247 EGC filers that had filed audited financials in a Securities Act or Exchange Act registration statement in the preceding 18 months but did not file periodic reports.

Page 18
Table A.2 Top five industries reported by EGC filers and exchange-listed companies by number (Numbers of only the top five in each noted population are displayed)
SIC industry description (code)
(1) All EGC Filers
(2) Non-listed EGC Filers
(3) Exchange-
Listed EGC Filers
(4) Other
Exchange- Listed
(Not EGCs) Pharmaceutical Preparations (2834) 224 (11%) 59 (5%) 165 (22%) 212 (5%) Blank Check Companies (6770) 152 (8%) 122 (10%) Real Estate Investment Trusts (6798) 97 (5%) 64 (5%) 33 (4%) 184 (5%) Prepackaged Software (7372) 97 (5%) 52 (4%) 45 (6%) Surgical/ medical instruments and apparatus (3841)23 54 (3%) 31 (4%) Business Services (7389) 42 (3%) State Commercial Banks (6022) 32 (4%) 168 (4%)
Biological Products, Except Diagnostic Substances (2836)23 31 (4%) Crude Petroleum and Natural Gas (1311) 120 (3%) National Commercial Banks (6021) 104 (3%) Total in Top 5 (for each column presented) 624 (32%) 339 (28%) 337 (45%) 788 (19%)
Not in Top 5 1,327 (68%) 870 (72%) 405 (55%) 3,267 (81%)
Total Companies 1,951 (100%) 1,209 (100%) 742 (100%) 4,055 (100%) Source: Audit Analytics
23 Tied for fifth with the same number of exchange-listed EGC filers disclosing the SIC codes 3841 and 2836.
Page 19
Table A.3 Top five industries reported by EGC filers and exchange-listed companies by % of assets (Amounts for only the top five in each noted population are displayed)
SIC industry description (code)
(1) All EGC Filers
(2) Non-listed EGC Filers
(3) Exchange-
Listed EGC Filers
(4) Other
Exchange- Listed
(Not EGCs)
Real Estate Investment Trusts (6798) 22% 48% 14% State Commercial Banks (6022) 19% 23% 6% Pharmaceutical Preparations (2834) 4% 5% Savings Institutions, Federally Chartered (6035) 3% 7% Crude Petroleum and Natural Gas (1311) 2% 2% Finance Services (6199) 6% Equipment Rental and Leasing, NEC (7359) 4% Prepackaged Software (7372) 3% National Commercial Banks (6021) 3% 17% Commercial Banks, NEC (6029) 20% Life Insurance (6311) 7% Security Brokers, Dealers, and Flotation Companies (6211) 5% Total in Top 5 50% 68% 48% 55% Not in Top 5 50% 32% 52% 45% Total Companies 100% 100% 100% 100%
Source: Audit Analytics and Standard & Poor's
Table A.4 Top five industries reported by EGC filers and exchange-listed companies by % of revenue (Amounts for only the top five in each noted population are displayed)
SIC industry description (code)
(1) All EGC Filers
(2) Non-listed EGC Filers
(3) Exchange-
Listed EGC Filers
(4) Other
Exchange-Listed
(Not EGCs) Real Estate Investment Trusts (6798) 7% 17% 4% Prepackaged Software (7372) 6% 7% Eating and Drinking Places (5812) 4% 5% Pharmaceutical Preparations (2834) 3% 5% 3% State Commercial Banks (6022) 3% 4% Sporting and Athletic Goods, NEC (3949) 5% Telephone Communications, Except Radiotelephone (4813) 5% 4% Engineering Services (8711) 4% Petroleum Refining (2911) 7% Crude Petroleum and Natural Gas (1311) 5% Motor Vehicles and Passenger Car Bodies (3711) 4% Variety Stores (5331) 4% Total in Top 5 23% 36% 23% 24% Not in Top 5 77% 64% 77% 76% Total Companies 100% 100% 100% 100%
Source: Audit Analytics and Standard & Poor's

Page 20
Table A.5 Reported revenue (Millions USD)
(1) All EGC Filers
(2) Non-listed EGC Filers
(3) Exchange-
Listed EGC Filers
(4) Other
Exchange-Listed
(Not EGCs) Minimum 0.0 0.0 0.0 0.0 Maximum 978.5 978.5 976.1 482,130.0 Average 56.6 17.3 120.5 4,938.3 Median 0.1 0.0 37.7 635.1
Source: Standard & Poor's
Table A.6 Reported assets (Millions USD) (1)
All EGC Filers
(2) Non-listed EGC Filers
(3) Exchange-
Listed EGC Filers
(4) Other
Exchange-Listed
(Not EGCs) Minimum 0.0 0.0 0.0 0.0 Maximum 19,352.7 13,244.9 19,352.7 2,603,865.1 Average 245.9 86.6 505.4 19,119.0 Median 5.9 0.2 161.5 1,418.2
Source: Standard & Poor's
Table A.7 SEC filing types used to determine newly identified EGC filers
Filing Type Number of EGC Filers
Securities Act Registration Statements 163
Exchange Act Registration Statements 34
Exchange Act Periodic/Current Reports 8
Other 2
Total 207 Source: Audit Analytics

Page 21
Appendix B: Inactive EGCs
The information presented below about inactive EGCs24 is the most recent available information through November 15, 2016.
Approximately 21% of the 414 inactive EGCs are blank check companies, according to the SIC code reported in the companies’ most recent SEC filings. This is the most common SIC code reported among the inactive companies; the next most common SIC code (3%) is metal mining (the remaining SIC codes each represent less than 3%).
Approximately 81% of the 414 inactive EGCs had an explanatory paragraph included in the last auditor's report stating that there is substantial doubt about the company's ability to continue as a going concern.
Approximately 14% of the 414 inactive EGCs were audited by firms required to be inspected on an annual basis by the PCAOB and the remaining 86% were audited by firms required to be inspected at least once in every three years.
Approximately 7% of the inactive EGCs were audited by non-U.S. firms, including 4% that were audited by non-U.S. firms that are affiliates of annually inspected firms.
24 Inactive EGCs discussed in this white paper are those companies that had previously identified themselves as EGCs in at least one SEC filing since 2012 but have not filed audited financial statements with the SEC in the 18 months preceding November 15, 2016. The 414 Inactive EGCs do not include the 465 companies that ceased to be SEC registrants as described in Appendix D

Page 22
Appendix C: Companies that are no longer EGC filers because of their annual revenue or large accelerated filer status
From April 5, 2012 through November 15, 2016 there were 200 companies that ceased to qualify as EGCs because of annual revenue in excess of $1 billion or large accelerated filer status. For the 200 companies, the five most common industries by SIC code were:
(i) pharmaceutical preparations, (ii) prepackaged software, (iii) real estate investment trusts, (iv) computer processing and data preparation, and (v) crude petroleum and natural gas.
Forty percent of these 200 companies reported operating in these industries.
Page 23
Appendix D: Companies that are no longer EGC filers because they are no longer SEC registrants
From April 5, 2012 through November 15, 2016, there were 465 companies that previously identified as EGCs but ceased to be SEC registrants and therefore were no longer EGC filers or inactive EGCs. Specifically, these 465 companies had (i) terminated their Exchange Act registration, (ii) had their Exchange Act registration revoked, or (iii) withdrawn their registration statement before effectiveness, and, in each case, did not subsequently file audited financial statements with the SEC. For the 465 companies, the five most common industries by SIC code were:
(i) blank check companies, (ii) pharmaceutical preparations, (iii) prepackaged software, (iv) metal mining, and (v) crude petroleum and natural gas. Thirty-five percent of these 465 companies reported operating in these industries.