whirlpool corporation€¦ · whirlpool corporation ("whirlpool"), the number one major...
TRANSCRIPT

UNITED STATES SECURITIES AND EXCHANGE COMMISSIONWASHINGTON, D.C. 20549
FORM 10-K(Mark One)
x ANNUAL REPORT PURSUANT TO SECTION 13 OR 15(d) OF THE SECURITIES EXCHANGE ACT OF 1934For the fiscal year ended December 31, 2016
OR
o TRANSITION REPORT PURSUANT TO SECTION 13 OR 15(d) OF THE SECURITIES EXCHANGE ACT OF 1934
For the transition period from _______ to _______Commission file number 1-3932
WHIRLPOOL CORPORATION(Exact name of registrant as specified in its charter)
Delaware 38-1490038(State of Incorporation) (I.R.S. Employer Identification No.)
2000 North M-63, Benton Harbor, Michigan 49022-2692
(Address of principal executive offices) (Zip Code)Registrant’s telephone number, including area code (269) 923-5000Securities registered pursuant to Section 12(b) of the Act:
Title of each class Name of each exchange on which registeredCommon stock, par value $1 per share Chicago Stock Exchange and New York Stock Exchange
0.625% Senior Notes due 2020
New York Stock Exchange
Securities registered pursuant to Section 12(g) of the Act: NONE
Indicate by check mark if the registrant is a well-known seasoned issuer, as defined in Rule 405 of the Securities Act. Yes ý No ¨Indicate by check mark if the registrant is not required to file reports pursuant to Section 13 or Section 15(d) of the Exchange Act. Yes ¨ No ýIndicate by check mark whether the registrant (1) has filed all reports required to be filed by Section 13 or 15(d) of the Exchange Act duringthe preceding 12 months (or for such shorter period that the registrant was required to file such report), and (2) has been subject to suchfiling requirements for the past 90 days. Yes ý No ¨Indicate by check mark whether the registrant has submitted electronically and posted on its corporate Web site, if any, every Interactive DataFile required to be submitted and posted pursuant to Rule 405 of Regulation S-T (§ 232.405 of this chapter) during the preceding 12 months(or for such shorter period that the registrant was required to submit and post such files). Yes ý No ¨Indicate by check mark if disclosure of delinquent filers pursuant to Item 405 of Regulation S-K (§229.405 of this chapter) is not containedherein, and will not be contained, to the best of the registrant’s knowledge, in definitive proxy or information statements incorporated byreference in Part III of this Form 10-K or any amendment to this Form 10-K. ý
Indicate by check mark whether the registrant is a large accelerated filer, an accelerated filer, a non-accelerated filer, or a smaller reportingcompany. See the definitions of “large accelerated filer,” “accelerated filer,” and “smaller reporting company” in Rule 12b-2 of the Exchange Act.(Check one) Large accelerated filer ý Accelerated filer ¨ Non-accelerated filer ¨ (Do not check if a smaller reporting company) Smaller reporting company ¨Indicate by check mark whether the registrant is a shell company (as defined in Rule 12b-2 of the Exchange Act). Yes ¨ No ýThe aggregate market value of voting common stock of the registrant held by stockholders not including voting stock held by directors and executive officers of theregistrant and certain employee plans of the registrant (the exclusion of such shares shall not be deemed an admission by the registrant that any such person is anaffiliate of the registrant) at the close of business on June 30, 2016 (the last business day of the registrant’s most recently completed second fiscal quarter) was$12,263,819,115 .On February 3, 2017 , the registrant had 74,467,790 shares of common stock outstanding.
DOCUMENTS INCORPORATED BY REFERENCEPortions of the following documents are incorporated herein by reference into the Part of the Form 10-K indicated:
Document Part of Form 10-K into which incorporatedThe registrant’s proxy statement for the 2017 annual meeting of stockholders (the “Proxy Statement”) Part III

WHIRLPOOL CORPORATION
ANNUAL REPORT ON FORM 10-K
For the fiscal year ended December 31, 2016
TABLE OF CONTENTS
PAGEPART I
Item 1. Business 3Item 1A. Risk Factors 7Item 1B. Unresolved Staff Comments 15Item 2. Properties 15Item 3. Legal Proceedings 15Item 4. Mine Safety Disclosures 15
PART II Item 5. Market for Registrant's Common Equity, Related Stockholder Matters and Issuer Purchases of Equity Securities 16Item 6. Selected Financial Data 17Item 7. Management's Discussion and Analysis of Financial Condition and Results of Operations 18Item 7A. Quantitative and Qualitative Disclosures about Market Risk 33Item 8. Financial Statements and Supplementary Data 34Item 9. Changes in and Disagreements with Accountants on Accounting and Financial Disclosure 68Item 9A. Controls and Procedures 68Item 9B. Other Information 68
PART III Item 10. Directors, Executive Officers and Corporate Governance 69Item 11. Executive Compensation 69Item 12. Security Ownership of Certain Beneficial Owners and Management and Related Stockholder Matters 69Item 13. Certain Relationships and Related Transactions, and Director Independence 69
Item 14. Principal Accounting Fees and Services70
PART IV Item 15. Exhibits, Financial Statement Schedules 71Item 16 Form 10-K Summary 71
SIGNATURES 72
PART I
ITEM 1. BUSINESS
Whirlpool Corporation ("Whirlpool"), the number one major appliance manufacturer in the world, was incorporated in 1955 under the laws of Delaware asthe successor to a business that traces its origin to 1898. Whirlpool manufactures products in 14 countries and markets products in nearly every country around theworld under brand names such as Whirlpool , KitchenAid , Maytag , Consul , Brastemp , Amana , Bauknecht , Jenn-Air, Indesit, andHotpoint*. Whirlpool’sreportable segments consist of North America, Europe, Middle East and Africa ("EMEA"), Latin America and Asia. As of December 31, 2016 , Whirlpool hadapproximately 93,000 employees.
As used herein, and except where the context otherwise requires, “Whirlpool,” “the Company,” “we,” “us,” and “our” refer to Whirlpool Corporation and itsconsolidated subsidiaries.
Products and Regions
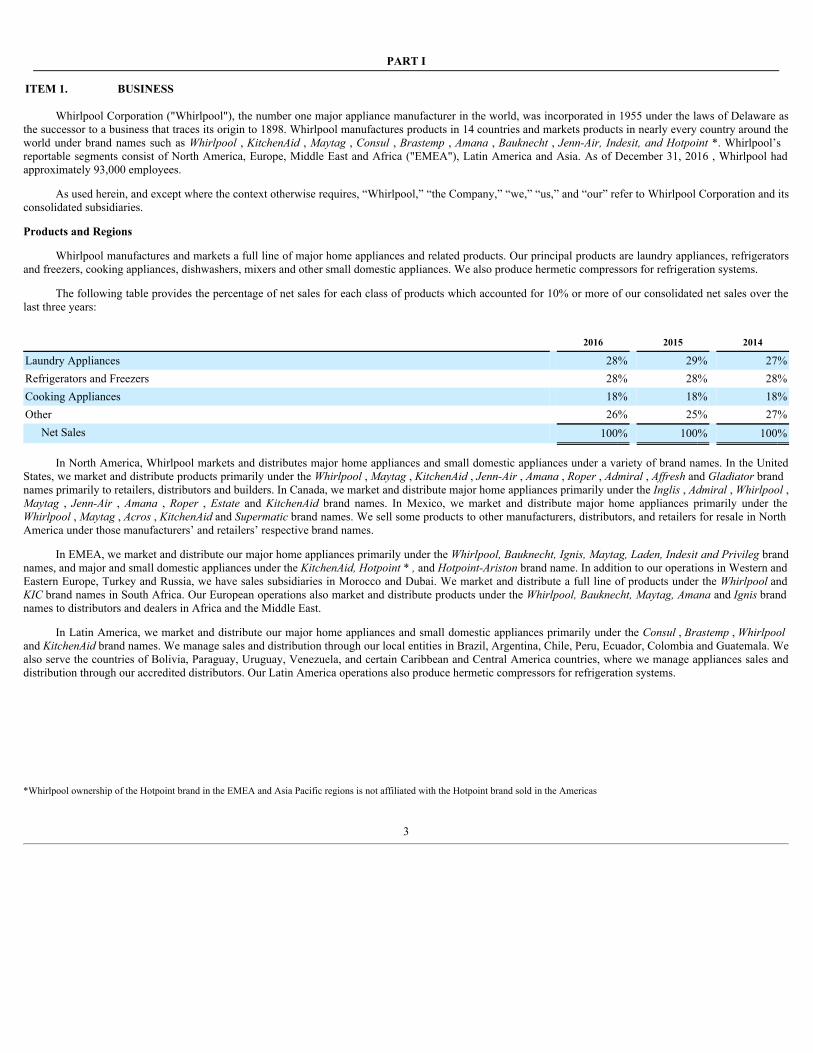
Whirlpool manufactures and markets a full line of major home appliances and related products. Our principal products are laundry appliances, refrigeratorsand freezers, cooking appliances, dishwashers, mixers and other small domestic appliances. We also produce hermetic compressors for refrigeration systems.
The following table provides the percentage of net sales for each class of products which accounted for 10% or more of our consolidated net sales over thelast three years:
2016 2015 2014
Laundry Appliances 28% 29% 27%Refrigerators and Freezers 28% 28% 28%Cooking Appliances 18% 18% 18%Other 26% 25% 27%
Net Sales 100% 100% 100%
In North America, Whirlpool markets and distributes major home appliances and small domestic appliances under a variety of brand names. In the UnitedStates, we market and distribute products primarily under the Whirlpool, Maytag, KitchenAid, Jenn-Air, Amana, Roper, Admiral, Affreshand Gladiatorbrandnames primarily to retailers, distributors and builders. In Canada, we market and distribute major home appliances primarily under the Inglis, Admiral, Whirlpool,Maytag , Jenn-Air , Amana , Roper , Estate and KitchenAid brand names. In Mexico, we market and distribute major home appliances primarily under theWhirlpool, Maytag, Acros, KitchenAidand Supermaticbrand names. We sell some products to other manufacturers, distributors, and retailers for resale in NorthAmerica under those manufacturers’ and retailers’ respective brand names.
In EMEA, we market and distribute our major home appliances primarily under the Whirlpool,Bauknecht,Ignis,Maytag,Laden,IndesitandPrivilegbrandnames, and major and small domestic appliances under the KitchenAid,Hotpoint* ,and Hotpoint-Aristonbrand name. In addition to our operations in Western andEastern Europe, Turkey and Russia, we have sales subsidiaries in Morocco and Dubai. We market and distribute a full line of products under the WhirlpoolandKICbrand names in South Africa. Our European operations also market and distribute products under the Whirlpool,Bauknecht,Maytag,Amanaand Ignisbrandnames to distributors and dealers in Africa and the Middle East.
In Latin America, we market and distribute our major home appliances and small domestic appliances primarily under the Consul, Brastemp, Whirlpooland KitchenAidbrand names. We manage sales and distribution through our local entities in Brazil, Argentina, Chile, Peru, Ecuador, Colombia and Guatemala. Wealso serve the countries of Bolivia, Paraguay, Uruguay, Venezuela, and certain Caribbean and Central America countries, where we manage appliances sales anddistribution through our accredited distributors. Our Latin America operations also produce hermetic compressors for refrigeration systems.
*Whirlpool ownership of the Hotpoint brand in the EMEA and Asia Pacific regions is not affiliated with the Hotpoint brand sold in the Americas
3

In Asia, we have organized the marketing and distribution of our major home appliances and small domestic appliances into five operating groups:(1) mainland China; (2) Hong Kong and Taiwan; (3) India, which includes Bangladesh, Sri Lanka, Nepal and Pakistan; (4) Oceania, which includes Australia, NewZealand and Pacific Islands; and (5) Southeast Asia, which includes Thailand, Singapore, Malaysia, Indonesia, Vietnam, the Philippines, Korea, Myanmar andJapan. We market and distribute our products in Asia primarily under the Whirlpool, Maytag, KitchenAid, Amana, Bauknecht, Jenn-Air, Diqua,andRoyalstarbrand names through a combination of direct sales to appliance retailers and chain stores and through full-service distributors to a large network of retail stores.
Competition
Competition in the major home appliance industry is intense, including competitors such as Arcelik, Bosch Siemens, Electrolux, Haier, Kenmore, LG,Mabe, Midea, Panasonic and Samsung, many of which are increasingly expanding beyond their existing manufacturing footprint. Moreover, our customer baseincludes large, sophisticated trade customers who have many choices and demand competitive products, services and prices. Competition in our business is basedupon a wide variety of factors, including selling price, product features and design, performance, innovation, energy efficiency, quality, cost, distribution andfinancial incentives. These financial incentives include cooperative advertising, co-marketing funds, salesperson incentives, volume rebates and terms. We believethat we can best compete in the current environment by focusing on introducing new and innovative products, building strong brands, enhancing trade customerand consumer value with our product and service offerings, expanding our regional footprint and trade distribution channels, increasing productivity, improvingquality, lowering costs, and taking other efficiency-enhancing measures.
Raw Materials and Purchased Components
We are generally not dependent upon any one source for raw materials or purchased components essential to our business. In areas where a single supplier isused, alternative sources are generally available and can be developed within the normal manufacturing environment. Some supply disruptions and unanticipatedcosts may be incurred in transitioning to a new supplier if a prior single supplier relationship was abruptly interrupted or terminated. In the event of a disruption,we believe that we will be able to qualify and use alternate materials, sometimes at premium costs, and that such raw materials and components will be available inadequate quantities to meet forecasted production schedules.
Trademarks, Licenses and Patents
We consider the trademarks, copyrights, patents, and trade secrets we own, and the licenses we hold, in the aggregate, to be a valuable asset. Whirlpool isthe owner of a number of trademarks in the United States and foreign countries. The most important trademarks to North America are Whirlpool, Maytag, Jenn-Air , KitchenAid , Amanaand Acros . The most important trademarks to Latin America are Consul,Brastemp,Whirlpooland KitchenAid . The most importanttrademarks to EMEA are Whirlpool , KitchenAid, Bauknecht, Indesit, Hotpoint * , Hotpoint-Ariston and Ignis . The most important trademarks to Asia areWhirlpool,RoyalstarandDiqua. We receive royalties from licensing our trademarks to third parties to manufacture, sell and service certain products bearing theWhirlpool,Maytag,KitchenAid,and Amanabrand names. We continually apply for and obtain United States and foreign patents. The primary purpose in obtainingpatents is to protect our designs and technologies.
Research and Development
Expenditures for research and development relating to new and innovative products and the improvement of existing products were approximately $ 604million , $579 million and $563 million in 2016 , 2015 and 2014 , respectively.
Protection of the Environment
Our manufacturing facilities are subject to numerous laws and regulations designed to protect or enhance the environment, many of which require federal,state, or other governmental licenses and permits with regard to wastewater discharges, air emissions, and hazardous waste management. Our policy is to complywith all such laws and regulations. Where laws and regulations are less restrictive, we have established and are following our own standards, consistent with ourcommitment to environmental responsibility.
*Whirlpool ownership of the Hotpoint brand in the EMEA and Asia Pacific regions is not affiliated with the Hotpoint brand sold in the Americas
4
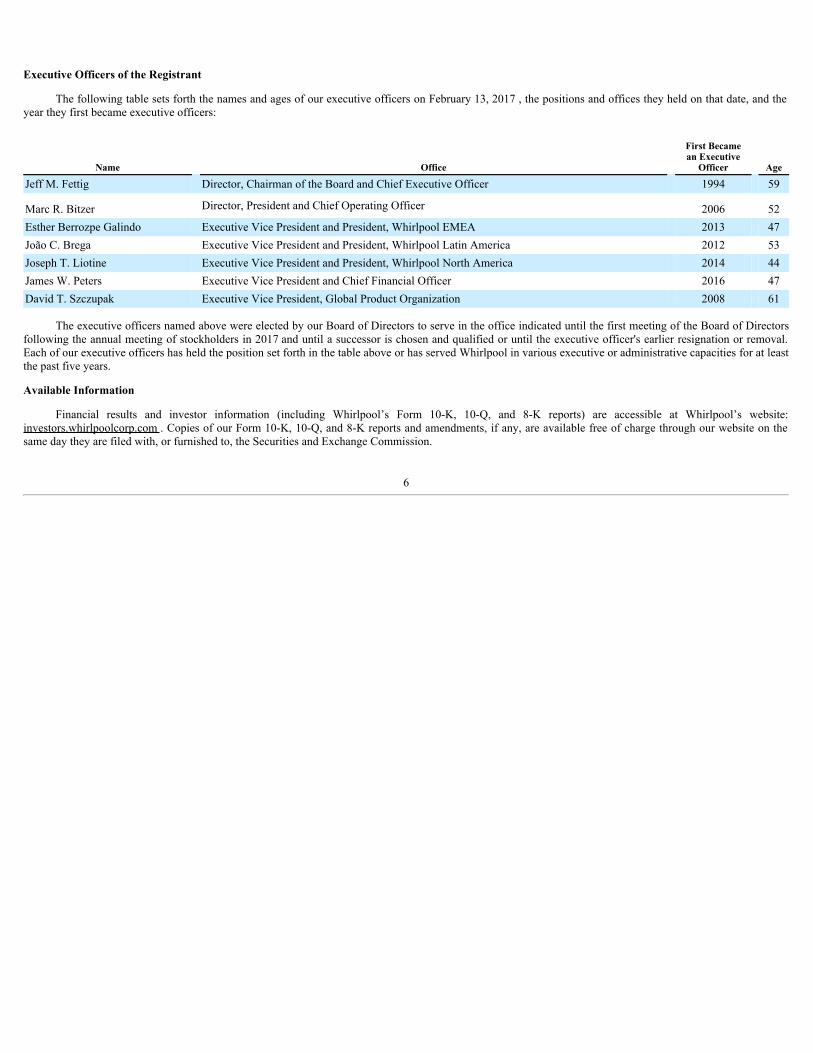
We believe that we are in compliance, in all material respects, with presently applicable governmental provisions relating to environmental protection in thecountries in which we have manufacturing operations. Compliance with these environmental laws and regulations did not have a material effect on capitalexpenditures, earnings, or our competitive position during 2016 and is not expected to be material in 2017 .
The entire major home appliance industry, including Whirlpool, must contend with the adoption of stricter governmental energy and environmentalstandards. These standards were phased-in over the past several years and include the general phase-out of ozone-depleting chemicals used in refrigeration, andenergy standards for selected major appliances, regulatory restrictions on the materials content specified for use in our products by some jurisdictions andmandated recycling of our products at the end of their useful lives. Compliance with these various standards, as they become effective, will require some productredesign. However, we believe, based on our understanding of the current state of proposed regulations, that we will be able to develop, manufacture, and marketproducts that comply with these regulations.
Whirlpool participates in environmental assessments and cleanup at a number of locations globally. These include operating and non-operating facilities,previously owned properties and waste sites, including "Superfund" (under the Comprehensive Environmental Response, Compensation and Liability Act(CERCLA)) sites. However, based upon our evaluation of the facts and circumstances relating to these sites along with the evaluation of our technical consultants,we do not presently anticipate any material adverse effect upon our earnings, financial condition, or competitive position arising out of the resolution of thesematters or the resolution of any other known governmental proceeding regarding environmental protection matters.
Acquisitions
Whirlpool China
On October 24, 2014 , Whirlpool's wholly-owned subsidiary, Whirlpool (China) Investment Co., Ltd., completed its acquisition of a 51% equity stake inHefei Rongshida Sanyo Electric Co., Ltd. ("Hefei Sanyo"), a joint stock company whose shares are listed and traded on the Shanghai Stock Exchange, which wehave since renamed to Whirlpool (China) Co., Ltd. (" Whirlpool China "). The aggregate purchase price for the transaction was RMB 3.4 billion (approximately$551 million at the date of purchase for each step of the transaction) net of cash acquired.
Indesit Company S.p.A.
On December 3, 2014 , Whirlpool completed the final step in its acquisition of Indesit Company S.p.A. ("Indesit") and on the same day Indesit delisted fromthe Electronic Stock Market organized and managed by Borsa Italiana S.p.A. Total consideration paid for Indesit was €1.1 billion (approximately $1.4 billion at thedates of purchase of each step in the transaction) in aggregate net of cash acquired.
Further discussion of these transactions can be found in the Financial Condition and Liquidity section of Management's Discussion and Analysis.
Other Information
For information about the challenges and risks associated with our foreign operations, see “Risks Factors” under Item 1A.
For certain other financial information concerning our business segments and foreign and domestic operations, see Note 13 to the Consolidated FinancialStatements.
For information on our global restructuring plans, and the impact of these plans on our operating segments, see Note 10 to the Consolidated FinancialStatements.
5
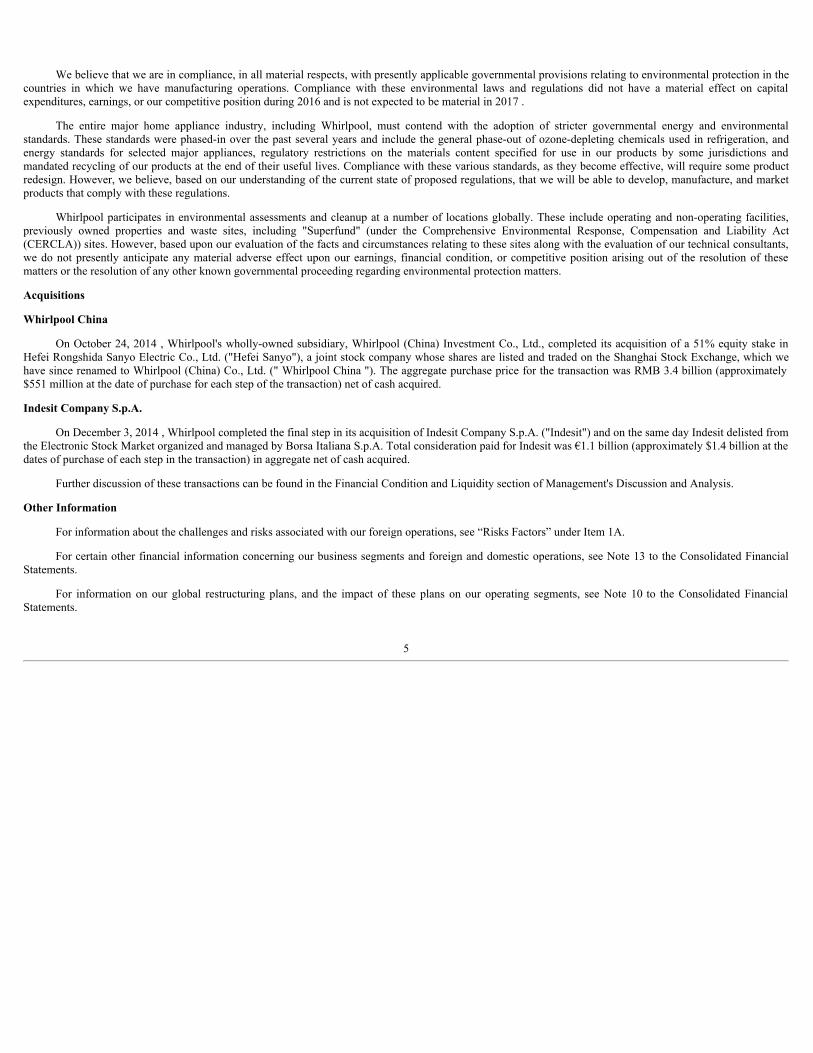
Executive Officers of the Registrant
The following table sets forth the names and ages of our executive officers on February 13, 2017 , the positions and offices they held on that date, and theyear they first became executive officers:
Name Office
First Becamean Executive
Officer Age
Jeff M. Fettig Director, Chairman of the Board and Chief Executive Officer 1994 59
Marc R. Bitzer Director, President and Chief Operating Officer 2006 52Esther Berrozpe Galindo Executive Vice President and President, Whirlpool EMEA 2013 47João C. Brega Executive Vice President and President, Whirlpool Latin America 2012 53Joseph T. Liotine Executive Vice President and President, Whirlpool North America 2014 44James W. Peters Executive Vice President and Chief Financial Officer 2016 47David T. Szczupak Executive Vice President, Global Product Organization 2008 61
The executive officers named above were elected by our Board of Directors to serve in the office indicated until the first meeting of the Board of Directorsfollowing the annual meeting of stockholders in 2017 and until a successor is chosen and qualified or until the executive officer's earlier resignation or removal.Each of our executive officers has held the position set forth in the table above or has served Whirlpool in various executive or administrative capacities for at leastthe past five years.
Available Information
Financial results and investor information (including Whirlpool’s Form 10-K, 10-Q, and 8-K reports) are accessible at Whirlpool’s website:investors.whirlpoolcorp.com . Copies of our Form 10-K, 10-Q, and 8-K reports and amendments, if any, are available free of charge through our website on thesame day they are filed with, or furnished to, the Securities and Exchange Commission.
6

ITEM 1A. RISK FACTORS
This report contains statements referring to Whirlpool that are not historical facts and are considered “forward-looking statements” within the meaning ofthe Private Securities Litigation Reform Act of 1995. These statements, which are intended to take advantage of the “safe harbor” provisions of the PrivateSecurities Litigation Reform Act of 1995, are based on current projections about operations, industry conditions, financial condition and liquidity. Words thatidentify forward-looking statements include words such as “may,” “could,” “will,” “should,” “possible,” “plan,” “predict,” “forecast,” “potential,” “anticipate,”“estimate,” “expect,” “project,” “intend,” “believe,” “may impact,” “on track,” and words and terms of similar substance used in connection with any discussion offuture operating or financial performance, a merger, or our businesses. In addition, any statements that refer to expectations, projections, or other characterizationsof future events or circumstances, including any underlying assumptions, are forward-looking statements. Those statements are not guarantees and are subject torisks, uncertainties, and assumptions that are difficult to predict. Therefore, actual results could differ materially and adversely from these forward-lookingstatements.
We have listed below the most significant strategic, operational, financial, and legal and compliance risks relating to our business.
STRATEGIC RISKS
Key Risk Risk DescriptionWe face intensecompetition in the majorhome appliance industryand failure to successfullycompete could negativelyaffect our business andfinancial performance.
Each of our operating segments operates in a highly competitive business environment and faces intense competition from agrowing number of competitors, many of which have strong consumer brand equity. Several of these competitors, such as Arcelik,Bosch Siemens, Electrolux, Haier, LG, Mabe, Midea, Panasonic and Samsung are large, well-established companies, many rankingamong the Global Fortune 150, and have demonstrated a commitment to success in the global market. Moreover, our customerbase includes large, sophisticated trade customers who have many choices and demand competitive products, services and prices.Competition in the global appliance market is based on a number of factors including selling price, product features and design,performance, innovation, reputation, energy efficiency, quality, cost, distribution, and financial incentives, such as cooperativeadvertising, co-marketing funds, sales person incentives, volume rebates and terms. Many of our competitors are increasinglyexpanding beyond their existing manufacturing footprints. Our competitors, especially global competitors with low-cost sources ofsupply and/or highly protected home markets outside the United States, have aggressively priced their products and/or introducednew products to increase market share and expand into new geographies. If we are unable to successfully compete in this highlycompetitive environment, our business and financial performance could be negatively affected.
The loss of, or substantialdecline in, sales to any ofour key trade customers,major buying groups, andbuilders could adverselyaffect our financialperformance.
We sell to a sophisticated customer base of large trade customers that have significant leverage as buyers over their suppliers. Mostof our products are not sold through long-term contracts, allowing trade customers to change volume among suppliers. As the tradecustomers continue to become larger, they may seek to use their position to improve their profitability by various means, includingimproved efficiency, lower pricing, and increased promotional programs. If we are unable to meet their demand requirements, ourvolume growth and financial results could be negatively affected. The loss of, or substantial decline in volume of, sales to our keytrade customers, major buying groups, builders, or any other trade customers to which we sell a significant amount of products,could adversely affect our financial performance. Additionally, the loss of market share or financial difficulties, includingbankruptcy and financial restructuring, by these trade customers could have a material adverse effect on our liquidity, financialposition and results of operations.
7

Failure to maintain ourreputation and brandimage could negativelyimpact our business.
Our brands have worldwide recognition, and our success depends on our ability to maintain and enhance our brand image andreputation. Maintaining, promoting and growing our brands depends on our marketing efforts, including advertising and consumercampaigns, as well as product innovation. We could be adversely impacted if we fail to achieve any of these objectives or if,whether or not justified, the reputation or image of our company or any of our brands is tarnished or receives negative publicity. Inaddition, adverse publicity about regulatory or legal action against us, or product quality issues, could damage our reputation andbrand image, undermine our customers' confidence in us and reduce long-term demand for our products, even if the regulatory orlegal action is unfounded or not material to our operations.
In addition, our success in maintaining, extending and expanding our brand image depends on our ability to adapt to a rapidlychanging media environment, including our increasing reliance on social media and online dissemination of advertising campaigns.Inaccurate or negative posts or comments about us on social networking and other websites that spread rapidly through suchforums could seriously damage our reputation and brand image. If we do not maintain, extend and expand our brand image, thenour product sales, financial condition and results of operations could be materially and adversely affected.
An inability to effectivelyexecute and manage ourbusiness objectives couldadversely affect ourfinancial performance.
The highly competitive nature of our industry requires that we effectively execute and manage our business objectives includingour global operating platform initiative. Our global operating platform initiative aims to reduce costs, expand margins, driveproductivity and quality improvements, accelerate our rate of innovation, and drive shareholder value. Our inability to effectivelycontrol costs and drive productivity improvements could affect our profits. In addition, our inability to provide high-quality,innovative products could adversely affect our ability to maintain or increase our sales, which could negatively affect our revenuesand overall financial performance. Additionally, our success is dependent on anticipating and appropriately reacting to changes incustomer preferences and on successful new product and process development and product relaunches in response to such changes.Our future results and our ability to maintain or improve our competitive position will depend on our capacity to gauge thedirection of our key markets and upon our ability to successfully and timely identify, develop, manufacture, market, and sell newor improved products in these changing markets.
Our intellectual propertyrights are valuable, andany inability to protectthem could reduce thevalue of our products,services and brands.
We consider our intellectual property rights, including patents, trademarks, copyrights and trade secrets, and the licenses we hold,to be a significant part and valuable aspect of our business. We attempt to protect our intellectual property rights through acombination of patent, trademark, copyright and trade secret laws, as well as licensing agreements and third party nondisclosureand assignment agreements. Our failure to obtain or adequately protect our trademarks, products, new features of our products, orour processes may diminish our competitiveness.
We have applied for intellectual property protection in the United States and other jurisdictions with respect to certain innovationsand new products, design patents, product features, and processes. We cannot be assured that the U.S. Patent and Trademark Officeor any similar authority in other jurisdictions will approve any of our patent applications. Additionally, the patents we own couldbe challenged or invalidated, others could design around our patents or the patents may not be of sufficient scope or strength toprovide us with any meaningful protection or commercial advantage. Further, the laws of certain foreign countries in which we dobusiness, or contemplate doing business in the future, do not recognize intellectual property rights or protect them to the sameextent as United States law. As a result, these factors could weaken our competitive advantage with respect to our products,services, and brands in foreign jurisdictions, which could adversely affect our financial performance.
Moreover, while we do not believe that any of our products infringe on enforceable intellectual property rights of third parties,others may assert intellectual property rights that cover some of our technology, brands, products, or services. Any litigationregarding patents or other intellectual property could be costly and time-consuming and could divert the attention of ourmanagement and key personnel from our business operations. Claims of intellectual property infringement might also require us toenter into costly license agreements or modify our products or services. We also may be subject to significant damages, injunctionsagainst development and sale of certain products or services, or limited in the use of our brands.
8

OPERATIONAL RISKS
Key Risk Risk DescriptionWe face risks associatedwith our acquisitions andother investments andrisks associated with ourincreased presence inemerging markets.
From time to time, we make strategic acquisitions, investments and participate in joint ventures. For example, we acquired Indesitand a majority interest in Hefei Sanyo in the fourth quarter of 2014. These transactions, and other transactions that we have enteredinto or which we may enter into in the future, can involve significant challenges and risks, including that the transaction does notadvance our business strategy or fails to produce a satisfactory return on our investment. We may encounter difficulties inintegrating acquisitions with our operations, applying our internal control processes to these acquisitions, and in managing strategicinvestments. Integrating acquisitions is often costly and may require significant attention from management. Furthermore, we maynot realize the degree, or timing, of benefits we anticipate when we first enter into a transaction. While our evaluation of anypotential acquisition includes business, legal and financial due diligence with the goal of identifying and evaluating the materialrisks involved, our due diligence reviews may not identify all of the issues necessary to accurately estimate the cost and potentialloss contingencies of a particular transaction, including potential exposure to regulatory sanctions resulting from an acquisitiontarget’s previous activities or costs associated with any quality issues with an acquisition target's legacy products.
Our growth plans include efforts to increase revenue from emerging markets, including through acquisitions. Local businesspractices in these countries may not comply with U.S. laws, local laws or other laws applicable to us or our compliance policies,which non-compliant practices may result in increased liability risks. For example, we may incur unanticipated costs, expenses orother liabilities as a result of an acquisition target’s violation of applicable laws, such as the U.S. Foreign Corrupt Practices Act(FCPA) or similar worldwide anti-bribery laws in non-U.S. jurisdictions. We may incur unanticipated costs or expenses, includingpost-closing asset impairment charges, expenses associated with eliminating duplicate facilities, litigation, and other liabilities. Inaddition, our recent and future acquisitions may increase our exposure to other risks associated with operating internationally,including foreign currency exchange rate fluctuations; political, legal and economic instability; inflation; changes in tax rates andtax laws; and work stoppages and labor relations.
9
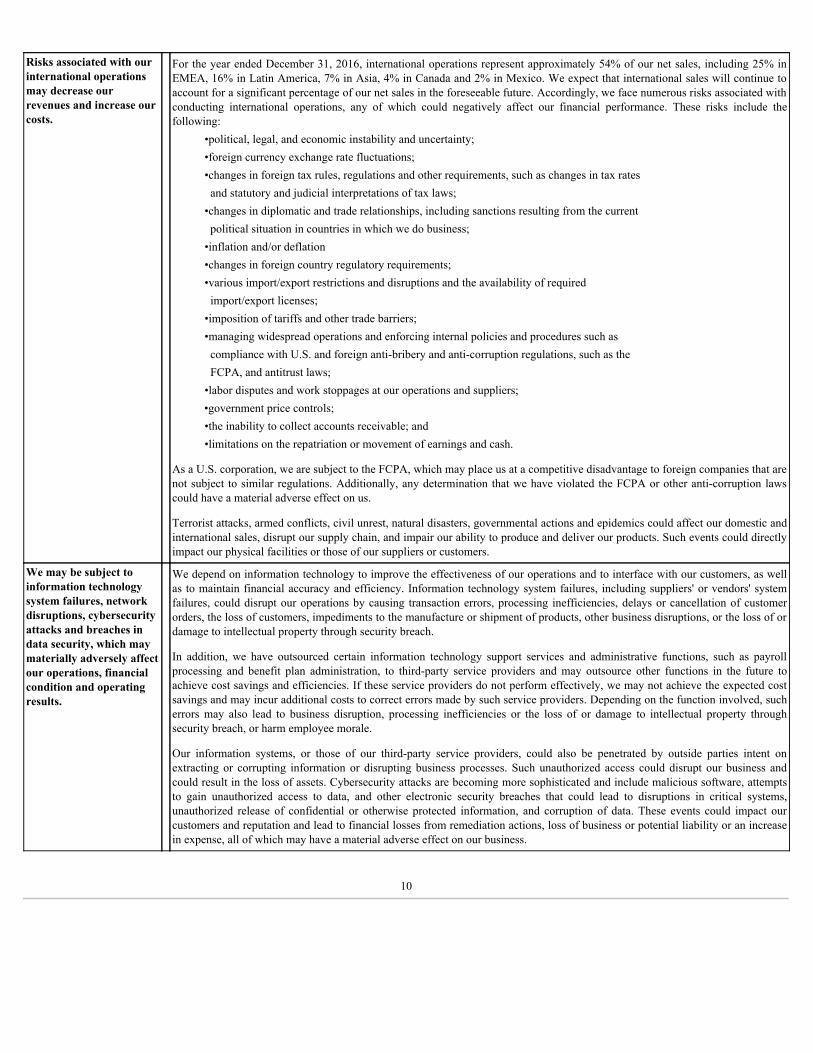
Risks associated with ourinternational operationsmay decrease ourrevenues and increase ourcosts.
For the year ended December 31, 2016, international operations represent approximately 54% of our net sales, including 25% inEMEA, 16% in Latin America, 7% in Asia, 4% in Canada and 2% in Mexico. We expect that international sales will continue toaccount for a significant percentage of our net sales in the foreseeable future. Accordingly, we face numerous risks associated withconducting international operations, any of which could negatively affect our financial performance. These risks include thefollowing:
•political, legal, and economic instability and uncertainty;•foreign currency exchange rate fluctuations;•changes in foreign tax rules, regulations and other requirements, such as changes in tax rates and statutory and judicial interpretations of tax laws;•changes in diplomatic and trade relationships, including sanctions resulting from the current political situation in countries in which we do business;•inflation and/or deflation•changes in foreign country regulatory requirements;•various import/export restrictions and disruptions and the availability of required import/export licenses;•imposition of tariffs and other trade barriers;•managing widespread operations and enforcing internal policies and procedures such as compliance with U.S. and foreign anti-bribery and anti-corruption regulations, such as the FCPA, and antitrust laws;•labor disputes and work stoppages at our operations and suppliers;
•government price controls;•the inability to collect accounts receivable; and•limitations on the repatriation or movement of earnings and cash.
As a U.S. corporation, we are subject to the FCPA, which may place us at a competitive disadvantage to foreign companies that arenot subject to similar regulations. Additionally, any determination that we have violated the FCPA or other anti-corruption lawscould have a material adverse effect on us.
Terrorist attacks, armed conflicts, civil unrest, natural disasters, governmental actions and epidemics could affect our domestic andinternational sales, disrupt our supply chain, and impair our ability to produce and deliver our products. Such events could directlyimpact our physical facilities or those of our suppliers or customers.
We may be subject toinformation technologysystem failures, networkdisruptions, cybersecurityattacks and breaches indata security, which maymaterially adversely affectour operations, financialcondition and operatingresults.
We depend on information technology to improve the effectiveness of our operations and to interface with our customers, as wellas to maintain financial accuracy and efficiency. Information technology system failures, including suppliers' or vendors' systemfailures, could disrupt our operations by causing transaction errors, processing inefficiencies, delays or cancellation of customerorders, the loss of customers, impediments to the manufacture or shipment of products, other business disruptions, or the loss of ordamage to intellectual property through security breach.
In addition, we have outsourced certain information technology support services and administrative functions, such as payrollprocessing and benefit plan administration, to third-party service providers and may outsource other functions in the future toachieve cost savings and efficiencies. If these service providers do not perform effectively, we may not achieve the expected costsavings and may incur additional costs to correct errors made by such service providers. Depending on the function involved, sucherrors may also lead to business disruption, processing inefficiencies or the loss of or damage to intellectual property throughsecurity breach, or harm employee morale.
Our information systems, or those of our third-party service providers, could also be penetrated by outside parties intent onextracting or corrupting information or disrupting business processes. Such unauthorized access could disrupt our business andcould result in the loss of assets. Cybersecurity attacks are becoming more sophisticated and include malicious software, attemptsto gain unauthorized access to data, and other electronic security breaches that could lead to disruptions in critical systems,unauthorized release of confidential or otherwise protected information, and corruption of data. These events could impact ourcustomers and reputation and lead to financial losses from remediation actions, loss of business or potential liability or an increasein expense, all of which may have a material adverse effect on our business.
10

Product-related liabilityor product recall costscould adversely affect ourbusiness and financialperformance.
We may be exposed to product-related liabilities, which in some instances may result in product redesigns, product recalls, or othercorrective action. In addition, any claim or product recall that results in significant adverse publicity, particularly if those claims orrecalls cause customers to question the safety or reliability of our products, may negatively affect our business, financial condition,or results of operations. We maintain product liability insurance, but it may not be adequate to cover losses related to productliability claims brought against us. Product liability insurance could become more expensive and difficult to maintain and may notbe available on commercially reasonable terms, if at all. We may also be involved in certain class action and other litigation, forwhich no insurance is available. A cost effective market for product recall insurance does not exist, so any product recall weinitiate could have a significant impact on our operating results and/or cash flows.
We regularly engage in investigations of potential quality and safety issues as part of our ongoing effort to deliver quality productsto our customers. We are currently investigating a limited number of potential quality and safety issues, and as appropriate, weundertake to effect repair or replacement of appliances. Currently we are implementing a corrective action plan affecting certain ofour Indesitand Hotpoint* branded dryers (see Note 6 of the Notes to the Consolidated Financial Statements for additionalinformation on these matters). Actual costs of these and any future issues depend upon several factors, including the number ofconsumers who respond to a particular recall, repair and administrative costs, whether the cost of any corrective action is borne byWhirlpool or the supplier, and, if borne by Whirlpool, whether we will be successful in recovering our costs from the supplier. Theactual costs incurred as a result of these issues and any future issues could have a material adverse effect on our business, financialcondition or results of operations.
The ability of suppliers todeliver parts, componentsand manufacturingequipment to ourmanufacturing facilities,and our ability tomanufacture withoutdisruption, could affectour global businessperformance.
We use a wide range of materials and components in the global production of our products, which come from numerous suppliers.Because not all of our business arrangements provide for guaranteed supply and some key parts may be available only from asingle supplier or a limited group of suppliers, we are subject to supply and pricing risk. In addition, certain proprietary componentparts used in some of our products are provided by single-source unaffiliated third-party suppliers. We would be unable to obtainthese proprietary components for an indeterminate period of time if these single-source suppliers were to cease or interruptproduction or otherwise fail to supply these components to us, which could adversely affect our product sales and operating results.Our operations and those of our suppliers are subject to disruption for a variety of reasons, including work stoppages, laborrelations, intellectual property claims against suppliers, information technology failures, and hazards such as fire, earthquakes,flooding, or other natural disasters, insurance for any of which may not be available, affordable or adequate. Such disruption couldinterrupt our ability to manufacture certain products. Any significant disruption could negatively impact our revenue and/orearnings performance.
Our ability to attract,develop and retainexecutives and otherqualified employees iscrucial to our results ofoperations and futuregrowth.
We depend upon the continued services and performance of our key executives, senior management and skilled personnel,particularly professionals with experience in our business and operations and the home appliance industry. We cannot be sure thatany of these individuals will continue to be employed by us. Significant time is required to hire and develop skilled replacementpersonnel. An inability to hire, develop, engage and retain a sufficient number of qualified employees could materially hinder ourbusiness by, for example, delaying our ability to bring new products to market or impairing the success of our operations.
A deterioration in laborrelations could adverselyimpact our globalbusiness.
As of December 31, 2016, we had approximately 93,000 employees. We are subject to separate collective bargaining agreementswith certain labor unions, which generally have two to three year terms, as well as various other commitments regarding ourworkforce. We periodically negotiate with certain unions representing our employees and may be subject to work stoppages or maybe unable to renew collective bargaining agreements on the same or similar terms, or at all, all of which may also have a materialadverse effect on our business, financial condition, or results of operations.
*Whirlpool ownership of the Hotpoint brand in the EMEA and Asia Pacific regions is not affiliated with the Hotpoint brand sold in the Americas
11
FINANCIAL RISKS
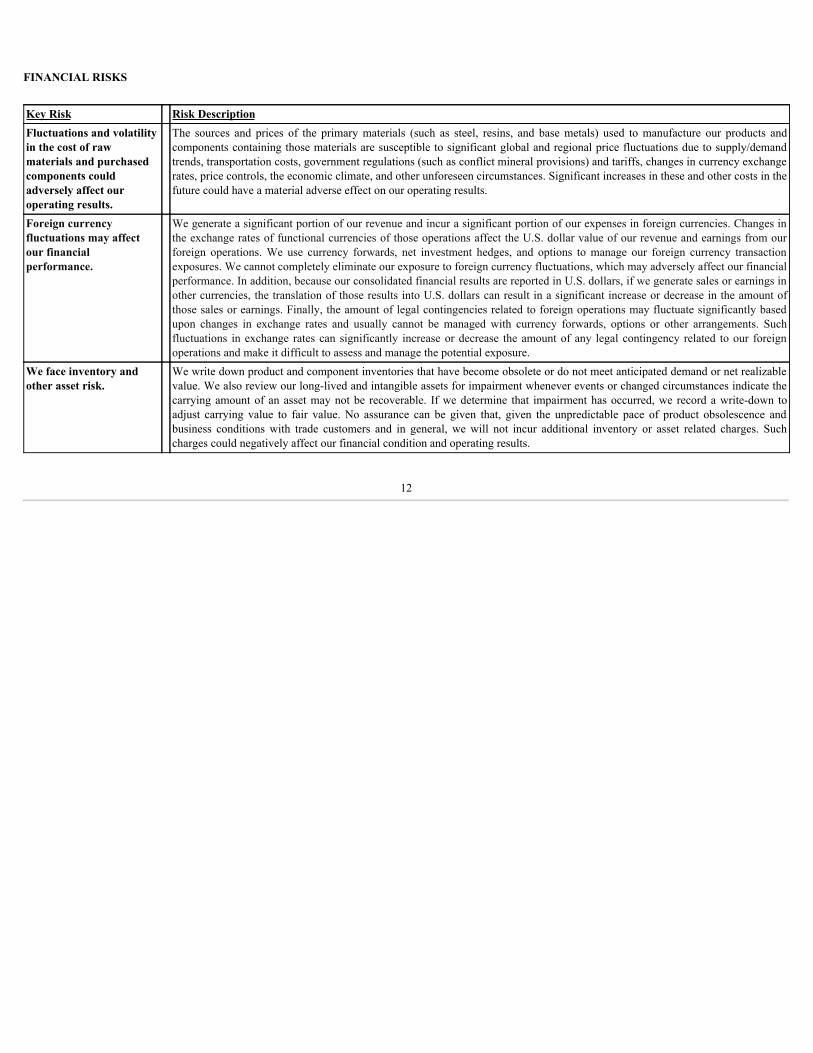
Key Risk Risk DescriptionFluctuations and volatilityin the cost of rawmaterials and purchasedcomponents couldadversely affect ouroperating results.
The sources and prices of the primary materials (such as steel, resins, and base metals) used to manufacture our products andcomponents containing those materials are susceptible to significant global and regional price fluctuations due to supply/demandtrends, transportation costs, government regulations (such as conflict mineral provisions) and tariffs, changes in currency exchangerates, price controls, the economic climate, and other unforeseen circumstances. Significant increases in these and other costs in thefuture could have a material adverse effect on our operating results.
Foreign currencyfluctuations may affectour financialperformance.
We generate a significant portion of our revenue and incur a significant portion of our expenses in foreign currencies. Changes inthe exchange rates of functional currencies of those operations affect the U.S. dollar value of our revenue and earnings from ourforeign operations. We use currency forwards, net investment hedges, and options to manage our foreign currency transactionexposures. We cannot completely eliminate our exposure to foreign currency fluctuations, which may adversely affect our financialperformance. In addition, because our consolidated financial results are reported in U.S. dollars, if we generate sales or earnings inother currencies, the translation of those results into U.S. dollars can result in a significant increase or decrease in the amount ofthose sales or earnings. Finally, the amount of legal contingencies related to foreign operations may fluctuate significantly basedupon changes in exchange rates and usually cannot be managed with currency forwards, options or other arrangements. Suchfluctuations in exchange rates can significantly increase or decrease the amount of any legal contingency related to our foreignoperations and make it difficult to assess and manage the potential exposure.
We face inventory andother asset risk.
We write down product and component inventories that have become obsolete or do not meet anticipated demand or net realizablevalue. We also review our long-lived and intangible assets for impairment whenever events or changed circumstances indicate thecarrying amount of an asset may not be recoverable. If we determine that impairment has occurred, we record a write-down toadjust carrying value to fair value. No assurance can be given that, given the unpredictable pace of product obsolescence andbusiness conditions with trade customers and in general, we will not incur additional inventory or asset related charges. Suchcharges could negatively affect our financial condition and operating results.
12
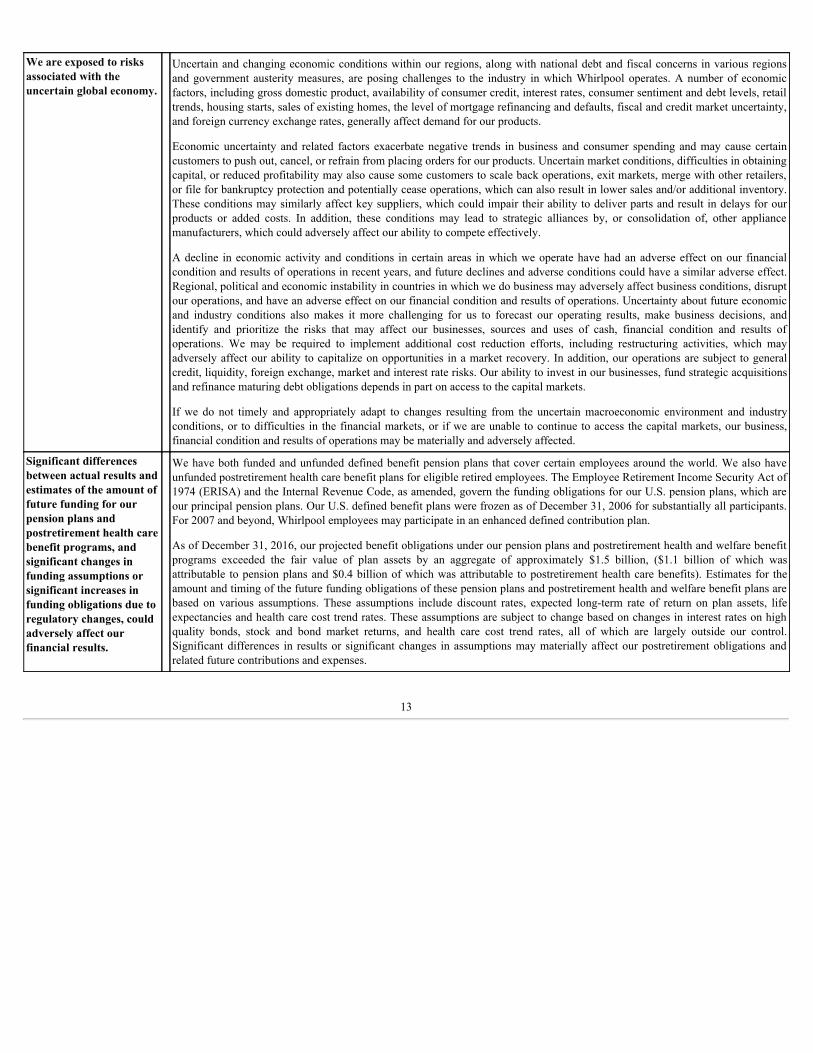
We are exposed to risksassociated with theuncertain global economy.
Uncertain and changing economic conditions within our regions, along with national debt and fiscal concerns in various regionsand government austerity measures, are posing challenges to the industry in which Whirlpool operates. A number of economicfactors, including gross domestic product, availability of consumer credit, interest rates, consumer sentiment and debt levels, retailtrends, housing starts, sales of existing homes, the level of mortgage refinancing and defaults, fiscal and credit market uncertainty,and foreign currency exchange rates, generally affect demand for our products.
Economic uncertainty and related factors exacerbate negative trends in business and consumer spending and may cause certaincustomers to push out, cancel, or refrain from placing orders for our products. Uncertain market conditions, difficulties in obtainingcapital, or reduced profitability may also cause some customers to scale back operations, exit markets, merge with other retailers,or file for bankruptcy protection and potentially cease operations, which can also result in lower sales and/or additional inventory.These conditions may similarly affect key suppliers, which could impair their ability to deliver parts and result in delays for ourproducts or added costs. In addition, these conditions may lead to strategic alliances by, or consolidation of, other appliancemanufacturers, which could adversely affect our ability to compete effectively.
A decline in economic activity and conditions in certain areas in which we operate have had an adverse effect on our financialcondition and results of operations in recent years, and future declines and adverse conditions could have a similar adverse effect.Regional, political and economic instability in countries in which we do business may adversely affect business conditions, disruptour operations, and have an adverse effect on our financial condition and results of operations. Uncertainty about future economicand industry conditions also makes it more challenging for us to forecast our operating results, make business decisions, andidentify and prioritize the risks that may affect our businesses, sources and uses of cash, financial condition and results ofoperations. We may be required to implement additional cost reduction efforts, including restructuring activities, which mayadversely affect our ability to capitalize on opportunities in a market recovery. In addition, our operations are subject to generalcredit, liquidity, foreign exchange, market and interest rate risks. Our ability to invest in our businesses, fund strategic acquisitionsand refinance maturing debt obligations depends in part on access to the capital markets.
If we do not timely and appropriately adapt to changes resulting from the uncertain macroeconomic environment and industryconditions, or to difficulties in the financial markets, or if we are unable to continue to access the capital markets, our business,financial condition and results of operations may be materially and adversely affected.
Significant differencesbetween actual results andestimates of the amount offuture funding for ourpension plans andpostretirement health carebenefit programs, andsignificant changes infunding assumptions orsignificant increases infunding obligations due toregulatory changes, couldadversely affect ourfinancial results.
We have both funded and unfunded defined benefit pension plans that cover certain employees around the world. We also haveunfunded postretirement health care benefit plans for eligible retired employees. The Employee Retirement Income Security Act of1974 (ERISA) and the Internal Revenue Code, as amended, govern the funding obligations for our U.S. pension plans, which areour principal pension plans. Our U.S. defined benefit plans were frozen as of December 31, 2006 for substantially all participants.For 2007 and beyond, Whirlpool employees may participate in an enhanced defined contribution plan.
As of December 31, 2016, our projected benefit obligations under our pension plans and postretirement health and welfare benefitprograms exceeded the fair value of plan assets by an aggregate of approximately $1.5 billion, ($1.1 billion of which wasattributable to pension plans and $0.4 billion of which was attributable to postretirement health care benefits). Estimates for theamount and timing of the future funding obligations of these pension plans and postretirement health and welfare benefit plans arebased on various assumptions. These assumptions include discount rates, expected long-term rate of return on plan assets, lifeexpectancies and health care cost trend rates. These assumptions are subject to change based on changes in interest rates on highquality bonds, stock and bond market returns, and health care cost trend rates, all of which are largely outside our control.Significant differences in results or significant changes in assumptions may materially affect our postretirement obligations andrelated future contributions and expenses.
13
LEGAL & COMPLIANCE RISKS
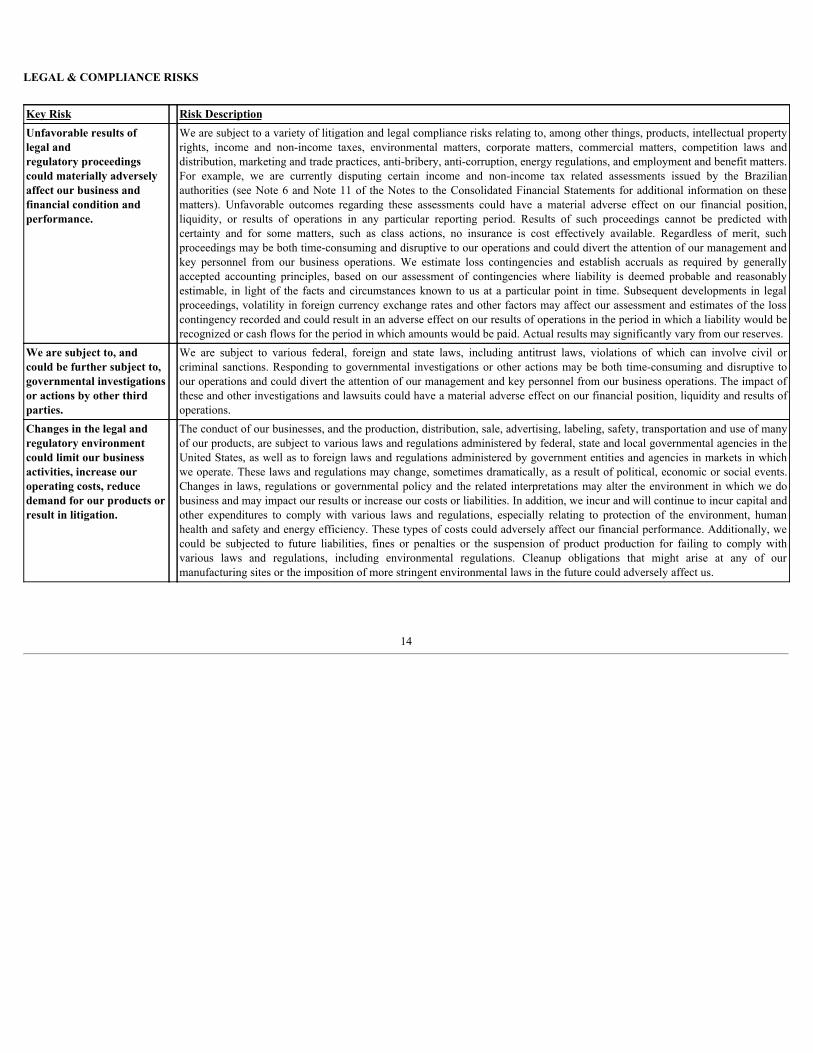
Key Risk Risk DescriptionUnfavorable results oflegal andregulatory proceedingscould materially adverselyaffect our business andfinancial condition andperformance.
We are subject to a variety of litigation and legal compliance risks relating to, among other things, products, intellectual propertyrights, income and non-income taxes, environmental matters, corporate matters, commercial matters, competition laws anddistribution, marketing and trade practices, anti-bribery, anti-corruption, energy regulations, and employment and benefit matters.For example, we are currently disputing certain income and non-income tax related assessments issued by the Brazilianauthorities (see Note 6 and Note 11 of the Notes to the Consolidated Financial Statements for additional information on thesematters). Unfavorable outcomes regarding these assessments could have a material adverse effect on our financial position,liquidity, or results of operations in any particular reporting period. Results of such proceedings cannot be predicted withcertainty and for some matters, such as class actions, no insurance is cost effectively available. Regardless of merit, suchproceedings may be both time-consuming and disruptive to our operations and could divert the attention of our management andkey personnel from our business operations. We estimate loss contingencies and establish accruals as required by generallyaccepted accounting principles, based on our assessment of contingencies where liability is deemed probable and reasonablyestimable, in light of the facts and circumstances known to us at a particular point in time. Subsequent developments in legalproceedings, volatility in foreign currency exchange rates and other factors may affect our assessment and estimates of the losscontingency recorded and could result in an adverse effect on our results of operations in the period in which a liability would berecognized or cash flows for the period in which amounts would be paid. Actual results may significantly vary from our reserves.
We are subject to, andcould be further subject to,governmental investigationsor actions by other thirdparties.
We are subject to various federal, foreign and state laws, including antitrust laws, violations of which can involve civil orcriminal sanctions. Responding to governmental investigations or other actions may be both time-consuming and disruptive toour operations and could divert the attention of our management and key personnel from our business operations. The impact ofthese and other investigations and lawsuits could have a material adverse effect on our financial position, liquidity and results ofoperations.
Changes in the legal andregulatory environmentcould limit our businessactivities, increase ouroperating costs, reducedemand for our products orresult in litigation.
The conduct of our businesses, and the production, distribution, sale, advertising, labeling, safety, transportation and use of manyof our products, are subject to various laws and regulations administered by federal, state and local governmental agencies in theUnited States, as well as to foreign laws and regulations administered by government entities and agencies in markets in whichwe operate. These laws and regulations may change, sometimes dramatically, as a result of political, economic or social events.Changes in laws, regulations or governmental policy and the related interpretations may alter the environment in which we dobusiness and may impact our results or increase our costs or liabilities. In addition, we incur and will continue to incur capital andother expenditures to comply with various laws and regulations, especially relating to protection of the environment, humanhealth and safety and energy efficiency. These types of costs could adversely affect our financial performance. Additionally, wecould be subjected to future liabilities, fines or penalties or the suspension of product production for failing to comply withvarious laws and regulations, including environmental regulations. Cleanup obligations that might arise at any of ourmanufacturing sites or the imposition of more stringent environmental laws in the future could adversely affect us.
14

ITEM 1B. UNRESOLVED STAFF COMMENTS
None.
ITEM 2. PROPERTIES
Our principal executive offices are located in Benton Harbor, Michigan. On December 31, 2016 , our principal manufacturing operations were carried on at 42 locations in 14 countries worldwide. We occupied a total of approximately 86.4 million square feet devoted to manufacturing, service, sales andadministrative offices, warehouse and distribution space. Over 37.9 million square feet of such space was occupied under lease. Whirlpool properties includefacilities which are suitable and adequate for the manufacture and distribution of Whirlpool’s products. The Company’s principal manufacturing sites by operatingsegment were as follows:
Segment Country Principal Manufacturing Locations
North AmericaUnitedStates 10Mexico 3
Europe, Middle East and Africa
France 1Italy 5Poland 3Russia 1Slovakia 1South-Africa 1Turkey 1UnitedKingdom 1
Latin America
Brazil 4China 1Colombia 1Italy 1Slovakia 1Mexico 1
AsiaChina 3India 3
Total 42
ITEM 3. LEGAL PROCEEDINGS
Information regarding legal proceedings can be found in Note 6 to the Consolidated Financial Statements and is incorporated herein by reference.
ITEM 4. MINE SAFETY DISCLOSURES
Not applicable.
15
PART II
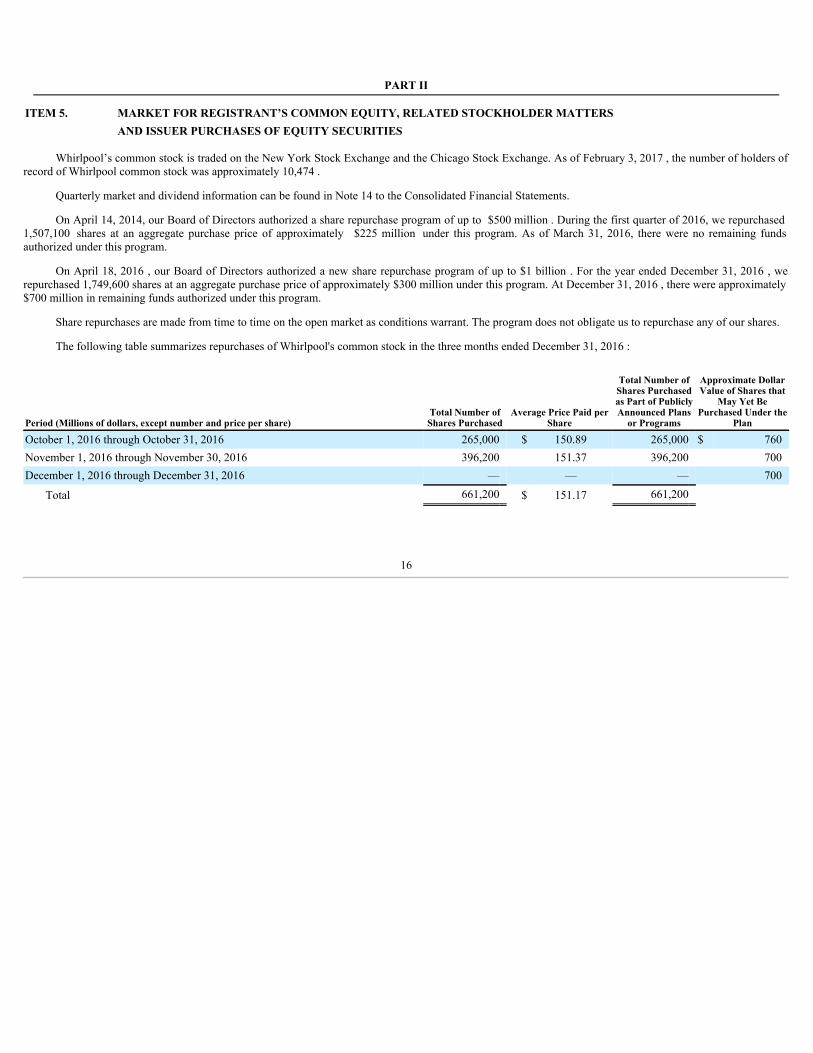
ITEM 5. MARKET FOR REGISTRANT’S COMMON EQUITY, RELATED STOCKHOLDER MATTERS AND ISSUER PURCHASES OF EQUITY SECURITIES
Whirlpool’s common stock is traded on the New York Stock Exchange and the Chicago Stock Exchange. As of February 3, 2017 , the number of holders ofrecord of Whirlpool common stock was approximately 10,474 .
Quarterly market and dividend information can be found in Note 14 to the Consolidated Financial Statements.
On April 14, 2014, our Board of Directors authorized a share repurchase program of up to $500 million . During the first quarter of 2016, we repurchased 1,507,100 shares at an aggregate purchase price of approximately $225 million under this program. As of March 31, 2016, there were no remaining fundsauthorized under this program.
On April 18, 2016 , our Board of Directors authorized a new share repurchase program of up to $1 billion . For the year ended December 31, 2016 , werepurchased 1,749,600 shares at an aggregate purchase price of approximately $300 million under this program. At December 31, 2016 , there were approximately$700 million in remaining funds authorized under this program.
Share repurchases are made from time to time on the open market as conditions warrant. The program does not obligate us to repurchase any of our shares.
The following table summarizes repurchases of Whirlpool's common stock in the three months ended December 31, 2016 :
Period (Millions of dollars, except number and price per share)Total Number ofShares Purchased
Average Price Paid perShare
Total Number ofShares Purchasedas Part of PubliclyAnnounced Plans
or Programs
Approximate DollarValue of Shares that
May Yet BePurchased Under the
Plan
October 1, 2016 through October 31, 2016 265,000 $ 150.89 265,000 $ 760November 1, 2016 through November 30, 2016 396,200 151.37 396,200 700December 1, 2016 through December 31, 2016 — — — 700
Total 661,200 $ 151.17 661,200
16
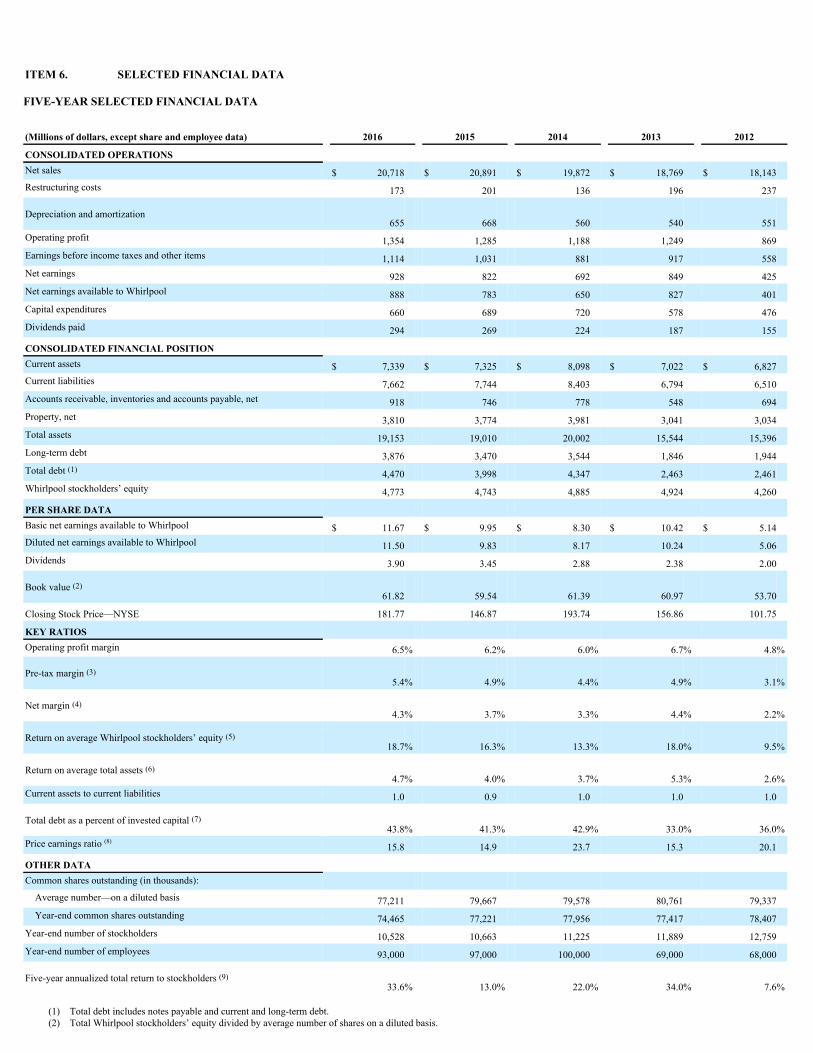
ITEM 6. SELECTED FINANCIAL DATA
FIVE-YEAR SELECTED FINANCIAL DATA
(Millions of dollars, except share and employee data) 2016 2015 2014 2013 2012
CONSOLIDATED OPERATIONS Net sales $ 20,718 $ 20,891 $ 19,872 $ 18,769 $ 18,143Restructuring costs 173 201 136 196 237
Depreciation and amortization 655 668 560 540 551Operating profit 1,354 1,285 1,188 1,249 869Earnings before income taxes and other items 1,114 1,031 881 917 558Net earnings 928 822 692 849 425Net earnings available to Whirlpool 888 783 650 827 401Capital expenditures 660 689 720 578 476Dividends paid 294 269 224 187 155
CONSOLIDATED FINANCIAL POSITION Current assets $ 7,339 $ 7,325 $ 8,098 $ 7,022 $ 6,827Current liabilities 7,662 7,744 8,403 6,794 6,510Accounts receivable, inventories and accounts payable, net 918 746 778 548 694Property, net 3,810 3,774 3,981 3,041 3,034Total assets 19,153 19,010 20,002 15,544 15,396Long-term debt 3,876 3,470 3,544 1,846 1,944Total debt (1) 4,470 3,998 4,347 2,463 2,461Whirlpool stockholders’ equity 4,773 4,743 4,885 4,924 4,260
PER SHARE DATA Basic net earnings available to Whirlpool $ 11.67 $ 9.95 $ 8.30 $ 10.42 $ 5.14Diluted net earnings available to Whirlpool 11.50 9.83 8.17 10.24 5.06Dividends 3.90 3.45 2.88 2.38 2.00
Book value (2) 61.82 59.54 61.39 60.97 53.70
Closing Stock Price—NYSE 181.77 146.87 193.74 156.86 101.75
KEY RATIOS Operating profit margin 6.5% 6.2% 6.0% 6.7% 4.8%
Pre-tax margin (3) 5.4% 4.9% 4.4% 4.9% 3.1%
Net margin (4) 4.3% 3.7% 3.3% 4.4% 2.2%
Return on average Whirlpool stockholders’ equity (5) 18.7% 16.3% 13.3% 18.0% 9.5%
Return on average total assets (6) 4.7% 4.0% 3.7% 5.3% 2.6%
Current assets to current liabilities 1.0 0.9 1.0 1.0 1.0
Total debt as a percent of invested capital (7) 43.8% 41.3% 42.9% 33.0% 36.0%
Price earnings ratio (8) 15.8 14.9 23.7 15.3 20.1
OTHER DATA Common shares outstanding (in thousands): Average number—on a diluted basis 77,211 79,667 79,578 80,761 79,337 Year-end common shares outstanding 74,465 77,221 77,956 77,417 78,407Year-end number of stockholders 10,528 10,663 11,225 11,889 12,759Year-end number of employees 93,000 97,000 100,000 69,000 68,000
Five-year annualized total return to stockholders (9) 33.6% 13.0% 22.0% 34.0% 7.6%
(1) Total debt includes notes payable and current and long-term debt.(2) Total Whirlpool stockholders’ equity divided by average number of shares on a diluted basis.

(3) Earnings (loss) before income taxes, as a percent of net sales.(4) Net earnings available to Whirlpool, as a percent of net sales.(5) Net earnings available to Whirlpool, divided by average Whirlpool stockholders’ equity.(6) Net earnings available to Whirlpool, divided by average total assets.(7) Total debt divided by total debt and total stockholders’ equity.(8) Closing stock price divided by diluted net earnings available to Whirlpool.(9) Stock appreciation plus reinvested dividends, divided by share price at the beginning of the period.
17
ITEM 7. MANAGEMENT’S DISCUSSION AND ANALYSIS OF FINANCIAL CONDITION AND RESULTS OF OPERATIONS
This Management Discussion and Analysis should be read in connection with the Consolidated Financial Statements, Notes to the Consolidated FinancialStatements and Selected Financial Data included in this Form 10-K. Certain references to particular information in the Notes to the Consolidated FinancialStatements are made to assist readers.
ABOUT WHIRLPOOL
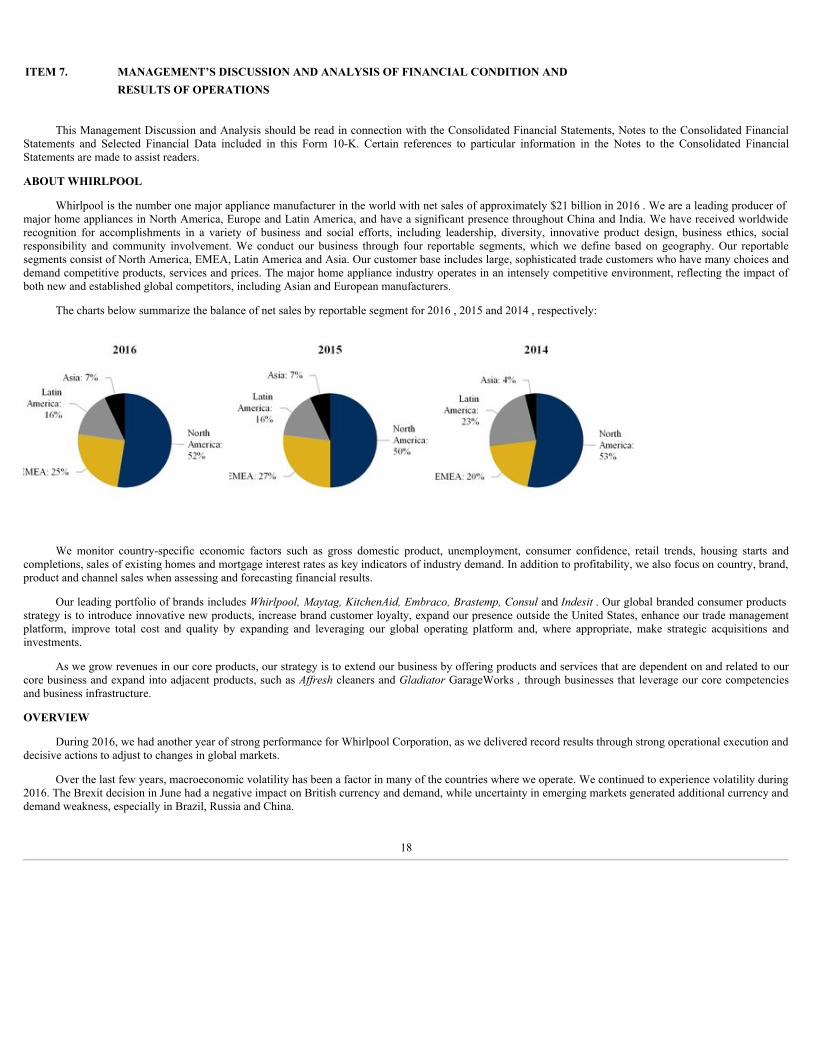
Whirlpool is the number one major appliance manufacturer in the world with net sales of approximately $21 billion in 2016 . We are a leading producer ofmajor home appliances in North America, Europe and Latin America, and have a significant presence throughout China and India. We have received worldwiderecognition for accomplishments in a variety of business and social efforts, including leadership, diversity, innovative product design, business ethics, socialresponsibility and community involvement. We conduct our business through four reportable segments, which we define based on geography. Our reportablesegments consist of North America, EMEA, Latin America and Asia. Our customer base includes large, sophisticated trade customers who have many choices anddemand competitive products, services and prices. The major home appliance industry operates in an intensely competitive environment, reflecting the impact ofboth new and established global competitors, including Asian and European manufacturers.
The charts below summarize the balance of net sales by reportable segment for 2016 , 2015 and 2014 , respectively:
We monitor country-specific economic factors such as gross domestic product, unemployment, consumer confidence, retail trends, housing starts andcompletions, sales of existing homes and mortgage interest rates as key indicators of industry demand. In addition to profitability, we also focus on country, brand,product and channel sales when assessing and forecasting financial results.
Our leading portfolio of brands includes Whirlpool,Maytag,KitchenAid,Embraco,Brastemp,Consuland Indesit. Our global branded consumer productsstrategy is to introduce innovative new products, increase brand customer loyalty, expand our presence outside the United States, enhance our trade managementplatform, improve total cost and quality by expanding and leveraging our global operating platform and, where appropriate, make strategic acquisitions andinvestments.
As we grow revenues in our core products, our strategy is to extend our business by offering products and services that are dependent on and related to ourcore business and expand into adjacent products, such as Affreshcleaners and GladiatorGarageWorks ,through businesses that leverage our core competenciesand business infrastructure.
OVERVIEW
During 2016, we had another year of strong performance for Whirlpool Corporation, as we delivered record results through strong operational execution anddecisive actions to adjust to changes in global markets.
Over the last few years, macroeconomic volatility has been a factor in many of the countries where we operate. We continued to experience volatility during2016. The Brexit decision in June had a negative impact on British currency and demand, while uncertainty in emerging markets generated additional currency anddemand weakness, especially in Brazil, Russia and China.
18
MANAGEMENT'S DISCUSSION AND ANALYSIS OF FINANCIAL CONDITION ANDRESULTS OF OPERATIONS - (CONTINUED)
These challenges, along with a further strengthening U.S. dollar, had a combined negative impact of approximately $600 million in revenue and $2 per share ofearnings.
Our earnings growth and strong cash generation enabled us to create long-term shareholder value through the execution of our balanced capital allocationapproach. We invested in our innovation pipeline through $660 million in capital expenditures while increasing our dividend by 11% and repurchasing $525million in common stock. These investments continue to be supported by a strong balance sheet, an increased capacity to invest and the confidence that ouroperating plans will deliver extraordinary levels of shareholder value both now and in the future.
Our long-term value creation framework is built upon the strong foundation we have in place: our industry-leading brand portfolio and robust productinnovation pipeline, supported by our best cost global operating platform and executed by our exceptional employees throughout the world. We will measure thesevalue-creation components by focusing on the following key metrics:
• Deliver 3 to 5 percent annual organic net sales growth across our global footprint
• Grow earnings per share by 10 to 15 percent annually
• Expand EBIT margins to 10 percent plus by 2020 through strong cost productivity programs and further leveraging our strong brands and innovative newproducts
• Generate free cash flow of 5 to 6 percent of net sales by 2018, which represents over 85 percent earnings to free cash conversion
We remain confident in our ability to effectively manage our business regardless of the operating environment and expect to continue delivering long-termvalue for all of our shareholders.
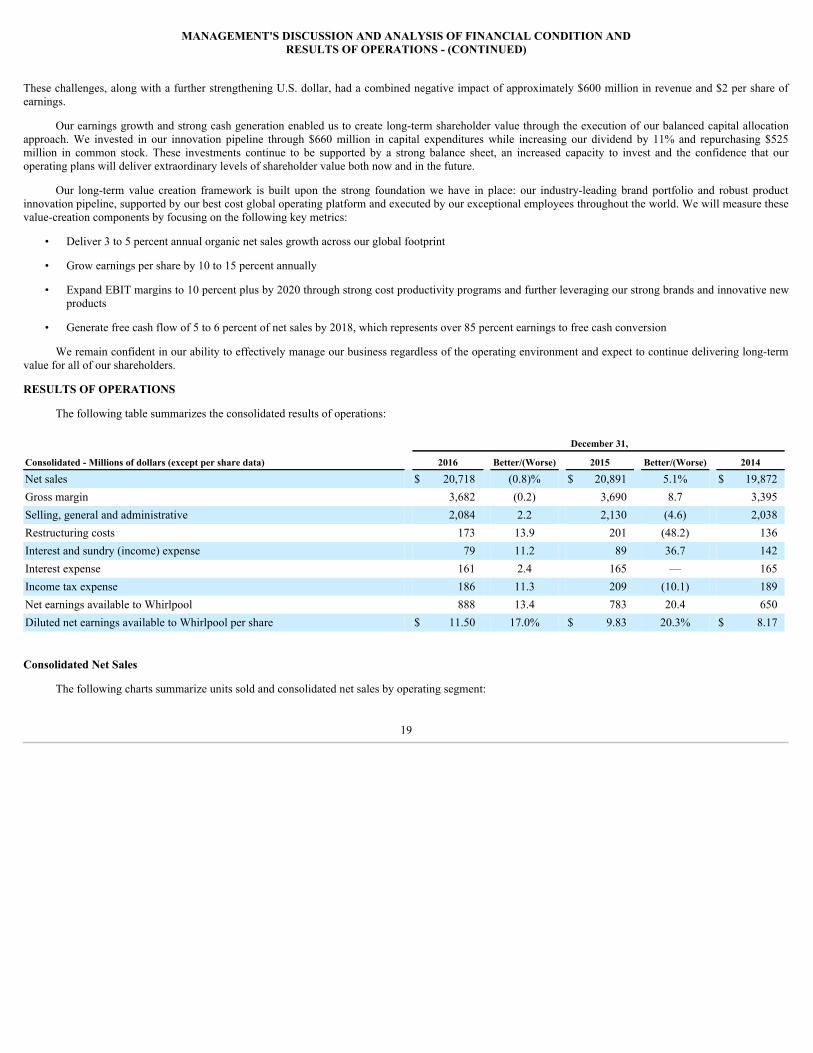
RESULTS OF OPERATIONS
The following table summarizes the consolidated results of operations:
December 31,
Consolidated - Millions of dollars (except per share data) 2016 Better/(Worse) 2015 Better/(Worse) 2014
Net sales $ 20,718 (0.8)% $ 20,891 5.1% $ 19,872Gross margin 3,682 (0.2) 3,690 8.7 3,395Selling, general and administrative 2,084 2.2 2,130 (4.6) 2,038Restructuring costs 173 13.9 201 (48.2) 136Interest and sundry (income) expense 79 11.2 89 36.7 142Interest expense 161 2.4 165 — 165Income tax expense 186 11.3 209 (10.1) 189Net earnings available to Whirlpool 888 13.4 783 20.4 650Diluted net earnings available to Whirlpool per share $ 11.50 17.0% $ 9.83 20.3% $ 8.17
Consolidated Net Sales
The following charts summarize units sold and consolidated net sales by operating segment:
19

MANAGEMENT'S DISCUSSION AND ANALYSIS OF FINANCIAL CONDITION ANDRESULTS OF OPERATIONS - (CONTINUED)
20

MANAGEMENT'S DISCUSSION AND ANALYSIS OF FINANCIAL CONDITION ANDRESULTS OF OPERATIONS - (CONTINUED)
Consolidated net sales decrease d 0.8% compared to 2015 primarily driven by unfavorable impacts from foreign currency and product price/mix, partiallyoffset by higher unit volumes. Excluding the impact of foreign currency, consolidated net sales increased 1.6% compared to 2015 . Consolidated net sales for 2015increase d 5.1% compared to 2014 primarily driven by increased volume due to acquisitions and favorable product price/mix, partially offset by the unfavorableimpact of foreign currency and a weakened demand environment in emerging markets. Excluding the impact of foreign currency and BEFIEX in 2014,consolidated net sales for 2015 increased 18.1% compared to 2014 .
We provide the percentage change in net sales, excluding the impact of foreign currency and BEFIEX, as a supplement to the change in net sales asdetermined by U.S. generally accepted accounting principles ("GAAP") to provide stockholders with a clearer basis to assess Whirlpool's results over time. Thismeasure is considered a non-GAAP financial measure and is calculated by translating the current period net sales in functional currency, to U.S. dollars using theprior-year's exchange rate compared to the prior-year period net sales and BEFIEX.
Significant regional trends were as follows:
• North America net sales increase d 3.9% compared to 2015 primarily due to a 7.7% increase in units sold, partially offset by unfavorable impactsfrom product price/mix and foreign currency. Excluding the impact of foreign currency, net sales increased 5.0% in 2016 . North America net salesfor 2015 increase d 0.9% compared to 2014 primarily due to a 1.4% increase in units sold and favorable product/price mix, partially offset by foreigncurrency. Excluding the impact of foreign currency, net sales increased 3.2% in 2015 .
• EMEA net sales decrease d 8.1% compared to 2015 , primarily due to unfavorable impacts from foreign currency, product price/mix, and a 1.9%decrease in units sold. Excluding the impact of foreign currency, net sales decreased 4.3% in 2016 . EMEA net sales for 2015 increase d 43.4%compared to 2014 , primarily due to a 59.7% increase in units sold due to the acquisition of Indesit and favorable product mix, partially offset byunfavorable foreign currency. Excluding the impact of foreign currency, net sales increased 75.3% in 2015 .
• Latin America net sales decrease d 4.7% compared to 2015 primarily due to a 11.5% decrease in units sold and unfavorable impacts from foreigncurrency, partially offset by favorable product price/mix. Excluding the impact of foreign currency, Latin America net sales decreased 1.5% in 2016 .Latin America net sales for 2015 decrease d 28.5% compared to 2014 primarily due to a 21.3% decrease in units sold and unfavorable foreigncurrency, partially offset by favorable product mix. Excluding the impact of foreign currency and BEFIEX, Latin America net sales decreased 5.9%in 2015 .
• Asia net sales increase d 0.5 % compared to 2015 primarily due to a 12.3% increase in units sold, partially offset by unfavorable impacts fromproduct price/mix and foreign currency. Excluding the impact of foreign currency, Asia net sales increased 5.4% in 2016 . Asia net sales for 2015increase d 73.6% compared to 2014 primarily due to a 78.8% increase in units sold driven by the acquisition of Hefei Sanyo. Excluding the impact offoreign currency, Asia net sales increased 78.3% in 2015 .
21
MANAGEMENT'S DISCUSSION AND ANALYSIS OF FINANCIAL CONDITION ANDRESULTS OF OPERATIONS - (CONTINUED)
Gross Margin
The chart below summarizes gross margin percentages by operating segment:
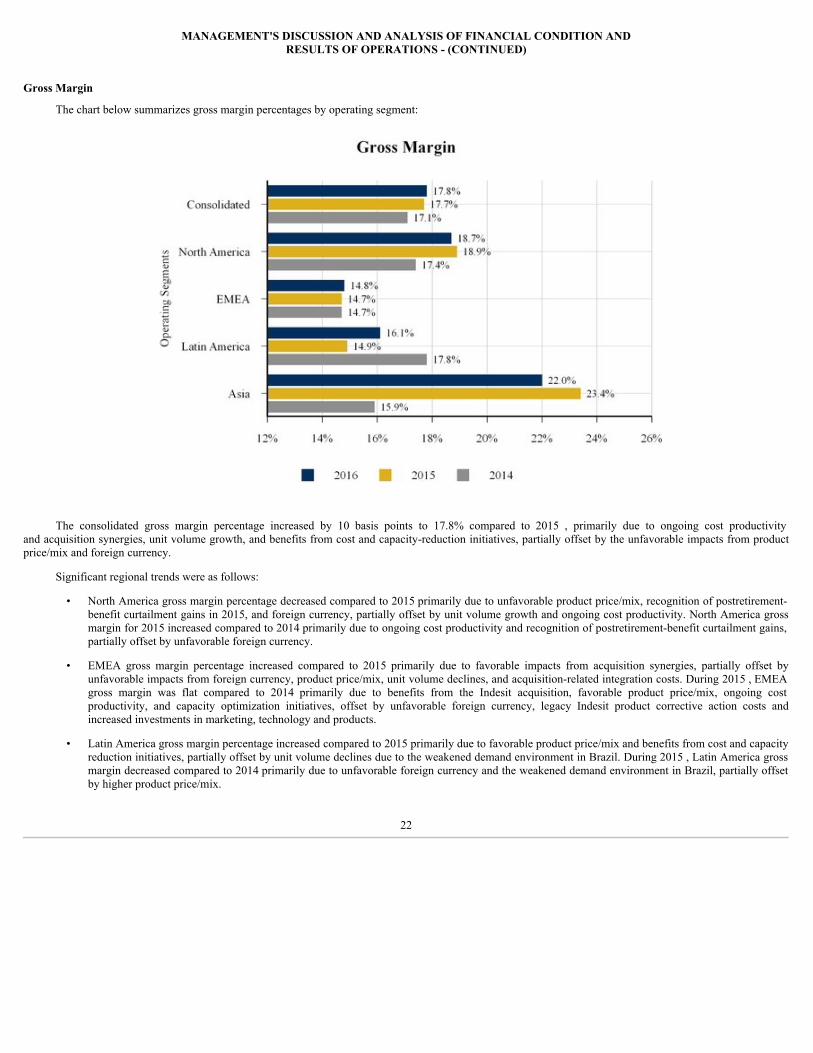
The consolidated gross margin percentage increased by 10 basis points to 17.8% compared to 2015 , primarily due to ongoing cost productivityand acquisition synergies, unit volume growth, and benefits from cost and capacity-reduction initiatives, partially offset by the unfavorable impacts from productprice/mix and foreign currency.
Significant regional trends were as follows:
• North America gross margin percentage decreased compared to 2015 primarily due to unfavorable product price/mix, recognition of postretirement-benefit curtailment gains in 2015, and foreign currency, partially offset by unit volume growth and ongoing cost productivity. North America grossmargin for 2015 increased compared to 2014 primarily due to ongoing cost productivity and recognition of postretirement-benefit curtailment gains,partially offset by unfavorable foreign currency.
• EMEA gross margin percentage increased compared to 2015 primarily due to favorable impacts from acquisition synergies, partially offset byunfavorable impacts from foreign currency, product price/mix, unit volume declines, and acquisition-related integration costs. During 2015 , EMEAgross margin was flat compared to 2014 primarily due to benefits from the Indesit acquisition, favorable product price/mix, ongoing costproductivity, and capacity optimization initiatives, offset by unfavorable foreign currency, legacy Indesit product corrective action costs andincreased investments in marketing, technology and products.
• Latin America gross margin percentage increased compared to 2015 primarily due to favorable product price/mix and benefits from cost and capacityreduction initiatives, partially offset by unit volume declines due to the weakened demand environment in Brazil. During 2015 , Latin America grossmargin decreased compared to 2014 primarily due to unfavorable foreign currency and the weakened demand environment in Brazil, partially offsetby higher product price/mix.
22
MANAGEMENT'S DISCUSSION AND ANALYSIS OF FINANCIAL CONDITION ANDRESULTS OF OPERATIONS - (CONTINUED)
• Asia gross margin percentage decreased in 2016 , compared to 2015 , primarily due to unfavorable product price/mix and increased investments inmarketing, technology and products, partially offset by unit volume growth and benefits from ongoing cost productivity. During 2015 , Asia grossmargin increased compared to 2014 primarily due to acquisition synergies, partially offset by increased investments in marketing, technology andproducts.
Selling, General and Administrative
The following table summarizes selling, general and administrative expenses as a percentage of sales by operating segment:
December 31,
Millions of dollars 2016 As a %
of Net Sales 2015 As a %
of Net Sales 2014 As a %
of Net Sales
North America $ 783 7.0 % $ 762 7.1 % $ 761 7.2 %EMEA 577 11.2 604 10.8 506 13.0 Latin America 305 9.6 315 9.4 359 7.7 Asia 216 15.2 226 16.0 146 17.9 Corporate/other 203 — 223 — 266 — Consolidated $ 2,084 10.1 % $ 2,130 10.2 % $ 2,038 10.3 %
Consolidated selling, general and administrative expenses as a percent of consolidated net sales in 2016 and 2015 , compared to the previous years, reflectthe favorable impact of acquisition synergies, partially offset by foreign currency.
Restructuring
We incurred restructuring charges of $173 million , $201 million , and $136 million for the years ended December 31 , 2016 , 2015 and 2014 , respectively.For the full year 2017, we expect to incur up to $200 million of restructuring charges, which will result in ongoing substantial cost reductions.
Additional information about restructuring activities can be found in Note 10 of the Notes to the Consolidated Financial Statements.
Interest and Sundry (Income) Expense
Interest and sundry (income) expense decrease d $10 million compared to 2015 , primarily due to amounts received pursuant to an agreement, reached in thefourth quarter of 2016, with the seller of Indesit to recover a portion of our acquisition related costs. During 2015 , interest and sundry (income) expense decrease d$53 million compared to 2014 , primarily due to a $64 million gain related to a business investment in Brazil during 2015 and previous year investment expensesrelated to the Hefei Sanyo and Indesit acquisitions, partially offset by impact from foreign currency.
For additional information about the Embraco antitrust matters and legacy product warranty cost, see Note 6 of the Notes to the Consolidated FinancialStatements. For additional information about the acquisitions of Hefei Sanyo and Indesit , see the Financial Condition and Liquidity section of Management'sDiscussion and Analysis.
Interest Expense
Interest expense decreased by $ 4 million compared to 2015 . This was a result of lower average interest rates on long-term debt, offset by higher averagelong-term debt balances. During 2015 , interest expense was unchanged compared to 2014 . This was a result of higher average long-term debt balances, offset bylower average interest rates on long-term debt.
Income Taxes
Income tax expenses were $186 million , $209 million , and $189 million in 2016 , 2015 and 2014 , respectively. The decrease in tax expense in 2016compared to 2015 is primarily due to favorable audits and settlements and tax planning resulting in valuation allowance releases, partially offset by higher pre-taxearnings. The increase in tax expense in 2015 compared to 2014 is primarily due to higher pre-tax earnings, partially offset by a lower effective tax rate.
For additional information about our consolidated tax provision, see Note 11 of the Notes to the Consolidated Financial Statements.
23

MANAGEMENT'S DISCUSSION AND ANALYSIS OF FINANCIAL CONDITION ANDRESULTS OF OPERATIONS - (CONTINUED)
FORWARD-LOOKING PERSPECTIVE
Earnings per diluted share presented below are net of tax, while each adjustment is presented on a pre-tax basis. The aggregate income tax impact of thetaxable components of each adjustment is presented in the income tax impact line item at our anticipated 2017 full-year tax rate of 22% . We currently estimateearnings per diluted share and industry demand for 2017 to be within the following ranges:
2017 Current Outlook
Estimated earnings per diluted share, for the year ending December 31, 2017 $13.25 — $14.25Including:
Restructuring Expense $(2.62)Income Tax Impact $0.58
Industry demand
North America (1) +4% — +6%EMEA +1% — +2%Latin America (2) FlatAsia Flat — +2%
(1) Reflects industry demand in the United States.(2) Reflects industry demand in Brazil.
For the full-year 2017 , we expect to generate cash from operating activities of $1.7 billion to $1.75 billion and free cash flow of approximately $1 billion ,including primarily acquisition related restructuring cash outlays of up to $165 million , legacy product warranty and liability costs of $69 million , pensioncontributions of $42 million and, with respect to free cash flow, capital expenditures of $700 million to $750 million .
The table below reconciles projected 2017 cash provided by operating activities determined in accordance with GAAP to free cash flow, a non-GAAPmeasure. Management believes that free cash flow provides stockholders with a relevant measure of liquidity and a useful basis for assessing Whirlpool’s ability tofund its activities and obligations. There are limitations to using non-GAAP financial measures, including the difficulty associated with comparing companies thatuse similarly named non-GAAP measures whose calculations may differ from our calculations. We define free cash flow as cash provided by continuing operationsless capital expenditures and including proceeds from the sale of assets/businesses, and changes in restricted cash. The change in restricted cash relates to theprivate placement funds paid by Whirlpool to acquire majority control of Hefei Sanyo in 2014 and which are used to fund capital expenditures and technicalresources to enhance Whirlpool China’s research and development and working capital, as required by the terms of the Hefei Sanyo acquisition made in October2014.
2017Millions of dollars Current Outlook
Cash provided by operating activities (1) $ 1,700 — $ 1,750Capital expenditures, proceeds from sale of assets/businesses and changes in restricted cash (700) — (750)
Free cash flow ~ $1,000(1) Financial guidance on a GAAP basis for cash provided by (used in) financing activities and cash provided by (used in) investing activities has not been provided because in order to prepareany such estimate or projection, the Company would need to rely on market factors and certain other conditions and assumptions that are outside of its control.
The projections above are based on many estimates and are inherently subject to change based on future decisions made by management and the Board ofDirectors of Whirlpool, and significant economic, competitive and other uncertainties and contingencies.
FINANCIAL CONDITION AND LIQUIDITY
Our objective is to finance our business through operating cash flow and the appropriate mix of long-term and short-term debt. By diversifying the maturitystructure, we avoid concentrations of debt, reducing liquidity risk. We have varying needs for short-term working capital financing as a result of the nature of ourbusiness. We regularly review our capital structure and liquidity priorities, which include funding the business through capital and engineering spending to supportinnovation and productivity initiatives, funding our pension plan and term debt liabilities, providing return to shareholders and potential acquisitions.
24

MANAGEMENT'S DISCUSSION AND ANALYSIS OF FINANCIAL CONDITION ANDRESULTS OF OPERATIONS - (CONTINUED)
Our short term potential uses of liquidity include funding our ongoing capital spending, restructuring activities, funding pension plans and returns toshareholders. We also have $560 million of term debt maturing in the next twelve months, and are currently evaluating our options in connection with thismaturing debt, which may include repayment through refinancing, through free cash flow generation, or cash on hand.
We monitor the credit ratings and market indicators of credit risk of our lending, depository, and derivative counterparty banks regularly, and take certainaction to manage credit risk. We diversify our deposits and investments in short term cash equivalents to limit the concentration of exposure by counterparty.
As of December 31, 2016 , the only country where we had cash or cash equivalents greater than 1% of our consolidated assets was China, which represented2.4%. In addition, we did not have any third-party accounts receivable greater than 1% of our consolidated assets in any single country outside of North America,with the exceptions of Italy, China, and Brazil which represented 1.0%, 1.0%, and 1.3% respectively. We continue to monitor general financial instability anduncertainty globally.
As of December 31, 2016 , we had €67 million (approximately $71 million as of December 31, 2016 ) in outstanding trade receivables and short-term andlong-term notes due to us associated with Alno AG, a long-standing European customer. Approximately €49 million (approximately $51 million as ofDecember 31, 2016 ) of the outstanding receivables were overdue as of December 31, 2016 . Our exposure includes not only the outstanding receivables but alsothe potential risks of an Alno AG bankruptcy and impacts to our distribution process. We believe our reserves related to these outstanding receivables aresufficient. In the fourth quarter of 2016, Whirlpool sold its remaining investment of approximately 10.6 million shares in Alno AG for approximately €5 million(approximately $6 million). We continue to monitor customer financial conditions globally.
The Company had cash and cash equivalents of approximately $1.1 billion at December 31, 2016 , of which approximately $1.0 billion was held bysubsidiaries in foreign countries. For each of its foreign subsidiaries, the Company makes an assertion regarding the amount of earnings intended for permanentreinvestment, with the balance available to be repatriated to the United States. The cash held by foreign subsidiaries for permanent reinvestment is generally usedto finance the subsidiaries' operational activities and future foreign investments. Our intent is to permanently reinvest these funds outside of the United States andour current plans do not demonstrate a need to repatriate these funds to fund our U.S. operations. However, if these funds were repatriated, then we would berequired to accrue and pay applicable United States taxes (subject to an adjustment for foreign tax credits) and withholding taxes payable to various countries. Therepatriation could result in an adjustment to the tax liability after considering available foreign tax credits and other tax attributes. It is not practicable to estimatethe amount of the deferred tax liability associated with these unremitted earnings due to the complexity of its hypothetical calculation.
Sources and Uses of Cash
We met our cash needs during 2016 through cash flows from operations, cash and cash equivalents, and financing arrangements. Our cash and cashequivalents at December 31, 2016 increased $313 million compared to the same period in 2015 .
The following table summarizes the net increase (decrease) in cash and cash equivalents for the periods presented. Significant drivers of changes in our cashand cash equivalents balance during 2016 are discussed below:
Cash Flow Summary
Millions of dollars 2016 2015 2014
Cash provided by (used in): Operating activities $ 1,203 $ 1,225 $ 1,479Investing activities (588) (681) (2,456)Financing activities (278) (707) 705Effect of exchange rate changes (24) (91) (82)
Net increase (decrease) in cash and cash equivalents $ 313 $ (254) $ (354)
25
MANAGEMENT'S DISCUSSION AND ANALYSIS OF FINANCIAL CONDITION ANDRESULTS OF OPERATIONS - (CONTINUED)
Cash Flows from Operating Activities
The decrease in cash provided by operating activities during 2016 reflects strong cash earnings and effective credit management, more than offset by cashexpenditures related to the legacy product corrective action.
The timing of cash flows from operations varies significantly throughout the year primarily due to changes in production levels, sales patterns, promotionalprograms, funding requirements, credit management, as well as receivable and payment terms. Depending on the timing of cash flows, the location of cashbalances, as well as the liquidity requirements of each country, external sources of funding are used to support working capital requirements.
Cash Flows from Investing Activities
Changes in cash used in investing activities during 2016 primarily reflect a reduction in capital expenditures and investment in related businesses, partiallyoffset by increased proceeds from the sale of business assets.
In June 2016, Whirlpool China Co., Ltd. (“Whirlpool China”), our majority-owned indirect subsidiary, entered into an agreement to return land use rightsfor land now occupied by two Whirlpool China plants in Hefei, China to a division of the Hefei municipal government. The aggregate price for the return of landuse rights was approximately RMB 687 million (approximately $103 million as of June 27, 2016). Whirlpool China received RMB 280 million (approximately $42million as of June 27, 2016) of the aggregate return price on June 27, 2016 with the remainder to be paid in installments in 2017 and 2018. The remaining balanceis RMB 407 million (approximately $59 million as of December 31, 2016 ).
Cash Flows from Financing Activities
Cash used in financing activities during 2016 primarily reflects share repurchase activity and repayments of long-term debt. Cash used in financing activitiesduring 2015 primarily reflects share repurchase activity under our share repurchase program. Cash provided by financing activities during 2014 primarily reflectsfunding required to complete the acquisitions of Hefei Sanyo and Indesit.
Whirlpool Subsidiary Share Repurchase
On July 12, 2016, Whirlpool S.A. (“WHR SA”) and Brasmotor S.A. (“BMT”), both majority-owned indirect subsidiaries of Whirlpool Corporation, issuedpublic announcements in Brazil reporting that Whirlpool do Brasil Ltda., the controlling shareholder of both WHR SA and BMT, intended to acquire theoutstanding common and preferred shares of WHR SA and BMT by means of tender offers for the publicly-held shares. At that time, Whirlpool do Brasil Ltda. andother Whirlpool entities held 99.20% of the common and 95.68% of the preferred shares of WHR SA and 99.40% of the common and 93.55% of the preferredshares of BMT. The tender offers were launched in November 2016 and concluded in December 2016. The offer for BMT was successful and will result in theacquisition of 100% of the shares of BMT after the squeeze-out of the remaining minority shareholders. The cost related to this offer was approximately $25million as of December 2016. The squeeze-out was completed in January 2017, bringing the total cost to approximately $31 million. The WHR SA tender offerwas abandoned because the minimum number of interested minority shareholders was not obtained.
Financing Arrangements
On July 15, 2016, $244 million of 7.75% notes matured and were repaid. On June 15, 2016, $250 million of 6.50% notes matured and were repaid.
On May 23, 2016, we completed a debt offering of $500 million principal amount of 4.50% notes due in 2046. The notes contain covenants that limit ourability to incur certain liens or enter into certain sale and lease-back transactions. In addition, if we experience a specific kind of change of control, we are requiredto make an offer to purchase all of the notes at a purchase price of 101% of the principal amount thereof, plus accrued and unpaid interest. The notes are registeredunder the Securities Act of 1933, as amended, pursuant to our Registration Statement on Form S-3 (File No. 333-203704) filed with the Securities and ExchangeCommission on April 29, 2015.
On November 2, 2016, Whirlpool Finance Luxembourg S.à. r.l., an indirect, wholly-owned finance subsidiary of Whirlpool Corporation, completed a debtoffering of €500 million (approximately $555 million as of the date of issuance) principal amount of 1.250% notes due in 2026. The Company has fully andunconditionally guaranteed these notes. The notes contain covenants that limit Whirlpool Corporation's ability to incur certain liens or enter into certain sale andlease-back transactions. In addition, if we experience a specific kind of change of control, we are required to make an offer to purchase all of the notes at apurchase price of 101% of the principal amount thereof, plus accrued and unpaid interest. The notes are registered under the Securities Act
26

MANAGEMENT'S DISCUSSION AND ANALYSIS OF FINANCIAL CONDITION ANDRESULTS OF OPERATIONS - (CONTINUED)
of 1933, as amended, pursuant to our Registration Statement on Form S-3 (File No.333-203704-1) filed with the Securities and Exchange Commission on October25, 2016
The Company had a total committed credit facilities of approximately $3.1 billion as of December 31, 2016 , which is fundamentally unchanged from thecommitted credit facilitates as of December 31, 2015 . The facilities are more geographically diverse and reflect the Company’s growing global operations. TheCompany believes these facilities are sufficient to support its global operations. We had no borrowings outstanding under the committed credit facilities at December 31, 2016 and 2015 , respectively.
For additional information about our financing arrangements, see Note 5 of the Notes to the Consolidated Financial Statements.
WHIRLPOOL CHINA ACQUISITION
On August 12, 2013 , Whirlpool's wholly-owned subsidiary, Whirlpool (China) Investment Co., Ltd., reached agreements to acquire a 51% equity stake inHefei Sanyo , a joint stock company whose shares are listed and traded on the Shanghai Stock Exchange. This transaction was completed on October 24, 2014 .Hefei Sanyo has since been renamed to "Whirlpool China Co., Ltd." The aggregate purchase price was RMB 3.4 billion (approximately $551 million at the dates ofpurchase). The Company funded the total consideration for the shares with cash on hand. The cash paid for the private placement portion of the transaction isconsidered restricted cash, which is used to fund capital expenditures and technical resources to enhance Whirlpool China’s research and development and workingcapital, as required by the terms of the Hefei Sanyo acquisition made in October 2014.
We expect the acquisition will accelerate Whirlpool's profitable growth in China. During 2014, Whirlpool began integrating the manufacturing,administrative, supply chain and technology operations of Hefei Sanyo . The results of Hefei Sanyo ’s operations have been included in the Consolidated FinancialStatements beginning October 24, 2014 .
Hefei Sanyo has an established and broad distribution network that includes a very large number of distribution outlets throughout China. Its significantpresence in rural areas complements Whirlpool’s presence in China’s higher-tier cities. With this acquisition, Whirlpool also gained manufacturing scale and acompetitive cost structure in the city of Hefei. The ability to consolidate operations offers strong synergies as Whirlpool will provide extensive technical, marketingand product development, combined with Hefei Sanyo ’s sales execution and operational strengths, to support the next phase of development in the advancement ofWhirlpool China as an important global production and research and development center for the home appliance sector.
INDESIT ACQUISITION
On December 3, 2014 , Whirlpool completed the final step in its acquisition of Indesit. Total consideration paid for Indesit was € 1.1 billion (approximately$1.4 billion at the dates of purchase of each step in the transaction) in aggregate net of cash acquired. The Company funded the aggregate purchase price for Indesitthrough borrowings under its credit facility and commercial paper programs, and repaid a portion of such borrowings through the issuance of an aggregate principalamount of $650 million in senior notes on November 4, 2014 and an aggregate principal amount of € 500 million (approximately $525 million as of the date ofissuance) in senior notes on March 12, 2015 .
This transaction has built Whirlpool’s market position within Europe, and we believe will continue to enable sustainable growth given the complementarymarket positions, product offerings and distribution channels of Whirlpool and Indesit throughout Europe. We expect efficiencies in R&D, capital spending andvalue chain costs, as well as operational scale with increased volume and the ability to more effectively integrate our product platforms. The results of Indesit ’soperations have been included in the Consolidated Financial Statements beginning October 14, 2014 .
Dividends
In April 2016, our Board of Directors approved an 11% increase in our quarterly dividend on our common stock to $1 per share from 90 cents per share.
Repurchase Program
For additional information about our repurchase program, see Note 8 of the Notes to the Consolidated Financial Statements.
27

MANAGEMENT'S DISCUSSION AND ANALYSIS OF FINANCIAL CONDITION ANDRESULTS OF OPERATIONS - (CONTINUED)
CONTRACTUAL OBLIGATIONS AND FORWARD-LOOKING CASH REQUIREMENTS
The following table summarizes our expected cash outflows resulting from financial contracts and commitments:
Payments due by period
Millions of dollars Total 2017 2018 & 2019 2020 & 2021 Thereafter
Long-term debt obligations (1)
$ 5,960 $ 709 $ 835 $ 1,025 $ 3,391Operating lease obligations 936 206 311 214 205
Purchase obligations (2)
764 164 295 194 111
United States & Foreign pension plans (3)
823 57 161 175 430
Other postretirement benefits (4)
307 42 68 65 132
Legal settlements (5)
7 7 — — —
Total (6)
$ 8,797 $ 1,185 $ 1,670 $ 1,673 $ 4,269
(1) Interest payments related to long-term debt are included in the table above. For additional information about our financing arrangements, see Note 5 of the Notes to the ConsolidatedFinancial Statements.
(2) Purchase obligations include our “take-or-pay” contracts with materials vendors and minimum payment obligations to other suppliers.(3) Represents the minimum contributions required for foreign and domestic pension plans based on current interest rates, asset return assumptions, legislative requirements and other
actuarial assumptions at December 31, 2016 . Management may elect to contribute amounts in addition to those required by law. See Note 12 of the Notes to the ConsolidatedFinancial Statements for additional information.
(4) Represents our portion of expected benefit payments under our retiree healthcare plans.(5) For additional information regarding legal settlements, see Note 6 of the Notes to the Consolidated Financial Statements.(6) This table does not include credit facility and commercial paper borrowings. For additional information about short-term borrowings, see Note 5 of the Notes to the Consolidated
Financial Statements. This table does not include future anticipated income tax settlements; see Note 11 of the Notes to the Consolidated Financial Statements.
OFF-BALANCE SHEET ARRANGEMENTS
We have guarantee arrangements in a Brazilian subsidiary. As a standard business practice in Brazil, the subsidiary guarantees customer lines of credit atcommercial banks to support purchases following its normal credit policies. If a customer were to default on its line of credit with the bank, our subsidiary wouldbe required to satisfy the obligation with the bank and the receivable would revert back to the subsidiary. At December 31, 2016 and December 31, 2015 , theguaranteed amounts totaled $258 million and $260 million , respectively. The fair value of these guarantees were nominal at December 31, 2016 and December 31,2015 . Our subsidiary insures against credit risk for these guarantees, under normal operating conditions, through policies purchased from high-qualityunderwriters. We had no losses associated with these guarantees in 2016 or 2015 .
We have guaranteed a $40 million five -year revolving credit facility between certain financial institutions and a not-for-profit entity in connection with acommunity and economic development project (“Harbor Shores”). The credit facility, which originated in 2008, was refinanced in December 2012 and we renewedour guarantee through 2017. It was also amended in 2015 and reduced from $43 million to $40 million by Harbor Shores in 2016. The fair value of this guaranteewas nominal at December 31, 2016 and December 31, 2015 . The purpose of Harbor Shores is to stimulate employment and growth in the areas of Benton Harborand St. Joseph, Michigan. In the event of default, we must satisfy the guarantee of the credit facility up to the amount borrowed at the date of default.
In the ordinary course of business, we enter into agreements with financial institutions to issue bank guarantees, letters of credit and surety bonds. Theseagreements are primarily associated with unresolved tax matters in Brazil, as is customary under local regulations, and governmental obligations related to certainemployee benefit arrangements. As of December 31, 2016 and 2015 , we had approximately $327 million and $290 million outstanding under these agreements,respectively.
CRITICAL ACCOUNTING POLICIES AND ESTIMATES
The preparation of financial statements in conformity with generally accepted accounting principles in the United States (GAAP) requires management tomake certain estimates and assumptions. We periodically evaluate these estimates and assumptions, which are based on historical experience, changes in thebusiness environment and other factors that management believes to be reasonable under the circumstances. Actual results may differ materially from theseestimates.
28
MANAGEMENT'S DISCUSSION AND ANALYSIS OF FINANCIAL CONDITION ANDRESULTS OF OPERATIONS - (CONTINUED)
Pension and Other Postretirement Benefits
Accounting for pensions and other postretirement benefits involves estimating the costs of future benefits and attributing the cost over the employee’sexpected period of employment. The determination of our obligation and expense for these costs requires the use of certain assumptions. Those key assumptionsinclude the discount rate, expected long-term rate of return on plan assets, life expectancy, and health care cost trend rates. These assumptions are subject to changebased on interest rates on high quality bonds, stock and bond markets and medical cost inflation, respectively. Actual results that differ from our assumptions areaccumulated and amortized over future periods and therefore, generally affect our recognized expense and accrued liability in such future periods. While webelieve that our assumptions are appropriate given current economic conditions and actual experience, significant differences in results or significant changes inour assumptions may materially affect our pension and other postretirement benefit obligations and related future expense.
Our pension and other postretirement benefit obligations at December 31, 2016 and preliminary retirement benefit costs for 2017 were prepared using theassumptions that were determined as of December 31, 2016 . The following table summarizes the sensitivity of our December 31, 2016 retirement obligations and2017 retirement benefit costs of our United States plans to changes in the key assumptions used to determine those results:
Estimated increase (decrease) in
Millions of dollars Percentage
Change 2017 Expense PBO/APBO*
for 2016
United States Pension Plans Discount rate +/-50bps $ 1/(1) $ (174)/187Expected long-term rate of return on plan assets +/-50bps (13)/13 –United States Other Postretirement Benefit Plan Discount rate +/-50bps 1/(1) (14)/15Health care cost trend rate
+/-100bps – –
* Projected benefit obligation (PBO) for pension plans and accumulated postretirement benefit obligation (APBO) for other postretirement benefit plans.
These sensitivities may not be appropriate to use for other years’ financial results. Furthermore, the impact of assumption changes outside of the rangesshown above may not be approximated by using the above results. For additional information about our pension and other postretirement benefit obligations, seeNote 12 of the Notes to the Consolidated Financial Statements.
Income Taxes
We estimate our income taxes in each of the taxing jurisdictions in which we operate. This involves estimating actual current tax expense together withassessing any temporary differences resulting from the different treatment of certain items, such as the timing for recognizing expenses, for tax and accountingpurposes. These differences may result in deferred tax assets or liabilities, which are included in our Consolidated Balance Sheets. We are required to assess thelikelihood that deferred tax assets, which include net operating loss carryforwards, foreign tax credits and deductible temporary differences, that are expected to berealizable in future years. Realization of our net operating loss and foreign tax credit deferred tax assets is supported by specific tax planning strategies and, wherepossible, considers projections of future profitability. If recovery is not more likely than not, we provide a valuation allowance based on estimates of future taxableincome in the various taxing jurisdictions, and the amount of deferred taxes that are ultimately realizable. If future taxable income is lower than expected or if taxplanning strategies are not available as anticipated, we may record additional valuation allowances through income tax expense in the period such determination ismade. Likewise, if we determine that we are able to realize our deferred tax assets in the future in excess of net recorded amounts, an adjustment to the deferred taxasset will benefit income tax expense in the period such determination is made.
As of December 31, 2016 and 2015 , we had total deferred tax assets of $3.2 billion and $3.3 billion , respectively, net of valuation allowances of $150million and $286 million , respectively. Our income tax expense has fluctuated considerably over the last five years from $133 million in 2012 to $ 186 million inthe current year. The tax expense has been influenced primarily by U.S. energy tax credits, foreign tax credits, audit settlements and adjustments, tax planningstrategies, enacted legislation, and dispersion of global income. Future changes in the effective tax rate will be subject to several factors, including businessprofitability, tax planning strategies, and enacted tax laws.
In addition, we operate within multiple taxing jurisdictions and are subject to audit in these jurisdictions. These audits can involve complex issues, whichmay require an extended period of time to resolve. For additional information about income taxes, see Notes 1 , 6 and 11 of the Notes to the Consolidated FinancialStatements.
29

MANAGEMENT'S DISCUSSION AND ANALYSIS OF FINANCIAL CONDITION ANDRESULTS OF OPERATIONS - (CONTINUED)
Legacy Product Corrective Action Reserves
In the normal course of business, we engage in investigations of potential quality and safety issues. As part of our ongoing effort to deliver quality productsto consumers, we are currently investigating a limited number of potential quality and safety issues globally. As necessary, we undertake to effect repair orreplacement of appliances in the event that an investigation leads to the conclusion that such action is warranted.
As part of that process, in 2015, Whirlpool engaged in thorough investigations of incident reports associated with two of its dryer production platformsdeveloped by Indesit. These dryer production platforms were developed prior to Whirlpool's acquisition of Indesit in October 2014. This led to Indesit reporting theissue to regulatory authorities for consideration. These discussions determined that corrective action of the affected dryers was required. Whirlpool hasimplemented modifications at the point of manufacture to ensure that dryers produced after October 2015 are not affected by this issue. An outreach and servicecampaign is underway to modify dryers that have already been sold. Such dryers were manufactured between April 2004 and October 2015 and sold in the UK andother countries in the EMEA region under the Hotpoint* and Indesitbrand names, as well as various other brands owned by other manufacturers, distributors andretailers whose products Indesit produced.
As of December 31, 2016 , Whirlpool had $162 million of cash expenditures related to the corrective action. We expect the corrective action affectingthese dryers to have future cash expenditures in 2017 of $69 million .
For additional information about the legacy product corrective action, see Note 6 of the Notes to the Consolidated Financial Statements.
Warranty Obligations
The estimation of warranty obligations is determined in the same period that revenue from the sale of the related products is recognized. The warrantyobligation is based on historical experience and represents our best estimate of expected costs at the time products are sold. Warranty accruals are adjusted forknown or anticipated warranty claims as new information becomes available. New product launches require a greater use of judgment in developing estimates untilhistorical experience becomes available. Future events and circumstances could materially change our estimates and require adjustments to the warrantyobligations. For additional information about warranty obligations, see Note 6 of the Notes to the Consolidated Financial Statements.
Goodwill and Other Intangibles
Certain business acquisitions have resulted in the recording of goodwill and trademark assets. Upon acquisition, the purchase price is first allocated toidentifiable assets and liabilities, including trademark assets, based on estimated fair value, with any remaining purchase price recorded as goodwill. Primarily,Whirlpool's trademarks and goodwill are considered indefinite-life intangible assets and as such, are not amortized. At December 31, 2016 , we had goodwill ofapproximately $3.0 billion . There have been no changes to our reporting units or allocations of goodwill by reporting units except for the impact of foreigncurrency. We primarily have trademark assets in our North America, EMEA and Asia operating segments with a total carrying value of approximately $2.6 billionas of December 31, 2016 .
We perform our annual impairment assessment for goodwill and other indefinite-life intangible assets as of October 1 st and more frequently if indicators ofimpairment exist.
In 2016, the Company primarily elected to perform a quantitative analysis using a discounted cash flow model and other valuation techniques, to evaluategoodwill and certain indefinite-life intangible assets.
Goodwill Valuations
In performing a quantitative assessment, we estimate each reporting units' fair value using the income approach. The income approach uses operatingsegments projection of estimated operating results and cash flows that are discounted using a weighted-average cost of capital that is determined based on currentmarket conditions. The projection uses management’s best estimates of economic and market conditions over the projected period including growth rates in sales,costs and number of units, estimates of future expected changes in operating margins and cash expenditures. Other estimates and assumptions include terminalvalue growth rates, future estimates of capital expenditures and changes in future working capital requirements. The estimated fair value of each operating segmentis compared to their respective carrying values.
*Whirlpool ownership of the Hotpoint brand in the EMEA and Asia Pacific regions is not affiliated with the Hotpoint brand sold in the Americas
30
MANAGEMENT'S DISCUSSION AND ANALYSIS OF FINANCIAL CONDITION ANDRESULTS OF OPERATIONS - (CONTINUED)
Additionally we validate our estimates of fair value under the income approach by comparing the values of fair value estimates using a market approach. Amarket approach estimates fair value by applying cash flow multiples to the reporting unit’s operating performance. The multiples are derived from comparablepublicly traded companies with similar operating and investment characteristics of the reporting units. We consider the implied control premium and concludewhether the implied control premium is reasonable based on other recent market transactions.
If actual results are not consistent with managements’ estimate and assumptions, goodwill may be overstated and a charge against net income would berequired, which would adversely affect the Company’s financial statements.
Based on the results of our quantitative assessment conducted on October 1, 2016, the fair values of Whirlpool's reporting units continue to exceed theirrespective carrying values. The range by which the excess fair value of our reporting units' goodwill exceeded their respective carrying values was 4% to 142%.The EMEA reporting unit has excess fair value of 4%. During the fourth quarter 2014, Whirlpool acquired Indesit, resulting in substantially all of the goodwillincluded in this reporting unit. The range by which the excess fair value of our remaining reporting units' goodwill exceeded their respective carrying values was70% to 142%.
Other Intangible Valuations
In performing a quantitative assessment of indefinite life intangible assets other than goodwill, primarily trademarks, we estimate the fair value of theseintangible assets using the relief-from-royalty method, which requires assumptions related to projected revenues from our annual long-range plan; assumed royaltyrates that could be payable if we did not own the trademark; and a discount rate based on our weighted average cost of capital. If the estimated fair value of theindefinite-lived intangible asset is less than its carrying value, we would recognize an impairment loss.
Three trademarks acquired in fourth quarter of 2014 have fair values that exceed their carrying values by less than 10%. The fair values of all othertrademarks exceeded their carrying values by more than 10% with the exception of one North American trademark.
The fair value of this North American trademark exceeded its carrying value of approximately $1 billion by 6% in 2016 and 5% in 2015 . We expectrevenue trends for this brand to improve as we continue to execute specific brand investments and product development plans. Additionally, we performed asensitivity analysis on our estimated fair value noting that a 10% reduction of forecasted revenues, a 50 basis point decrease in royalty rate, or a 50 basis pointincrease in discount rate would result in an impairment ranging from approximately $22 million to $78 million.
If actual results are not consistent with management's estimate and assumptions, trademarks or other indefinite-life intangible assets may be overstated and acharge against net income would be required, which would adversely affect the Company’s financial results of operations.
Based on the results of our quantitative assessment performed as of October 1, 2014, impairment of two trademarks was determined to exist, primarilydriven by a change in our brand strategy in EMEA as a result of the acquisition of Indesit and resulted in a charge of approximately $12 million in 2014.
Our assessment indicates no impairment of any trademarks as of December 31, 2016 .
For additional information about goodwill and intangible valuations, see Note 2 of the Notes to the Consolidated Financial Statements.
ISSUED BUT NOT YET EFFECTIVE ACCOUNTING PRONOUNCEMENTS
Additional information regarding recently issued accounting pronouncements can be found in Note 1 of the Notes to the Consolidated Financial Statements.
OTHER MATTERS
For information regarding certain of our loss contingencies/litigation, see Note 6 of the Consolidated Financial Statements.
Antidumping Petition
In December 2015, we filed a petition with the U.S. Department of Commerce (DOC) and the United States International Trade Commission (ITC) toaddress Samsung and LG dumping large residential washers from China. The petition was filed to
31
MANAGEMENT'S DISCUSSION AND ANALYSIS OF FINANCIAL CONDITION ANDRESULTS OF OPERATIONS - (CONTINUED)
restore fair competition in the United States that will support significant investment in the production of large residential washers and the creation of U.S. jobs. TheWhirlpool washers affected by the imports subject in this case are made in Clyde, Ohio.
In December 2016, the DOC issued a final determination that Samsung and LG violated U.S. and international trade laws by dumping washers from Chinainto the U.S. As part of the final determination, the DOC also announced certain antidumping margins for Samsung and LG. In January 2017, the ITC votedunanimously that Samsung and LG's dumping had caused material injury to the U.S. washer industry. As in the case of our December 2011 petition, the DOC andITC decisions will be followed by administrative review procedures and possible appeals over the next several years.
Post-Retirement Benefit Litigation
For information regarding post-retirement benefit litigation, see Note 12 of the Consolidated Financial Statements.
FORWARD-LOOKING STATEMENTS
The Private Securities Litigation Reform Act of 1995 provides a safe harbor for forward-looking statements made by us or on our behalf. Certain statementscontained in this annual report, including those within the forward-looking perspective section within this Management's Discussion and Analysis, and otherwritten and oral statements made from time to time by us or on our behalf do not relate strictly to historical or current facts and may contain forward-lookingstatements that reflect our current views with respect to future events and financial performance. As such, they are considered “forward-looking statements” whichprovide current expectations or forecasts of future events. Such statements can be identified by the use of terminology such as “may,” “could,” “will,” “should,”“possible,” “plan,” “predict,” “forecast,” “potential,” “anticipate,” “estimate,” “expect,” “project,” “intend,” “believe,” “may impact,” “on track,” and similar wordsor expressions. Our forward-looking statements generally relate to our growth strategies, financial results, product development, and sales efforts. These forward-looking statements should be considered with the understanding that such statements involve a variety of risks and uncertainties, known and unknown, and may beaffected by inaccurate assumptions. Consequently, no forward-looking statement can be guaranteed and actual results may vary materially.
This document contains forward-looking statements about Whirlpool Corporation and its consolidated subsidiaries (“Whirlpool”) that speak only as of thisdate. Whirlpool disclaims any obligation to update these statements. Forward-looking statements in this document may include, but are not limited to, statementsregarding expected earnings per share, cash flow, productivity and raw material prices. Many risks, contingencies and uncertainties could cause actual results todiffer materially from Whirlpool's forward-looking statements. Among these factors are: (1) intense competition in the home appliance industry reflecting theimpact of both new and established global competitors, including Asian and European manufacturers; (2) Whirlpool's ability to maintain or increase sales tosignificant trade customers and the ability of these trade customers to maintain or increase market share; (3) Whirlpool's ability to maintain its reputation and brandimage; (4) the ability of Whirlpool to achieve its business plans, productivity improvements, and cost control objectives, and to leverage its global operatingplatform, and accelerate the rate of innovation; (5) Whirlpool's ability to obtain and protect intellectual property rights; (6) acquisition and investment-related risks,including risks associated with our past acquisitions, and risks associated with our increased presence in emerging markets; (7) risks related to our internationaloperations, including changes in foreign regulations, regulatory compliance and disruptions arising from political, legal and economic instability; (8) informationtechnology system failures, data security breaches, network disruptions, and cybersecurity attacks; (9) product liability and product recall costs; (10) the ability ofsuppliers of critical parts, components and manufacturing equipment to deliver sufficient quantities to Whirlpool in a timely and cost-effective manner; (11) ourability to attract, develop and retain executives and other qualified employees; (12) the impact of labor relations; (13) fluctuations in the cost of key materials(including steel, resins, copper and aluminum) and components and the ability of Whirlpool to offset cost increases; (14) Whirlpool’s ability to manage foreigncurrency fluctuations; (15) inventory and other asset risk; (16) the uncertain global economy and changes in economic conditions which affect demand for ourproducts; (17) health care cost trends, regulatory changes and variations between results and estimates that could increase future funding obligations for pensionand postretirement benefit plans; (18) litigation, tax, and legal compliance risk and costs, especially if materially different from the amount we expect to incur orhave accrued for, and any disruptions caused by the same; (19) the effects and costs of governmental investigations or related actions by third parties; and (20)changes in the legal and regulatory environment including environmental, health and safety regulations.
We undertake no obligation to update any forward-looking statement, and investors are advised to review disclosures in our filings with the SEC. It is notpossible to foresee or identify all factors that could cause actual results to differ from expected or historic results. Therefore, investors should not consider theforegoing factors to be an exhaustive statement of all risks, uncertainties, or factors that could potentially cause actual results to differ from forward-lookingstatements.
Additional information concerning these and other factors can be found in “Risk Factors” in Item 1A of this report.
32
ITEM 7A. QUANTITATIVE AND QUALITATIVE DISCLOSURES ABOUT MARKET RISK
MARKET RISK
We have in place an enterprise risk management process that involves systematic risk identification and mitigation covering the categories of enterprise,strategic, financial, operation and compliance and reporting risk. The enterprise risk management process receives Board of Directors and Management oversight,drives risk mitigation decision-making and is fully integrated into our internal audit planning and execution cycle.
We are exposed to market risk from changes in foreign currency exchange rates, domestic and foreign interest rates, and commodity prices, which can affectour operating results and overall financial condition. We manage exposure to these risks through our operating and financing activities and, when deemedappropriate, through the use of derivatives. Derivatives are viewed as risk management tools and are not used for speculation or for trading purposes. Derivativesare generally contracted with a diversified group of investment grade counterparties to reduce exposure to nonperformance on such instruments.
We use foreign currency forward contracts, currency options, and currency swaps to hedge the price risk associated with firmly committed and forecastedcross-border payments and receipts related to ongoing business and operational financing activities. Foreign currency contracts are sensitive to changes in foreigncurrency exchange rates. At December 31, 2016 , a 10% favorable or unfavorable exchange rate movement in each currency in our portfolio of foreign currencycontracts would have resulted in an incremental unrealized gain of approximately $125 million or loss of approximately $145 million. Consistent with the use ofthese contracts to neutralize the effect of exchange rate fluctuations, such unrealized losses or gains would be offset by corresponding gains or losses, respectively,in the re-measurement of the underlying exposures.
We enter into commodity swap contracts to hedge the price risk associated with firmly committed and forecasted commodities purchases, the prices ofwhich are not fixed directly through supply contracts. As of December 31, 2016 , a 10% favorable or unfavorable shift in commodity prices would have resulted inan incremental gain or loss of approximately $30 million, respectively, related to these contracts.
33
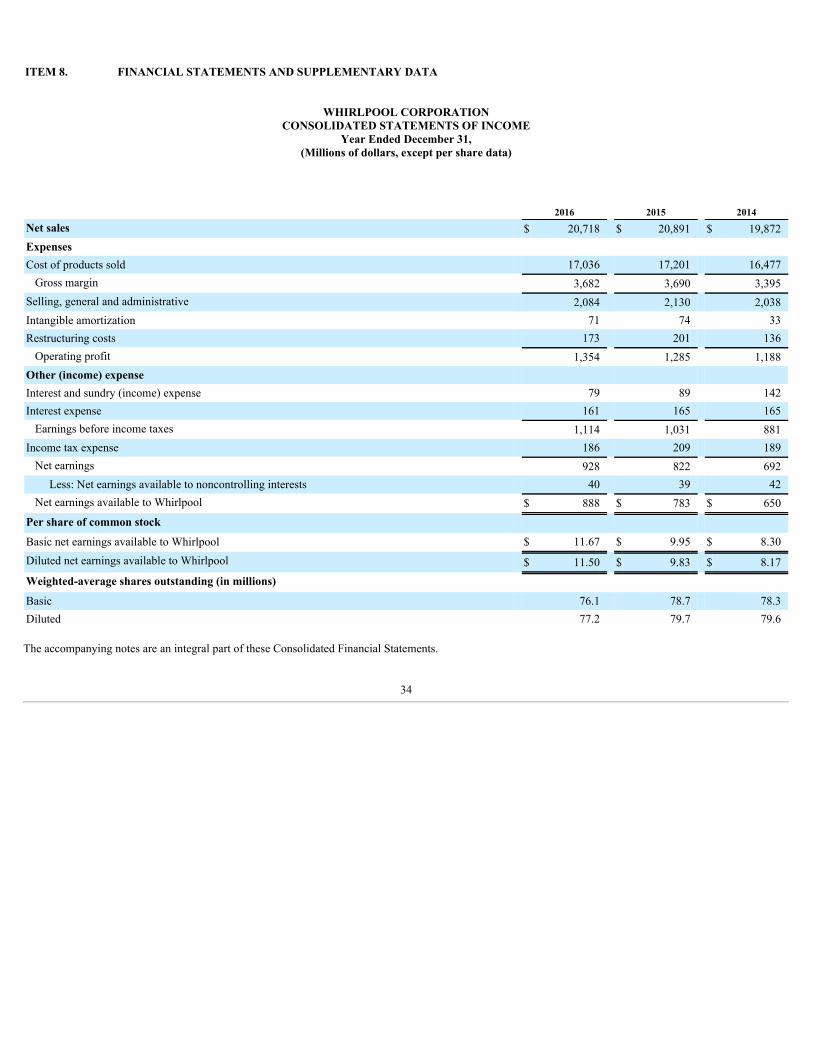
ITEM 8. FINANCIAL STATEMENTS AND SUPPLEMENTARY DATA
WHIRLPOOL CORPORATIONCONSOLIDATED STATEMENTS OF INCOME
Year Ended December 31,(Millions of dollars, except per share data)
2016 2015 2014Net sales $ 20,718 $ 20,891 $ 19,872Expenses Cost of products sold 17,036 17,201 16,477
Gross margin 3,682 3,690 3,395Selling, general and administrative 2,084 2,130 2,038Intangible amortization 71 74 33Restructuring costs 173 201 136
Operating profit 1,354 1,285 1,188Other (income) expense Interest and sundry (income) expense 79 89 142Interest expense 161 165 165
Earnings before income taxes 1,114 1,031 881Income tax expense 186 209 189
Net earnings 928 822 692Less: Net earnings available to noncontrolling interests 40 39 42
Net earnings available to Whirlpool $ 888 $ 783 $ 650Per share of common stock Basic net earnings available to Whirlpool $ 11.67 $ 9.95 $ 8.30Diluted net earnings available to Whirlpool $ 11.50 $ 9.83 $ 8.17Weighted-average shares outstanding (in millions) Basic 76.1 78.7 78.3Diluted 77.2 79.7 79.6
The accompanying notes are an integral part of these Consolidated Financial Statements.
34

WHIRLPOOL CORPORATIONCONSOLIDATED STATEMENTS OF COMPREHENSIVE INCOME
Year Ended December 31,(Millions of dollars)
2016 2015 2014
Net earnings $ 928 $ 822 $ 692
Other comprehensive income (loss), before tax: Foreign currency translation adjustments (30) (432) (392) Derivative instruments: Net gain (loss) arising during period 106 (25) 10 Less: reclassification adjustment for gain (loss) included in net earnings 35 (2) 11 Derivative instruments, net 71 (23) (1) Marketable securities: Net gain (loss) arising during period (2) 3 — Marketable securities, net (2) 3 — Defined benefit pension and postretirement plans: Prior service (cost) credit arising during period 30 (5) (11) Net gain (loss) arising during period (139) (55) (242) Less: amortization of prior service credit (cost) and actuarial (loss) (39) 19 (20) Defined benefit pension and postretirement plans, net: (70) (79) (233)Other comprehensive (loss), before tax (31) (531) (626) Income tax benefit (expense) related to items of other comprehensive income (loss) (37) 30 80Other comprehensive income (loss), net of tax $ (68) $ (501) $ (546)
Comprehensive income $ 860 $ 321 $ 146 Less: comprehensive income, available to noncontrolling interests 40 30 38
Comprehensive income available to Whirlpool $ 820 $ 291 $ 108
The accompanying notes are an integral part of these Consolidated Financial Statements.
35

WHIRLPOOL CORPORATIONCONSOLIDATED BALANCE SHEETS
At December 31,(Millions of dollars)
2016 2015
Assets Current assets
Cash and cash equivalents $ 1,085 $ 772Accounts receivable, net of allowance of $185 and $160, respectively 2,711 2,530Inventories 2,623 2,619Prepaid and other current assets 920 953
Total current assets 7,339 6,874Property, net of accumulated depreciation of $6,055 and $5,953, respectively 3,810 3,774Goodwill 2,956 3,006Other intangibles, net of accumulated amortization of $387 and $327, respectively 2,552 2,678Deferred income taxes 2,154 2,301Other noncurrent assets 342 377Total assets $ 19,153 $ 19,010Liabilities and stockholders’ equity Current liabilities
Accounts payable $ 4,416 $ 4,403Accrued expenses 649 675Accrued advertising and promotions 742 706Employee compensation 390 452Notes payable 34 20Current maturities of long-term debt 560 508Other current liabilities 871 980
Total current liabilities 7,662 7,744Noncurrent liabilities
Long-term debt 3,876 3,470Pension benefits 1,074 1,025Postretirement benefits 334 390Other noncurrent liabilities 479 707
Total noncurrent liabilities 5,763 5,592Stockholders’ equity
Common stock, $1 par value, 250 million shares authorized, 111 million shares issued, and 74 million and 77 millionshares outstanding, respectively 111 111Additional paid-in capital 2,672 2,641Retained earnings 7,314 6,722Accumulated other comprehensive loss (2,400) (2,332)Treasury stock, 37 million and 33 million shares, respectively (2,924) (2,399)
Total Whirlpool stockholders’ equity 4,773 4,743Noncontrolling interests 955 931
Total stockholders’ equity 5,728 5,674Total liabilities and stockholders’ equity $ 19,153 $ 19,010
The accompanying notes are an integral part of these Consolidated Financial Statements.
36
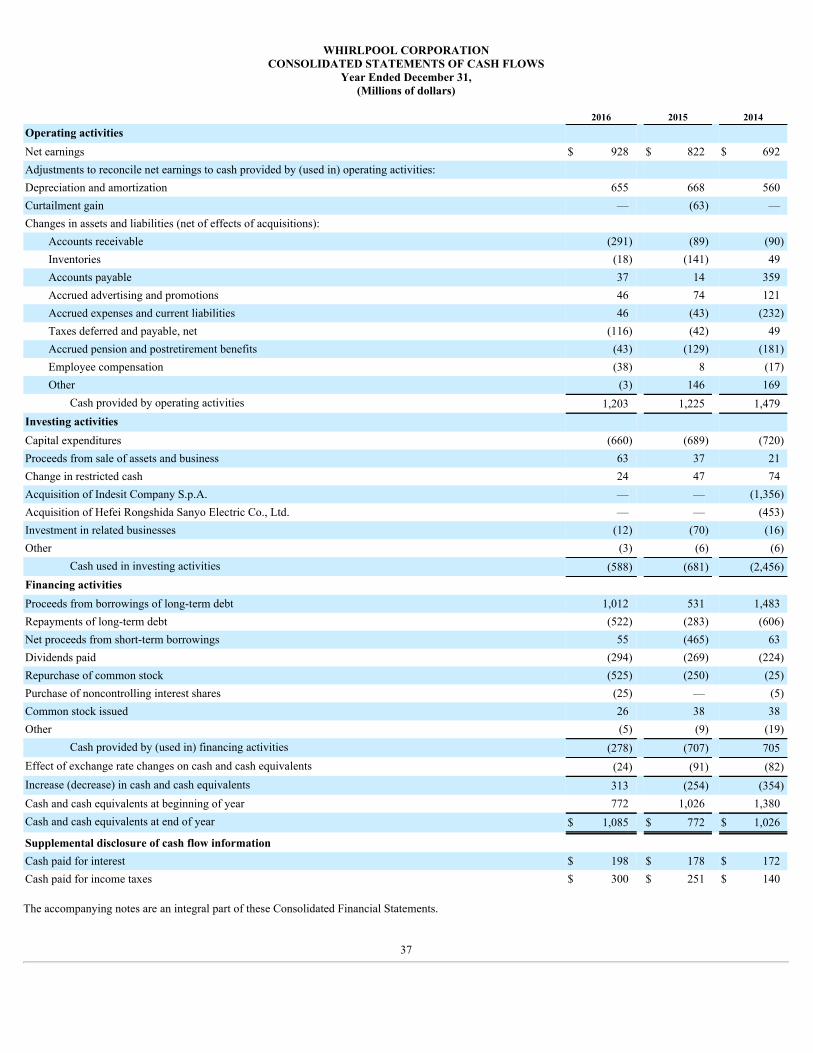
WHIRLPOOL CORPORATIONCONSOLIDATED STATEMENTS OF CASH FLOWS
Year Ended December 31,(Millions of dollars)
2016 2015 2014Operating activities Net earnings $ 928 $ 822 $ 692Adjustments to reconcile net earnings to cash provided by (used in) operating activities: Depreciation and amortization 655 668 560Curtailment gain — (63) —Changes in assets and liabilities (net of effects of acquisitions):
Accounts receivable (291) (89) (90)Inventories (18) (141) 49Accounts payable 37 14 359Accrued advertising and promotions 46 74 121Accrued expenses and current liabilities 46 (43) (232)Taxes deferred and payable, net (116) (42) 49Accrued pension and postretirement benefits (43) (129) (181)Employee compensation (38) 8 (17)Other (3) 146 169
Cash provided by operating activities 1,203 1,225 1,479Investing activities Capital expenditures (660) (689) (720)Proceeds from sale of assets and business 63 37 21Change in restricted cash 24 47 74Acquisition of Indesit Company S.p.A. — — (1,356)Acquisition of Hefei Rongshida Sanyo Electric Co., Ltd. — — (453)Investment in related businesses (12) (70) (16)Other (3) (6) (6)
Cash used in investing activities (588) (681) (2,456)Financing activities Proceeds from borrowings of long-term debt 1,012 531 1,483Repayments of long-term debt (522) (283) (606)Net proceeds from short-term borrowings 55 (465) 63Dividends paid (294) (269) (224)Repurchase of common stock (525) (250) (25)Purchase of noncontrolling interest shares (25) — (5)Common stock issued 26 38 38Other (5) (9) (19)
Cash provided by (used in) financing activities (278) (707) 705Effect of exchange rate changes on cash and cash equivalents (24) (91) (82)Increase (decrease) in cash and cash equivalents 313 (254) (354)Cash and cash equivalents at beginning of year 772 1,026 1,380Cash and cash equivalents at end of year $ 1,085 $ 772 $ 1,026
Supplemental disclosure of cash flow information Cash paid for interest $ 198 $ 178 $ 172Cash paid for income taxes $ 300 $ 251 $ 140
The accompanying notes are an integral part of these Consolidated Financial Statements.
37
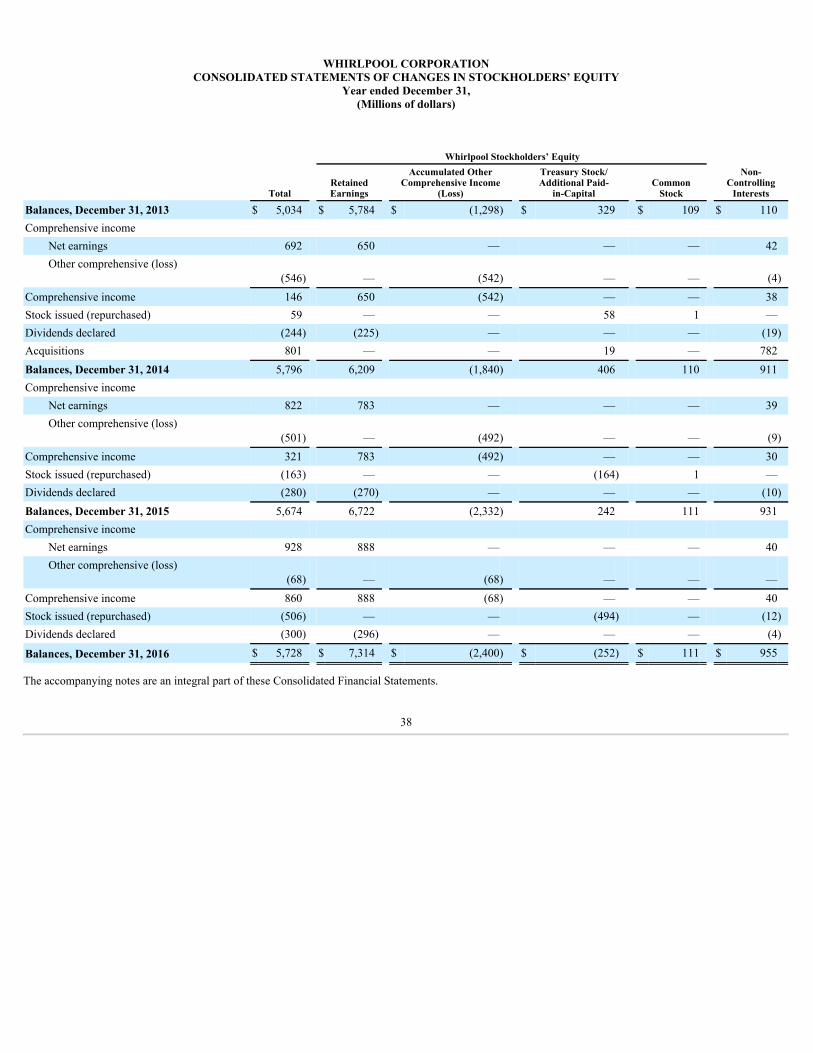
WHIRLPOOL CORPORATIONCONSOLIDATED STATEMENTS OF CHANGES IN STOCKHOLDERS’ EQUITY
Year ended December 31,(Millions of dollars)
Whirlpool Stockholders’ Equity
Total RetainedEarnings
Accumulated OtherComprehensive Income
(Loss)
Treasury Stock/Additional Paid-
in-Capital Common
Stock
Non-Controlling
Interests
Balances, December 31, 2013 $ 5,034 $ 5,784 $ (1,298) $ 329 $ 109 $ 110Comprehensive income
Net earnings 692 650 — — — 42Other comprehensive (loss)
(546) — (542) — — (4)Comprehensive income 146 650 (542) — — 38Stock issued (repurchased) 59 — — 58 1 —Dividends declared (244) (225) — — — (19)Acquisitions 801 — — 19 — 782Balances, December 31, 2014 5,796 6,209 (1,840) 406 110 911Comprehensive income
Net earnings 822 783 — — — 39Other comprehensive (loss)
(501) — (492) — — (9)Comprehensive income 321 783 (492) — — 30Stock issued (repurchased) (163) — — (164) 1 —Dividends declared (280) (270) — — — (10)Balances, December 31, 2015 5,674 6,722 (2,332) 242 111 931Comprehensive income
Net earnings 928 888 — — — 40Other comprehensive (loss)
(68) — (68) — — —Comprehensive income 860 888 (68) — — 40Stock issued (repurchased) (506) — — (494) — (12)Dividends declared (300) (296) — — — (4)
Balances, December 31, 2016 $ 5,728 $ 7,314 $ (2,400) $ (252) $ 111 $ 955
The accompanying notes are an integral part of these Consolidated Financial Statements.
38

NOTES TO THE CONSOLIDATED FINANCIAL STATEMENTS
( 1 ) SUMMARY OF PRINCIPAL ACCOUNTING POLICIES
General Information
Whirlpool Corporation, a Delaware corporation, is the world's leading manufacturer and marketer of major home appliances. Whirlpool manufacturesproducts in 14 countries and markets products in nearly every country around the world under brand names such as Whirlpool , KitchenAid , Maytag , Consul ,Brastemp, Amana, Bauknecht, Jenn-Air,Indesit,andHotpoint* . Whirlpool’s reportable segments consist of North America, Europe, Middle East and Africa("EMEA"), Latin America and Asia.
Principles of ConsolidationThe consolidated financial statements are prepared in conformity with United States (U.S.) generally accepted accounting principles (GAAP), and
include all majority-owned subsidiaries. All material intercompany transactions have been eliminated upon consolidation. We do not consolidate the financialstatements of any company in which we have an ownership interest of 50% or less unless that company is deemed to be a variable interest entity ("VIE") of whichwe are the primary beneficiary. Certain VIEs are consolidated when the company is the primary beneficiary of these entities and has the ability to directly impactthe activities of these entities, and have a nominal effect on the Company's results.
Reclassifications
We reclassified certain prior period amounts in our Consolidated Financial Statements to be consistent with current period presentation.
Use of Estimates
We are required to make estimates and assumptions that affect the amounts reported in the Consolidated Financial Statements and accompanyingnotes. The most significant assumptions are estimates in determining the fair value of intangible assets, legal contingencies, income taxes and pension andpostretirement benefits. Actual results could differ materially from those estimates.
Revenue Recognition
Sales are recognized when revenue is realized or realizable and has been earned. Revenue is recognized when the sales price is determinable and the risk andrewards of ownership are transferred to the customer as determined by the shipping terms. For the majority of our sales, title is transferred to the customer as soonas products are shipped. For a portion of our sales, title is transferred to the customer upon receipt of products at the customer’s location. Sales are net ofallowances for product returns, which are based on historical return rates and certain promotions.
Accounts Receivable and Allowance for Doubtful Accounts
We carry accounts receivable at sales value less an allowance for doubtful accounts. We periodically evaluate accounts receivable and establish anallowance for doubtful accounts based on a combination of specific customer circumstances, credit conditions and the history of write-offs and collections. Weevaluate items on an individual basis when determining accounts receivable write-offs. In general, our policy is to not charge interest on trade receivables after theinvoice becomes past due. A receivable is considered past due if payment has not been received within agreed upon invoice terms.
Freight and Warehousing Costs
We classify freight and warehousing costs within cost of products sold in our Consolidated Statements of Income.
Cash and Cash Equivalents
All highly liquid debt instruments purchased with an initial maturity of three months or less are considered cash equivalents.
*Whirlpool ownership of the Hotpoint brand in the EMEA and Asia Pacific regions is not affiliated with the Hotpoint brand sold in the Americas
39
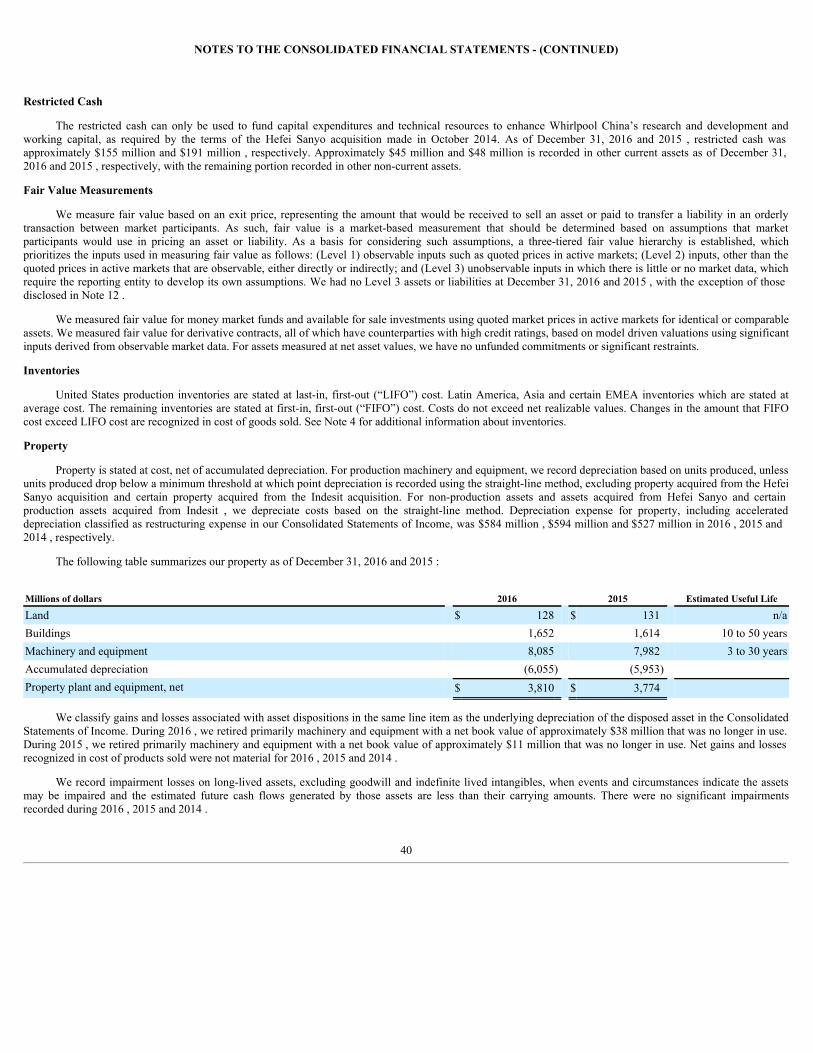
NOTES TO THE CONSOLIDATED FINANCIAL STATEMENTS - (CONTINUED)
Restricted Cash
The restricted cash can only be used to fund capital expenditures and technical resources to enhance Whirlpool China’s research and development andworking capital, as required by the terms of the Hefei Sanyo acquisition made in October 2014. As of December 31, 2016 and 2015 , restricted cash wasapproximately $155 million and $191 million , respectively. Approximately $45 million and $48 million is recorded in other current assets as of December 31,2016 and 2015 , respectively, with the remaining portion recorded in other non-current assets.
Fair Value Measurements
We measure fair value based on an exit price, representing the amount that would be received to sell an asset or paid to transfer a liability in an orderlytransaction between market participants. As such, fair value is a market-based measurement that should be determined based on assumptions that marketparticipants would use in pricing an asset or liability. As a basis for considering such assumptions, a three-tiered fair value hierarchy is established, whichprioritizes the inputs used in measuring fair value as follows: (Level 1) observable inputs such as quoted prices in active markets; (Level 2) inputs, other than thequoted prices in active markets that are observable, either directly or indirectly; and (Level 3) unobservable inputs in which there is little or no market data, whichrequire the reporting entity to develop its own assumptions. We had no Level 3 assets or liabilities at December 31, 2016 and 2015 , with the exception of thosedisclosed in Note 12 .
We measured fair value for money market funds and available for sale investments using quoted market prices in active markets for identical or comparableassets. We measured fair value for derivative contracts, all of which have counterparties with high credit ratings, based on model driven valuations using significantinputs derived from observable market data. For assets measured at net asset values, we have no unfunded commitments or significant restraints.
Inventories
United States production inventories are stated at last-in, first-out (“LIFO”) cost. Latin America, Asia and certain EMEA inventories which are stated ataverage cost. The remaining inventories are stated at first-in, first-out (“FIFO”) cost. Costs do not exceed net realizable values. Changes in the amount that FIFOcost exceed LIFO cost are recognized in cost of goods sold. See Note 4 for additional information about inventories.
Property
Property is stated at cost, net of accumulated depreciation. For production machinery and equipment, we record depreciation based on units produced, unlessunits produced drop below a minimum threshold at which point depreciation is recorded using the straight-line method, excluding property acquired from the HefeiSanyo acquisition and certain property acquired from the Indesit acquisition. For non-production assets and assets acquired from Hefei Sanyo and certainproduction assets acquired from Indesit , we depreciate costs based on the straight-line method. Depreciation expense for property, including accelerateddepreciation classified as restructuring expense in our Consolidated Statements of Income, was $584 million , $594 million and $527 million in 2016 , 2015 and2014 , respectively.
The following table summarizes our property as of December 31, 2016 and 2015 :
Millions of dollars 2016 2015 Estimated Useful Life
Land $ 128 $ 131 n/aBuildings 1,652 1,614 10 to 50 yearsMachinery and equipment 8,085 7,982 3 to 30 yearsAccumulated depreciation (6,055) (5,953) Property plant and equipment, net $ 3,810 $ 3,774
We classify gains and losses associated with asset dispositions in the same line item as the underlying depreciation of the disposed asset in the ConsolidatedStatements of Income. During 2016 , we retired primarily machinery and equipment with a net book value of approximately $38 million that was no longer in use.During 2015 , we retired primarily machinery and equipment with a net book value of approximately $11 million that was no longer in use. Net gains and lossesrecognized in cost of products sold were not material for 2016 , 2015 and 2014 .
We record impairment losses on long-lived assets, excluding goodwill and indefinite lived intangibles, when events and circumstances indicate the assetsmay be impaired and the estimated future cash flows generated by those assets are less than their carrying amounts. There were no significant impairmentsrecorded during 2016 , 2015 and 2014 .
40

NOTES TO THE CONSOLIDATED FINANCIAL STATEMENTS - (CONTINUED)
Goodwill and Other Intangibles
We perform our annual impairment assessment for goodwill and other indefinite-life intangible assets as of October 1st and more frequently if indicators ofimpairment exist. In 2016, the Company primarily elected to perform a quantitative analysis using a discounted cash flow model and other valuation techniques, toevaluate goodwill and certain indefinite-life intangible assets.
Goodwill
In performing a quantitative assessment of goodwill, we estimate each reporting units fair value using fair value using the best information available to us,including market information and discounted cash flow projections also referred to as the income approach. The income approach uses reporting unit’s projectionsof estimated operating results and cash flows that are discounted using a weighted-average cost of capital, which that is determined based on current marketconditions. Additionally we validate our estimates of fair value under the income approach by comparing the values to fair value estimates using a marketapproach. We performed our assessment as of October 1, 2016 , and determined there was no impairment of goodwill.
Other Intangible Assets
We perform a quantitative assessment of other indefinite life intangible assets, which are primarily comprised of trademarks. We estimate the fair value ofthese intangible assets using the relief-from-royalty method, which primarily requires assumptions related to projected revenues from our annual long-range plan,assumed royalty rates that could be payable if we did not own the trademark, and a discount rate based on our weighted average cost of capital. We performed ourassessment as of October 1, 2016 , and determined there was no impairments of indefinite life intangible assets.
Other definite life intangible assets are amortized over their useful life and are assessed for impairment when impairment indicators are present.
Accounts Payable Outsourcing
We offer our suppliers access to third party payable processors, independent to Whirlpool. The processors allow suppliers to sell their receivables tofinancial institutions at the sole discretion of both the supplier and the financial institution. In China, as a common practice we pay suppliers with banker’sacceptance drafts. Banker’s acceptance drafts allow suppliers to sell their receivables to financial institutions at the sole discretion of both the supplier and thefinancial institution. We have no economic interest in the sale of these receivables and no direct financial relationship with the financial institutions concerningthese services. All of our obligations, including amounts due, remain to our suppliers as stated in our supplier agreements. As of December 31, 2016 and 2015 ,approximately $1.3 billion and $1.2 billion , respectively, have been issued to participating financial institutions.
Derivative Financial Instruments
We use derivative instruments designated as cash flow and fair value hedges to manage our exposure to the volatility in material costs, foreign currency andinterest rates on certain debt instruments. Changes in the fair value of derivative assets or liabilities (i.e., gains or losses) are recognized depending upon the type ofhedging relationship and whether a hedge has been designated. For those derivative instruments that qualify for hedge accounting, we designate the hedginginstrument, based upon the exposure being hedged, as a cash flow hedge, fair value hedge, or a hedge of a net investment in a foreign operation. For a derivativeinstrument designated as a fair value hedge, the gain or loss on the derivative is recognized in earnings in the period of change in fair value together with theoffsetting gain or loss on the hedged item. For a derivative instrument designated as a cash flow hedge, the effective portion of the derivative’s gain or loss isinitially reported as a component of Other Comprehensive Income and is subsequently recognized in earnings when the hedged exposure affects earnings. For aderivative instrument designated as a hedge of a net investment in a foreign operation, the effective portion of the derivative’s gain or loss is reported in OtherComprehensive Income (Loss) as part of the cumulative translation adjustment. Changes in fair value of derivative instruments that do not qualify for hedgeaccounting are recognized immediately in current net earnings. See Note 7 for additional information about hedges and derivative financial instruments.
Foreign Currency Translation and Transactions
Foreign currency denominated assets and liabilities are translated into United States dollars at exchange rates existing at the respective balance sheet dates.Translation adjustments resulting from fluctuations in exchange rates are recorded as a separate component of Accumulated Other Comprehensive Income (Loss)within stockholders’ equity. The results of operations of foreign subsidiaries are translated at the average exchange rates during the respective periods. Gains andlosses resulting from foreign currency transactions are included in net earnings.
41

NOTES TO THE CONSOLIDATED FINANCIAL STATEMENTS - (CONTINUED)
Research and Development Costs
Research and development costs are charged to expense and totaled $ 604 million , $579 million and $563 million in 2016 , 2015 and 2014 , respectively.
Advertising Costs
Advertising costs are charged to expense when the advertisement is first communicated and totaled $366 million , $310 million and $269 million in 2016 ,2015 and 2014 , respectively.
Income Taxes
We account for income taxes using the asset and liability method. Under this method, deferred tax assets and liabilities are recognized for the future taxconsequences of temporary differences between the financial statement and tax basis of assets and liabilities using enacted rates. The effect of a change in tax rateson deferred tax assets is recognized in income in the period of enactment date.
We recognize, primarily in other noncurrent liabilities, in the Consolidated Balance Sheets, the effects of uncertain income tax positions. We recordliabilities net of the amount, based on technical merits, that will be sustained upon examination. We accrue for other non income tax contingencies when it isprobable that a liability to a taxing authority has been incurred and the amount of the contingency can be reasonably estimated.
Provision is made for taxes on undistributed earnings of foreign subsidiaries and related companies to the extent that such earnings are not deemed to bepermanently invested. See Note 11 for additional information about income taxes.
Stock Based Compensation
Stock based compensation expense is based on the grant date fair value and is expensed over the period during which an employee is required to provideservice in exchange for the award (generally the vesting period). The Company's stock based compensation includes stock options, performance stock units,performance shares, restricted stock and restricted stock units. The fair value of stock options are determined using the Black-Scholes option-pricing model, whichincorporates assumptions regarding the risk-free interest rate, expected volatility, expected option life, expected forfeitures and dividend yield. Expected forfeituresare based on historical experience. Stock options are granted with an exercise price equal to the stock price on the date of grant. The fair value of restricted stockunits and performance stock units is generally based on the closing market price of Whirlpool common stock on the grant date. See Note 9 for additionalinformation about stock based compensation.
BEFIEX Credits
In previous years, our Brazilian operations earned tax credits under the Brazilian government’s export incentive program (BEFIEX). These credits reduceBrazilian federal excise taxes on domestic sales, resulting in an increase in the operations’ recorded net sales. We recognized export credits as they weremonetized. See Note 6 and Note 11 for additional information regarding BEFIEX credits.
Adoption of New Accounting Standards
In November 2015, the Financial Accounting Standards Board (“FASB”) issued Accounting Standards Update ("ASU") No. 2015-17, "Income Taxes (Topic740): Balance Sheet Classification of Deferred Taxes", which supersedes the guidance in Topic 740, Income Taxes, that requires an entity to separate deferred taxliabilities and assets into a current amount and noncurrent amount in a classified statement of financial position. The amendment requires entities that present aclassified balance sheet to classify all deferred tax liabilities and assets as a noncurrent amount. This pronouncement is effective for fiscal years and interim periodswithin those years beginning after December 15, 2016, and may be early adopted on a prospective basis or on a retrospective basis to all periods presented. OnDecember 31, 2016, we retrospectively adopted the new accounting standard. The change resulted in the reclassification, from current to noncurrent, of deferredtax assets of approximately $451 million and deferred tax liabilities of approximately $19 million , as of December 31, 2015. The impact of this reclassification asof December 31, 2016 has no impact on net income or cash flow, and is comparable to December 31, 2015.
The following standards were adopted during 2016, none of which have a material impact on our Consolidated Financial Statements:
42
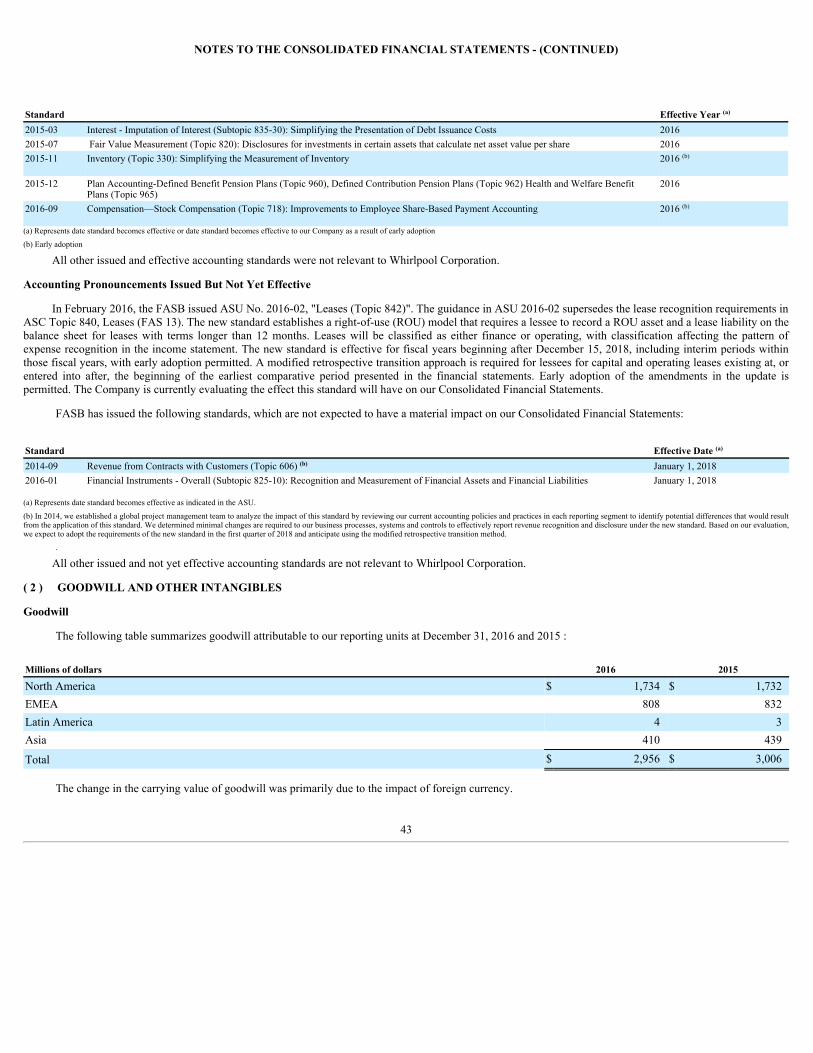
NOTES TO THE CONSOLIDATED FINANCIAL STATEMENTS - (CONTINUED)
Standard Effective Year (a)
2015-03 Interest - Imputation of Interest (Subtopic 835-30): Simplifying the Presentation of Debt Issuance Costs 20162015-07 Fair Value Measurement (Topic 820): Disclosures for investments in certain assets that calculate net asset value per share 20162015-11 Inventory (Topic 330): Simplifying the Measurement of Inventory 2016 (b)
2015-12 Plan Accounting-Defined Benefit Pension Plans (Topic 960), Defined Contribution Pension Plans (Topic 962) Health and Welfare BenefitPlans (Topic 965)
2016
2016-09 Compensation—Stock Compensation (Topic 718): Improvements to Employee Share-Based Payment Accounting 2016 (b)
(a) Represents date standard becomes effective or date standard becomes effective to our Company as a result of early adoption (b) Early adoption
All other issued and effective accounting standards were not relevant to Whirlpool Corporation.
Accounting Pronouncements Issued But Not Yet Effective
In February 2016, the FASB issued ASU No. 2016-02, "Leases (Topic 842)". The guidance in ASU 2016-02 supersedes the lease recognition requirements inASC Topic 840, Leases (FAS 13). The new standard establishes a right-of-use (ROU) model that requires a lessee to record a ROU asset and a lease liability on thebalance sheet for leases with terms longer than 12 months. Leases will be classified as either finance or operating, with classification affecting the pattern ofexpense recognition in the income statement. The new standard is effective for fiscal years beginning after December 15, 2018, including interim periods withinthose fiscal years, with early adoption permitted. A modified retrospective transition approach is required for lessees for capital and operating leases existing at, orentered into after, the beginning of the earliest comparative period presented in the financial statements. Early adoption of the amendments in the update ispermitted. The Company is currently evaluating the effect this standard will have on our Consolidated Financial Statements.
FASB has issued the following standards, which are not expected to have a material impact on our Consolidated Financial Statements:
Standard Effective Date (a)
2014-09 Revenue from Contracts with Customers (Topic 606) (b) January 1, 20182016-01 Financial Instruments - Overall (Subtopic 825-10): Recognition and Measurement of Financial Assets and Financial Liabilities January 1, 2018
(a) Represents date standard becomes effective as indicated in the ASU. (b) In 2014, we established a global project management team to analyze the impact of this standard by reviewing our current accounting policies and practices in each reporting segment to identify potential differences that would resultfrom the application of this standard. We determined minimal changes are required to our business processes, systems and controls to effectively report revenue recognition and disclosure under the new standard. Based on our evaluation,we expect to adopt the requirements of the new standard in the first quarter of 2018 and anticipate using the modified retrospective transition method.
. All other issued and not yet effective accounting standards are not relevant to Whirlpool Corporation.
( 2 ) GOODWILL AND OTHER INTANGIBLES
Goodwill
The following table summarizes goodwill attributable to our reporting units at December 31, 2016 and 2015 :
Millions of dollars 2016 2015
North America $ 1,734 $ 1,732EMEA 808 832Latin America 4 3Asia 410 439
Total $ 2,956 $ 3,006
The change in the carrying value of goodwill was primarily due to the impact of foreign currency.
43
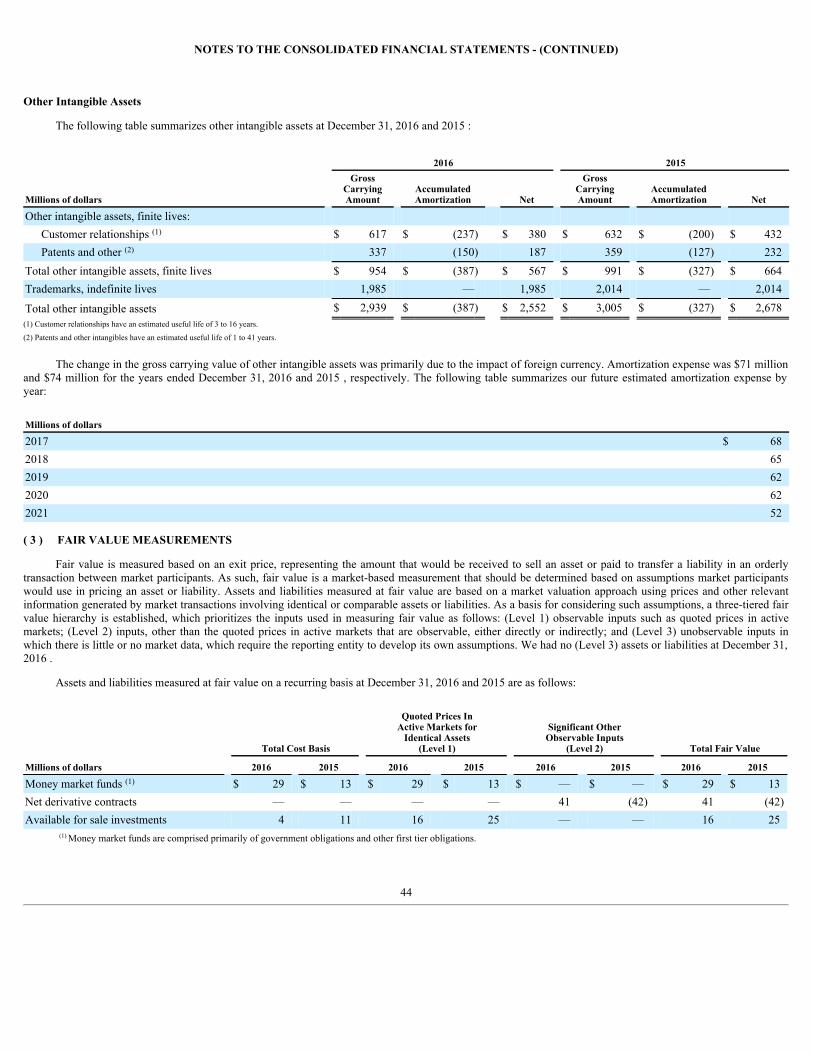
NOTES TO THE CONSOLIDATED FINANCIAL STATEMENTS - (CONTINUED)
Other Intangible Assets
The following table summarizes other intangible assets at December 31, 2016 and 2015 :
2016 2015
Millions of dollars
GrossCarryingAmount
AccumulatedAmortization Net
GrossCarryingAmount
AccumulatedAmortization Net
Other intangible assets, finite lives: Customer relationships (1) $ 617 $ (237) $ 380 $ 632 $ (200) $ 432Patents and other (2) 337 (150) 187 359 (127) 232
Total other intangible assets, finite lives $ 954 $ (387) $ 567 $ 991 $ (327) $ 664Trademarks, indefinite lives 1,985 — 1,985 2,014 — 2,014
Total other intangible assets $ 2,939 $ (387) $ 2,552 $ 3,005 $ (327) $ 2,678(1) Customer relationships have an estimated useful life of 3 to 16 years. (2) Patents and other intangibles have an estimated useful life of 1 to 41 years.
The change in the gross carrying value of other intangible assets was primarily due to the impact of foreign currency. Amortization expense was $71 millionand $74 million for the years ended December 31, 2016 and 2015 , respectively. The following table summarizes our future estimated amortization expense byyear:
Millions of dollars
2017 $ 682018 652019 622020 622021 52
( 3 ) FAIR VALUE MEASUREMENTS
Fair value is measured based on an exit price, representing the amount that would be received to sell an asset or paid to transfer a liability in an orderlytransaction between market participants. As such, fair value is a market-based measurement that should be determined based on assumptions market participantswould use in pricing an asset or liability. Assets and liabilities measured at fair value are based on a market valuation approach using prices and other relevantinformation generated by market transactions involving identical or comparable assets or liabilities. As a basis for considering such assumptions, a three-tiered fairvalue hierarchy is established, which prioritizes the inputs used in measuring fair value as follows: (Level 1) observable inputs such as quoted prices in activemarkets; (Level 2) inputs, other than the quoted prices in active markets that are observable, either directly or indirectly; and (Level 3) unobservable inputs inwhich there is little or no market data, which require the reporting entity to develop its own assumptions. We had no (Level 3) assets or liabilities at December 31,2016 .
Assets and liabilities measured at fair value on a recurring basis at December 31, 2016 and 2015 are as follows:
Total Cost Basis
Quoted Prices InActive Markets for
Identical Assets(Level 1)
Significant OtherObservable Inputs
(Level 2) Total Fair Value
Millions of dollars 2016 2015 2016 2015 2016 2015 2016 2015
Money market funds (1) $ 29 $ 13 $ 29 $ 13 $ — $ — $ 29 $ 13Net derivative contracts — — — — 41 (42) 41 (42)Available for sale investments 4 11 16 25 — — 16 25
(1) Money market funds are comprised primarily of government obligations and other first tier obligations.
44
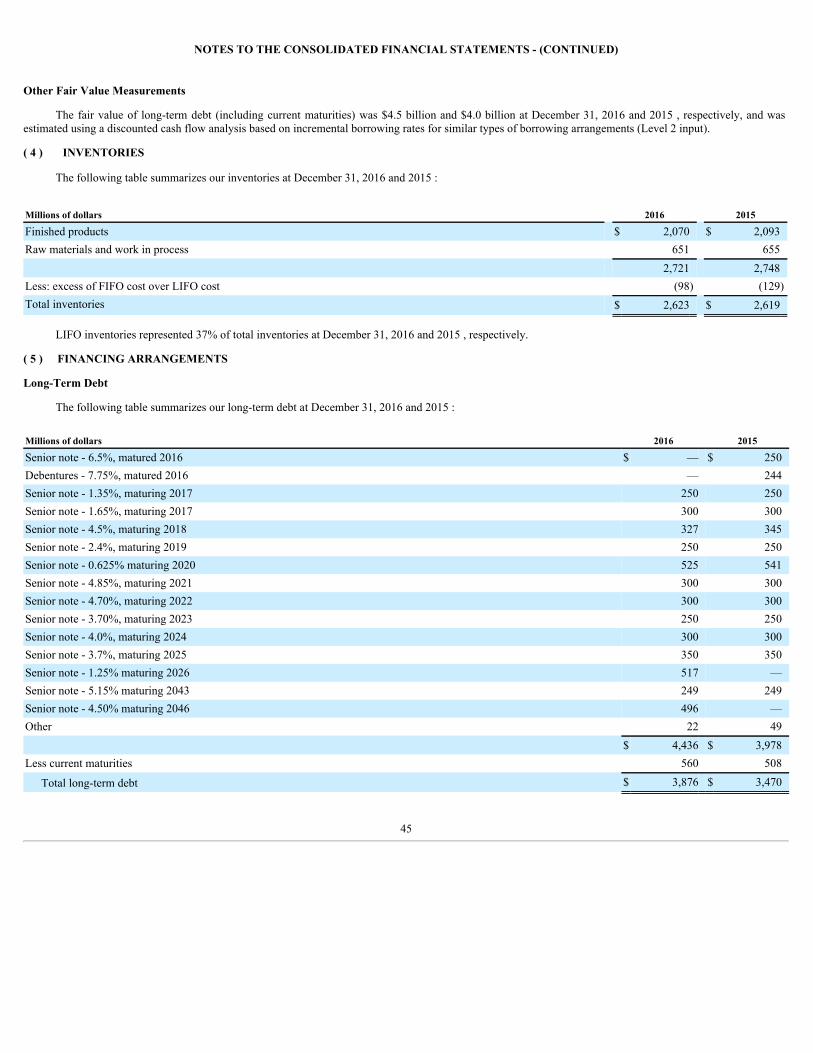
NOTES TO THE CONSOLIDATED FINANCIAL STATEMENTS - (CONTINUED)
Other Fair Value Measurements
The fair value of long-term debt (including current maturities) was $4.5 billion and $4.0 billion at December 31, 2016 and 2015 , respectively, and wasestimated using a discounted cash flow analysis based on incremental borrowing rates for similar types of borrowing arrangements (Level 2 input).
( 4 ) INVENTORIES
The following table summarizes our inventories at December 31, 2016 and 2015 :
Millions of dollars 2016 2015
Finished products $ 2,070 $ 2,093Raw materials and work in process 651 655 2,721 2,748Less: excess of FIFO cost over LIFO cost (98) (129)Total inventories $ 2,623 $ 2,619
LIFO inventories represented 37% of total inventories at December 31, 2016 and 2015 , respectively.
( 5 ) FINANCING ARRANGEMENTS
Long-Term Debt
The following table summarizes our long-term debt at December 31, 2016 and 2015 :
Millions of dollars 2016 2015
Senior note - 6.5%, matured 2016 $ — $ 250Debentures - 7.75%, matured 2016 — 244Senior note - 1.35%, maturing 2017 250 250Senior note - 1.65%, maturing 2017 300 300Senior note - 4.5%, maturing 2018 327 345Senior note - 2.4%, maturing 2019 250 250Senior note - 0.625% maturing 2020 525 541Senior note - 4.85%, maturing 2021 300 300Senior note - 4.70%, maturing 2022 300 300Senior note - 3.70%, maturing 2023 250 250Senior note - 4.0%, maturing 2024 300 300Senior note - 3.7%, maturing 2025 350 350Senior note - 1.25% maturing 2026 517 —Senior note - 5.15% maturing 2043 249 249Senior note - 4.50% maturing 2046 496 —Other 22 49 $ 4,436 $ 3,978Less current maturities 560 508
Total long-term debt $ 3,876 $ 3,470
45

NOTES TO THE CONSOLIDATED FINANCIAL STATEMENTS - (CONTINUED)
The following table summarizes the contractual maturities of our long-term debt, including current maturities, at December 31, 2016 :
Millions of dollars
2017 $ 5602018 3422019 2592020 5242021 299Thereafter 2,452 Long-term debt, including current maturities $ 4,436
On July 15, 2016, $244 million of 7.75% notes matured and were repaid. On June 15, 2016, $250 million of 6.50% notes matured and were repaid.
On May 23, 2016, we completed a debt offering of $500 million principal amount of 4.50% notes due in 2046. The notes contain covenants that limitour ability to incur certain liens or enter into certain sale and lease-back transactions. In addition, if we experience a specific kind of change of control, we arerequired to make an offer to purchase all of the notes at a purchase price of 101% of the principal amount thereof, plus accrued and unpaid interest. The notes areregistered under the Securities Act of 1933, as amended, pursuant to our Registration Statement on Form S-3 (File No. 333-203704) filed with the Securities andExchange Commission on April 29, 2015.
On November 2, 2016, Whirlpool Finance Luxembourg S.à. r.l., an indirect, wholly-owned finance subsidiary of Whirlpool Corporation, completed a debtoffering of €500 million (approximately $555 million as of the date of issuance) principal amount of 1.250% notes due in 2026. The Company has fully andunconditionally guaranteed these notes. The notes contain covenants that limit Whirlpool Corporation's ability to incur certain liens or enter into certain sale andlease-back transactions. In addition, if we experience a specific kind of change of control, we are required to make an offer to purchase all of the notes at apurchase price of 101% of the principal amount thereof, plus accrued and unpaid interest. The notes are registered under the Securities Act of 1933, as amended,pursuant to our Registration Statement on Form S-3 (File No.333-203704-1) filed with the Securities and Exchange Commission on October 25, 2016
On May 17, 2016, we and certain of our subsidiaries entered into a Third Amended and Restated Long-Term Credit Agreement (the “Amended Long-TermFacility”). The Amended Long-Term Facility provides aggregate borrowing capacity of $2.5 billion , which combines amounts previously available under our priorOriginal Long-Term Facility and Terminated 364-Day Facility. The Amended Long-Term Facility has a maturity date of May 17, 2021 and amends and restates inits entirety our previously existing Second Amended and Restated Long-Term Credit Agreement, dated September 26, 2014 (the "Original Long-Term Facility"),and replaces aggregate borrowing capacity of $500 million available under our previously existing Amended and Restated Short-Term Credit Agreement, dated asof September 25, 2015, which agreement was terminated on May 17, 2016 (the "Terminated 364-Day Facility").
The interest and fee rates payable with respect to the Amended Long-Term Facility based on our current debt rating are as follows: (1) the spread overLIBOR is 1.125% ; (2) the spread over prime is 0.125% ; and (3) the unused commitment fee is 0.125% . The Amended Long-Term Facility contains customarycovenants and warranties including, among other things, a debt to capitalization ratio of less than or equal to 0.60 to 1.00 as of the last day of each fiscal quarter,and a rolling twelve month interest coverage ratio required to be greater than or equal to 3.0 to 1.0 for each fiscal quarter. In addition, the covenants limit ourability to (or to permit any subsidiaries to), subject to various exceptions and limitations: (i) merge with other companies; (ii) create liens on its property; (iii) incurdebt or off-balance sheet obligations at the subsidiary level; (iv) enter into transactions with affiliates, except on an arms-length basis; (v) enter into agreementsrestricting the payment of subsidiary dividends or restricting the making of loans or repayment of debt by subsidiaries to the Company or other subsidiaries; and(vi) enter into agreements restricting the creation of liens on our assets.
In addition to the committed $2.5 billion Amended Long-Term Facility, we have a committed European facility and committed credit facilities in Brazil.The European facility provides borrowings up to €250 million (approximately $263 million at December 31, 2016 ), expiring in 2019. The committed creditfacilities in Brazil provide borrowings up to 1.0 billion Brazilian reais (approximately $307 million at December 31, 2016 ), expiring in 2017.
We had no borrowings outstanding under the committed credit facilities at December 31, 2016 and 2015 , respectively.
46
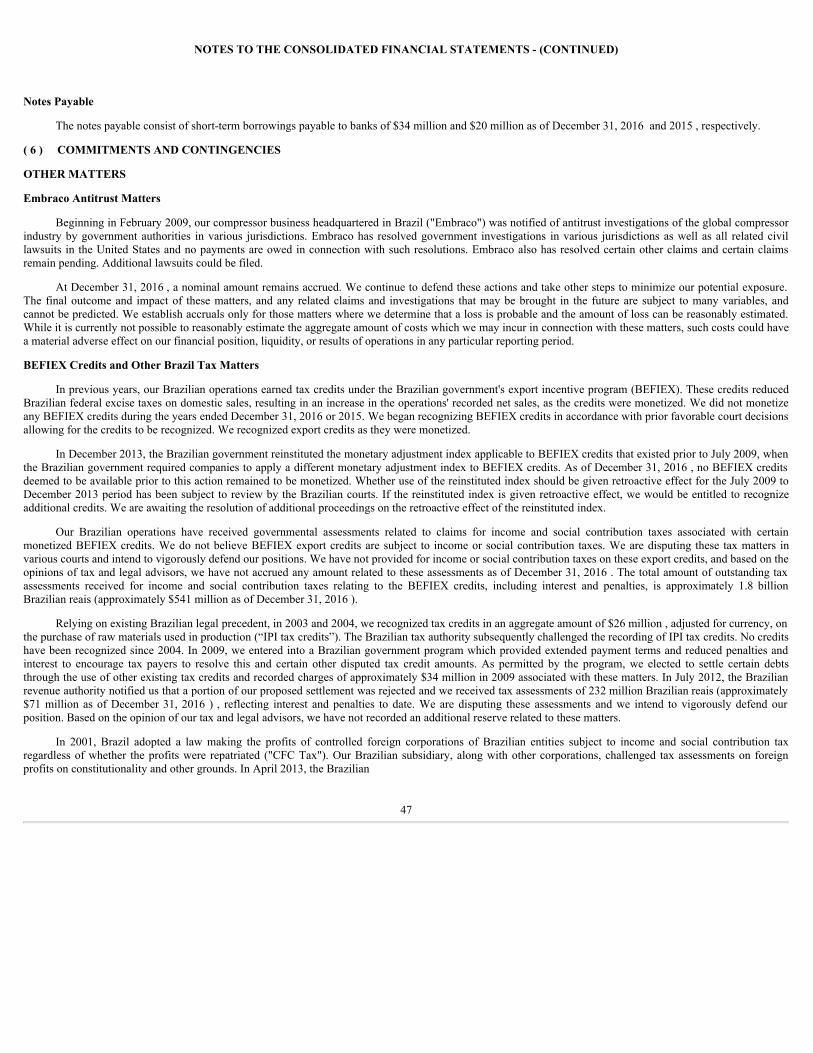
NOTES TO THE CONSOLIDATED FINANCIAL STATEMENTS - (CONTINUED)
Notes Payable
The notes payable consist of short-term borrowings payable to banks of $34 million and $20 million as of December 31, 2016 and 2015 , respectively.
( 6 ) COMMITMENTS AND CONTINGENCIES
OTHER MATTERS
Embraco Antitrust Matters
Beginning in February 2009, our compressor business headquartered in Brazil ("Embraco") was notified of antitrust investigations of the global compressorindustry by government authorities in various jurisdictions. Embraco has resolved government investigations in various jurisdictions as well as all related civillawsuits in the United States and no payments are owed in connection with such resolutions. Embraco also has resolved certain other claims and certain claimsremain pending. Additional lawsuits could be filed.
At December 31, 2016 , a nominal amount remains accrued. We continue to defend these actions and take other steps to minimize our potential exposure.The final outcome and impact of these matters, and any related claims and investigations that may be brought in the future are subject to many variables, andcannot be predicted. We establish accruals only for those matters where we determine that a loss is probable and the amount of loss can be reasonably estimated.While it is currently not possible to reasonably estimate the aggregate amount of costs which we may incur in connection with these matters, such costs could havea material adverse effect on our financial position, liquidity, or results of operations in any particular reporting period.
BEFIEX Credits and Other Brazil Tax Matters
In previous years, our Brazilian operations earned tax credits under the Brazilian government's export incentive program (BEFIEX). These credits reducedBrazilian federal excise taxes on domestic sales, resulting in an increase in the operations' recorded net sales, as the credits were monetized. We did not monetizeany BEFIEX credits during the years ended December 31, 2016 or 2015. We began recognizing BEFIEX credits in accordance with prior favorable court decisionsallowing for the credits to be recognized. We recognized export credits as they were monetized.
In December 2013, the Brazilian government reinstituted the monetary adjustment index applicable to BEFIEX credits that existed prior to July 2009, whenthe Brazilian government required companies to apply a different monetary adjustment index to BEFIEX credits. As of December 31, 2016 , no BEFIEX creditsdeemed to be available prior to this action remained to be monetized. Whether use of the reinstituted index should be given retroactive effect for the July 2009 toDecember 2013 period has been subject to review by the Brazilian courts. If the reinstituted index is given retroactive effect, we would be entitled to recognizeadditional credits. We are awaiting the resolution of additional proceedings on the retroactive effect of the reinstituted index.
Our Brazilian operations have received governmental assessments related to claims for income and social contribution taxes associated with certainmonetized BEFIEX credits. We do not believe BEFIEX export credits are subject to income or social contribution taxes. We are disputing these tax matters invarious courts and intend to vigorously defend our positions. We have not provided for income or social contribution taxes on these export credits, and based on theopinions of tax and legal advisors, we have not accrued any amount related to these assessments as of December 31, 2016 . The total amount of outstanding taxassessments received for income and social contribution taxes relating to the BEFIEX credits, including interest and penalties, is approximately 1.8 billionBrazilian reais (approximately $541 million as of December 31, 2016 ).
Relying on existing Brazilian legal precedent, in 2003 and 2004, we recognized tax credits in an aggregate amount of $26 million , adjusted for currency, onthe purchase of raw materials used in production (“IPI tax credits”). The Brazilian tax authority subsequently challenged the recording of IPI tax credits. No creditshave been recognized since 2004. In 2009, we entered into a Brazilian government program which provided extended payment terms and reduced penalties andinterest to encourage tax payers to resolve this and certain other disputed tax credit amounts. As permitted by the program, we elected to settle certain debtsthrough the use of other existing tax credits and recorded charges of approximately $34 million in 2009 associated with these matters. In July 2012, the Brazilianrevenue authority notified us that a portion of our proposed settlement was rejected and we received tax assessments of 232 million Brazilian reais (approximately$71 million as of December 31, 2016 ) , reflecting interest and penalties to date. We are disputing these assessments and we intend to vigorously defend ourposition. Based on the opinion of our tax and legal advisors, we have not recorded an additional reserve related to these matters.
In 2001, Brazil adopted a law making the profits of controlled foreign corporations of Brazilian entities subject to income and social contribution taxregardless of whether the profits were repatriated ("CFC Tax"). Our Brazilian subsidiary, along with other corporations, challenged tax assessments on foreignprofits on constitutionality and other grounds. In April 2013, the Brazilian
47

NOTES TO THE CONSOLIDATED FINANCIAL STATEMENTS - (CONTINUED)
Supreme Court ruled on one of our cases, finding that the law is constitutional, but remanding the case to a lower court for consideration of other arguments raisedin our appeal, including the existence of tax treaties with jurisdictions in which controlled foreign corporations are domiciled. As of December 31, 2016 , ourpotential exposure for income and social contribution taxes relating to profits of controlled foreign corporations, including interest and penalties and net ofexpected foreign tax credits, is approximately 171 million Brazilian reais (approximately $52 million as of December 31, 2016 ). We believe these assessments arewithout merit and we intend to continue to vigorously dispute them. Based on the opinion of our tax and legal advisors, we have not accrued any amount related tothese assessments as of December 31, 2016 .
In addition to the IPI tax credit and CFC Tax matters noted above, we are currently disputing other assessments issued by the Brazilian tax authoritiesrelated to non-income and income tax matters, including for the monetization of BEFIEX credits and other matters, which are at various stages of review innumerous administrative and judicial proceedings. The amounts related to these assessments will continue to be increased by monetary adjustments at the Selicrate, which is the benchmark rate set by the Brazilian Central Bank. In accordance with our accounting policies, we routinely assess these matters and, whennecessary, record our best estimate of a loss. We believe these tax assessments are without merit and are vigorously defending our positions.
Litigation is inherently unpredictable and the conclusion of these matters may take many years to ultimately resolve. Accordingly, it is possible that anunfavorable outcome in these proceedings could have a material adverse effect on our financial position, liquidity, or results of operations in any particularreporting period.
Other Litigation
We have vigorously defended against numerous lawsuits pending in the United States relating to certain of our front load washing machines. In 2016, wereached final agreement on a settlement that will resolve all such class action lawsuits (except for attorneys fees in an immaterial case) and received court approval.We are proceeding through the administrative consumer claims process to implement the terms of the settlement, which will be complete in 2017.
In addition, we are currently vigorously defending a number of other lawsuits in federal and state courts in the United States related to the manufacturingand sale of our products which include class action allegations, and have and may become involved in similar actions in other jurisdictions. These lawsuits allegeclaims which include negligence, breach of contract, breach of warranty, product liability and safety claims, false advertising, fraud, and violation of federal andstate regulations, including consumer protection laws. In general, we do not have insurance coverage for class action lawsuits. We are also involved in variousother legal actions in the United States and other jurisdictions around the world arising in the normal course of business, for which insurance coverage may or maynot be available depending on the nature of the action. We dispute the merits of these suits and actions, and intend to vigorously defend them. Managementbelieves, based upon its current knowledge, after taking into consideration legal counsel's evaluation of such suits and actions, and after taking into account currentlitigation accruals, that the outcome of these matters currently pending against Whirlpool should not have a material adverse effect, if any, on our financialposition, liquidity, or results of operations.
Competition Investigation
In 2013, the French Competition Authority commenced an investigation of appliance manufacturers and retailers in France. The investigation includes(among others) Whirlpool and Indesit operations in France. Although it is currently not possible to assess the impact, if any, this matter may have on ourConsolidated Financial Statements, the resolution of this matter could have a material adverse effect on our financial position, liquidity, or results of operations inany particular reporting period.
48
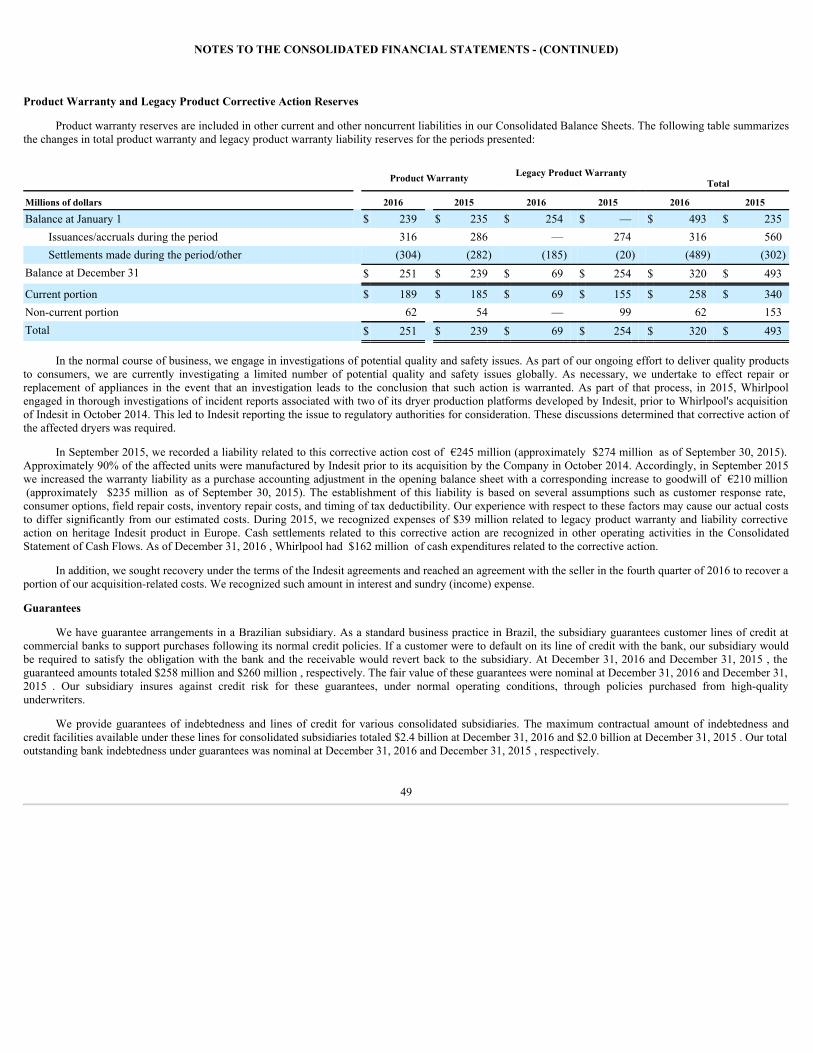
NOTES TO THE CONSOLIDATED FINANCIAL STATEMENTS - (CONTINUED)
Product Warranty and Legacy Product Corrective Action Reserves
Product warranty reserves are included in other current and other noncurrent liabilities in our Consolidated Balance Sheets. The following table summarizesthe changes in total product warranty and legacy product warranty liability reserves for the periods presented:
Product Warranty Legacy Product Warranty
Total
Millions of dollars 2016 2015 2016 2015 2016 2015
Balance at January 1 $ 239 $ 235 $ 254 $ — $ 493 $ 235Issuances/accruals during the period 316 286 — 274 316 560Settlements made during the period/other (304) (282) (185) (20) (489) (302)
Balance at December 31 $ 251 $ 239 $ 69 $ 254 $ 320 $ 493
Current portion $ 189 $ 185 $ 69 $ 155 $ 258 $ 340Non-current portion 62 54 — 99 62 153Total $ 251 $ 239 $ 69 $ 254 $ 320 $ 493
In the normal course of business, we engage in investigations of potential quality and safety issues. As part of our ongoing effort to deliver quality productsto consumers, we are currently investigating a limited number of potential quality and safety issues globally. As necessary, we undertake to effect repair orreplacement of appliances in the event that an investigation leads to the conclusion that such action is warranted. As part of that process, in 2015, Whirlpoolengaged in thorough investigations of incident reports associated with two of its dryer production platforms developed by Indesit, prior to Whirlpool's acquisitionof Indesit in October 2014. This led to Indesit reporting the issue to regulatory authorities for consideration. These discussions determined that corrective action ofthe affected dryers was required.
In September 2015, we recorded a liability related to this corrective action cost of €245 million (approximately $274 million as of September 30, 2015).Approximately 90% of the affected units were manufactured by Indesit prior to its acquisition by the Company in October 2014. Accordingly, in September 2015we increased the warranty liability as a purchase accounting adjustment in the opening balance sheet with a corresponding increase to goodwill of €210 million (approximately $235 million as of September 30, 2015). The establishment of this liability is based on several assumptions such as customer response rate,consumer options, field repair costs, inventory repair costs, and timing of tax deductibility. Our experience with respect to these factors may cause our actual coststo differ significantly from our estimated costs. During 2015, we recognized expenses of $39 million related to legacy product warranty and liability correctiveaction on heritage Indesit product in Europe. Cash settlements related to this corrective action are recognized in other operating activities in the ConsolidatedStatement of Cash Flows. As of December 31, 2016 , Whirlpool had $162 million of cash expenditures related to the corrective action.
In addition, we sought recovery under the terms of the Indesit agreements and reached an agreement with the seller in the fourth quarter of 2016 to recover aportion of our acquisition-related costs. We recognized such amount in interest and sundry (income) expense.
Guarantees
We have guarantee arrangements in a Brazilian subsidiary. As a standard business practice in Brazil, the subsidiary guarantees customer lines of credit atcommercial banks to support purchases following its normal credit policies. If a customer were to default on its line of credit with the bank, our subsidiary wouldbe required to satisfy the obligation with the bank and the receivable would revert back to the subsidiary. At December 31, 2016 and December 31, 2015 , theguaranteed amounts totaled $258 million and $260 million , respectively. The fair value of these guarantees were nominal at December 31, 2016 and December 31,2015 . Our subsidiary insures against credit risk for these guarantees, under normal operating conditions, through policies purchased from high-qualityunderwriters.
We provide guarantees of indebtedness and lines of credit for various consolidated subsidiaries. The maximum contractual amount of indebtedness andcredit facilities available under these lines for consolidated subsidiaries totaled $2.4 billion at December 31, 2016 and $2.0 billion at December 31, 2015 . Our totaloutstanding bank indebtedness under guarantees was nominal at December 31, 2016 and December 31, 2015 , respectively.
49

NOTES TO THE CONSOLIDATED FINANCIAL STATEMENTS - (CONTINUED)
We have guaranteed a $40 million five -year revolving credit facility between certain financial institutions and a not-for-profit entity in connection with acommunity and economic development project (“Harbor Shores”). The credit facility, which originated in 2008, was refinanced in December 2012 and we renewedour guarantee through 2017. It was also amended in 2015 and 2016 by Harbor Shores and reduced to $43 million and $40 million , respectively. The fair value ofthis guarantee was nominal at December 31, 2016 and December 31, 2015 The purpose of Harbor Shores is to stimulate employment and growth in the areas ofBenton Harbor and St. Joseph, Michigan. In the event of default, we must satisfy the guarantee of the credit facility up to the amount borrowed at the date ofdefault.
Operating Lease Commitments
At December 31, 2016 , we had noncancelable operating lease commitments totaling $936 million . The annual future minimum lease payments aresummarized by year in the table below :
Millions of dollars 2017 $ 2062018 1702019 1412020 1182021 96Thereafter 205Total noncancelable operating lease commitments $ 936
Rent expense was $234 million , $238 million and $228 million for 2016 , 2015 and 2014 , respectively.
Purchase Obligations
Our expected cash outflows resulting from non-cancellable purchase obligations are summarized by year in the table below :
Millions of dollars
2017 $ 1642018 1482019 1472020 1252021 69Thereafter 111Total purchase obligations $ 764
( 7 ) HEDGES AND DERIVATIVE FINANCIAL INSTRUMENTS
Derivative instruments are accounted for at fair value based on market rates. Derivatives where we elect hedge accounting are designated as either cash flowor fair value hedges. Derivatives that are not accounted for based on hedge accounting are marked to market through earnings. The accounting for changes in thefair value of a derivative depends on the intended use and designation of the derivative instrument. Hedging ineffectiveness and a net earnings impact occur whenthe change in the fair value of the hedge does not offset the change in the fair value of the hedged item. The ineffective portion of the gain or loss is recognized inearnings.
Using derivative instruments means assuming counterparty credit risk. Counterparty credit risk relates to the loss we could incur if a counterparty were todefault on a derivative contract. We generally deal with investment grade counterparties and monitor the overall credit risk and exposure to individualcounterparties. We do not anticipate nonperformance by any counterparties. The amount of counterparty credit exposure is limited to the unrealized gains, if any,on such derivative contracts. We do not require nor do we post collateral or security on such contracts.
Hedging Strategy
In the normal course of business, we manage risks relating to our ongoing business operations including those arising from changes in foreign exchangerates, interest rates and commodity prices. Fluctuations in these rates and prices can affect our operating results and financial condition. We use a variety ofstrategies, including the use of derivative instruments, to manage these risks. We do not enter into derivative financial instruments for trading or speculativepurposes.
50

NOTES TO THE CONSOLIDATED FINANCIAL STATEMENTS - (CONTINUED)
Foreign Currency Exchange Rate Risk
We incur expenses associated with the procurement and production of products in a limited number of countries, while we sell in the local currencies of alarge number of countries. Our primary foreign currency exchange exposures result from cross-currency sales of products. As a result, we enter into foreignexchange contracts to hedge certain firm commitments and forecasted transactions to acquire products and services that are denominated in foreign currencies.
We enter into certain undesignated non-functional currency asset and liability hedges that relate primarily to short-term payables, receivables andintercompany loans. These forecasted cross-currency cash flows relate primarily to foreign currency denominated expenditures and intercompany financingagreements, royalty agreements and dividends. When we hedge a foreign currency denominated payable or receivable with a derivative, the effect of changes in theforeign exchange rates are reflected currently in interest and sundry (income) expense for both the payable/receivable and the derivative. Therefore, as a result ofthe economic hedge, we do not elect hedge accounting.
Commodity Price Risk
We enter into commodity derivative contracts on various commodities to manage the price risk associated with forecasted purchases of materials used in ourmanufacturing process. The objective of these hedges is to reduce the variability of cash flows associated with the forecasted purchase of commodities.
Interest Rate Risk
We may enter into interest rate swap agreements to manage interest rate risk exposure. Our interest rate swap agreements, if any, effectively modify ourexposure to interest rate risk, primarily through converting certain of our floating rate debt to a fixed rate basis, and certain fixed rate debt to a floating rate basis.These agreements involve either the receipt or payment of floating rate amounts in exchange for fixed rate interest payments or receipts, respectively, over the lifeof the agreements without an exchange of the underlying principal amounts. We also may utilize a cross-currency interest rate swap agreement to manage ourexposure relating to certain intercompany debt denominated in one foreign currency that will be repaid in another foreign currency. At December 31, 2016 and2015 there were no outstanding swap agreements.
We may enter into treasury rate lock agreements to effectively modify our exposure to interest rate risk by locking-in interest rates on probable long-termdebt issuances.
Net Investment Hedging
We primarily use foreign currency denominated debt to hedge our investments in certain foreign subsidiaries. In the fourth quarter of 2016, we designatedapproximately €700 million of foreign currency denominated debt instruments as net investment hedges, and as of December 31, 2016 , the outstanding principalamount of foreign currency denominated debt instruments designated as net investment hedges totaled €500 million . We had no net investment hedges as ofDecember 31, 2015.
At December 31, 2016 , our foreign currency denominated debt designated as net investment hedge consisted of:
Instrument Notional (local) Notional (USD) Maturity
Senior note - 0.625% € 500 $ 527 March 2020
For instruments that are designated and qualify as a net investment hedge, the effective portion of the instruments' gain or loss is reported as a component ofOCI and recorded in accumulated other comprehensive loss. The gain or loss will be subsequently reclassified into net earnings when the hedged net investment iseither sold or substantially liquidated. The remaining change in fair value of the hedge instruments represents the ineffective portion, which is immediatelyrecognized in interest and sundry (income) expense on our consolidated statements of income. As of December 31, 2016 , there was no ineffectiveness on hedgesdesignated as net investment hedges.
51

NOTES TO THE CONSOLIDATED FINANCIAL STATEMENTS - (CONTINUED)
The following tables summarize our outstanding derivative contracts and their effects on our Consolidated Balance Sheets at December 31, 2016 and 2015 :
Fair Value of
Type ofHedge (1)
Notional Amount Hedge Assets Hedge Liabilities Maximum Term
(Months)
Millions of dollars 2016 2015 2016 2015 2016 2015 2016 2015
Derivatives accounted for as hedges Foreign exchange forwards/options $ 1,813 $ 886 $ 32 $ 31 $ 10 $ 8 (CF) 58 12Commodity swaps/options 299 322 7 1 11 66 (CF) 36 33Total derivatives accounted for as hedges $ 39 $ 32 $ 21 $ 74 Derivatives not accounted for as hedges Foreign exchange forwards/options $ 3,262 $ 2,886 $ 39 $ 22 $ 16 $ 21 N/A 35 11Commodity swaps/options 2 7 — — — 1 N/A 2 6Total derivatives not accounted for as hedges 39 22 16 22 Total derivatives $ 78 $ 54 $ 37 $ 96
Current $ 54 $ 54 $ 35 $ 79 Noncurrent 24 — 2 17 Total derivatives $ 78 $ 54 $ 37 $ 96
(1) Derivatives accounted for as hedges are considered cash flow (CF) hedges.
The increase in the notional amount of derivatives is due to increased inter-company funding activity.
The effects of derivative instruments on our Consolidated Statements of Income and Comprehensive Income for OCI for the years ended December 31,2016 and 2015 are as follows:
Gain (Loss)Recognized in OCI(Effective Portion)
Gain (Loss) Reclassified from OCI into Income
(Effective Portion) (1)
Cash Flow Hedges - Millions of dollars 2016 2015 2016 2015
Foreign exchange forwards/options $ 27 $ 77 $ 66 $ 56 (a)Commodity swaps/options 53 (102) (30) (57) (a)Interest rate derivatives — — (1) (1) (b)
Net Investment Hedges Foreign currency 28 — — —
$ 108 $ (25) $ 35 $ (2)
Gain (Loss) Recognized on Derivatives not
Accounted for as Hedges (2)
Derivatives not Accounted for as Hedges - Millions of dollars 2016 2015
Foreign exchange forwards/options $ 26 $ 29(1) Gains and losses reclassified from accumulated OCI and recognized in income are recorded in (a) cost of products sold; or (b) interest expense.(2) Mark to market gains and losses recognized in income are recorded in interest and sundry income (expense).
For cash flow hedges, the amount of ineffectiveness recognized in interest and sundry income (expense) was nominal during 2016 and 2015 . There were nohedges designated as fair value in 2016 and 2015. The net amount of unrealized gain or loss on derivative instruments included in accumulated OCI related tocontracts maturing and expected to be realized during the next twelve months is a loss of $38 million at December 31, 2016 .
52

NOTES TO THE CONSOLIDATED FINANCIAL STATEMENTS - (CONTINUED)
( 8 ) STOCKHOLDERS’ EQUITY
Comprehensive Income
Comprehensive income primarily includes (1) our reported net earnings, (2) foreign currency translation, (3) changes in the effective portion of our openderivative contracts designated as cash flow hedges, (4) changes in our unrecognized pension and other postretirement benefits and (5) changes in fair value of ouravailable for sale marketable securities.
The following table shows the components of accumulated other comprehensive income (loss) available to Whirlpool at December 31, 2014 , 2015 , and2016 , and the activity for the years then ended:
Millions of dollars Foreign
Currency Derivative
Instruments
Pension andPostretirement
Liability MarketableSecurities Total
December 31, 2013 $ (532) $ (6) $ (770) $ 10 $ (1,298)Unrealized gain (loss) (392) (1) — — (393)Unrealized actuarial gain(loss) and prior service credit (cost) — — (233) — (233)Tax effect (5) — 85 — 80Other comprehensive income (loss), net of tax (397) (1) (148) — (546)
Less: Other comprehensive loss available to noncontrolling interests (4) — — — (4)Other comprehensive income (loss) available to Whirlpool (393) (1) (148) — (542)
December 31, 2014 $ (925) $ (7) $ (918) $ 10 $ (1,840)Unrealized gain (loss) (432) (23) — 3 (452)Unrealized actuarial gain (loss) and prior service credit (cost) — — (79) — (79)Tax effect — — 30 — 30Other comprehensive income (loss), net of tax (432) (23) (49) 3 (501)
Less: Other comprehensive loss available to noncontrolling interests (9) — — — (9)Other comprehensive income (loss) available to Whirlpool (423) (23) (49) 3 (492)
December 31, 2015 $ (1,348) $ (30) $ (967) $ 13 $ (2,332)Unrealized gain (loss) (30) 71 — (2) 39Unrealized actuarial gain (loss) and prior service credit (cost) — — (70) — (70)Tax effect (17) (26) 6 — (37)Other comprehensive income (loss), net of tax (47) 45 (64) (2) (68)
Less: Other comprehensive loss available to noncontrolling interests — — — — —Other comprehensive income (loss) available to Whirlpool $ (47) $ 45 $ (64) $ (2) $ (68)
December 31, 2016 $ (1,395) $ 15 $ (1,031) $ 11 $ (2,400)
Net Earnings per Share
Diluted net earnings per share of common stock include the dilutive effect of stock options and other share-based compensation plans. Basic and diluted netearnings per share of common stock were calculated as follows:
Millions of dollars and shares 2016 2015 2014
Numerator for basic and diluted earnings per share – net earnings available to Whirlpool $ 888 $ 783 $ 650
Denominator for basic earnings per share – weighted-average shares 76.1 78.7 78.3Effect of dilutive securities – stock-based compensation 1.1 1.0 1.3
Denominator for diluted earnings per share – adjusted weighted-average shares 77.2 79.7 79.6
Anti-dilutive stock options/awards excluded from earnings per share 0.3 0.2 0.2
53

NOTES TO THE CONSOLIDATED FINANCIAL STATEMENTS - (CONTINUED)
Dividends
Dividends per share paid to shareholders were $3.90 , $3.45 and $2.88 during 2016 , 2015 and 2014 , respectively.
Repurchase Program
On April 14, 2014 , our Board of Directors authorized a share repurchase program of up to $500 million . During the first quarter of 2016, we repurchased1,507,100 shares at an aggregate purchase price of approximately $225 million under this program. As of March 31, 2016, there were no remaining fundsauthorized under this program.
On April 18, 2016 , our Board of Directors authorized a new share repurchase program of up to $1 billion . For the year ended December 31, 2016 , werepurchased 1,749,600 shares at an aggregate purchase price of approximately $300 million under this program. At December 31, 2016 , there were approximately$700 million in remaining funds authorized under this program.
Share repurchases are made from time to time on the open market as conditions warrant. The program does not obligate us to repurchase any of our shares.
( 9 ) SHARE-BASED INCENTIVE PLANS
We sponsor several share-based employee incentive plans. Share-based compensation expense for grants awarded under these plans was $39 million , $52million and $47 million in 2016 , 2015 , and 2014 , respectively. Related income tax benefits recognized in earnings were $14 million , $18 million and $16 millionin 2016 , 2015 , and 2014 , respectively.
At December 31, 2016 , unrecognized compensation cost related to non-vested stock option and stock unit awards totaled $49 million . The cost of thesenon-vested awards is expected to be recognized over a weighted-average remaining vesting period of 27 months.
Share-Based Employee Incentive Plans
On April 16, 2013, our stockholders approved the Amended and Restated 2010 Omnibus Stock and Incentive Plan (“2010 OSIP”). This plan was previouslyadopted by our Board of Directors on February 19, 2013 and provides for the issuance of stock options, performance stock units, performance shares, restrictedstock and restricted stock units. No new awards may be granted under the 2010 OSIP after the tenth anniversary of the date that the stockholders approved the plan.However, the term and exercise of awards granted before then may extend beyond that date. At December 31, 2016 , approximately 5.8 million shares remainavailable for issuance under the 2010 OSIP.
Stock Options
Eligible employees may receive stock options as a portion of their total compensation. Such options generally become exercisable over a 3 -year period,expire 10 years from the date of grant and are subject to forfeiture upon termination of employment, other than by death, disability or retirement. We use the Black-Scholes option-pricing model to measure the fair value of stock options granted to employees. Granted options have exercise prices equal to the market price ofWhirlpool common stock on the grant date. The principal assumptions used in valuing options include: (1) risk-free interest rate—an estimate based on the yield ofUnited States zero coupon securities with a maturity equal to the expected life of the option; (2) expected volatility—an estimate based on the historical volatilityof Whirlpool common stock for a period equal to the expected life of the option; and (3) expected option life—an estimate based on historical experience. Stockoptions are expensed on a straight-line basis, net of estimated forfeitures. Based on the results of the model, the weighted-average grant date fair value of stockoptions granted for 2016 , 2015 , and 2014 were $31.21 , $63.40 and $42.09 , respectively, using the following assumptions:
Weighted Average Black-Scholes Assumptions 2016 2015 2014
Risk-free interest rate 1.2% 1.5% 1.5%Expected volatility 33.5% 35.5% 38.2%Expected dividend yield 2.8% 1.4% 1.8%Expected option life, in years 5 5 5
54

NOTES TO THE CONSOLIDATED FINANCIAL STATEMENTS - (CONTINUED)
Stock Option Activity
The following table summarizes stock option activity during 2016 :
In thousands, except per share data Number
of Options
Weighted- Average
Exercise Price
Outstanding at January 1 1,938 $ 105.46Granted 561 132.66Exercised (249) 103.11Canceled or expired (35) 144.40Outstanding at December 31 2,215 $ 112.00Exercisable at December 31 1,401 $ 90.30
The total intrinsic value of stock options exercised was $20 million , $48 million , and $36 million for 2016 , 2015 , and 2014 , respectively. The related taxbenefits were $7 million , $18 million and $13 million for 2016 , 2015 , and 2014 , respectively. Cash received from the exercise of stock options was $26 million ,$38 million , and $38 million for 2016 , 2015 , and 2014 , respectively.
The table below summarizes additional information related to stock options outstanding at December 31, 2016 :
Options in thousands / dollars in millions, except share data Outstanding Net of
Expected Forfeitures Options
Exercisable
Number of options 2,116 1,401Weighted-average exercise price per share $ 111.93 $ 90.30Aggregate intrinsic value $ 156 $ 131Weighted-average remaining contractual term, in years 6 5
Stock Units
Eligible employees may receive restricted stock units or performance stock units as a portion of their total compensation.
Restricted stock units are typically granted to selected management employees on an annual basis and vest over three years. Periodically, restricted stockunits may be granted to selected executives based on special recognition or retention circumstances and generally vest from three years to seven years. Somepreviously granted awards accrue dividend equivalents on outstanding units (in the form of additional stock units) based on dividends declared on Whirlpoolcommon stock. These awards convert to unrestricted common stock at the conclusion of the vesting period.
Performance stock units are granted to executives on an annual basis and generally vest over a three year period, converting to unrestricted common stock atthe conclusion of the vesting period. The final award may equal 0% to 200% of a target based on pre-established Whirlpool financial performance measures.
We measure compensation cost for stock units based on the closing market price of Whirlpool common stock at the grant date, with adjustments forperformance stock units to reflect the final award granted. The weighted average grant date fair values of awards granted during 2016 , 2015 , and 2014 were$127.88 , $155.37 and $133.31 , respectively. The total fair value of stock units vested during 2016 , 2015 , and 2014 was $33 million , $41 million and $25 million, respectively.
The following table summarizes stock unit activity during 2016 :
Stock units in thousands, except per-share data Number ofStock Units
Weighted- AverageGrant Date Fair
Value
Non-vested, at January 1 833 $ 125.71Granted 314 127.88Canceled (20) 151.50Vested and transferred to unrestricted (312) 106.41Non-vested, at December 31 815 $ 134.21
55

NOTES TO THE CONSOLIDATED FINANCIAL STATEMENTS - (CONTINUED)
Nonemployee Director Equity Awards
In 2016, each nonemployee director received an annual grant of Whirlpool common stock, with the number of shares to be issued to the director determinedby dividing $125,000 by the closing price of Whirlpool common stock on the date of the annual meeting of our stockholders. Nonemployee directors receive a one-time grant of 1,000 shares of Whirlpool common stock made at the time they first join the Board.
( 10 ) RESTRUCTURING CHARGES
We periodically take action to improve operating efficiencies, typically in connection with business acquisitions or changes in the economicenvironment. Our footprint and headcount reductions and organizational integration actions relate to discrete, unique restructuring events, primarily reflected in thefollowing plans.
During 2014 and 2015, we announced the following restructuring plans: (a) the closure of a microwave oven manufacturing facility and other organizationalefficiency actions in EMEA and Latin America, (b) organizational integration activities in China and Europe to support the integration of Whirlpool China andIndesit, and (c) the closure of a research and development facility in Germany in 2016. All of these actions were substantially completed in 2016.
In the second quarter of 2015, we committed to a restructuring plan to integrate our Italian legacy operations with those of Indesit. The industrialrestructuring plan, which was approved by the relevant labor unions in July 2015 and signed by the Italian government in August 2015, provides for the closure orrepurposing of certain manufacturing facilities and headcount reductions at other facilities. In addition, the restructuring plan provides for headcount reductions inthe salaried employee workforce. We estimate that we will incur up to €179 million (approximately $189 million as of December 31, 2016 ) in employee-relatedcosts, €25 million (approximately $26 million as of December 31, 2016 ) in asset impairment costs, and €37 million (approximately $39 million as ofDecember 31, 2016 ) in other associated costs in connection with these actions. These actions will be substantially complete in 2018. We estimate €209 million(approximately $220 million as of December 31, 2016 ) of the estimated €241 million total cost will result in future cash expenditures.
On January 24, 2017 the Company and certain subsidiary companies began consultations with certain works councils and other regulatory agencies inconnection with the Company’s proposal to restructure its EMEA dryer manufacturing operations. Company management authorized the initiation of suchconsultations on December 30, 2016. These actions are expected to result in changing the operations at the Yate, U.K. facility to focus on manufacturing for U.K.consumer needs only; ending production in 2018 in Amiens, France; and concentrating the production of dryers for non-UK consumer needs in Lodz, Poland. TheCompany currently anticipates that approximately 500 positions would be impacted by these actions. The Company would expect these actions to be substantiallycomplete in 2018. The Company estimates that it will incur up to approximately $65 million in employee-related costs, approximately $12 million in assetimpairment costs, and approximately $11 million in other associated costs in connection with these actions. The Company estimates that approximately $76million of the estimated $88 million total cost will result in future cash expenditures. The actions outlined above resulted in a 2016 charge of $20 million which fellwithin the reported charges for 2016.
The following tables summarize the changes to our restructuring liability for the years ended December 31, 2016 and 2015 :
Millions of dollars 12/31/2015Charges toEarnings Cash Paid
Non-Cash andOther
Revision ofEstimate 12/31/2016
Employee termination costs $ 30 $ 133 $ (90) $ (2) $ — $ 71Asset impairment costs — 17 (1) (16) — —Facility exit costs 3 15 (16) — — 2Other exit costs 18 8 (12) — — 14
Total $ 51 $ 173 $ (119) $ (18) $ — $ 87
Millions of dollars 12/31/2014Charge toEarnings Cash Paid
Non-cash andOther
Revision ofEstimate 12/31/2015
Employee termination costs $ 58 $ 136 $ (168) $ 1 $ 3 $ 30Asset impairment costs — 30 — (30) — —Facility exit costs 4 12 (13) — — 3Other exit costs 16 23 (21) — — 18
Total $ 78 $ 201 $ (202) $ (29) $ 3 $ 51
56

NOTES TO THE CONSOLIDATED FINANCIAL STATEMENTS - (CONTINUED)
The following table summarizes 2016 restructuring charges by operating segment:
Millions of dollars 2016 Charges
North America $ 14EMEA 146Latin America 9Asia 3Corporate / Other 1
Total $ 173
( 11 ) INCOME TAXES
Income tax expense was $186 million , $209 million , and $189 million in 2016 , 2015 and 2014 , respectively. The following table summarizes thedifference between income tax expense at the United States statutory rate of 35% and the income tax expense at effective worldwide tax rates for the respectiveperiods:
Millions of dollars 2016 2015 2014
Earnings before income taxes United States $ 605 $ 555 $ 325Foreign 509 476 556
Earnings before income taxes 1,114 1,031 881 Income tax computed at United States statutory rate 390 361 308
U.S. government tax incentives (9) (13) (10)Foreign government tax incentives, including BEFIEX (11) (19) (46)Foreign tax rate differential (50) (36) (17)U.S. foreign tax credits (86) (103) (148)Valuation allowances (121) (95) 9State and local taxes, net of federal tax benefit 20 18 5Foreign withholding taxes 36 16 16U.S. tax on foreign dividends and subpart F income 63 57 56Settlement of global tax audits (40) 16 (5)Changes in enacted tax rates 32 — —Other items, net (38) 7 21
Income tax computed at effective worldwide tax rates $ 186 $ 209 $ 189
Current and Deferred Tax Provision
The following table summarizes our income tax (benefit) provision for 2016 , 2015 and 2014 :
2016 2015 2014
Millions of dollars Current Deferred Current Deferred Current Deferred
United States $ 34 $ 120 $ 98 $ 55 $ 7 $ 8Foreign 167 (154) 181 (143) 182 12State and local 7 12 10 8 (2) (18) $ 208 $ (22) $ 289 $ (80) $ 187 $ 2Total income tax expense $ 186 $ 209 $ 189
United States Government Tax Incentives
On December 18, 2015, the Protecting Americans from Tax Hikes Act of 2015 (the "Act") was signed into law. The Act makes permanent certain provisionsincluding the Research and Development Credit. The Act extends through 2019 certain provisions including Bonus Depreciation and exempts certain types ofincome payments between related controlled foreign corporations.
57

NOTES TO THE CONSOLIDATED FINANCIAL STATEMENTS - (CONTINUED)
United States Tax on Foreign Dividends
We have historically reinvested all unremitted earnings of our foreign subsidiaries and affiliates. We plan to distribute approximately $5 million of foreignearnings over the next several years. This distribution is forecasted to result in tax benefits which have not been recorded because of their contingent nature. Therehas been no deferred tax liability provided on the remaining amount of unremitted earnings of $4.6 billion at December 31, 2016 . The Company had cash andcash equivalents of approximately $1.1 billion at December 31, 2016 , of which approximately $1.0 billion was held by subsidiaries in foreign countries. Our intentis to permanently reinvest these funds outside of the United States and our current plans do not demonstrate a need to repatriate these funds to fund our U.S.operations. However, if these funds were repatriated, then we would be required to accrue and pay applicable United States taxes (subject to an adjustment forforeign tax credits) and withholding taxes payable to various countries. The repatriation could result in an adjustment to the tax liability after considering availableforeign tax credits and other tax attributes. It is not practicable to estimate the amount of the deferred tax liability associated with these unremitted earnings due tothe complexity of its hypothetical calculation.
Valuation Allowances
At December 31, 2016 , we had net operating loss carryforwards of $3.5 billion , $1.0 billion of which were United States State net operating losscarryforwards. Of the total net operating loss carryforwards, $2.2 billion do not expire, with substantially all of the remaining carryforwards expiring in variousyears through 2036. As of December 31, 2016 , we had $310 million of foreign tax credit carryforwards and $964 million of United States general business creditcarryforwards available to offset future payments of federal income taxes, expiring between 2017 and 2036.
We routinely review the future realization of deferred tax assets based on projected future reversal of taxable temporary differences, available tax planningstrategies and projected future taxable income. We have recorded a valuation allowance to reflect the net estimated amount of certain deferred tax assets associatedwith net operating loss and other deferred tax assets we believe will be realized. Our recorded valuation allowance of $150 million at December 31, 2016 consistsof $128 million of net operating loss carryforward deferred tax assets and $22 million of other deferred tax assets. Our recorded valuation allowance was $286million at December 31, 2015 and consisted of $239 million of net operating loss carryforward deferred tax assets and $47 million of other deferred tax assets.The reduction in our valuation allowance includes $121 million recognized in net earnings which consist of $163 million of valuation allowance releases and $42million of additional valuation allowances. The remaining change relates to reclassification within our net deferred tax asset. We believe that it is more likely thannot that we will realize the benefit of existing deferred tax assets, net of valuation allowances mentioned above.
Settlement of Global Tax Audits
We are in various stages of audits by certain governmental tax authorities. We establish liabilities for the difference between tax return provisions and thebenefits recognized in our financial statements. Such amounts represent a reasonable provision for taxes ultimately expected to be paid, and may need to beadjusted over time as more information becomes known. We are no longer subject to any significant United States federal tax examinations for the years before2008, or any state, local or foreign income tax examinations by tax authorities for years before 2004.
58

NOTES TO THE CONSOLIDATED FINANCIAL STATEMENTS - (CONTINUED)
Deferred Tax Liabilities and Assets
Deferred income taxes reflect the net tax effects of temporary differences between the carrying amounts of assets and liabilities used for financial reportingpurposes and the amounts used for income tax purposes. The following table summarizes the significant components of our deferred tax liabilities and assets atDecember 31, 2016 and 2015 :
Millions of dollars 2016 2015
Deferred tax liabilities Intangibles $ 765 $ 770Property, net 199 175LIFO inventory 59 57Other 156 214
Total deferred tax liabilities 1,179 1,216Deferred tax assets U.S. general business credit carryforwards, including Energy Tax Credits 964 1,010Pensions 322 315Loss carryforwards 668 683Postretirement obligations 144 168Foreign tax credit carryforwards 310 253Research and development capitalization 273 306Employee payroll and benefits 111 164Accrued expenses 106 133Product warranty accrual 64 64Receivable and inventory allowances 59 106Other 344 353
Total deferred tax assets 3,365 3,555Valuation allowances for deferred tax assets (150) (286)
Deferred tax assets, net of valuation allowances 3,215 3,269Net deferred tax assets $ 2,036 $ 2,053
Unrecognized Tax Benefits
The following table represents a reconciliation of the beginning and ending amount of unrecognized tax benefits that if recognized would impact theeffective tax rate, excluding federal benefits of state and local tax positions, and interest and penalties:
Millions of dollars 2016 2015 2014
Balance, January 1 $ 143 $ 141 $ 113Additions for tax positions of the current year 14 12 17Additions for tax positions of prior years 1 27 4Reductions for tax positions of prior years (33) (25) (23)Settlements during the period (20) (5) (11)Positions assumed in acquisitions — — 42Lapses of applicable statute of limitation (3) (7) (1)Balance, December 31 $ 102 $ 143 $ 141
In connection with our acquisitions of Hefei Sanyo and Indesit in 2014, the Company assumed $72 million of uncertain tax position liabilities, including $31million of interest and penalties. The acquisition of Hefei Sanyo resulted in an assumed uncertain tax position of $62 million that was reflected in the openingbalance sheet, while the acquisition of Indesit resulted in an assumed uncertain tax position of $10 million .
Interest and penalties associated with unrecognized tax benefits resulted in a net benefit of $19 million as of December 31, 2016 , a net expense of $5million in 2015 , and a net benefit of $6 million in 2014 . We have accrued a total of $42 million at December 31, 2016 and $63 million at December 31, 2015 and2014 , respectively.
It is reasonably possible that certain unrecognized tax benefits of $21 million could be settled with various related jurisdictions during the next 12 months.

59

NOTES TO THE CONSOLIDATED FINANCIAL STATEMENTS - (CONTINUED)
( 12 ) PENSION AND OTHER POSTRETIREMENT BENEFIT PLANS
We have funded and unfunded defined benefit pension plans that cover certain employees in North America, Europe, Asia and Brazil. For the United Statesplan, which comprises the majority of our obligation, the plans are frozen for the majority of participants. The formula for United States salaried employeescovered under the qualified defined benefit plan was based on years of service and final average salary, while the formula for United States hourly employeescovered under the defined benefit plans was based on specific dollar amounts for each year of service. There were multiple formulas for employees covered underthe qualified and nonqualified defined benefit plans sponsored by Maytag, including a cash balance formula. In addition, we sponsor an unfunded SupplementalExecutive Retirement Plan. This plan is nonqualified and provides certain key employees defined pension benefits that supplement those provided by theCompany’s other retirement plans.
A defined contribution plan is being provided to all United States employees subsequent to the pension plan freezes and is not classified within the netperiodic benefit cost. The company provides annual match and automatic company contributions, in cash or company stock, of up to 7% of employees’ eligiblepay. Our contributions during 2016 , 2015 and 2014 were $77 million , $76 million and $71 million , respectively.
We provide postretirement health care benefits for eligible retired employees in the United States, Canada and Brazil. For our United States plan, whichcomprises the majority of our obligation, eligible retirees include those who were full-time employees with 10 years of service who attained age 55 while in servicewith us and those union retirees who met the eligibility requirements of their collective bargaining agreements. In general, the postretirement health and welfarebenefit plans include cost-sharing provisions that limit our exposure for recent and future retirees and are contributory, with participants’ contributions adjustedannually. The plans are unfunded. We reserve the right to modify these benefits in the future.
During the second quarter 2011, we modified retiree medical benefits for certain retirees to be consistent with those benefits provided by the WhirlpoolCorporation Group Benefit Plan. We accounted for these changes as a plan amendment in 2011, resulting in a reduction in the postretirement benefit obligation of$138 million of which approximately $104 million of benefit has been recognized in net earnings since 2011, with an offset to accumulated other comprehensiveloss, net of tax. In response, a group of retirees initiated legal proceedings against Whirlpool asserting the above benefits are vested and changes to the plan are notpermitted. We disagree with plaintiffs' assertion and are continuing to vigorously defend our position, including through any necessary appeal process. However,an unfavorable ruling in any particular reporting period could require us to immediately reverse the benefit we have recognized to that point, and remeasure theassociated postretirement benefit obligation, the impact of which will depend on timing and the actuarial assumptions then in effect.
Defined Benefit - Pensions and Postretirement Benefit Plans
Obligations and Funded Status at End of Year
United States
Pension Benefits Foreign
Pension Benefits Other Postretirement
Benefits
Millions of dollars 2016 2015 2016 2015 2016 2015
Funded status Fair value of plan assets $ 2,664 $ 2,741 $ 510 $ 552 $ — $ —Benefit obligations 3,415 3,470 855 865 376 441Funded status $ (751) $ (729) $ (345) $ (313) $ (376) $ (441)Amounts recognized in the consolidated balance sheet Noncurrent asset $ — $ — $ 2 $ 5 $ — $ —Current liability (14) (10) (10) (12) (42) (51)Noncurrent liability (737) (719) (337) (306) (334) (390)Amount recognized $ (751) $ (729) $ (345) $ (313) $ (376) $ (441)Amounts recognized in accumulated other comprehensive loss (pre-tax) Net actuarial loss $ 1,426 $ 1,404 $ 176 $ 99 $ 3 $ 20Prior service (credit) cost (7) (11) (3) (3) (40) (25)Amount recognized $ 1,419 $ 1,393 $ 173 $ 96 $ (37) $ (5)
60

NOTES TO THE CONSOLIDATED FINANCIAL STATEMENTS - (CONTINUED)
Change in Benefit Obligation
United States
Pension Benefits Foreign
Pension Benefits Other Postretirement
Benefits
Millions of dollars 2016 2015 2016 2015 2016 2015
Benefit obligation, beginning of year $ 3,470 $ 3,796 $ 865 $ 1,026 $ 441 $ 502Service cost 3 3 5 5 7 2Interest cost 147 150 27 31 18 19Plan participants’ contributions — — 1 1 6 7Actuarial loss (gain) 92 (164) 105 (11) (16) (32)Benefits paid (286) (315) (31) (31) (54) (55)Plan amendments — — — (3) (30) 8Settlements / curtailment (gain) (11) — (16) (66) — —Foreign currency exchange rates — — (101) (87) 4 (10)
Benefit obligation, end of year $ 3,415 $ 3,470 $ 855 $ 865 $ 376 $ 441
Accumulated benefit obligation, end of year $ 3,406 $ 3,459 $ 816 $ 806 N/A N/A
Change in Plan Assets
United States Pension Benefits Foreign
Pension Benefits Other Postretirement
Benefits
Millions of dollars 2016 2015 2016 2015 2016 2015
Fair value of plan assets, beginning of year $ 2,741 $ 3,042 $ 552 $ 640 $ — $ —Actual return on plan assets 206 (62) 47 16 — —Employer contribution 14 76 30 39 48 48Plan participants’ contributions — — 1 1 6 7Benefits paid (286) (315) (31) (31) (54) (55)Other Adjustments — — — 4 — —Settlements (11) — (14) (73) — —Foreign currency exchange rates — — (75) (44) — —Fair value of plan assets, end of year $ 2,664 $ 2,741 $ 510 $ 552 $ — $ —
Components of Net Periodic Benefit Cost
United States
Pension Benefits Foreign
Pension Benefits Other Postretirement
Benefits
Millions of dollars 2016 2015 2014 2016 2015 2014 2016 2015 2014
Service cost $ 3 $ 3 $ 2 $ 5 $ 5 $ 5 $ 7 $ 2 $ 3Interest cost 147 150 167 27 31 22 18 19 24Expected return on plan assets (186) (191) (193) (30) (33) (16) — — —Amortization:
Actuarial loss 46 53 43 4 5 5 — — —Prior service cost (credit) (3) (3) (3) — — 1 (15) (23) (36)
Curtailment gain 4 — — (1) — — — (63) —Settlement loss — — — 3 12 4 — — —Net periodic benefit cost $ 11 $ 12 $ 16 $ 8 $ 20 $ 21 $ 10 $ (65) $ (9)
During the first quarter of 2015, we recognized approximately $47 million from a curtailment gain due to the elimination of amounts credited to notionalretiree health accounts for certain employees under age 50. The curtailment gain was recognized in our Consolidated Condensed Statement of ComprehensiveIncome with $43 million recorded in cost of products sold and the remaining balance in selling, general and administrative, with an offset to accumulated othercomprehensive loss, net of tax.
During the third quarter of 2015, we recognized approximately $16 million from a curtailment gain due to the elimination of retiree medical eligibility forcertain employees under age 50. The curtailment gain was recognized in our Consolidated Condensed Statement of Comprehensive Income with $15 millionrecorded in cost of products sold and the remaining balance in selling, general and administrative, with an offset to accumulated other comprehensive loss, net of

tax.
61

NOTES TO THE CONSOLIDATED FINANCIAL STATEMENTS - (CONTINUED)
Other Changes in Plan Assets and Benefit Obligations Recognized in Other Comprehensive Loss (Pre-Tax) in 2016
Millions of dollars United States
Pension Benefits Foreign
Pension Benefits Other Postretirement
Benefits
Current year actuarial loss $ 73 $ 83 $ (17)Actuarial (loss) recognized during the year (51) (6) —Current year prior service cost (credit) — — (30)Prior service credit (cost) recognized during the year 3 — 15Total recognized in other comprehensive loss (pre-tax) $ 25 $ 77 $ (32)Total recognized in net periodic benefit costs and other comprehensiveloss (pre-tax) $ 36 $ 85 $ (22)
Estimated Pre-Tax Amounts that will be amortized from Accumulated Other Comprehensive Loss into Net Periodic Pension Cost in 2017
Millions of dollars United States
Pension Benefits Foreign
Pension Benefits Other Postretirement
Benefits
Actuarial loss $ 50 $ 7 $ —Prior service (credit) (3) — (15)Total $ 47 $ 7 $ (15)
Additionally, we amortize prior service credits over a period of up to 28 years.
Assumptions
Weighted-Average Assumptions used to Determine Benefit Obligation at End of Year
United States
Pension Benefits Foreign
Pension Benefits Other Postretirement
Benefits
2016 2015 2016 2015 2016 2015
Discount rate 4.15% 4.45% 2.64% 3.40% 4.42% 4.51%Rate of compensation increase 4.50% 4.50% 3.08% 3.06% N/A N/A
Weighted-Average Assumptions used to Determine Net Periodic Cost
United States
Pension Benefits Foreign
Pension Benefits Other Postretirement
Benefits
2016 2015 2014 2016 2015 2014 2016 2015 2014
Discount rate 4.45% 4.05% 4.95% 3.40% 3.32% 3.89% 4.88% 4.74% 5.25%Expected long-term rate of return on plan assets 7.00% 7.00% 7.25% 5.81% 5.63% 5.44% N/A N/A N/ARate of compensation increase 4.50% 4.50% 4.50% 3.06% 3.23% 3.35% N/A N/A N/AHealth care cost trend rate
Initial rate N/A N/A N/A N/A N/A N/A 7.00% 7.00% 7.00%Ultimate rate N/A N/A N/A N/A N/A N/A 5.00% 5.00% 5.00%Year that ultimate rate will be reached N/A N/A N/A N/A N/A N/A 2019 2019 2017
Discount Rate
For our United States pension and postretirement benefit plans, the discount rate was selected using a hypothetical portfolio of high quality bondsoutstanding at December 31 that would provide the necessary cash flows to match our projected benefit payments. For our foreign pension and postretirementbenefit plans, the discount rate was primarily selected using high quality bond yields for the respective country or region covered by the plan.
62
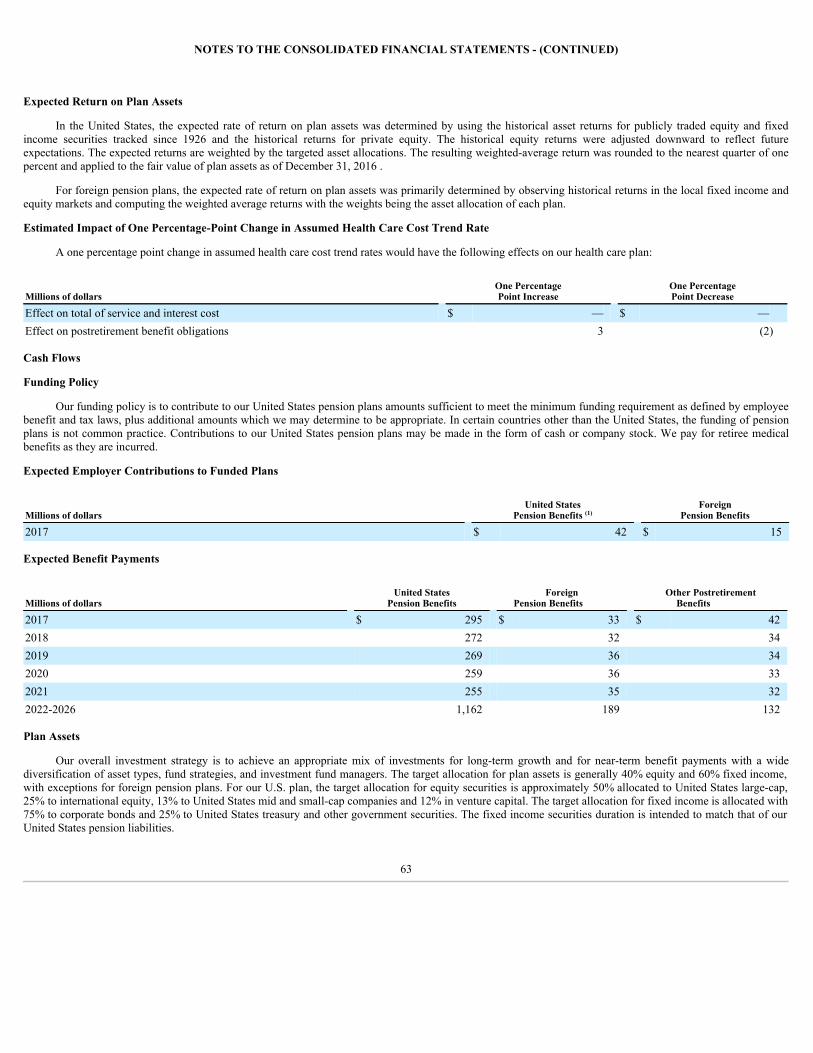
NOTES TO THE CONSOLIDATED FINANCIAL STATEMENTS - (CONTINUED)
Expected Return on Plan Assets
In the United States, the expected rate of return on plan assets was determined by using the historical asset returns for publicly traded equity and fixedincome securities tracked since 1926 and the historical returns for private equity. The historical equity returns were adjusted downward to reflect futureexpectations. The expected returns are weighted by the targeted asset allocations. The resulting weighted-average return was rounded to the nearest quarter of onepercent and applied to the fair value of plan assets as of December 31, 2016 .
For foreign pension plans, the expected rate of return on plan assets was primarily determined by observing historical returns in the local fixed income andequity markets and computing the weighted average returns with the weights being the asset allocation of each plan.
Estimated Impact of One Percentage-Point Change in Assumed Health Care Cost Trend Rate
A one percentage point change in assumed health care cost trend rates would have the following effects on our health care plan:
Millions of dollars One PercentagePoint Increase
One PercentagePoint Decrease
Effect on total of service and interest cost $ — $ —Effect on postretirement benefit obligations 3 (2)
Cash Flows
Funding Policy
Our funding policy is to contribute to our United States pension plans amounts sufficient to meet the minimum funding requirement as defined by employeebenefit and tax laws, plus additional amounts which we may determine to be appropriate. In certain countries other than the United States, the funding of pensionplans is not common practice. Contributions to our United States pension plans may be made in the form of cash or company stock. We pay for retiree medicalbenefits as they are incurred.
Expected Employer Contributions to Funded Plans
Millions of dollars United States
Pension Benefits (1) Foreign
Pension Benefits
2017 $ 42 $ 15
Expected Benefit Payments
Millions of dollars United States
Pension Benefits Foreign
Pension Benefits Other Postretirement
Benefits
2017 $ 295 $ 33 $ 422018 272 32 342019 269 36 342020 259 36 332021 255 35 322022-2026 1,162 189 132
Plan Assets
Our overall investment strategy is to achieve an appropriate mix of investments for long-term growth and for near-term benefit payments with a widediversification of asset types, fund strategies, and investment fund managers. The target allocation for plan assets is generally 40% equity and 60% fixed income,with exceptions for foreign pension plans. For our U.S. plan, the target allocation for equity securities is approximately 50% allocated to United States large-cap,25% to international equity, 13% to United States mid and small-cap companies and 12% in venture capital. The target allocation for fixed income is allocated with75% to corporate bonds and 25% to United States treasury and other government securities. The fixed income securities duration is intended to match that of ourUnited States pension liabilities.
63

NOTES TO THE CONSOLIDATED FINANCIAL STATEMENTS - (CONTINUED)
Plan assets are reported at fair value based on an exit price, representing the amount that would be received to sell an asset in an orderly transaction betweenmarket participants. As such, fair value is a market-based measurement that should be determined based on assumptions that market participants would use inpricing an asset. As a basis for considering such assumptions, a three-tiered fair value hierarchy is established, which prioritizes the inputs used in measuring fairvalue as follows: (Level 1) observable inputs such as quoted prices in active markets; (Level 2) inputs, other than the quoted prices in active markets that areobservable, either directly or indirectly; and (Level 3) unobservable inputs in which there is little or no market data, which require the reporting entity to develop itsown assumptions. We manage the process and approve the results of a third party pricing service to value the majority of our securities and to determine theappropriate level in the fair value hierarchy.
The fair values of our pension plan assets at December 31, 2016 and 2015 , by asset category were as follows:
December 31,
Quoted prices
(Level 1)
Other significantobservable inputs
(Level 2)
Significantunobservable inputs
(Level 3) Net Asset Value Total
Millions of dollars 2016 2015 2016 2015 2016 2015 2016 2015 2016 2015
Cash and cash equivalents $ 47 $ 26 $ — $ — $ — $ — $ — $ — $ 47 $ 26
Government and government agencysecurities (a)
U.S. securities — — 455 494 — — — — 455 494International securities — — 163 212 — — — — 163 212
Corporate bonds and notes (a)
U.S. companies — — 892 909 — — — — 892 909International companies — — 190 160 — — — — 190 160
Equity securities (b)
U.S. companies 14 13 — — — — — — 14 13International companies 454 472 — — — — — — 454 472
Mutual funds (c) 64 59 — — — — — — 64 59
Common and collective funds (d)
U.S. equity securities — — — — — — 650 648 650 648International equity securities — — — — — — 56 65 56 65Short-term investment fund — — — — — — 30 55 30 55
Limited partnerships (e)
U.S. private equity investments — — — — 104 120 — — 104 120Diversified fund of funds — — — — 14 21 — — 14 21Emerging growth — — — — 14 15 — — 14 15
Real estate (f) — — — — — — 10 10 10 10
All other investments — — 17 14 — — — — 17 14
$ 579 $ 570 $ 1,717 $ 1,789 $ 132 $ 156 $ 746 $ 778 $ 3,174 $ 3,293
(a) Valued using pricing vendors who use proprietary models to estimate the price a dealer would pay to buy a security using significant observable inputs, such as interest rates, yieldcurves, and credit risk.
(b) Valued using the closing stock price on a national securities exchange, which reflects the last reported sales price on the last business day of the year.(c) Valued using the net asset value (NAV) of the fund, which is based on the fair value of underlying securities. The fund primarily invests in a diversified portfolio of equity securities
issued by non-U.S. companies.(d) Valued using the NAV of the fund, which is based on the fair value of underlying securities.(e) Valued at estimated fair value based on the proportionate share of the limited partnership's fair value, as determined by the general partner.(f) Valued using the NAV of the fund, which is based on the fair value of underlying assets.
64

NOTES TO THE CONSOLIDATED FINANCIAL STATEMENTS - (CONTINUED)
Fair Value Measurements Using Significant Unobservable Inputs (Level 3)
Millions of dollars Limited
Partnerships
Balance, December 31, 2015 $ 156Realized gains (net) 16Unrealized gains (net) (9)Purchases 2Settlements (33)
Balance, December 31, 2016 $ 132
Additional Information
The projected benefit obligation and fair value of plan assets for pension plans with a projected benefit obligation in excess of plan assets at December 31,2016 and 2015 were as follows:
United States
Pension Benefits Foreign
Pension Benefits
Millions of dollars 2016 2015 2016 2015
Projected benefit obligation $ 3,415 $ 3,470 $ 759 $ 776Fair value of plan assets 2,664 2,741 421 469
The projected benefit obligation, accumulated benefit obligation and fair value of plan assets for pension plans with an accumulated benefit obligation inexcess of plan assets at December 31, 2016 and 2015 were as follows:
United States
Pension Benefits Foreign
Pension Benefits
Millions of dollars 2016 2015 2016 2015
Projected benefit obligation $ 3,415 $ 3,470 $ 720 $ 730Accumulated benefit obligation 3,406 3,459 699 690Fair value of plan assets 2,664 2,741 383 424
( 13 ) OPERATING SEGMENT INFORMATION
Operating segments are defined as components of an enterprise about which separate financial information is available that is evaluated on a regular basis bythe chief operating decision maker, or decision making group, in deciding how to allocate resources to an individual segment and in assessing performance.
We identify such segments based upon geographical regions of operations because each operating segment manufactures home appliances and relatedcomponents, but serves strategically different markets. The chief operating decision maker evaluates performance based upon each segment’s operating income,which is defined as income before interest and sundry (income) expense, interest expense, income taxes, noncontrolling interests, intangible asset impairment andrestructuring costs. Total assets by segment are those assets directly associated with the respective operating activities. The “Other/Eliminations” column primarilyincludes corporate expenses, assets and eliminations, as well as restructuring costs and intangible asset impairments, if any. Intersegment sales are eliminatedwithin each region except compressor sales out of Latin America, which are included in Other/Eliminations.
We conduct business in three countries - the United States, Brazil, and China - which individually comprised at least 10% of consolidated net sales or long-lived assets within the country in the last three years. The following table summarizes net sales and long-lived assets by geographic area:
65
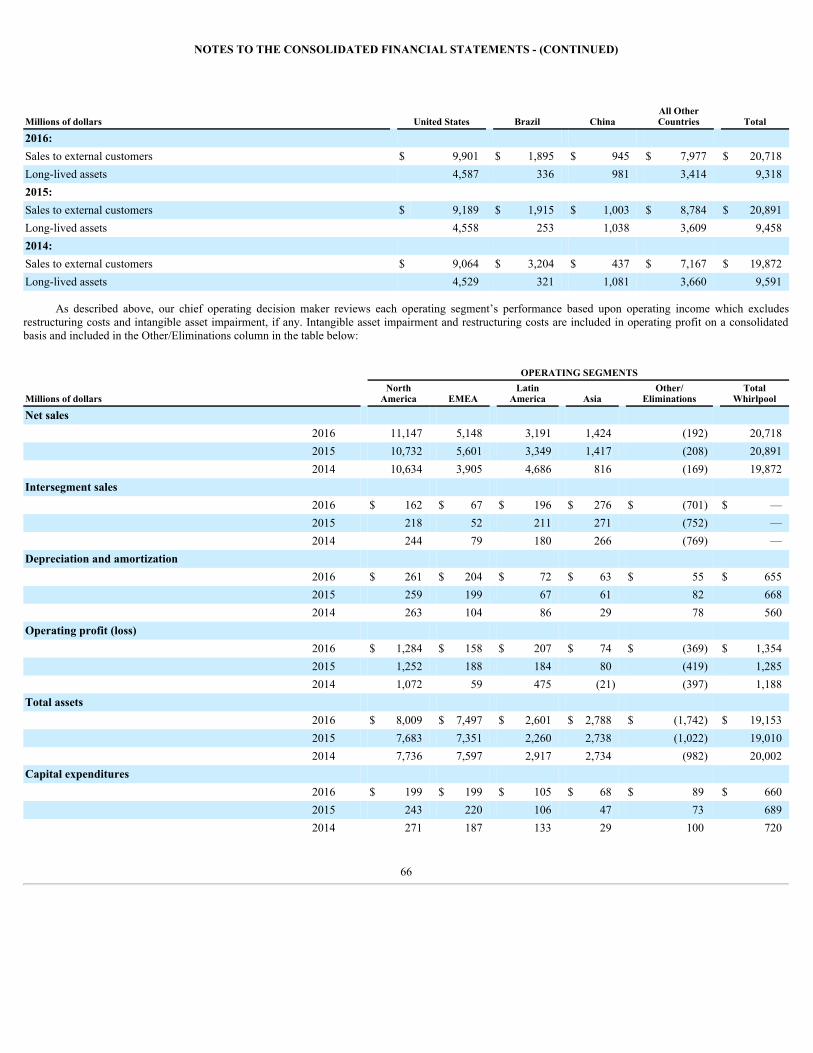
NOTES TO THE CONSOLIDATED FINANCIAL STATEMENTS - (CONTINUED)
Millions of dollars United States Brazil China All OtherCountries Total
2016: Sales to external customers $ 9,901 $ 1,895 $ 945 $ 7,977 $ 20,718Long-lived assets 4,587 336 981 3,414 9,3182015: Sales to external customers $ 9,189 $ 1,915 $ 1,003 $ 8,784 $ 20,891Long-lived assets 4,558 253 1,038 3,609 9,4582014: Sales to external customers $ 9,064 $ 3,204 $ 437 $ 7,167 $ 19,872Long-lived assets 4,529 321 1,081 3,660 9,591
As described above, our chief operating decision maker reviews each operating segment’s performance based upon operating income which excludesrestructuring costs and intangible asset impairment, if any. Intangible asset impairment and restructuring costs are included in operating profit on a consolidatedbasis and included in the Other/Eliminations column in the table below:
OPERATING SEGMENTS
Millions of dollars North
America EMEA Latin
America Asia Other/
Eliminations Total
Whirlpool
Net sales 2016 11,147 5,148 3,191 1,424 (192) 20,7182015 10,732 5,601 3,349 1,417 (208) 20,8912014 10,634 3,905 4,686 816 (169) 19,872
Intersegment sales 2016 $ 162 $ 67 $ 196 $ 276 $ (701) $ —2015 218 52 211 271 (752) —2014 244 79 180 266 (769) —
Depreciation and amortization 2016 $ 261 $ 204 $ 72 $ 63 $ 55 $ 6552015 259 199 67 61 82 6682014 263 104 86 29 78 560
Operating profit (loss) 2016 $ 1,284 $ 158 $ 207 $ 74 $ (369) $ 1,3542015 1,252 188 184 80 (419) 1,2852014 1,072 59 475 (21) (397) 1,188
Total assets 2016 $ 8,009 $ 7,497 $ 2,601 $ 2,788 $ (1,742) $ 19,1532015 7,683 7,351 2,260 2,738 (1,022) 19,0102014 7,736 7,597 2,917 2,734 (982) 20,002
Capital expenditures 2016 $ 199 $ 199 $ 105 $ 68 $ 89 $ 6602015 243 220 106 47 73 6892014 271 187 133 29 100 720
66

NOTES TO THE CONSOLIDATED FINANCIAL STATEMENTS - (CONTINUED)
( 14 ) QUARTERLY RESULTS OF OPERATIONS (UNAUDITED)
Three months ended
Dec. 31 Sept. 30 Jun. 30 Mar. 31
Millions of dollars, except per share data 2016 2015 2016 2015 2016 2015 2016 2015
Net sales $ 5,656 $ 5,560 $ 5,248 $ 5,277 $ 5,198 $ 5,208 $ 4,616 $ 4,846Cost of products sold 4,701 4,558 4,310 4,347 4,230 4,303 3,795 3,993Operating profit 335 380 370 329 366 273 283 303Interest and sundry (income) expense (16) 57 26 21 39 (42) 30 53Net earnings 186 189 244 250 342 185 156 198Net earnings available to Whirlpool 180 180 238 235 320 177 150 191
Per share of common stock: (1)
Basic net earnings $ 2.40 $ 2.31 $ 3.14 $ 2.98 $ 4.20 $ 2.24 $ 1.94 $ 2.42Diluted net earnings 2.36 2.28 3.10 2.95 4.15 2.21 1.92 2.38Dividends 1.00 0.90 1.00 0.90 1.00 0.90 0.90 0.75
Market price range of common stock: (2)
High $ 185.24 $ 167.72 $ 194.10 $ 186.82 $ 193.59 $ 202.50 $ 180.59 $ 217.11Low 145.91 140.50 159.55 143.75 152.19 172.85 123.60 186.14Close 181.77 146.87 162.16 147.26 166.64 173.05 180.34 202.06
(1) The quarterly earnings per share amounts will not necessarily add to the earnings per share computed for the year due to the method used in calculating per share data.(2) Composite price as reported by the New York Stock Exchange.
67

ITEM 9. CHANGES IN AND DISAGREEMENTS WITH ACCOUNTANTS ON ACCOUNTING AND FINANCIAL DISCLOSURE
None.
ITEM 9A. CONTROLS AND PROCEDURES
Disclosure controls and procedures. Whirlpool maintains disclosure controls and procedures (as defined in Rule 13a-15(e) of the Securities Exchange Actof 1934, as amended (the "Securities Exchange Act")) that are designed to provide reasonable assurance that information required to be disclosed in our filingsunder the Securities Exchange Act is recorded, processed, summarized, and reported within the periods specified in the rules and forms of the SEC and that suchinformation is accumulated and communicated to Whirlpool’s management, including its Chief Executive Officer and Chief Financial Officer, as appropriate, toallow timely decisions regarding required disclosure.
Prior to filing this report, we completed an evaluation under the supervision and with the participation of Whirlpool management, including the ChiefExecutive Officer and Chief Financial Officer, of the effectiveness of the design and operation of our disclosure controls and procedures as of December 31, 2016 .Based on this evaluation, the Chief Executive Officer and Chief Financial Officer concluded that our disclosure controls and procedures were effective at thereasonable assurance level as of December 31, 2016 .
Management’s annual report on internal control over financial reporting. Pursuant to Section 404 of the Sarbanes-Oxley Act of 2002 and the rules andregulations adopted pursuant thereto, we included a report of management’s assessment of the effectiveness of our internal control over financial reporting as partof this report. Management’s report is included on page 75 of this report under the caption entitled “Management’s Report on Internal Control Over FinancialReporting”.
Our internal control over financial reporting as of December 31, 2016 has been audited by Ernst & Young LLP, an independent registered public accountingfirm, as stated in their report, which is included on page 77 of this report under the caption entitled “Report of Independent Registered Public Accounting Firm”and is incorporated herein by reference.
There were no changes in our internal control over financial reporting during the quarter ended December 31, 2016 that have materially affected, or arereasonably likely to materially affect, our internal control over financial reporting.
ITEM 9B. OTHER INFORMATION
None.
68

PART III
ITEM 10. DIRECTORS, EXECUTIVE OFFICERS AND CORPORATE GOVERNANCE
Information regarding our executive officers is included in ITEM 1 of PART I of this report.
Information regarding the background of the directors, matters related to the Audit Committee, Section 16(a) compliance, and the process by which ourshareholders may recommend nominees to our Board of Directors can be found under the captions “Directors and Nominees for Election as Directors,” “Board ofDirectors and Corporate Governance - Board of Directors and Committees,”, “Section 16(a) Beneficial Ownership Reporting Compliance”, and "Board ofDirectors and Corporate Governance - Director Nominations to be Considered by Stockholders" in our Proxy Statement, which is incorporated herein by reference.
We have adopted a code of ethics that applies to all of our employees, officers and directors, including our principal executive officer, principal financialofficer and principal accounting officer. The text of our code of ethics is posted on our website: www.whirlpoolcorp.com (scroll to the bottom of the main page andclick on “Policies,” then on “Code of Ethics.”) Whirlpool intends to disclose future amendments to, or waivers from, certain provisions of the code of ethics forexecutive officers and directors on the website within four business days following the date of such amendment or waiver. Stockholders may request a free copy ofthe code of ethics from:
Investor RelationsWhirlpool Corporation
2000 North M-63Mail Drop 2609
Benton Harbor, MI 49022-2692Telephone: (269) 923-2641
Whirlpool has also adopted Corporate Governance Guidelines and written charters for its Audit, Finance, Human Resources and Corporate Governance andNominating Committees, all of which are posted on our website: www.whirlpoolcorp.com (scroll to the bottom of the main page and click on “Policies.”)Stockholders may request a free copy of the charters and guidelines from the address or telephone number set forth above.
ITEM 11. EXECUTIVE COMPENSATION
Information regarding compensation of our executive officers and directors can be found under the captions “Nonemployee Director Compensation,”“Compensation Discussion and Analysis,” “Executive Compensation Tables,” and “Human Resources Committee Interlocks and Insider Participation” in the ProxyStatement, which is incorporated herein by reference. See also the information under the caption “Human Resources Committee Report” in our Proxy Statement,which is incorporated herein by reference; however, such information is only “furnished” hereunder and not deemed “soliciting material” or “filed” with the SECor subject to Regulation 14A or 14C or to the liabilities of Section 18 of the Securities Exchange Act of 1934.
ITEM 12. SECURITY OWNERSHIP OF CERTAIN BENEFICIAL OWNERS AND MANAGEMENT AND RELATED STOCKHOLDER MATTERS
Information regarding the security ownership of any person that we know to beneficially own more than 5% of Whirlpool stock and by each Whirlpooldirector, each Whirlpool named executive officer, and all directors and executive officers as a group, can be found under the captions “Security Ownership” and“Beneficial Ownership” in the Proxy Statement, which is incorporated herein by reference. Information relating to securities authorized under equity compensationplans can be found under the caption “Equity Compensation Plan Information” in the Proxy Statement, which is incorporated herein by reference.
ITEM 13. CERTAIN RELATIONSHIPS AND RELATED TRANSACTIONS, AND DIRECTOR INDEPENDENCE
Information regarding certain relationships and related transactions (if any) and the independence of Whirlpool’s directors, can be found under the captions“Related Person Transactions” and “Board of Directors and Corporate Governance—Board of Directors and Committees” in the Proxy Statement, which isincorporated herein by reference.
69

ITEM 14. PRINCIPAL ACCOUNTING FEES AND SERVICES
Information regarding our auditors and the Audit Committee’s pre-approval policies can be found under the caption “Matters Relating to IndependentRegistered Public Accounting Firm” in the Proxy Statement, which is incorporated herein by reference.
70
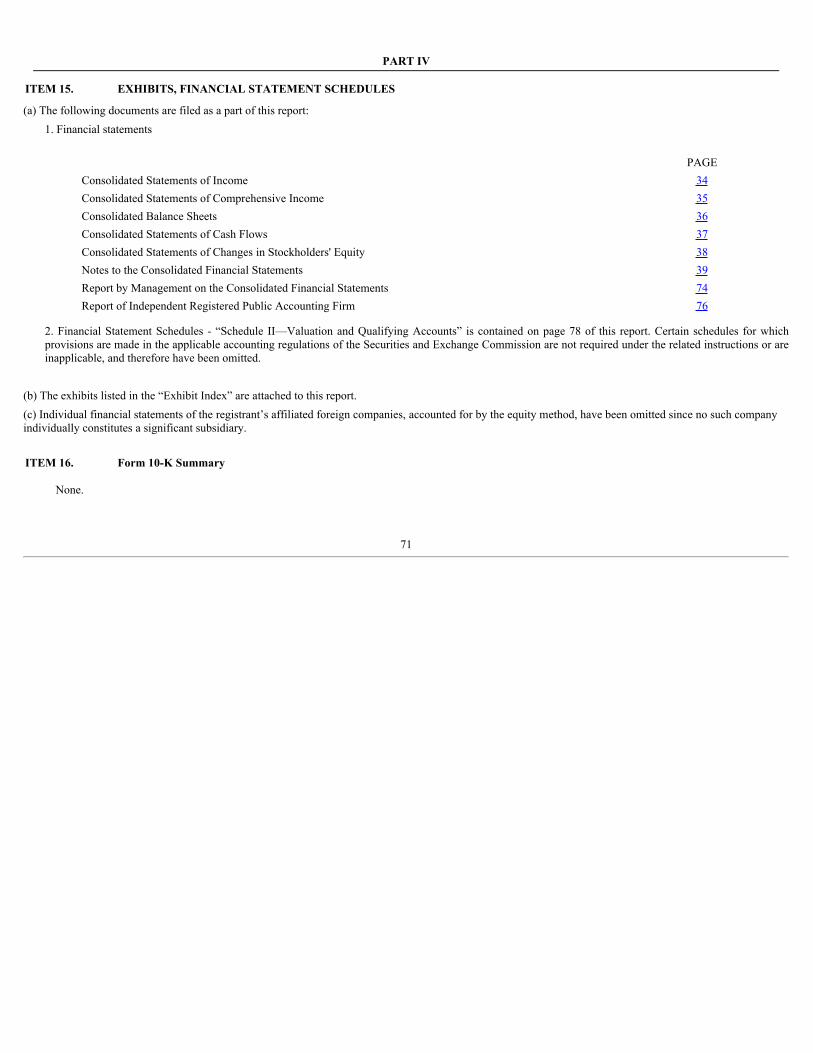
PART IV
ITEM 15. EXHIBITS, FINANCIAL STATEMENT SCHEDULES
(a) The following documents are filed as a part of this report:1. Financial statements
PAGEConsolidated Statements of Income 34Consolidated Statements of Comprehensive Income 35Consolidated Balance Sheets 36Consolidated Statements of Cash Flows 37Consolidated Statements of Changes in Stockholders' Equity 38Notes to the Consolidated Financial Statements 39Report by Management on the Consolidated Financial Statements 74Report of Independent Registered Public Accounting Firm 76
2. Financial Statement Schedules - “Schedule II—Valuation and Qualifying Accounts” is contained on page 78 of this report. Certain schedules for whichprovisions are made in the applicable accounting regulations of the Securities and Exchange Commission are not required under the related instructions or areinapplicable, and therefore have been omitted.
(b) The exhibits listed in the “Exhibit Index” are attached to this report.(c) Individual financial statements of the registrant’s affiliated foreign companies, accounted for by the equity method, have been omitted since no such companyindividually constitutes a significant subsidiary.
ITEM 16. Form 10-K Summary
None.
71

SIGNATURES
Pursuant to the requirements of Section 13 or 15(d) of the Securities Exchange Act of 1934, the registrant has duly caused this report to be signed on itsbehalf by the undersigned, thereunto duly authorized.
W HIRLPOOL C ORPORATION(Registrant) By: /s/ JAMES W. PETERS February 13, 2017
James W. Peters
Executive Vice President and Chief Financial Officer Pursuant to the requirements of the Securities Exchange Act of 1934, this report has been signed below by the following persons on behalf of the registrant
and in the capacities and on the date indicated.
Signature Title
/s/ JEFF M. FETTIG Director, Chairman of the Board and Chief Executive Officer
(Principal Executive Officer)Jeff M. Fettig
/s/ MARC R. BITZER Director, President and Chief Operating Officer
Marc R. Bitzer
/s/ JAMES W. PETERS Executive Vice President and Chief Financial Officer
(Principal Financial Officer)James W. Peters
/s/ JOSEPH A. LOVECHIO Vice President and Corporate Controller
(Principal Accounting Officer)Joseph A. Lovechio
SAMUEL R. ALLEN* DirectorSamuel R. Allen
GARY T. DICAMILLO* Director
Gary T. DiCamillo
DIANE M. DIETZ* DirectorDiane M. Dietz
GERRI T. ELLIOTT* Director
Gerri T. Elliott
MICHAEL F. JOHNSTON* DirectorMichael F. Johnston
JOHN D. LIU* Director
John D. Liu
HARISH MANWANI* Director
Harish Manwani
WILLIAM D. PEREZ* DirectorWilliam D. Perez
LARRY O. SPENCER* Director
Larry O. Spencer
MICHAEL D. WHITE* DirectorMichael D. White
72

*By: /s/ KIRSTEN J. HEWITT Attorney-in-Fact February 13, 2017 Kirsten J. Hewitt
73
REPORT BY MANAGEMENT ON THE CONSOLIDATED FINANCIAL STATEMENTS
The management of Whirlpool Corporation has prepared the accompanying financial statements. The financial statements have been audited by Ernst &Young LLP, an independent registered public accounting firm, whose report, based upon their audits, expresses the opinion that these financial statements presentfairly the consolidated financial position, statements of income and cash flows of Whirlpool and its subsidiaries in accordance with accounting principles generallyaccepted in the United States. Their audits are conducted in conformity with the auditing standards of the Public Company Accounting Oversight Board (UnitedStates).
The financial statements were prepared from the Company’s accounting records, books and accounts which, in reasonable detail, accurately and fairlyreflect all material transactions. The Company maintains a system of internal controls designed to provide reasonable assurance that the Company’s books andrecords, and the Company’s assets are maintained and accounted for, in accordance with management’s authorizations. The Company’s accounting records,compliance with policies and internal controls are regularly reviewed by an internal audit staff.
The audit committee of the Board of Directors of the Company is composed of four independent directors who, in the opinion of the board, meet therelevant financial experience, literacy, and expertise requirements. The audit committee provides independent and objective oversight of the Company’s accountingfunctions and internal controls and monitors (1) the objectivity of the Company’s financial statements, (2) the Company’s compliance with legal and regulatoryrequirements, (3) the independent registered public accounting firm’s qualifications and independence, and (4) the performance of the Company’s internal auditfunction and independent registered public accounting firm. In performing these functions, the committee has the responsibility to review and discuss the annualaudited financial statements and quarterly financial statements and related reports with management and the independent registered public accounting firm,including the Company’s disclosures under “Management’s Discussion and Analysis of Financial Condition and Results of Operations,” to monitor the adequacyof financial disclosure. The committee also has the responsibility to retain and terminate the Company’s independent registered public accounting firm and exercisethe committee’s sole authority to review and approve all audit engagement fees and terms and pre-approve the nature, extent, and cost of all non-audit servicesprovided by the independent registered public accounting firm.
/s/ JAMES W. PETERS
James W. PetersExecutive Vice President and Chief Financial OfficerFebruary 13, 2017
74

MANAGEMENT’S REPORT ON INTERNAL CONTROL OVER FINANCIAL REPORTING
The management of Whirlpool Corporation is responsible for establishing and maintaining adequate internal control over financial reporting as defined inRules 13a – 15(f) and 15d – 15(f) under the Securities Exchange Act of 1934. Whirlpool’s internal control system is designed to provide reasonable assurance toWhirlpool’s management and board of directors regarding the reliability of financial reporting and the preparation and fair presentation of published financialstatements.
All internal control systems, no matter how well designed, have inherent limitations. Therefore, even those systems determined to be effective can provideonly reasonable assurance with respect to financial statement preparation and presentation.
The management of Whirlpool assessed the effectiveness of Whirlpool’s internal control over financial reporting as of December 31, 2016 . In making thisassessment, it used the criteria set forth by the Committee of Sponsoring Organizations of the Treadway Commission (COSO) in Internal Control—IntegratedFramework (2013 Framework). Based on the assessment and those criteria, management believes that Whirlpool maintained effective internal control overfinancial reporting as of December 31, 2016 .
Whirlpool’s independent registered public accounting firm has issued an audit report on its assessment of Whirlpool’s internal control over financialreporting. This report appears on page 77.
/s/ JEFF M. FETTIG /s/ JAMES W. PETERSJeff M. Fettig James W. Peters Chairman of the Board and Chief Executive Officer
Executive Vice President and Chief Financial Officer
February 13, 2017 February 13, 2017
75
REPORT OF INDEPENDENT REGISTERED PUBLIC ACCOUNTING FIRM
The Board of Directors and Stockholders of Whirlpool Corporation
We have audited the accompanying consolidated balance sheets of Whirlpool Corporation as of December 31, 2016 and 2015 , and the related consolidatedstatements of income, comprehensive income, shareholders' equity and cash flows for each of the three years in the period ended December 31, 2016 . Our auditsalso included the financial statement schedule listed in the index at Item 15(a). These financial statements and schedule are the responsibility of the Company'smanagement. Our responsibility is to express an opinion on these financial statements and schedule based on our audits.
We conducted our audits in accordance with the standards of the Public Company Accounting Oversight Board (United States). Those standards require thatwe plan and perform the audit to obtain reasonable assurance about whether the financial statements are free of material misstatement. An audit includesexamining, on a test basis, evidence supporting the amounts and disclosures in the financial statements. An audit also includes assessing the accounting principlesused and significant estimates made by management, as well as evaluating the overall financial statement presentation. We believe that our audits provide areasonable basis for our opinion.
In our opinion, the financial statements referred to above present fairly, in all material respects, the consolidated financial position of Whirlpool Corporationat December 31, 2016 and 2015 , and the consolidated results of its operations and its cash flows for each of the three years in the period ended December 31, 2016, in conformity with U.S. generally accepted accounting principles.
We also have audited, in accordance with the standards of the Public Company Accounting Oversight Board (United States), Whirlpool Corporation’sinternal control over financial reporting as of December 31, 2016 , based on criteria established in Internal Control-Integrated Framework issued by the Committeeof Sponsoring Organizations of the Treadway Commission 2013 framework and our report dated February 13, 2017 expressed an unqualified opinion thereon.
/s/ Ernst & Young LLP
Chicago, IllinoisFebruary 13, 2017
76

REPORT OF INDEPENDENT REGISTERED PUBLIC ACCOUNTING FIRM
The Board of Directors and Stockholders of Whirlpool Corporation
We have audited Whirlpool Corporation’s internal control over financial reporting as of December 31, 2016 , based on criteria established in InternalControl-Integrated Framework issued by the Committee of Sponsoring Organizations of the Treadway Commission 2013 framework (the COSO criteria).Whirlpool Corporation’s management is responsible for maintaining effective internal control over financial reporting, and for its assessment of the effectivenessof internal control over financial reporting included in the accompanying Management’s Report on Internal Control Over Financial Reporting. Our responsibility isto express an opinion on the company’s internal control over financial reporting based on our audit.
We conducted our audit in accordance with the standards of the Public Company Accounting Oversight Board (United States). Those standards require thatwe plan and perform the audit to obtain reasonable assurance about whether effective internal control over financial reporting was maintained in all materialrespects. Our audit included obtaining an understanding of internal control over financial reporting, assessing the risk that a material weakness exists, testing andevaluating the design and operating effectiveness of internal control based on the assessed risk, and performing such other procedures as we considered necessaryin the circumstances. We believe that our audit provides a reasonable basis for our opinion.
A company’s internal control over financial reporting is a process designed to provide reasonable assurance regarding the reliability of financial reportingand the preparation of financial statements for external purposes in accordance with generally accepted accounting principles. A company’s internal control overfinancial reporting includes those policies and procedures that (1) pertain to the maintenance of records that, in reasonable detail, accurately and fairly reflect thetransactions and dispositions of the assets of the company; (2) provide reasonable assurance that transactions are recorded as necessary to permit preparation offinancial statements in accordance with generally accepted accounting principles, and that receipts and expenditures of the company are being made only inaccordance with authorizations of management and directors of the company; and (3) provide reasonable assurance regarding prevention or timely detection ofunauthorized acquisition, use, or disposition of the company’s assets that could have a material effect on the financial statements.
Because of its inherent limitations, internal control over financial reporting may not prevent or detect misstatements. Also, projections of any evaluation ofeffectiveness to future periods are subject to the risk that controls may become inadequate because of changes in conditions, or that the degree of compliance withthe policies or procedures may deteriorate.
In our opinion, Whirlpool Corporation maintained, in all material respects, effective internal control over financial reporting as of December 31, 2016 ,based on the COSO criteria.
We also have audited, in accordance with the standards of the Public Company Accounting Oversight Board (United States), the consolidated balance sheetsof Whirlpool Corporation as of December 31, 2016 and 2015 , and the related consolidated statements of income, comprehensive income, shareholders’ equity andcash flows for each of the three years in the period ended December 31, 2016 and our report dated February 13, 2017 expressed an unqualified opinion thereon.
/s/ Ernst & Young LLP
Chicago, IllinoisFebruary 13, 2017
77
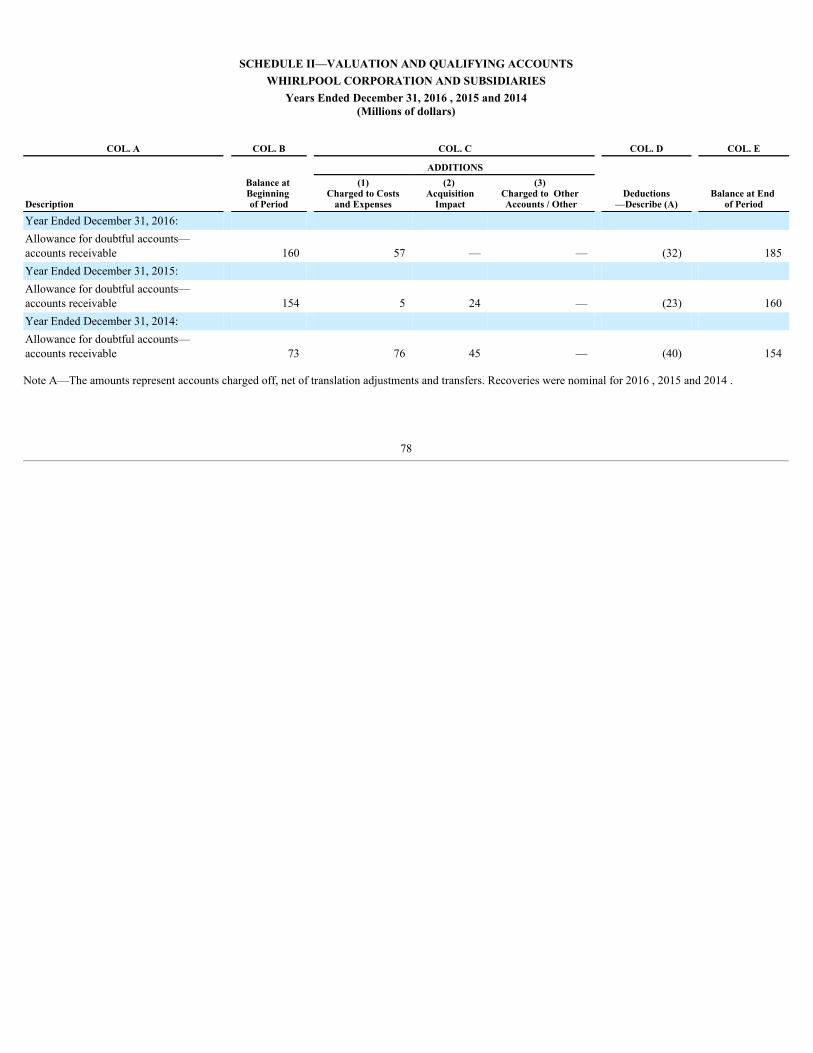
SCHEDULE II—VALUATION AND QUALIFYING ACCOUNTSWHIRLPOOL CORPORATION AND SUBSIDIARIES
Years Ended December 31, 2016 , 2015 and 2014(Millions of dollars)
COL. A COL. B COL. C COL. D COL. E
ADDITIONS
Description
Balance at Beginning of Period
(1)Charged to Costs
and Expenses
(2) Acquisition
Impact
(3) Charged to Other Accounts / Other
Deductions—Describe (A)
Balance at End of Period
Year Ended December 31, 2016: Allowance for doubtful accounts—accounts receivable 160 57 — — (32) 185Year Ended December 31, 2015: Allowance for doubtful accounts—accounts receivable 154 5 24 — (23) 160Year Ended December 31, 2014: Allowance for doubtful accounts—accounts receivable 73 76 45 — (40) 154
Note A—The amounts represent accounts charged off, net of translation adjustments and transfers. Recoveries were nominal for 2016 , 2015 and 2014 .
78

[THIS PAGE INTENTIONALLY LEFT BLANK]

ANNUAL REPORT ON FORM 10-KITEMS 15(a)(3) and 15(c)
EXHIBIT INDEXYEAR ENDED DECEMBER 31, 2016
The following exhibits are submitted herewith or incorporated herein by reference in response to Items 15(a)(3) and 15(c). Each exhibit that is considered amanagement contract or compensatory plan or arrangement required to be filed pursuant to Item 15(a)(3) of Form 10-K is identified by a “(Z).”
Number and Description of Exhibit
3(i) Restated Certificate of Incorporation of Whirlpool Corporation (amended and restated as of April 22, 2009). [Incorporated by reference fromExhibit 3.1 to the Company's Form 8-K (Commission file number 1-3932) filed on April 23, 2009]
3(ii) By-Laws of Whirlpool Corporation (amended and restated effective October 18, 2016). [Incorporated by reference from Exhibit 3.2 to the
Company’s Form 8-K (Commission file number 1-3932) filed on October 21, 2016] 4(i) The registrant hereby agrees to furnish to the Securities and Exchange Commission, upon request, a copy of instruments defining the rights of
holders of each issue of long-term debt of the registrant and its subsidiaries. 4(ii) Indenture dated as of April 15, 1990 between Whirlpool Corporation and Citibank, N.A. [Incorporated by reference from Exhibit 4(a) to the
Company’s Registration Statement on Form S-3 (Commission file number 33-40249) filed on May 6, 1991] 4(iii) Indenture dated as of March 20, 2000 between Whirlpool Corporation and U.S. Bank, National Association (as successor to Citibank, N.A.)
[Incorporated by reference from Exhibit 4(a) to the Company’s Registration Statement on Form S-3 (Commission file number 333-32886) filedon March 21, 2000]
4(iv) Indenture dated as of June 15, 1987 between Maytag Corporation and The First National Bank of Chicago. [Incorporated by reference from
Maytag Corporation’s Quarterly Report on Form 10-Q (Commission file number 1-00655) for the quarter ended June 30, 1987] 4(v) Ninth Supplemental Indenture dated as of October 30, 2001 between Maytag Corporation and Bank One, National Association. [Incorporated by
reference from Exhibit 4.1 to Maytag Corporation’s Form 8-K (Commission file number 1-00655) filed on October 31, 2001] 4(vi) Tenth Supplemental Indenture dated as of December 30, 2010, between Maytag Corporation, Whirlpool Corporation and The Bank of New
York Mellon Trust Company, N.A. [Incorporated by reference from Exhibit 4(vi) to the Company’s Annual Report on Form 10-K (Commissionfile number 1-3932) for the fiscal year ended December 31, 2010]
4(vii) Indenture, dated November 2, 2016, among Whirlpool Finance Luxembourg S.à. r.l., Whirlpool Corporation and U.S. Bank National
Association. [Incorporated by reference from Exhibit 4.1 to the Company’s Form 8-K (Commission file number 1-3932) filed on November 2,2016]
10(i)(a) Share Purchase Agreement dated July 10, 2014 among Whirlpool Corporation and Fineldo S.p.A., Franca Carloni, Andrea Merloni, Aristide
Merloni, Maria Paola Merloni, and Antonella Merloni [Incorporated by reference from Exhibit 10.1 to the Company’s Quarterly Report on Form10-Q (Commission file number 1-3932) for the quarter ended September 30, 2014]
10(i)(b) Share Purchase Agreement dated July 10, 2014 among Whirlpool Corporation and Fineldo S.p.A., Fines S.p.A., Franca Carloni, Andrea
Merloni, Aristide Merloni, Maria Paola Merloni, Ester Merloni, Vittorio Merloni and Antonella Merloni [Incorporated by reference from Exhibit10.2 to the Company’s Quarterly Report on Form 10-Q (Commission file number 1-3932) for the quarter ended September 30, 2014]
E-1
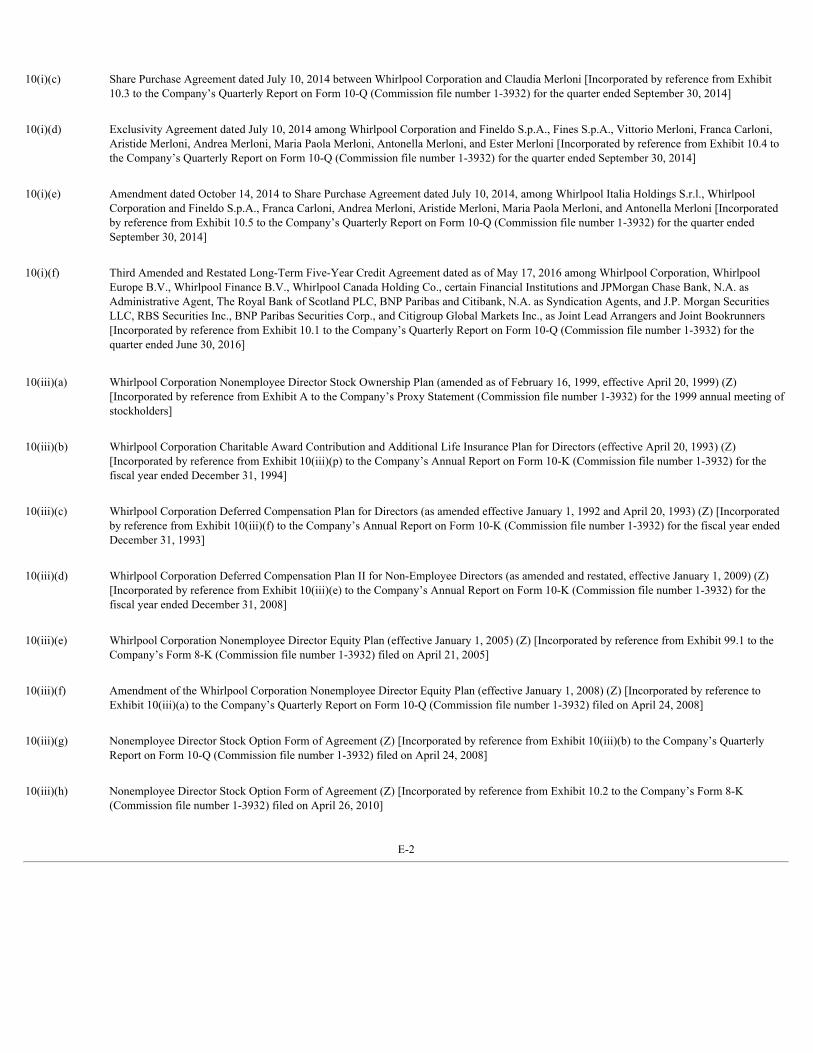
10(i)(c) Share Purchase Agreement dated July 10, 2014 between Whirlpool Corporation and Claudia Merloni [Incorporated by reference from Exhibit
10.3 to the Company’s Quarterly Report on Form 10-Q (Commission file number 1-3932) for the quarter ended September 30, 2014] 10(i)(d) Exclusivity Agreement dated July 10, 2014 among Whirlpool Corporation and Fineldo S.p.A., Fines S.p.A., Vittorio Merloni, Franca Carloni,
Aristide Merloni, Andrea Merloni, Maria Paola Merloni, Antonella Merloni, and Ester Merloni [Incorporated by reference from Exhibit 10.4 tothe Company’s Quarterly Report on Form 10-Q (Commission file number 1-3932) for the quarter ended September 30, 2014]
10(i)(e) Amendment dated October 14, 2014 to Share Purchase Agreement dated July 10, 2014, among Whirlpool Italia Holdings S.r.l., Whirlpool
Corporation and Fineldo S.p.A., Franca Carloni, Andrea Merloni, Aristide Merloni, Maria Paola Merloni, and Antonella Merloni [Incorporatedby reference from Exhibit 10.5 to the Company’s Quarterly Report on Form 10-Q (Commission file number 1-3932) for the quarter endedSeptember 30, 2014]
10(i)(f) Third Amended and Restated Long-Term Five-Year Credit Agreement dated as of May 17, 2016 among Whirlpool Corporation, Whirlpool
Europe B.V., Whirlpool Finance B.V., Whirlpool Canada Holding Co., certain Financial Institutions and JPMorgan Chase Bank, N.A. asAdministrative Agent, The Royal Bank of Scotland PLC, BNP Paribas and Citibank, N.A. as Syndication Agents, and J.P. Morgan SecuritiesLLC, RBS Securities Inc., BNP Paribas Securities Corp., and Citigroup Global Markets Inc., as Joint Lead Arrangers and Joint Bookrunners[Incorporated by reference from Exhibit 10.1 to the Company’s Quarterly Report on Form 10-Q (Commission file number 1-3932) for thequarter ended June 30, 2016]
10(iii)(a) Whirlpool Corporation Nonemployee Director Stock Ownership Plan (amended as of February 16, 1999, effective April 20, 1999) (Z)[Incorporated by reference from Exhibit A to the Company’s Proxy Statement (Commission file number 1-3932) for the 1999 annual meeting ofstockholders]
10(iii)(b) Whirlpool Corporation Charitable Award Contribution and Additional Life Insurance Plan for Directors (effective April 20, 1993) (Z)
[Incorporated by reference from Exhibit 10(iii)(p) to the Company’s Annual Report on Form 10-K (Commission file number 1-3932) for thefiscal year ended December 31, 1994]
10(iii)(c) Whirlpool Corporation Deferred Compensation Plan for Directors (as amended effective January 1, 1992 and April 20, 1993) (Z) [Incorporated
by reference from Exhibit 10(iii)(f) to the Company’s Annual Report on Form 10-K (Commission file number 1-3932) for the fiscal year endedDecember 31, 1993]
10(iii)(d) Whirlpool Corporation Deferred Compensation Plan II for Non-Employee Directors (as amended and restated, effective January 1, 2009) (Z)
[Incorporated by reference from Exhibit 10(iii)(e) to the Company’s Annual Report on Form 10-K (Commission file number 1-3932) for thefiscal year ended December 31, 2008]
10(iii)(e) Whirlpool Corporation Nonemployee Director Equity Plan (effective January 1, 2005) (Z) [Incorporated by reference from Exhibit 99.1 to the
Company’s Form 8-K (Commission file number 1-3932) filed on April 21, 2005] 10(iii)(f) Amendment of the Whirlpool Corporation Nonemployee Director Equity Plan (effective January 1, 2008) (Z) [Incorporated by reference to
Exhibit 10(iii)(a) to the Company’s Quarterly Report on Form 10-Q (Commission file number 1-3932) filed on April 24, 2008] 10(iii)(g) Nonemployee Director Stock Option Form of Agreement (Z) [Incorporated by reference from Exhibit 10(iii)(b) to the Company’s Quarterly
Report on Form 10-Q (Commission file number 1-3932) filed on April 24, 2008] 10(iii)(h) Nonemployee Director Stock Option Form of Agreement (Z) [Incorporated by reference from Exhibit 10.2 to the Company’s Form 8-K
(Commission file number 1-3932) filed on April 26, 2010]
E-2

10(iii)(i) Transition Agreement dated December 23, 2015 between Whirlpool Corporation and Michael A. Todman (Z) [Incorporated by reference from
Exhibit 10(iii)(i) to the Company’s Annual Report on Form 10-K (Commission file number 1-3932) for the fiscal year ended December 31,2015]
10(iii)(j) Whirlpool Corporation 2000 Omnibus Stock and Incentive Plan (effective January 1, 2000) (Z) [Incorporated by reference from Exhibit A to the
Company’s Proxy Statement (Commission file number 1-3932) for the 2000 annual meeting of stockholders filed on March 13, 2000]10(iii)(k) Whirlpool Corporation 2002 Omnibus Stock and Incentive Plan (effective January 1, 2002) (Z) [Incorporated by reference from Exhibit A to the
Company’s Proxy Statement (Commission file number 1-3932) for the 2002 annual meeting of stockholders filed on March 8, 2002] 10(iii)(l) Whirlpool Corporation 2007 Omnibus Stock and Incentive Plan (effective January 1, 2007) (Z) [Incorporated by reference from Annex A to the
Company’s Proxy Statement (Commission file number 1-3932) for the 2007 annual meeting of stockholders filed on March 12, 2007] 10(iii)(m) Omnibus Equity Plans 409A Amendment (effective December 19, 2008) (Z) [Incorporated by reference from Exhibit 10(iii)(n) to the
Company’s Annual Report on Form 10-K (Commission file number 1-3932) for the fiscal year ended December 31, 2008]
10(iii)(n) Whirlpool Corporation 2010 Omnibus Stock and Incentive Plan (Z) [Incorporated by reference from Exhibit 10.1 to the Company’s Form 8-K(Commission file number 1-3932) filed on April 26, 2010]
10(iii)(o) Whirlpool Corporation Amended and Restated 2010 Omnibus Stock and Incentive Plan (Z) [Incorporated by reference from Exhibit 10.1 to the
Company’s Registration Statement on Form S-8 (Commission file number 333-187948) filed on April 16, 2013] 10(iii)(p) Form of Agreement for the Whirlpool Corporation Career Stock Grant Program (pursuant to one or more of Whirlpool’s Omnibus Stock and
Incentive Plans) (Z) [Incorporated by reference from Exhibit 10(iii)(q) to the Company’s Annual Report on Form 10-K (Commission filenumber 1-3932) for the fiscal year ended December 31, 1995]
10(iii)(q) Form of Amendment to Whirlpool Corporation Career Stock Grant Agreement (Z) [Incorporated by reference from Exhibit 10(iii)(p) to the
Company’s Annual Report on Form 10-K (Commission file number 1-3932) for the fiscal year ended December 31, 2008] 10(iii)(r) Form of Stock Option Grant Document for the Whirlpool Corporation Stock Option Program (pursuant to one or more of Whirlpool’s Omnibus
Stock and Incentive Plans)(Rev. 02/17/04) (Z) [Incorporated by reference from Exhibit 10(i) to the Company’s Form 8-K (Commission filenumber 1-3932) filed on January 25, 2005]
10(iii)(s) Form of Restricted Stock Unit Agreement (pursuant to one or more of Whirlpool’s Omnibus Stock and Incentive Plans) (Z) [Incorporated by
reference from Exhibit 10.1 to the Company’s Form 8-K (Commission file number 1-3932) filed on June 21, 2010] 10(iii)(t) Whirlpool Corporation 2010 Omnibus Stock and Incentive Plan Restricted Stock Unit Award (Z) [Incorporated by reference from Exhibit 10(iii)
(a) to the Company’s Form 10-Q (Commission file number 1-3932) for the quarter ended March 31, 2011] 10(iii)(u) Whirlpool Corporation 2010 Omnibus Stock and Incentive Plan Strategic Excellence Program Performance Unit Award (Z) [Incorporated by
reference from Exhibit 10(iii)(b) to the Company’s Form 10-Q (Commission file number 1-3932) for the quarter ended March 31, 2011]
E-3

10(iii)(v) Whirlpool Corporation 2010 Omnibus Stock and Incentive Plan Strategic Excellence Program Stock Option Grant (Z) [Incorporated byreference from Exhibit 10(iii)(c) to the Company’s Form 10-Q (Commission file number 1-3932) for the quarter ended March 31, 2011]
10(iii)(w) Whirlpool Corporation 2010 Omnibus Stock and Incentive Plan Strategic Excellence Program Restricted Stock Unit Award (Z) [Incorporated by
reference from Exhibit 10(iii)(d) to the Company’s Form 10-Q (Commission file number 1-3932) for the quarter ended March 31, 2011] 10(iii)(x) Whirlpool Corporation 2010 Omnibus Stock and Incentive Plan Strategic Excellence Program Stock Option Grant Document (Z) [Incorporated
by reference from Exhibit 10(iii)(a) to the Company’s form 10-Q (Commission file number 1-3932) for the quarter ended March 31, 2012] 10(iii)(y) Whirlpool Corporation 2010 Omnibus Stock and Incentive Plan Strategic Excellence Program Performance Restricted Stock Unit / Performance
Unit Grant Document (Z) [Incorporated by reference from Exhibit 10(iii)(b) to the Company’s form 10-Q (Commission file number 1-3932) forthe quarter ended March 31, 2012]
10(iii)(z) Form of Compensation and Benefits Assurance Agreements (Z) [Incorporated by reference from Exhibit 10.1 to the Company’s Form 8-K
(Commission file number 1-3932) filed on August 23, 2010] 10(iii)(aa) Whirlpool Corporation Executive Deferred Savings Plan (as amended effective January 1, 1992) (Z) [Incorporated by reference from Exhibit
10(iii)(n) to the Company’s Annual Report on Form 10-K (Commission file number 1-3932) for the fiscal year ended December 31, 1993] 10(iii)(bb) Whirlpool Corporation Executive Deferred Savings Plan II (as amended and restated, effective January 1, 2009), including Supplement A,
Whirlpool Executive Restoration Plan (as amended and restated, effective January 1, 2009) (Z) [Incorporated by reference from Exhibit 10(iii)(y) to the Company’s Annual Report on Form 10-K (Commission file number 1-3932) for the fiscal year ended December 31, 2008]
10(iii)(cc) Amendment to the Whirlpool Corporation Executive Deferred Savings Plan II (dated December 21, 2009) (Z) [Incorporated by reference from
Exhibit 10(iii)(x) to the Company’s Annual Report on Form 10-K (Commission file number 1-3932) for the fiscal year ended December 31,2009]
10(iii)(dd) Whirlpool Retirement Benefits Restoration Plan (as amended and restated effective January 1, 2009) (Z) [Incorporated by reference fromExhibit 10(iii)(dd) to the Company’s Annual Report on Form 10-K (Commission file number 1-3932) for the fiscal year ended December 31,2008]
10(iii)(ee) Whirlpool Supplemental Executive Retirement Plan (as amended and restated, effective January 1, 2009) (Z) [Incorporated by reference from
Exhibit 10(iii)(ee) to the Company’s Annual Report on Form 10-K (Commission file number 1-3932) for the fiscal year ended December 31,2008]
10(iii)(ff) Whirlpool Corporation Form of Indemnity Agreement (Z) [Incorporated by reference from Exhibit 10.1 to the Company’s Form 8-K
(Commission file number 1-3932) filed on February 23, 2006] 10(iii)(gg) Whirlpool Corporation Performance Excellence Plan (Z) [Incorporated by reference from Exhibit 10(iii)(a) to the Company’s Quarterly Report
on Form 10-Q (Commission file number 1-3932) for the quarter ended March 31, 2014]
E-4

10(iii)(hh) Whirlpool Corporation 2014 Executive Performance Excellence Plan (Z) [Incorporated by reference from Exhibit 10.1 to the Company’s Form8-K (Commission file number 1-3932) filed on April 17, 2014]
10(iii)(ii) Agreement dated May 1, 2012 by and between Whirlpool Corporation and Mr. João Carlos Costa Brega (Z) [Incorporated by reference from
Exhibit 10(iii)(ii) to the Company’s Annual Report on Form 10-K (Commission file number 1-3932) for the fiscal year ended December 31,2015]
10(iii)(jj) Transition Agreement, dated June 22, 2016, between Whirlpool Corporation and Larry M. Venturelli. [Incorporated by reference from Exhibit
10.1 to the Company’s Form 8-K (Commission file number 1-3932) filed on June 24, 2016] 12 Ratio of Earnings to Fixed Charges 21 List of Subsidiaries 23 Consent of Independent Registered Public Accounting Firm 24 Power of Attorney 31(a) Certification of Chief Executive Officer, Pursuant to Section 302 of the Sarbanes-Oxley Act of 2002 31(b) Certification of Chief Financial Officer, Pursuant to Section 302 of the Sarbanes-Oxley Act of 2002 32 Certifications Pursuant to 18 U.S.C. Section 1350, as Adopted Pursuant to Section 906 of the Sarbanes-Oxley Act of 2002 101.INS XBRL Instance Document 101.SCH XBRL Taxonomy Extension Schema Document 101.CAL XBRL Taxonomy Extension Calculation Linkbase Document 101.LAB XBRL Taxonomy Extension Label Linkbase Document 101.PRE XBRL Taxonomy Extension Presentation Linkbase Document 101.DEF XBRL Taxonomy Extension Definition Linkbase Document
E-5

EXHIBIT 12 - RATIO OF EARNINGS TO FIXED CHARGES
WHIRLPOOL CORPORATION AND SUBSIDIARIES
Year Ended December 31,
2016 2015 2014 2013 2012
Earnings Earnings before income taxes $ 1,114 $ 1,031 $ 881 $ 917 $ 558Fixed charges 220 225 222 231 256
$ 1,334 $ 1,256 $ 1,103 $ 1,148 $ 814
Fixed charges Portion of rents representative of the interest factor $ 59 $ 60 $ 57 $ 54 $ 57Interest on indebtedness 155 160 159 172 193Amortization of debt financing fees 6 5 6 5 6
$ 220 $ 225 $ 222 $ 231 $ 256
Ratio of earnings to fixed charges 6.1 5.6 5.0 5.0 3.2
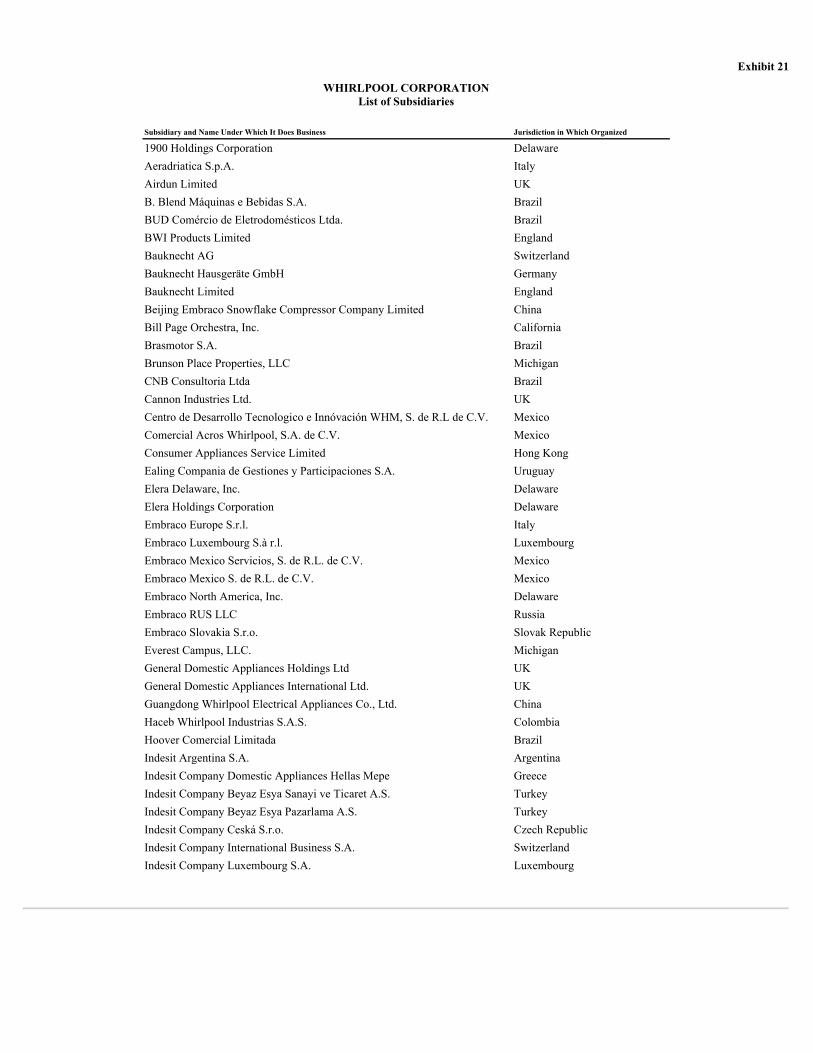
Exhibit 21
WHIRLPOOL CORPORATIONList of Subsidiaries
Subsidiary and Name Under Which It Does Business Jurisdiction in Which Organized
1900 Holdings Corporation DelawareAeradriatica S.p.A. ItalyAirdun Limited UKB. Blend Máquinas e Bebidas S.A. BrazilBUD Comércio de Eletrodomésticos Ltda. BrazilBWI Products Limited EnglandBauknecht AG SwitzerlandBauknecht Hausgeräte GmbH GermanyBauknecht Limited EnglandBeijing Embraco Snowflake Compressor Company Limited ChinaBill Page Orchestra, Inc. CaliforniaBrasmotor S.A. BrazilBrunson Place Properties, LLC MichiganCNB Consultoria Ltda BrazilCannon Industries Ltd. UKCentro de Desarrollo Tecnologico e Innóvación WHM, S. de R.L de C.V. MexicoComercial Acros Whirlpool, S.A. de C.V. MexicoConsumer Appliances Service Limited Hong KongEaling Compania de Gestiones y Participaciones S.A. UruguayElera Delaware, Inc. DelawareElera Holdings Corporation DelawareEmbraco Europe S.r.l. ItalyEmbraco Luxembourg S.à r.l. LuxembourgEmbraco Mexico Servicios, S. de R.L. de C.V. MexicoEmbraco Mexico S. de R.L. de C.V. MexicoEmbraco North America, Inc. DelawareEmbraco RUS LLC RussiaEmbraco Slovakia S.r.o. Slovak RepublicEverest Campus, LLC. MichiganGeneral Domestic Appliances Holdings Ltd UKGeneral Domestic Appliances International Ltd. UKGuangdong Whirlpool Electrical Appliances Co., Ltd. ChinaHaceb Whirlpool Industrias S.A.S. ColombiaHoover Comercial Limitada BrazilIndesit Argentina S.A. ArgentinaIndesit Company Domestic Appliances Hellas Mepe GreeceIndesit Company Beyaz Esya Sanayi ve Ticaret A.S. TurkeyIndesit Company Beyaz Esya Pazarlama A.S. TurkeyIndesit Company Ceská S.r.o. Czech RepublicIndesit Company International Business S.A. SwitzerlandIndesit Company Luxembourg S.A. Luxembourg

Subsidiary and Name Under Which It Does Business Jurisdiction in Which Organized
Indesit Company Magyarorszàg Kft HungaryIndesit Company Nordics AB SwedenIndesit Company Polska Sp. zo.o. PolandIndesit Company Singapore Pte. Ltd. SingaporeIndesit Company UK Holdings Ltd. UKIndesit International ZAO RussiaIndesit IP S.r.l. ItalyIndesit Ireland Ltd. IrelandIndesit Middle East FZE United Arab EmiratesIndesit Ukraine LLC UkraineIRE Beteiligungs GmbH GermanyIndustrias Acros Whirlpool, S.A. de C.V. MexicoJackson Appliances Ltd. UKKitchenAid Australia, Pty Ltd. AustraliaKitchenAid Delaware, Inc. DelawareKitchenAid Europa, Inc. DelawareKitchenAid, Inc. OhioKitchenAid Global, Inc. DelawareKitchenAid Promotions, LLC MichiganKitchenAid Trading Co., Ltd. ChinaLAWSA S.A. ArgentinaMLOG Armazém Geral Ltda. BrazilMaytag Limited OntarioMaytag Properties, LLC MichiganMaytag Sales, Inc. DelawareMaytag Worldwide N.V. CuraçaoMerloni Domestic Appliances Ltd. UKNineteen Hundred Corporation New YorkQingdao EECON Electronic Controls and Appliances Co., Ltd. ChinaSouth American Sales Partnership FloridaTHC Assets Corporation DelawareUp Points Serviços Empresariais S.A. BrazilWCGP Nova Scotia Co. Nova ScotiaWhirlpool (Australia) Pty. Limited AustraliaWhirlpool (B.V.I.) Limited Virgin Islands (British)Whirlpool (China) Co., Ltd. ChinaWhirlpool (China) Investment Co., Ltd. ChinaWhirlpool (Hefei) Trading Co., Ltd ChinaWhirlpool (Hong Kong) Limited Hong KongWhirlpool (Thailand) Limited ThailandWhirlpool America Holdings Corp. DelawareWhirlpool Argentina S.r.l. ArgentinaWhirlpool ASEAN Co. DelawareWhirlpool Asia B.V. Netherlands (The)Whirlpool Asia Holdings S.à r.l. Luxembourg
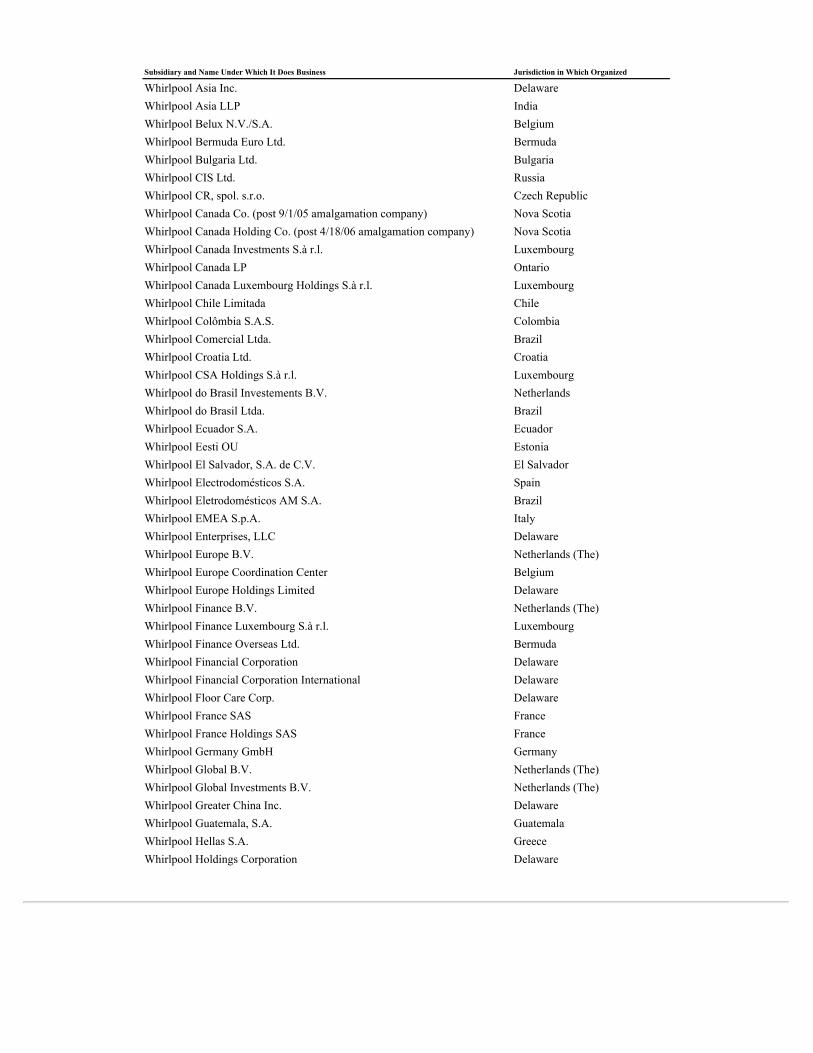
Subsidiary and Name Under Which It Does Business Jurisdiction in Which Organized
Whirlpool Asia Inc. DelawareWhirlpool Asia LLP IndiaWhirlpool Belux N.V./S.A. BelgiumWhirlpool Bermuda Euro Ltd. BermudaWhirlpool Bulgaria Ltd. BulgariaWhirlpool CIS Ltd. RussiaWhirlpool CR, spol. s.r.o. Czech RepublicWhirlpool Canada Co. (post 9/1/05 amalgamation company) Nova ScotiaWhirlpool Canada Holding Co. (post 4/18/06 amalgamation company) Nova ScotiaWhirlpool Canada Investments S.à r.l. LuxembourgWhirlpool Canada LP OntarioWhirlpool Canada Luxembourg Holdings S.à r.l. LuxembourgWhirlpool Chile Limitada ChileWhirlpool Colômbia S.A.S. ColombiaWhirlpool Comercial Ltda. BrazilWhirlpool Croatia Ltd. CroatiaWhirlpool CSA Holdings S.à r.l. LuxembourgWhirlpool do Brasil Investements B.V. NetherlandsWhirlpool do Brasil Ltda. BrazilWhirlpool Ecuador S.A. EcuadorWhirlpool Eesti OU EstoniaWhirlpool El Salvador, S.A. de C.V. El SalvadorWhirlpool Electrodomésticos S.A. SpainWhirlpool Eletrodomésticos AM S.A. BrazilWhirlpool EMEA S.p.A. ItalyWhirlpool Enterprises, LLC DelawareWhirlpool Europe B.V. Netherlands (The)Whirlpool Europe Coordination Center BelgiumWhirlpool Europe Holdings Limited DelawareWhirlpool Finance B.V. Netherlands (The)Whirlpool Finance Luxembourg S.à r.l. LuxembourgWhirlpool Finance Overseas Ltd. BermudaWhirlpool Financial Corporation DelawareWhirlpool Financial Corporation International DelawareWhirlpool Floor Care Corp. DelawareWhirlpool France SAS FranceWhirlpool France Holdings SAS FranceWhirlpool Germany GmbH GermanyWhirlpool Global B.V. Netherlands (The)Whirlpool Global Investments B.V. Netherlands (The)Whirlpool Greater China Inc. DelawareWhirlpool Guatemala, S.A. GuatemalaWhirlpool Hellas S.A. GreeceWhirlpool Holdings Corporation Delaware

Subsidiary and Name Under Which It Does Business Jurisdiction in Which Organized
Whirlpool Home Appliances B.V. Netherlands (The)Whirlpool Home Appliances Limited Liability Company TurkeyWhirlpool Hungarian Trading Limited Liability Company HungaryWhirlpool India Holdings Limited DelawareWhirlpool of India Limited IndiaWhirlpool Insurance Company, Ltd. BermudaWhirlpool Internacional S. de R.L. de C.V. MexicoWhirlpool International GmbH SwitzerlandWhirlpool International Holdings S.à r.l. LuxembourgWhirlpool International Manufacturing S.à r.l. LuxembourgWhirlpool Ireland Limited IrelandWhirlpool Italia Holdings S.r.l. ItalyWhirlpool Italia S.r.l. ItalyWhirlpool Japan Co., Ltd. JapanWhirlpool Japan Inc. DelawareWhirlpool Kazakhstan LLP Kazakhstan Whirlpool Latin America Corporation DelawareWhirlpool Latvia S.I.A. LatviaWhirlpool Lietuva UAB LithuaniaWhirlpool Ltd Belgrade SerbiaWhirlpool Luxembourg Holdings S.à r.l. LuxembourgWhirlpool Luxembourg Investments S.à r.l. LuxembourgWhirlpool Luxembourg S.à r.l. LuxembourgWhirlpool Luxembourg Ventures S.à r.l. LuxembourgWhirlpool Management Services S.a.g.l. SwitzerlandWhirlpool Maroc S. à r.l. MoroccoWhirlpool Mauritius Limited MauritiusWhirlpool MEEA DMCC United Arab EmiratesWhirlpool Mexico, S.A. de C.V. MexicoWhirlpool Mexico Holdings LLC DelawareWhirlpool Mexico Ventures LLC DelawareWhirlpool Microwave Products Development Limited Hong KongWhirlpool NAAG Holdings Corporation DelawareWhirlpool NAR Holdings, LLC DelawareWhirlpool Nederland B.V. Netherlands (The)Whirlpool Nordic A/S DenmarkWhirlpool Nordic AB SwedenWhirlpool Nordic OY FinlandWhirlpool Nordic AS NorwayWhirlpool Oceania Inc. DelawareWhirlpool Österreich GmbH AustriaWhirlpool Overseas Holdings, LLC DelawareWhirlpool Overseas Hong Kong Limited Hong KongWhirlpool Overseas Manufacturing S.ár.l. LuxembourgWhirlpool Peru S.R.L. PeruWhirlpool Polska Appliances Sp. z o.o. Poland

Subsidiary and Name Under Which It Does Business Jurisdiction in Which Organized
Whirlpool Polska Sp. z o.o. PolandWhirlpool Portugal, S.A. PortugalWhirlpool Product Development (Shenzhen) Company Limited ChinaWhirlpool Properties, Inc. MichiganWhirlpool Puntana S.A. ArgentinaWhirlpool R&D S.r.l. ItalyWhirlpool Realty Corporation DelawareWhirlpool Romania S.r.l. RomaniaWhirlpool RUS LLC RussiaWhirlpool S.A. BrazilWhirlpool SSC Limited IrelandWhirlpool Slovakia spol. s.r.o. Slovak RepublicWhirlpool Slovakia Home Appliances spol. s.r.o. Slovak RepublicWhirlpool South Africa (Proprietary) Limited South AfricaWhirlpool Southeast Asia Pte SingaporeWhirlpool Sweden Aktiebolag SwedenWhirlpool Taiwan Co., Ltd. TaiwanWhirlpool Technologies, LLC MichiganWhirlpool UK Appliances Limited UKWhirlpool UK Pension Scheme Trustee Limited EnglandWhirlpool Ukraine LLC UkraineWhirlpool WW Holdings B.V. Netherlands (The)Xpelair Ltd. UK
Exhibit 23
CONSENT OF INDEPENDENT REGISTERED PUBLIC ACCOUNTING FIRM
We consent to the incorporation by reference in the following Registration Statements:
Registration Statements of Whirlpool Corporation33-34037 333-90602 333-150942333-77167 333-125260 333-157392333-42322 333-128686 333-166484 333-143372 333-181339 333-187948
333-203704
Registration Statement of Whirlpool Finance Luxembourg S.a.r.l333-203704-1 Registration Statements of Whirlpool Corporationpertaining to the Whirlpool Savings Plan
33-26680 33-53196
Registration Statements of Whirlpool Corporationpertaining to the Whirlpool 401(k) Retirement Plan
333-66163 333-138711 333-179695 Registration Statement of Whirlpool Corporationpertaining to the Maytag Corporation Salary Savings Plan, Maytag Corporation DeferredCompensation Plan and Maytag Corporation Deferred Compensation Plan II
333-132875 Registration Statements of Maytag Corporationpertaining to the Maytag Corporation Deferred Compensation and Salary Savings Plans
333-102002 333-101995 333-121368
of our reports dated February 13, 2017 , with respect to the consolidated financial statements and schedule of Whirlpool Corporation and the effectiveness ofinternal control over financial reporting of Whirlpool Corporation, included in this Annual Report (Form 10-K) for the year ended December 31, 2016 .
/s/ Ernst & Young LLP
Chicago, IllinoisFebruary 13, 2017

Exhibit 24
POWER OF ATTORNEY
KNOW ALL MEN BY THESE PRESENTS, that each of the undersigned, being a director or officer, or both, of WHIRLPOOL CORPORATION, aDelaware corporation (hereinafter called the “Corporation”), does hereby constitute and appoint JEFF M. FETTIG and KIRSTEN J. HEWITT, with full power toeach of them to act alone, as the true and lawful attorneys and agents of the undersigned, with full power of substitution and resubstitution to each of said attorneys,to execute, file or deliver any and all instruments and to do all acts and things which said attorneys and agents, or any of them, deem advisable to enable theCorporation to comply with the Securities Act of 1933, as amended, the Securities Exchange Act of 1934, as amended, and any requirements of the Securities andExchange Commission in respect thereof, in connection with the filing under said Securities Exchange Act of the Corporation's Annual Report on Form 10-K forthe year ended December 31, 2016 , including specifically, but without limitation of the general authority hereby granted, the power and authority to sign his or hername as a director or officer, or both, of the Corporation, as indicated below opposite his or her signature, to the Annual Report on Form 10-K, or any amendment,post-effective amendment, or papers supplemental thereto to be filed in respect of said Annual Report on Form 10-K; and each of the undersigned does herebyfully ratify and confirm all that said attorneys and agents, or any of them, or the substitute of any of them, shall do or cause to be done by virtue hereof.
IN WITNESS WHEREOF, each of the undersigned has subscribed these presents, as of the 13 th day of February, 2017 .
Signature Title
/s/ JEFF M. FETTIG Director, Chairman of the Board and Chief Executive Officer
(Principal Executive Officer)Jeff M. Fettig
/s/ MARC R. BITZER Director, President and Chief Operating Officer
Marc R. Bitzer
/s/ JAMES W. PETERS Executive Vice President and Chief Financial Officer
(Principal Financial Officer)James W. Peters
/s/ JOSEPH A. LOVECHIO Vice President and Corporate Controller
(Principal Accounting Officer)Joseph A. Lovechio
/s/ SAMUEL R. ALLEN DirectorSamuel R. Allen
/s/ GARY T. DICAMILLO Director
Gary T. DiCamillo
/s/ DIANE M. DIETZ DirectorDiane M. Dietz
/s/ GERRI T. ELLIOTT Director
Gerri T. Elliott
/s/ MICHAEL F. JOHNSTON DirectorMichael F. Johnston
/s/ JOHN D. LIU Director
John D. Liu
/s/ HARISH MANWANI Director
Harish Manwani
/s/ WILLIAM D. PEREZ DirectorWilliam D. Perez
/s/ LARRY O. SPENCER Director
Larry O. Spencer
/s/ MICHAEL D. WHITE DirectorMichael D. White

Exhibit 31.1
CERTIFICATION PURSUANT TO SECTION 302 OF THE SARBANES-OXLEY ACT OF 2002
I, Jeff M. Fettig, certify that:
1. I have reviewed this annual report on Form 10-K of Whirlpool Corporation;
2. Based on my knowledge, this report does not contain any untrue statement of a material fact or omit to state a material fact necessary to make thestatements made, in light of the circumstances under which such statements were made, not misleading with respect to the period covered by this report;
3. Based on my knowledge, the financial statements, and other financial information included in this report, fairly present in all material respects thefinancial condition, results of operations and cash flows of the registrant, as of, and for, the periods presented in this report;
4. The registrant’s other certifying officer and I are responsible for establishing and maintaining disclosure controls and procedures (as defined in ExchangeAct Rules 13a-15(e) and 15d-15(e)) and internal control over financial reporting (as defined in Exchange Act Rule 13a-15(f) and 15d-15(f)) for theregistrant and have:
(a) Designed such disclosure controls and procedures, or caused such disclosure controls and procedures to be designed under our supervision, toensure that material information relating to the registrant, including its consolidated subsidiaries, is made known to us by others within thoseentities, particularly during the period in which this report is being prepared;
(b) Designed such internal control over financial reporting, or caused such internal control over financial reporting to be designed under oursupervision, to provide reasonable assurance regarding the reliability of financial reporting and the preparation of financial statements forexternal purposes in accordance with generally accepted accounting principles;
(c) Evaluated the effectiveness of the registrant’s disclosure controls and procedures and presented in this report our conclusions about theeffectiveness of the disclosure controls and procedures, as of the end of the period covered by this report based on such evaluation; and
(d) Disclosed in this report any change in the registrant’s internal control over financial reporting that occurred during the registrant’s most recentfiscal quarter (the registrant’s fourth fiscal quarter in the case of an annual report) that has materially affected, or is reasonably likely tomaterially affect, the registrant’s internal control over financial reporting; and
5. The registrant’s other certifying officer and I have disclosed, based on our most recent evaluation of internal control over financial reporting, to theregistrant’s auditors and the audit committee of the registrant’s board of directors (or persons performing the equivalent functions):
(a) All significant deficiencies and material weaknesses in the design or operation of internal control over financial reporting which are reasonablylikely to adversely affect the registrant’s ability to record, process, summarize and report financial information; and
(b) Any fraud, whether or not material, that involves management or other employees who have a significant role in the registrant’s internal controlover financial reporting.
Date: February 13, 2017 /s/ JEFF M. FETTIG
Name: Jeff M. FettigTitle:
Chairman of the Board and
Chief Executive Officer
Exhibit 31.2
CERTIFICATION PURSUANT TO SECTION 302 OF THE SARBANES-OXLEY ACT OF 2002
I, James W. Peters, certify that:
1. I have reviewed this annual report on Form 10-K of Whirlpool Corporation;
2. Based on my knowledge, this report does not contain any untrue statement of a material fact or omit to state a material fact necessary to make thestatements made, in light of the circumstances under which such statements were made, not misleading with respect to the period covered by this report;
3. Based on my knowledge, the financial statements, and other financial information included in this report, fairly present in all material respects thefinancial condition, results of operations and cash flows of the registrant, as of, and for, the periods presented in this report;
4. The registrant’s other certifying officer and I are responsible for establishing and maintaining disclosure controls and procedures (as defined in ExchangeAct Rules 13a-15(e) and 15d-15(e)) and internal control over financial reporting (as defined in Exchange Act Rule 13a-15(f) and 15d-15(f)) for theregistrant and have:
(a) Designed such disclosure controls and procedures, or caused such disclosure controls and procedures to be designed under our supervision, toensure that material information relating to the registrant, including its consolidated subsidiaries, is made known to us by others within thoseentities, particularly during the period in which this report is being prepared;
(b) Designed such internal control over financial reporting, or caused such internal control over financial reporting to be designed under oursupervision, to provide reasonable assurance regarding the reliability of financial reporting and the preparation of financial statements forexternal purposes in accordance with generally accepted accounting principles;
(c) Evaluated the effectiveness of the registrant’s disclosure controls and procedures and presented in this report our conclusions about theeffectiveness of the disclosure controls and procedures, as of the end of the period covered by this report based on such evaluation; and
(d) Disclosed in this report any change in the registrant’s internal control over financial reporting that occurred during the registrant’s most recentfiscal quarter (the registrant’s fourth fiscal quarter in the case of an annual report) that has materially affected, or is reasonably likely tomaterially affect, the registrant’s internal control over financial reporting; and
5. The registrant’s other certifying officer and I have disclosed, based on our most recent evaluation of internal control over financial reporting, to theregistrant’s auditors and the audit committee of the registrant’s board of directors (or persons performing the equivalent functions):
(a) All significant deficiencies and material weaknesses in the design or operation of internal control over financial reporting which are reasonablylikely to adversely affect the registrant’s ability to record, process, summarize and report financial information; and
(b) Any fraud, whether or not material, that involves management or other employees who have a significant role in the registrant’s internal controlover financial reporting.
Date: February 13, 2017 /s/ JAMES W. PETERS
Name: James W. PetersTitle:
Executive Vice Presidentand Chief Financial Officer
Exhibit 32.1
Certifications Pursuant to18 U.S.C. Section 1350,as Adopted Pursuant to Section 906 of theSarbanes-Oxley Act of 2002
In connection with the Annual Report on Form 10-K of Whirlpool Corporation (“Whirlpool”) for the quarterly period ended December 31, 2016 as filed with theSecurities and Exchange Commission on the date hereof (the “Report”), Jeff M. Fettig, as Chief Executive Officer of Whirlpool, and James Peters, as ChiefFinancial Officer of Whirlpool, each hereby certifies, pursuant to 18 U.S.C. Section 1350, as adopted pursuant to Section 906 of the Sarbanes-Oxley Act of 2002,that, to his knowledge:
1. The Report fully complies with the requirements of Section 13(a) or 15(d) of the Securities Exchange Act of 1934; and
2. The information contained in the Report fairly represents, in all material respects, the financial condition and results of operations of Whirlpool.
/s/ JEFF M. FETTIGName: Jeff M. FettigTitle:
Chairman of the Board and
Chief Executive Officer
Date: February 13, 2017 /s/ JAMES W. PETERS
Name: James W. PetersTitle:
Executive Vice President and
Chief Financial Officer
Date: February 13, 2017