where’s the insider advantage? - civitas · where’s the insider advantage? a review of the...
TRANSCRIPT

Where’s the Insider
Advantage?


Where’s the Insider
Advantage?A review of the evidence
that withdrawal from the EU would not harm the UK’s exports or foreign investment in the UK
Michael Burrage
Institute for the Study of Civil Society · London
www.civitas.org.uk
First published in book form October 2014
Part I: A comparative study of UK exports to EU and non-EU nations between 1960 and 2012, first published as a Civitas online report May 2014
Part II: The impact of the EU on foreign direct investment in the UK from 1970 to 2011, first published as a Civitas online report June 2014
© Civitas 2014 55 Tufton Street
London SW1P 3QL
email: [email protected]
All rights reserved
ISBN: 978-1-906837-65-5
Independence: Civitas: Institute for the Study of Civil Society is a registered educational charity (No. 1085494) and a company limited by guarantee (No. 04023541). Civitas is
financed from a variety of private sources to avoid over-reliance on any single or small group of donors.
All publications are independently refereed. All the Institute’s publications seek to further its objective of promoting the advancement of learning. The views expressed are those of the
authors, not of the Institute.
Designed and typeset by Richard Kelly
Printed in Great Britain by Berforts Group Ltd
Stevenage, SG1 2BH

www.civitas.org.uk
ContentsAuthor vii
Acknowledgements vii
Table of Abbreviatons viii
Preface ix
Part I: A comparative study of UK exports to EU and non-EU nations between 1960 and 2012
1. A 39-year-old argument 3
2. How can we identify insider advantages? 6
3. A view of the half-century 1960–2012 10
4. The top 35 fastest-growing exporters to the EU 14
5. A backwards glance at the Common Market 21
6. And further back, to the pre-entry years 28
7. Are services any different? 30
8. Do UK exporters need an insider advantage? 34
9. A country with neither heft nor clout 39
10. Measuring the benefits of the EU’s trade agreements 45
11. On the opportunity costs of EU solidarity 53
12. UK exports to new member states 59
13. A final look at the UK versus 11 outsiders 62
14. Twenty-one findings of this search 64
Conclusion 69
Part II: The impact of the EU on foreign direct investment in the UK from 1970 to 2011
Introduction 75
FDI: a suspicion becomes a fact 76
Inference and evidence about FDI 78
UNCTAD vs OECD: differences and disagreements of the two authoritative sources 81

www.civitas.org.uk
The problem of Special Purpose Entities 83
A search for hidden SPEs 86
The ever-shrinking control group 90
1. Did entry to the Common Market in 1973 boost FDI in the UK? 94
Has membership been of lasting benefit? 99
2. Did declining to join the euro adversely affect FDI in the UK? 108
The warning from the big business lobby 109
The post-euro fall in the UK share of FDI flows to the EU 110
Shares of FDI inflows to Europe pre- and post-euro: winners and losers 112
Shares of FDI stock in Europe pre- and post-euro: winners and losers 114
Growth of FDI inflows to Europe pre- and post-euro 117
Growth of FDI stock in Europe pre- and post-euro 119
How to tell the truth and mislead the reader 122
3. Has the Single Market attracted FDI to the UK ? 123
A revived pro-EU business lobby gives a different warning 123
Growth of FDI flows and stock under the Single Market 125
4. A summary of the findings, with short answers to the three questions 133
5. On claims and warnings about FDI in debates about the EU 140
Appendix A: OECD vs UNCTAD: inward FDI flows and FDI stock 146
Appendix B: UNCTAD vs OECD: side by side comparisons 150
Appendix C: Obiter dicta of the Britain in Europe case for joining the euro 153
Notes 155

vii
www.civitas.org.uk
AuthorMichael Burrage is a director of Cimigo which is based in Ho Chi Minh City, Vietnam,
and conducts market and corporate strategy research in China, India and 12 countries
in the Asia Pacific region. He is also a founder director of a start-up specialist telecom
company which among other things provides the free telephone interpreter service
for aid workers and others in Afghanistan at www.afghaninterpreters.org.
He is a sociologist by training, was a Fulbright scholar at the University of Pennsylvania,
and lectured at the London School of Economics for many years, specialising in
cross-national analysis of industrial enterprise and professional institutions. His
years there were, however, interrupted by spells as a research fellow at Harvard, at
the Swedish Collegium of Advanced Study, Uppsala, at the Free University of Berlin
and at the Center for Higher Education Studies and the Institute of Government of
the University of California Berkeley. He has been British Council lecturer at the
University of Pernambuco, Recife, Brazil, and also a visiting professor at Kyoto,
Hokkaido, Kansai and Hosei universities in Japan.
He has written articles in a number of American, European and Japanese sociological
journals, conducted a comparative study of telephone usage in Tokyo, Manhattan,
Paris and London for NTT, and a study of British entrepreneurs for Ernst & Young.
His recent publications include Revolution and the Making of the Contemporary
Legal Profession: England, France and the United States (OUP) 2006 and Class
Formation, Civil Society and the State: A comparative analysis of Russia, France,
the United States and England (Palgrave Macmillan) 2008. He edited Martin Trow:
Twentieth-century higher education: from elite to mass to universal (Johns Hopkins)
2010. He recently contributed to Professionen, Eigentum und Staat: Europäische
Entwicklungen im Vergleich -19. und 20. Jahrhundert, (Wallstein Verlag) 2014.
AcknowledgementsWithout the critical reviews of various members of the Civitas team, and in particular
those of Jonathan Lindsell and Nigel Williams, this book would have been very much
poorer than it is. It owes a great deal to them. The mistakes that remain are mine
alone.

www.civitas.org.uk
viii
Table of AbbreviationsBCC British Chambers of Commerce BIS Department for Business, Innovation & Skills (UK Government)BIT Bilateral Investment TreatyCAGR Compound Annual Growth RateCBI Confederation of British IndustryEBOPS Extended Balance of Payments Services ClassificationEC European Commission or European CommunityECM European Common MarketEEA European Economic AreaEEC European Economic CommunityEFTA European Free Trade Association EMU European Monetary Union EU European UnionEU 11 (12) EU members before 1995: Belgium, Denmark, France, Germany, Greece,
Ireland, Italy, Luxembourg, the Netherlands, Portugal, Spain (UK)EU 13 EU members before 2004 less Belgium and Luxembourg, i.e. Austria,
Denmark, Finland, France, Germany, Greece, Ireland, Italy, Netherlands, Portugal, Spain, Sweden, UK
EU 14 (15) EU members before 2004: Austria, Belgium, Denmark, Finland, France, Germany, Greece, Ireland, Italy, Luxembourg, Netherlands, Portugal, Spain, Sweden (UK)
Eurozone 11 The first EU members to use the Euro currency: Austria, Belgium, Finland, France, Germany, Ireland, Italy, Luxembourg, Netherlands, Portugal, Spain
FCO Foreign and Commonwealth Office (UK Government) FDI Foreign Direct InvestmentFTA Free Trade Agreement/AreaGDP Gross Domestic ProductGDP(PPP) GDP by purchasing power parity GFCF Gross Fixed Capital FormationHMG Her Majesty’s GovernmentIMF International Monetary FundIPPA Investment Promotion and Protection AgreementMercosur South American common marketMiFID Markets in Financial Instruments DirectiveNAFTA North American Free Trade AgreementNTBs Non-tariff barriersOECD Organisation for Economic Co-operation and DevelopmentOFC Offshore Financial CentreONS Office for National Statistics SPE Special Purpose Entity (financial instrument)TTIP Transatlantic Trade and Investment Partnership UIC Ultimate Investment CountryUKIP United Kingdom Independence PartyUNCTAD United Nations Conference on Trade and DevelopmentWTO World Trade Organisation

ix
www.civitas.org.uk
PrefaceThe two papers that constitute this report were written by a voter who has grown
tired of the case being made for continued membership of the EU, or in defence
of the Single Market, by members of the UK political elite who have declined, over
many years, either to collect or to present any convincing evidence to support their
arguments.
Why they have declined to collect evidence systematically is still a bit of a mystery.
Among those most ready to speak fervently, and often eloquently, in favour of the
European Union, or of the merits of the Single Market, are ex-prime ministers and
ex-chancellors, ex-cabinet ministers, ex-EU commissioners, many of whom once
had the power to initiate regular, detailed, systematic monitoring of the impact
of the EU on the UK’s economy that would have informed public debate. They
declined to do so and speak now as if the high offices they once held give them
some special exemption from the ordinary rules of debate, and as if, by confidently
and constantly repeating their arguments, they will obtain credibility, even without
evidence. They won’t, and the widespread scepticism about the institutions they
support demonstrates that.
Since the sources of data that might demonstrate whether their arguments have
any merit are readily accessible, I decided to look at them, in my spare time, in the
hope of finding evidence that might corroborate their views. These two papers are
the result. As will be clear, I failed to find much support for those who repeat two of
the more well-trodden themes in the EU debate: that the Single Market has been of
immense benefit to UK trade; and that, outside it, foreign investors would desert this
lonely little island.
Perhaps other researchers will be more successful, but for the moment, I am inclined
to the view that if the case for the Single Market rests on its help to UK exports, it
is a poor one. To those with whom I spar on such matters, and there are a few, I
am inclined to say: ‘Defend the Single Market any way you wish, but do not argue
it is good for British exports. It isn’t, and has never been, so on that score you don’t
have a case.’ I make a similar reply whenever the FDI scare is raised. None of
us understand the causal dynamics of investment decisions, so before frightening
yourself and others with what might happen to the UK, look at the best available
evidence about how other independent countries have fared. I sometimes add: ‘If
you don’t believe my presentation of it, then go and look the EC’s own reports. They
have long since abandoned the idea that the Single Market is a magnet for foreign
investors.’

www.civitas.org.uk
x • Where’s The Insider Advantage?
These papers are no more than reporting evidence that anyone can consult, resting
on no scientific method other than observation and comparison. Many economists
will no doubt find such descriptive statistics elementary, even simplistic, and would
prefer to incorporate the raw data presented in a model of some kind which would
allow one simultaneously to assess the impact of the many other factors that affect
both UK exports and foreign direct investment. Obviously, at several points in these
searches, I wished I could do it, but then doubted that I really wanted to do it. Such
models come at a price of making assumptions and estimates, and finding debatable
proxies, and pretty soon one begins to lose contact with the real world, leaving only
a tiny group of fellow specialists who can assess the trustworthiness of the model. I
remain therefore a little sceptical of their merits.
Who can forget Rose’s much-discussed model that predicted: ‘British trade with
euroland may eventually triple as a result of British entry into EMU, conceivably
resulting in… a 20 per cent boost to British GDP in the long run.’ He went on to urge
the UK to ‘seriously consider whether it wishes to forgo this historic opportunity for
an enormously beneficial expansion of its European trade’.1 And somehow or other, I
have never come across a prediction from the EC’s own models, or from those of its
commissioned contractors, that predicts anything other than good things for everyone
providing we have ‘more Europe’. It is almost as if they had been set to avoid bad
news. And yet, at the same time, ever since the Single Market commenced in 1993,
the inhabitants of the EU have suffered from an unemployment rate invariably two,
and often many more, points higher than the mean of other OECD countries, almost
invariably more than double that of the three European countries that have declined
to join the EU, and consistently far more severe in terms of duration than the mean of
other OECD countries.2 It has been a club of high and severe unemployment. There
is still a role for simply reporting what has actually happened, good news or bad.
There are, of course, a few contrary spirits who have been and are determined that
the EU debate should not proceed as a debate without evidence. One of the more
notable is the former Chancellor and Prime Minister Gordon Brown, who initiated
the process for the evaluation of the five tests which should be met before the UK
joined the euro, a constitutional tweak for which he deserves great credit. Launched
from within the Treasury but open to any interested parties who had something to
say that was worth hearing, the process was impartial, extremely thorough, and as a
result its recommendation was wholly convincing.3 A private initiative worthy of note
is Tim Congdon’s study of the costs of EU membership for UKIP.4 Which of the major
parties, one may ask, has conducted as serious, as thorough or as knowledgeable

Preface • xi
www.civitas.org.uk
an analysis? Which of them has even attempted to promote debate by publishing a
rejoinder? The Balance of Competences Review of the FCO may be another useful
contribution. At first glance, it may appear to be more of an expression of informed
opinion rather than a mine of research, but nonetheless it deserves careful analysis.
If these two papers provoke another researcher, with or without a model, to try to
show that their conclusions are wrong, either by identifying benefits of the Single
Market for British exporters that have so far eluded me, or by demonstrating, despite
the evidence that I have assembled, that as an independent country the UK would
be unattractive to foreign investors, then they will have served a useful purpose.


PART IA comparative study of UK exports to EU and non-EU
nations between 1960 and 2012

A comparative study of UK exports to EU and non-EU nations between 1960 and 2012 • 3
www.civitas.org.uk
1. A 39-year-old argumentIn 1975, when Harold Wilson’s Labour Government sought to make the case for a
Yes vote in the 1975 referendum on membership of the European Common Market,
one of the arguments in the pamphlet sent to every household in the country was
that:
Inside, on the improved terms, we remain part of the world’s most powerful trading
bloc. We can help to fix the terms of world trade… Outside, we are on our own… We
would have to try to negotiate some special free trade arrangement, a new Treaty…
But… until it was in force, Britain’s exports to the common market would be seriously
handicapped. Britain would no longer have any say in the future economic and
political development of the common market. We would just be outsiders looking
in… Other countries have made … special arrangements with the Community. They
might find Community decisions irksome, even an interference with their affairs. But
they have no part in making those decisions.1
It has proved to be a remarkably durable argument. It might be said perhaps to have
stood the test of time, though of nothing else it must be added, since it has been
subject to rather little critical scrutiny or revision over the intervening years. Instead,
Mr Wilson’s successors have been content to reprise his arguments, and often his
words, occasionally elaborating on them by contrasting the insider advantage that
the UK has enjoyed as a member of the EU with the disadvantages of those outside
it who have taken no part in the making of the rules, whether half outside such
as Norway and Switzerland, or those fully outside in the wider world who face the
remaining tariff barriers of the EU.
Over the past eighteen months or so, unsettled by the prospect of a referendum
and rising opinion poll support for UKIP, members of the UK’s current political elite
have sought to rally support for membership of the EU in terms very similar to those
used by Mr Wilson, almost as if nothing that the EU has done since 1975, and
nothing that the UK has experienced as a member, could provide a more convincing,
appealing, or contemporary argument for continued membership than the uncertain,
and possibly difficult, prospects of life outside it. In the peroration of his contribution
to a conference of the Confederation of British Industry (CBI) in November 2012,
the leader of the Labour Party, Ed Miliband invited his audience to sympathise with
‘voiceless, powerless’ Norway, and raised the spectre of the UK ‘standing alone’
while ‘the terms of trade would be dictated by others’. In the edited version of his
speech, his argument was rephrased as follows:

www.civitas.org.uk
4 • Where’s The Insider Advantage?
Those in favour of leaving the EU say we could still be part of the Single Market.
They may be right. But who would set the rules? Not us. It would be those within the
European Union. We would live by rules that we have no say in making ourselves.
Still contributing to the EU Budget, as Norway does, but voiceless and powerless.
Unable to change the terms of trade… The best place for Britain is to be at the table,
seeking to shape the economic direction of Europe. Do we want to be inside the
room? Or do we want to guarantee ourselves a place outside the room? And then
think about the world trade talks. If we left the EU, be under no illusions, it would be
the United States, China, the European Union in the negotiating room, literally eating
our lunch, and Britain in the overflow room.2
Two weeks later, at the end of November, in a speech at Chatham House, organised
by the big business pro-EU group Business for New Europe, the former Prime
Minister, Tony Blair, contrasted the past and present ‘rationale for Europe’. Sixty-six
years ago ‘when the project began… it was peace. Today it is power… in this new
world, to leverage power, you need the heft of the EU.’ This led him to conclude that
one of the three major disadvantages of leaving the EU was that ‘we would be out of
the decision-making process determining the rules of the Single Market’.3
On 10 December 2012, in a speech to the Parliamentary Press Gallery, the present
Prime Minister warned of the ‘Norway option’… of being ‘governed by fax’ from
Brussels and ‘unable to influence the EU’s laws’. Six weeks later, 23 January 2013,
when outlining his plans for a referendum on British membership of the European
Union, he repeated the warning. ‘Norway has no say at all in setting (EU) rules. It
just has to implement its directives.’ He then stressed, more emphatically than any
of the others, the critical importance of the insider advantage. ‘Our participation in
the Single Market, and our ability to help set its rules, is the principal reason for our
membership of the EU.’4
In May 2013, in an article in The Daily Telegraph, Peter Mandelson, a former EC
commissioner, added his contribution. He sought to discredit what he chose to call
the ‘anti-Europeans’ argument… that we can continue trading at will in Europe, with
the same privileges as now, without being part of its policy-making, its regulatory
rules and its policing of the market’s openness. This is a grave deception.’5
These and other speeches and articles appear to have been part of an orchestrated
campaign, with the same arguments and often the same words in all of them.
Unfortunately, they also seem to have agreed that no evidence at all would be
required about specific insider advantages, or about any benefits or ‘privileges’ that

A comparative study of UK exports to EU and non-EU nations between 1960 and 2012 • 5
www.civitas.org.uk
the UK has obtained from the rules it has helped to make.
Mr Miliband’s reference to the ‘terms of trade’ was as close as he came to a specific
example, but much as the EC might have wished to do so, it seems unlikely that the
EU has ever been able to ‘dictate’ or ‘change’ the terms of trade, at least as these are
normally understood.6 One would have thought that Mr Blair’s years in office might
have given him a few telling illustrations to help his case, but he declined to mention
any. And none at all are worth mentioning in the 700 pages of his autobiography.
Mr Cameron only gave an example which rather contradicted his argument, where
the UK was not voiceless but was nonetheless powerless. He was referring to the
EC’s Working Time Directive. ‘We cannot,’ he said, ‘harmonise everything… it is
neither right nor necessary to claim that the integrity of the Single Market, or full
membership of the European Union, requires the working hours of British hospital
doctors to be set in Brussels, irrespective of the views of British parliamentarians
and practitioners.’7
One might at first, without thinking, take Mr Mandelson, as a former EU commissioner,
to be an informed witness, or even living proof, of the UK’s insider advantage.
However, like all commissioners, he has sworn before the European Court to act ‘in
the general interest of the Union’ rather than the UK, so he may well be among the
less informed and less reliable witnesses to any insider advantages , or ‘privileges’
as he put it, obtained by Britain. In any event, he felt no need to say what these
‘privileges’ might be, or how UK exporters had benefited from them.
Constant repetition of an argument by apparently informed past and present office-
holders no doubt helps to embed it in the public mind, but it does not make it any more
correct, nor does it mean that no evidence is required to support it. The advantages
the UK has obtained by being an EU insider, and helping to set the Single Market
rules, remain in the dark. In this paper, I will try to identify them.
www.civitas.org.uk
6 • Where’s The Insider Advantage?
2. How can we identify insider advantages?The most direct way in which these insider advantages might be identified would be
to pick one or more regulations or directives where the UK has taken a distinctive
position which other members were initially not inclined to support, but where, by
making alliances, by force of argument and weight of evidence, doughty British
insiders eventually prevailed, to the benefit of UK trade with other members and to
the disadvantage of outsiders.
The chances of doing this with any precision seem remote. The UK Permanent
Representative in Brussels recently sought patiently to explain the extraordinarily
complex web of relationships that form the EU legislative process to members of
the Commons European Scrutiny Committee.1 They are at best opaque, and parts
are of course confidential and completely hidden, so it seems doubtful whether
any researcher could identify who was responsible for any of the more than three
thousand EC directives and regulations that together form the Single Market, let
alone determine what the advantages for insiders might have been.2
As it happens, a recent report by Europe Economics for the Department for Business,
Innovation & Skills (BIS) analysed the British influence on EU efforts ‘to create/
deepen the Single Market’ during the Financial Services Action Plan 1998–2006. It
focused specifically on the Markets in Financial Instruments Directive (MiFID).3 In
this instance, policymakers had decided that British practice was best, and the MiFID
therefore ‘closely reflected British norms and policy theories’, and in many respects
‘mimicked UK practice’. It might therefore be considered as a perfect example of the
UK’s insider advantage. If the UK had not been a member of the EU, it hardly seems
likely that the EU would have been inclined to follow British practice quite so closely.
However, as Europe Economics point out, it was able to exercise such influence
largely because of favourable circumstances at the time: the EU was then seeking to
liberalise the financial services and the UK was then thought to embody international
best regulatory practice. Since the financial crisis, circumstances have changed
fundamentally. The EU is now seeking to restrict and control the financial sector,
and is no longer looking to the UK for inspiration or guidance. Far from it. Hence, the
second half of Europe Economics’ analysis largely consists of explaining why UK
influence is likely to be insignificant or negligible in the foreseeable future, and why
the UK should probably expect to be overruled or outvoted, as it already has been
on the bonus cap, though it might yet win on that issue in the European Court. The
UK may still be the leading player in financial services within the EU, but its insider

A comparative study of UK exports to EU and non-EU nations between 1960 and 2012 • 7
www.civitas.org.uk
advantages have not merely disappeared, but turned into disadvantages. A bonus
cap is not being proposed in New York, Zurich or Hong Kong.
Financial services is the most closely watched and best reported sector of the
British economy. The idea that we could conduct similar analyses of the waxing
and waning of the insider advantages of a representative sample of other sectors
to determine the net balance of insider advantages and disadvantages from UK
participation in EU rule-setting, even with the full-hearted collaboration of Messrs
Miliband, Blair, Cameron and Mandelson and others convinced of their existence,
seems improbable.
Maybe the best evidence will eventually come from outsiders who feel that EU
members’ insider advantages have worked to their disadvantage when competing
in EU markets. Such an opportunity might occur now that the EU has opened
negotiations with the United States about a Transatlantic Trade and Investment
Partnership (TTIP). An American negotiator might perhaps, in due course, identify
the insider advantages or ‘privileges’ that they consider protectionist, and would like
to see removed. We will have to wait and see.
At present, the only circumstance where responsibility can be clearly identified is
when a country exercises its veto, but that, of course, is only to prevent something,
presumably a potential disadvantage, from happening. On every other occasion, the
rules simply emerge, as the Prime Minister put it when referring to the Working Time
Directive, from ‘Brussels’, without anyone being quite sure which pressure group
or party or country, or group of countries, or committee, or official or commissioner,
should be held to account. In practice, one wonders if, from the point of view of the
average person, and in terms of participation in debate in the media, blogosphere,
pub or living room, Norway’s ‘government by fax’ feels so distinctive.4
Every member country of the EU seems to be governed for much of the time in much
the same way, not knowing what their representatives said or did, or how or when or
why a particular directive or regulation was debated or agreed. As one expert, whose
career is devoted to understanding and teaching EU governance, and who is ‘very
strongly supportive of the European Union’, put it: ‘It is not clear who is responsible
for what. It is not clear what coalitions governed on what issues, what the majority
was on what issues, or who were the winners and losers.’5
The regulation on how restaurants within the EU may serve olive oil provides an
instructive example. Suddenly, seemingly out of the blue, the people and governments
of the EU were informed by an EU official, and the Norwegians presumably by

www.civitas.org.uk
8 • Where’s The Insider Advantage?
fax, that: ‘From the first of January next year, we can guarantee the quality and
authenticity of olive oil… And we do that by having new rules on labelling, concerning
the category and origin of olive oil.’ After explaining that the new rules will force
restaurants to serve sealed, throw-away bottles of oil to customers instead refillable
flasks or bowls, he concluded by saying that: ‘This is good news for consumers in
Europe.’6
Who instigated or devised this particular ruling, its precise legal status, and
what debate or expressions of public concern might have prompted it, remained
unreported. Since the sealed, throwaway bottles were to replace bowls and refillable
jars of olive oil in every café, bar and restaurant across the EU, it is a fair bet that
the Brussels lobbyists of companies who bottle, label and distribute olive oil or
other sauces and condiments must have been involved, since it would transfer the
business of thousands of local olive oil growers and family-based supply chains into
their hands.
Three days later, in the face of Europe-wide media ridicule, the regulation was
revoked, and the lobby groups supporting the measure emerged from the shadows
to express their dismay.7 This might look like a rather reassuring sign that the EU is
after all accountable to its citizens. But that is not quite the end of the story. Who,
one wonders, has the power to reverse, at a stroke, a regulation that had passed
through all the EC approved decision-making processes? Was it Dacian Ciolos, the
Agricultural Commissioner, all on his own? What part did the European Parliament
play, either in the original decision or in its reversal? For the moment, no one knows,
and the British and everyone else seem no better informed than the Norwegians −
perhaps less well informed.8
The direct route of assessing insider advantages by tracking debates and discussions
through to actual benefits for UK trade would appear to be impassable at present,
and perhaps indefinitely. In this search, we will therefore have to adopt a second,
less direct but much simpler method, and that is by trying to identify the outcomes
and results of the insider advantages. This is the method by which schools and
universities, hospitals and ambulances, and many other public services in the UK,
are routinely judged, as well, of course, as private companies, so there seems no
good reason why the same method should not be applied to the Single Market. That
means, above all else, measuring the rate of growth of UK exports against that of
non-members since it began. The main promise of the Single Market was, as it still
is, to increase trade between member countries, and since it was hardly needed to
increase UK imports, this means to increase exports.

A comparative study of UK exports to EU and non-EU nations between 1960 and 2012 • 9
www.civitas.org.uk
Growth of exports as such is nothing to celebrate or write home about, since it is the
normal occurrence. Absence of growth is a rather unusual and exceptional event,
as may be seen from UNCTAD’s records of export growth in 237 countries since
1950.9 Hence, if the insider advantage exists, it must primarily be sought, and show
itself, in an increase in the rate of growth of UK exports over the life of the Single
Market, compared with either EEA and EFTA states who may adopt the rules but are
not insiders who had a part in formulating them, as well as states in the rest of the
world who follow only those rules that apply to the sale of goods or services within
the Single Market.
As far as I am aware, this is the first attempt to identify insider advantages by
searching historical and cross-national export data, so it must be considered an
exploratory investigation, a search for clues worthy of closer scrutiny and analysis
at some later date. It will make use of evidence in the OECD databases, long the
primary source of trade data, with the decided advantage of being readily accessible
to anyone. With a few clicks, therefore, anyone can corroborate the findings of this
search, and for that matter, amend, supplement and update them.

www.civitas.org.uk
10 • Where’s The Insider Advantage?
3. A view of the half-century 1960–2012Perhaps we may best begin by examining UK exports to the members of the EU over
a very long time span, that is to say from 1960, the earliest date that we have records
for exports to most of them, and well before the UK joined the Common Market, until
2012, the latest year for which records are available, a span of more than 50 years.
Figure 1 presents the UK exports to 14 countries that were to become members
of the present EU from 1960 to 2012, as a percentage of total UK exports to all 22
of the OECD countries for which we have data over this half-century. To provide
a comparative marker, it also gives the proportion going to the three European
countries that opted to remain independent.
Figure 1UK export of goods to 14 present EU member countries as a percentage of exports to 22 OECD countries, compared with exports to three independent European countries, 1960–2012
The three independent European countries are Iceland, Norway and Switzerland. EU 14 are the old countries of the EU (before 2004) other than Britain, i.e. Austria, Belgium, Denmark, Finland, France, Germany, Greece, Ireland, Italy, Luxembourg, Netherlands, Portugal, Spain and Sweden. These are the only EU countries for which there is data from 1960. Source: Monthly Statistics on International Trade, Dataset: trade in value by partner countries, United Kingdom. Since exports to Belgium and Luxembourg were not recorded from 1960–1993, imports from the UK recorded by the Belgium and Luxembourg Economic Union were substituted over these years. Both databases are at www.oecd-ilibrary.org
What it shows is that the proportion of goods going to the future EU member countries
grew rather sharply, by 12 per cent, over the twelve years before the UK entered the
Common Market, from 49.6 per cent in 1960 to 61.6 per cent in 1972. However,
0%
10%
20%
30%
40%
50%
60%
70%
80%
3 independent European countriesEU 142010 2005 2000 1995 1990 1985 1980 1975 1970 1965 1960
UK enters EEC Single market begins

A comparative study of UK exports to EU and non-EU nations between 1960 and 2012 • 11
www.civitas.org.uk
over the 40 years of EU membership, for all the costs and obligations incurred, for
all the treaties negotiated, and for all the immense amounts of time and anguish
spent arguing about various aspects of the EU project, the proportion of UK exports
going to the UK’s future EU partners has changed hardly at all. To be precise, it has
fallen by two per cent, from 63.9 per cent in 1973, the year of entry, to 61.9 per cent
in 2012, with 0.5 per cent of the fall occurring during the years of the Single Market,
despite the insider advantages the UK was supposedly enjoying.
The overall impression of this graph is, surely, that EU membership and the Single
Market changed nothing. Year by year, the proportion has, as the graph shows,
fluctuated a little, near 60 per cent in 1981 and touching 70 per cent in 1986–87, and
there is an ominous downwards slide since 2004, (some years before the financial
crisis one may note), but there is no indication whatever, by this first simple measure,
that the EU or the Single Market has had any impact on UK exports at all. It therefore
gives no clue as to where the insider advantages might be found.
The orange line plotting the proportion of the exports of the three independent
countries only makes matters worse. It also fluctuates, but overall it contrasts with
exports to the present members of the EU. Instead of continuity and slight decline,
exports to these three countries have increased during all three periods, before the
UK joined the EU and was still a fellow member of EFTA, from 5.1 per cent to 6.5
per cent, over the Common Market years from 6.0 to 7.6 per cent, and most of all
under the Single Market, despite a dip in 1998–99, from 7.0 per cent to 10.7 per
cent. Over the half-century, therefore, the proportion going to the non-EU members
has more than doubled, so the Single Market years have been rather good years
for UK exports to them, even though they are not members of it, and had no part
in determining its rules. By themselves, these figures suggest that the UK enjoyed
more advantages trading with outsiders, albeit outsiders with which the UK or the EC
had bilateral trade agreements, than with fellow insiders.
In volume and value, of course, there have been large increases in UK exports
to both groups of countries, but those going to the non-EU members have risen
faster. Since the inauguration of the Single Market, UK exports to the EU countries
increased from $9.2b to $25.9b per month in 2012, a nominal increase of 180 per
cent, (in real terms of 78 per cent) while those to the three independent European
countries from $1.0b to $4.5b per month, an increase of 331 per cent (in real terms
171 per cent).
One wonders, of course, whether this could be the result of the focusing on the

www.civitas.org.uk
12 • Where’s The Insider Advantage?
export of goods. As often observed, the UK has become a predominantly service
economy, and it might be that services exports would show a quite different picture.
It is not possible to present a similar half-century diorama of services exports
since the collection of systematic evidence about them is a relatively recent. The
OECD has been publishing returns from some countries since the mid–1980s, but
comprehensive figures for EU countries and the three independent countries of
Europe date only from 1999, and hence can provide no more than an addendum
to the evidence on the export of goods. Figure 2 (below) shows the proportion of
UK exports going to 14 EU countries that were all members of the Single Market
over the years 1999–2011, alongside the proportion going to the three independent
countries of Europe. As the OECD has grown since 1960, they are here expressed
as a proportion of 33 OECD countries.
Figure 2UK exports of services to 14 present EU member countries as a percentage of UK exports of services to 33 OECD countries,
compared with exports of services to three independent European countries, 1999–2011
Source: Dataset: Trade in services by partner country – EBOPS 2002: United Kingdom. The missing entry for Australia in 2003 was taken to be midway between those of 2002 and 2004. www.oecd.ilibrary.org
The proportion going to the EU does not differ greatly from that of goods exports
in that it has been fairly has stable, though with a marginal decline over the 13
years as a whole from 48.9 per cent to 47.7 per cent.1 The big surprise in this chart
is that the proportion going to the three independent countries has trebled in this
0%
10%
20%
30%
40%
50%
60%
2010200520003 independent European countriesEU 14

A comparative study of UK exports to EU and non-EU nations between 1960 and 2012 • 13
www.civitas.org.uk
relatively short period, from 6.1 per cent to 20.2 per cent. In real terms, US$(1993),
UK services exports to them grew by 145 per cent, while those to fellow members
of the Single Market grew by only 68 per cent, which is slightly less than the 72 per
cent growth of UK exports to all 33 OECD countries.
Over 13 years of the Single Market, therefore, the growth of UK services exports to
fellow EU members has not only been significantly lower compared with exports to
the non-members in Europe, but also to the average growth of services exports to
other OECD non-members scattered around the world. The surprise springs from
the fact that over most of these years British prime ministers have been urging
the European Commission to extend or deepen or complete the Single Market in
services. One must conclude either that their efforts have had little effect or that the
Single Market is not particularly helpful to UK services exports, or both.
These are puzzling and counter-intuitive findings. For all the insider advantages the
UK has supposedly enjoyed, not to mention the other costs and obligations that EU
membership has entailed, it is reasonable to expect that the proportion of its exports
going to fellow members of the EU would increase, especially under the Single
Market.2 Correspondingly, it would be reasonable to expect that the proportion of UK
exports going to countries which enjoyed no insider advantages, and only benefited
from EEA or bilateral free trade agreements with the EU over some of these years,
would decline, though whether they did or not would also depend of course on what
was happening to exports to the other five OECD countries that are not included in
this calculation.
The first step in this search has therefore drawn a blank. The insider advantage
case might perhaps be saved by arguing that the proportion of UK exports going to
fellow members would have fallen more than a mere two per cent, were it not for the
UK’s insider advantage. This argument, however, would require strong evidence to
support it, especially as we have just observed that the proportion of exports going to
EU countries grew most of all when the UK was not a member of the EEC.

www.civitas.org.uk
14 • Where’s The Insider Advantage?
4. The top 35 fastest-growing exporters to the EU In a second attempt to identify the insider advantages, we will consider the UK as an
outsider exporting to the other 11 founder members, and compare its performance
with that of real outsiders, in the hope that the UK’s insider advantages might be
revealed by the contrast with the export performance of countries who are without
them.
To produce a manageable list, and exclude the absolute exporting beginners with
tiny starting figures and therefore very high growth rates, a minimum requirement of
exports to the EU 11 of at least $100m per month in 2011 was set for inclusion in the
comparison. Thirty-four countries remained. So that we may compare like with like,
the exports of these 34 countries to the UK were subtracted from their totals, since
the UK cannot, of course, export to itself. Adding the UK as an exporter to the EU 11,
we therefore have 35 countries.
The results are given in Table 1 in the form of a league table of the top 35 fastest-
growing exporters to the 11 founder members of the Single Market over its first 19
years. The UK, it may be seen, is in 28th position, fractionally below Egypt. Twenty-
seven non-member countries, without the insider advantages or ‘privileges’, have
therefore increased their exports to 11 founder members of the Single Market at a
faster rate than the UK. Once again, neither the advantages of being an insider, nor
the disadvantages of being as outsider, are readily apparent. If we did not know, and
were asked to identify the sole country to enjoy insider advantages, based on the
rate of growth of their exports to the EU it seems doubtful if anyone would choose
the 28th country on the list. The aggregate value of UK exports to our 11 founder
member countries might perhaps be a clue, and we will return to examine it in a
moment.
The objection to such a list is that it confuses ‘emerging’, ‘transitional’, ‘middle-
income developing countries’ and ‘petroleum and gas producing countries’ to
mention just a few of the distinctions made in UNCTAD’s classification of exporters,
and places them alongside ‘major exporters of manufactured goods’, and that it does
not therefore compare like with like. However, in the present context none of these
distinctions are relevant. The aim is simply to try to identify insider advantages and
outsider disadvantages, and it is not certain how the elimination of, say, emerging
exporters or oil producers would help in that search. If the minimum requirement
had been set at, say, $1b per month, the UK would have risen to 21st place, and if
the three oil exporters had been excluded, the UK would move further up the list to
18th. Some British observers might feel a little better after these corrections, but it is
difficult to think of any analytical benefit from such a shorter, more select, list.

A comparative study of UK exports to EU and non-EU nations between 1960 and 2012 • 15
www.civitas.org.uk
Table 1Top 35 fastest-growing exporters of goods to 11 founding
members of the EU Single Market 1993–2011
Rank
% growth over 19 years
measured In US$(1993)
Exports per month in 2011
In US$bn(2011)
1 Vietnam 544 0.4
2 Qatar 496 0.3
3 Ukraine 446 1.1
4 China & Hong Kong 429 15.3
5 United Arab Emirates 402 2.8
6 Russia 377 7.8
7 India 367 3.4
8 Brazil 357 3.4
9 Turkey* 295 6.2
10 Nigeria 250 1.1
11 Australia 243 2.6
12 South Africa* 224 2.1
13 Chile* 198 0.6
14 Korea* 197 3.0
15 Mexico* 176 2.1
16 Morocco* 170 1.5
17 Singapore 163 2.3
18 New Zealand 147 0.3
19 Canada 142 2.3
20 Bangladesh 129 0.1
21 Bahrain 129 0.1
22 US 126 22.2
23 Switzerland* 114 11.8
24 Saudi Arabia 114 2.3
25 Norway* 114 2.7
26 Kenya 99 0.1
27 Egypt* 96 1.1
28 UK 81 23.9
29 Israel* 51 1.5
30 Japan 51 4.7
31 Taiwan 50 1.5
32 Iceland* 48 0.1
33 Thailand 48 0.9
34 Kuwait 21 0.3
35 Indonesia 12 0.6
Source: www.oecd-ilibrary.org.OECD database Monthly Statistics of International Trade doi:10.1787/data-02279

www.civitas.org.uk
16 • Where’s The Insider Advantage?
There is merit in presenting, at least to begin with, as comprehensive a list as possible
without prior editing out of countries by some arbitrary and debatable rule. In any
case, since we are also hoping to observe the disadvantages of being an outsider,
the smaller, newly-emerging exporter countries deserve to be included since, in
addition to the disadvantage of not having taken any part in the rule-making of the
Single Market, they have to surmount unfamiliar non-tariff, shipping and marketing
obstacles of the kind sometimes mentioned to explain the poor performance of UK
exporters in new markets. Hence, the fact that a number of them have nevertheless
increased their exports to the Single Market more rapidly than the UK suggests that
the disadvantages of being an outsider may have been exaggerated.
At the end of the day, whatever countries might, for one reason or another, be
removed from the table, its message would remain exactly the same: in terms of
growth the Single Market does not appear to have been a success story for UK
exports, and the data does not provide any hint of where an insider advantage might
be found.
Eleven of the countries in the table are starred to indicate that they enjoy trading
advantages with the EU by virtue of Free Trade Agreements (FTAs) that they have
negotiated with the EU, which came into force either before or at some point during
the Single Market.1 Their exports to the EU may of course have benefited from
these agreements, but these agreements cannot be the insider advantages that
those defending UK membership of the EU have in mind. If they were, they would
not provide much of an argument for continued membership, since a country could
enjoy them without being a member, and without ‘sitting at the table’, ‘helping to
make the rules’ etc. The export performance of these countries can hardly help us
to understand what the UK’s insider advantages might be, or help to explain why the
UK exports to the EU should have grown at such a slow pace.
Might the high gross value of UK exports provide part of the explanation? Perhaps
UK exports grew rapidly in the past, (and we have reason to believe this was the
case), when they were climbing towards their present high value and, having reached
it, decelerated as the EU became a mature market for UK exports? Growth of any
phenomenon, whether company sales or living organisms, would display the same
characteristic.2 UK exports might therefore be just one more instance of the same
natural and inevitable process.
One must treat this argument with some caution. It is the standard defence of
market leaders that are failing to respond to new competitors, and it seems an odd

A comparative study of UK exports to EU and non-EU nations between 1960 and 2012 • 17
www.civitas.org.uk
coincidence that the growth curve for UK exports flattens out at the very moment
that new opportunities for trade were supposed to be opened up by the advent of the
Single Market. As it happens, two competitors, the US and China, have been closing
in fast on the UK in recent years, so perhaps, in a few years’ time, we will be able to
see whether their growth also declines naturally and inevitably.
In the meantime, if we try to discover whether there is such a natural growth curve
which flattens out when exports reach a high value, we have first to decide whether
high value should be measured in total or per capita. At first glance, the latter seems
the more appropriate of the two. But in per capita value, UK exports to other members
of the Single Market, of $387 per month in 2011, are not particularly high. They are
comfortably exceeded by, among others, those of Norway ($541) and Singapore
($447). The per capita value per month of Switzerland’s exports to the EU 11 ($1,505
in 2011) is four times higher than that of UK exports. This suggests either that the UK
has a way to go before the flattening out should be expected to occur, or that every
country has its own export growth curve, shaped by its own comparative advantages.
We may next try to discover whether the growth rates of any of the other founder
members of the Single Market show a similar tendency, proceeding as we did with
the UK by treating each of them in turn as an outsider, exporting to the other 11.
These economies are, for the most part, as advanced as the UK, and have been
trading with each other as long as the UK has been trading with them. They might
therefore be considered a fairer assessment of UK export performance than the
exporters from around the world given in Table 1.
The results are presented in Table 2 (overleaf), with growth in the total value of goods
exports and their actual value in 2011 on the left hand side, and the per capita growth
and value in 2011 on the right. In this league table, the UK, with growth of total value
of 81 per cent over the 19 years, ends up in joint ninth place with Germany, both of
them below the weighted mean growth of the 12 countries which is 92. In total value,
it is in third place, and some way behind Germany and France. In per capita growth
it is in ninth place, and again below the weighted mean, which is 75. In per capita
value it is again in ninth place, but at US$(2011)387 per month is some way below
the weighted mean of the 12 countries of $527.
The argument that the low growth rate of UK exports is only to be expected, given
their high total value, does not receive much support from this data. Eight countries
are clustered closely around the mean rate of growth, while the total value of their
exports varies widely. German exports have a much greater total value than those

www.civitas.org.uk
18 • Where’s The Insider Advantage?
of the UK, as do those of France, but they have not grown at a slower rate, as
the argument suggests they should. There is in fact no inverse correlation between
growth and value, r = 0.089.
On the per capita side, there are countries that have both higher rates of growth
and far higher value, notably Belgium and the Netherlands, whose figures do not,
according to the OECD, include re-exports, the so-called Rotterdam effect.3 Ireland
is another notable contrast with the UK, growing at almost the same rate, but with
exports more than double the per capita value in 2011 of those of the UK. They all
add weight to the Swiss example mentioned above, and suggest that the UK still has
some way to go until it runs up against any natural and inevitable ceiling of export
growth. Again, there is no correlation between growth and per capita value amongst
all 12, r = −0.11.
Table 2Growth in the value of exports of goods of the 12 original
members of the Single Market to each other, listed in order of their growth in total monthly value over the 19 years 1993–2011
Percentage growth in total
value permonth
In US$(1993)
Total value permonth In 2011
in US$bn(2011)
Percentage growth in per
capita value per month
In US$(1993)
Per capita value per month In 2011 in US$(2011)
133 15.5 Spain 98 336
107 3.9 Ireland 65 865
101 20.9 Netherlands 85 1250
98 2.0 Luxembourg 55 3911
95 20.6 Belgium 78 1863
88 19.6 Italy 76 325
93 36.9 France 70 583
82 4.5 Portugal 70 421
81 42.8 Germany 79 524
81 23.9 UK 69 387
79 3.8 Denmark 67 681
39 2.3 Greece 31 210
92 26.5 weighted mean 75 527
Note: Luxembourg figures should be treated with extreme caution, since its returns are, as usual, incomplete. However, in the interests of providing a complete set of figures, its exports to ten countries 1993–1998 and the Netherlands 1993–1999, to the UK 1993–2000, were taken from the imports of the Belgium-Luxembourg Economic Union database. Its missing 2011 exports to Denmark were estimated as six per cent of the total reported joint figure for Belgium & Luxembourg. OECD annual figure for the value of goods export is an average of the 12 monthly values. Source: www.oecd-ilibrary.org.OECD database Monthly Statistics of International Trade doi:10.1787/data-02279
A comparative study of UK exports to EU and non-EU nations between 1960 and 2012 • 19
www.civitas.org.uk
Perhaps the more interesting result of this calculation, however, is that the growth in
the total value of the exports of all 12 countries, with a weighted mean as we noted
of 92 per cent over the 19 years, is rather low compared with that of non-member
exporters shown in Table 1. All 11 of the other founder member countries, if they had
been separated as outsiders like the UK, would therefore have been clustered near
the UK, and towards the bottom end of any extended top exporters table.
This might lead one to think that advanced economies, exporting to markets in which
they have been long-established, will, regardless of their value, tend to have rather
low growth rates in a world context. However, as we have already seen in Table 1,
exports from a number of non-member countries that are equally advanced as the
EU 12, and have also been long established in these markets, have managed grow
much more rapidly than the EU mean of 92 per cent. Exports from Norway and
Switzerland to the EU 11 grew by 114 per cent, that is to say, by a greater amount
than 11 of the 12 Single Market member countries to each other. Exports of the
United States grew by 126 per cent, of Canada by 142 per cent, of New Zealand by
147 per cent, and of Australia by 243 per cent.
These four English-speaking countries, it must be remembered, have not only been
suffering the supposed disadvantages of being outsiders who have taken no part in
the setting of the Single Market rules, but are also at considerable distances from
the Single Market, and therefore to varying degrees have to surmount the well-
documented discouraging effect of distance on trade relations. One of the most
popular theories of international trade, the gravity model, suggests that the flow of
trade between two countries is proportional to their income, and inversely proportional
to the distance between them. Having collected a vast amount of evidence to support
the latter point, Ghemawat summarized the importance of distance in the phrase:
‘Other things being equal, doubling the geographic distance between countries
halves the trade between them.’ 4
Odd as it may sound, the Single Market therefore has been a low growth area for
its own members, but a much better one for non-members. This curious, counter-
intuitive conclusion does not quite fit the rhetoric often used to defend the Single
Market, which claimed that trade and exports would intensify amongst its own
members, at the expense of those left outside, a view that the present UK prime
minister seems to share and which may account for his reluctance to contemplate
leaving the EU. If growth of exports be taken as a measure of the intensification of
trade relationships, and it is hard to think of a better one, this intensification of trade
amongst members has not happened. If only, one is tempted to add, UK exports to

www.civitas.org.uk
20 • Where’s The Insider Advantage?
the Single Market had a grown at the same rate as some of these disadvantaged
outsiders.
More importantly, in the present context, these figures fail to give the least hint or
glimpse of any insider advantages or outsider disadvantages, nor even a clue as to
where we might look for them. If anything, they suggest the exact opposite: insider
disadvantages and outsider advantages. The only two countries that might suggest
the disadvantages of being outside ‘the world’s largest market’ are Japan and
Taiwan, but then one is bound to wonder whether other factors might explain their
poor performance, since their near neighbour Korea was able to surmount these
disadvantages for many years before it signed a trade agreement with the EU in
2010, which came into force in 2011.

A comparative study of UK exports to EU and non-EU nations between 1960 and 2012 • 21
www.civitas.org.uk
5. A backwards glance at the Common Market Another way to assess the UK export performance under the Single Market is by
looking back, and comparing it with what we might loosely call the Common Market
decades, that is the years following UK entry in 1973 until 1992, the year before the
launch of the Single Market. The high value of UK exports to the Single Market might
lead one to think, as mentioned above, that the UK might, or must, have enjoyed
a higher rate of growth at some point in the past. The 50-year view with which we
began in Figure 1 suggested this higher rate of growth might have got under way
before the UK entered the EU. Nonetheless, the comparison with the years of EU
membership before the Single Market was initiated is useful, as it may tell us whether
UK performance under the Single Market was above or below earlier UK experience
with these same EU member countries. Obviously, if export growth under the Single
Market was significantly above earlier UK experience, we might have stumbled upon
the insider advantage of taking part in the setting of its rules.
There is a problem when making such an historical comparison, since the number
of member countries increased from nine in 1973 to 12 in 1992 (Greece having
joined in 1981 and Portugal and Spain in 1986) and, though a common practice, it
is obviously misleading to measure growth in countries’ exports while the number
of countries included in the count is increasing. The number of EU countries will
therefore be held constant by backdating the membership of the three later entrants
as if they had been members of the EU since 1973, and measuring the growth of UK
and other exports to the same 11 founding members of the Single Market.
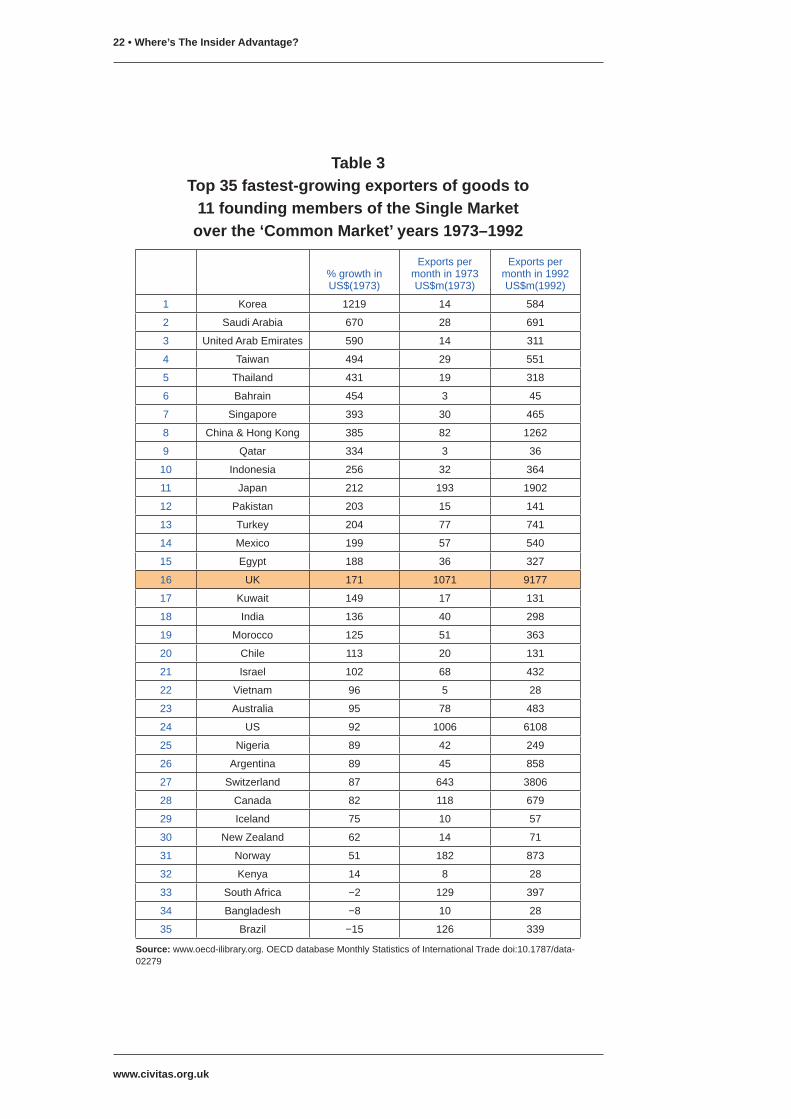
Table 3 (overleaf) presents a list of the 35 fastest-growing exporters to the same EU
11 over the two Common Market decades, without any minimum level of exports for
inclusion in the list.
It shows that UK exports grew at a markedly faster rate prior to the Single Market.
Over the 20 Common Market years it increased by 171 per cent, putting it in 16th
place overall in the Top 35, compared with 81 per cent increase and 28th place over
the 19 years of the Single Market. Moreover, unlike the Single Market decades,
virtually all of those above the UK on the list were either emerging exporting countries
or oil producers. If these were eliminated, the UK would have been very near the top
of the list, with Japan ahead, and only Singapore, China & Hong Kong, and possibly
Turkey, as contenders for second place, depending on which of them we wish to
exclude as start-up exporters.
However, far more important than the final, ‘corrected’ ranking of the UK is the fact
www.civitas.org.uk
22 • Where’s The Insider Advantage?
Table 3Top 35 fastest-growing exporters of goods to
11 founding members of the Single Market over the ‘Common Market’ years 1973–1992
% growth in US$(1973)
Exports per month in 1973 US$m(1973)
Exports per month in 1992 US$m(1992)
1 Korea 1219 14 584
2 Saudi Arabia 670 28 691
3 United Arab Emirates 590 14 311
4 Taiwan 494 29 551
5 Thailand 431 19 318
6 Bahrain 454 3 45
7 Singapore 393 30 465
8 China & Hong Kong 385 82 1262
9 Qatar 334 3 36
10 Indonesia 256 32 364
11 Japan 212 193 1902
12 Pakistan 203 15 141
13 Turkey 204 77 741
14 Mexico 199 57 540
15 Egypt 188 36 327
16 UK 171 1071 9177
17 Kuwait 149 17 131
18 India 136 40 298
19 Morocco 125 51 363
20 Chile 113 20 131
21 Israel 102 68 432
22 Vietnam 96 5 28
23 Australia 95 78 483
24 US 92 1006 6108
25 Nigeria 89 42 249
26 Argentina 89 45 858
27 Switzerland 87 643 3806
28 Canada 82 118 679
29 Iceland 75 10 57
30 New Zealand 62 14 71
31 Norway 51 182 873
32 Kenya 14 8 28
33 South Africa −2 129 397
34 Bangladesh −8 10 28
35 Brazil −15 126 339
Source: www.oecd-ilibrary.org. OECD database Monthly Statistics of International Trade doi:10.1787/data-02279

A comparative study of UK exports to EU and non-EU nations between 1960 and 2012 • 23
www.civitas.org.uk
that the growth of UK exports in these decades exceeded that of the US and several
other countries that were reasonably well-established in the global trading networks
at the time. In 1973 the average monthly value of UK exports edged ahead of those
of the US at $1,006m per month for the first time since 1966, and continued to grow
at a faster pace till 1992, when at $9,170m their value was just over 50 per cent
higher than the $6,108m value of US exports. It thereby demonstrated, incidentally,
that the country with the highest monthly average value need not invariably have a
low rate of growth. UK exports also grew more rapidly over these years than those
of Australia, Argentina, Canada, Switzerland, Norway, Switzerland and South Africa,
all of which were well-established exporters of the day.
The performance of UK exports over these Common Market decades, therefore,
contrasts sharply with their performance over the first 19 years of the Single Market,
but in the wrong direction for those who wish to argue that the UK has enjoyed, or
is enjoying, insider advantages in the Single Market. During the Common Market
years, UK exports grew faster than those of the US and the other seven countries,
while under the Single Market the exports of every single one of them grew faster
than those of the UK. The United States is an especially illuminating example of
the difference between the two eras. Over the 20 years of the Common Market, UK
exports had, as just mentioned, grown faster than American exports and by 1992
were 50 per cent higher in value. That was, however, their high point relative to US
exports, and they have never reached it since. Instead, the differential has declined,
fairly steadily throughout the 19 years of the Single Market, and in 2011, for the first
time since 1972, the value of US exports of goods to the EU 11 exceeded the value
of UK exports. There cannot, therefore, be much doubt that the growth of UK exports
has declined under the Single Market, and that it has failed, thus far, to live up to its
promise.
The contrast between the two eras is illustrated in the figures 3 & 4 below. Figure 3
compares the growth in the total value of UK exports of goods to the countries that
were to become EU 11 with that of a slightly different sub-set of countries, seven
founder or long-standing members of OECD (Australia, Canada, Iceland, Japan,
Norway, Switzerland and the United States) whose trade with EU countries was
therefore well-established, and well-documented, before the UK entered the EU.
Over all the Common Market years, as may be clearly seen, UK exports to the EU
grew at a decidedly more rapid rate than those of these seven OECD countries, and
by the end of the two decades had grown 75 per cent more than theirs in gross value.

www.civitas.org.uk
24 • Where’s The Insider Advantage?
Figure 3Growth in total value of goods exports to 11 founding members of the Single Market over the Common Market years 1973–1992:
UK compared with seven long-standing OECD members in US$(1973)
Source: Monthly Statistics on International Trade, Dataset: trade in value by partner countries, www.oecd-ilibrary.org. The seven non-EU OECD members are Australia, Canada, Iceland, Japan, Norway, Switzerland and the United States.
Over these years, therefore, it is possible to imagine that the UK might have enjoyed
some kind of insider advantage. Indeed, this is a perfect textbook example of the
kind of clue or prima facie evidence we have been searching for. But what kind
of advantage was it? The directives and regulations which have ‘harmonised’ the
member countries under the Single Market were barely under way, and indeed
the entire EC institutional apparatus surrounded by lobbyists/stakeholders and its
culture of comitology were still rudimentary. Apart from the much advertised bracing
effects of competition within the Common Market, one possible explanation is strong
economic growth in France, Germany and Italy. However, it is then not clear why the
UK should have benefited from this growth more than the other OECD countries. We
are therefore obliged to mention the other plausible explanation, the one distinctive
characteristic of the EEC over all those years, its rather high common external tariff.
Perhaps this tariff restricted the growth of the exports of the seven OECD members,
to the advantage of the UK, which, as an EU member, was not subject to it?
Until such time as the impact of that tariff has been definitively measured, we can
only speculate. However, having raised the issue of tariffs over the Common Market
−50%
0%
50%
100%
150%
200%
Seven non-EU OECD membersUK1990198519801975

A comparative study of UK exports to EU and non-EU nations between 1960 and 2012 • 25
www.civitas.org.uk
years leads one to consider the possibility that those who today extol the insider
advantages of EU membership might be referring to tariff protection offered by
the EU, though they could hardly say so openly without embarrassment. It seems
unlikely. Tariffs are, certainly, insider advantages, but EU tariffs on non-agricultural
products have been falling steadily for many years. According to the UNCTAD, the
EU weighted average tariff on manufactured products fell from 4.42 per cent in 1988
to 2.67 per cent in 2010.1 Since many non-members avoid them altogether, they can
hardly amount to prized insider advantages.2
Non-tariff barriers (NTBs) might, more plausibly, be considered as such since these
have sometimes been estimated to be the equivalent of as much as 20 per cent of
an external tariff. Member countries have not, however, been remarkably effective
at eliminating NTBs amongst themselves, so the idea that they collude to maintain
them against outsiders, and the UK must remain a member of the EU to enjoy these
NTB insider advantages, seems rather far-fetched. Until we are told exactly what the
insider advantages that count for so much actually are, we can only speculate, so
we will return to the facts.
The growth in value of UK exports over the 20 Common Market years shown in
Figure 3 may be compared with their growth over 19 years of the Single Market
which is shown in Figure 4 (overleaf), alongside the same seven OECD non-EU
countries. Over the first 12 years, from 1993 to 2004, the value of UK exports grew
at a slightly faster rate, though with nothing like the same lead as it had enjoyed
during the Common Market years. Then, in 2005, the UK slipped behind their rate
of growth, and in 2009 dropped markedly behind, so that by the end of 19 years, in
2011, the exports of the seven OECD countries had grown 35 per cent more than
the UK’s.
The putative insider advantage therefore seems to have disappeared altogether.
Once again, we can only rescue the claim if we take the view that, without the insider
advantage, the growth of UK exports would have fallen still further behind these other
OECD countries. However, that is only plausible if we have evidence explaining why
it is reasonable to expect that to have happened, just after the exciting opportunities
by ‘the world’s largest Single Market’ were opened to UK exporters and over the
years when the Single Market was being ‘widened’ and ‘deepened’.

www.civitas.org.uk
26 • Where’s The Insider Advantage?
Figure 4 Growth in total value of goods exports to the EU 11 UK
compared with seven long-standing OECD members 1993–2011
Source: Monthly Statistics on International Trade, Dataset: trade in value by partner countries, www.oecd-ilibrary.org. The seven non-EU OECD members are Australia, Canada, Iceland, Japan, Norway, Switzerland and the United States
The UK was not, one must add, entirely alone in experiencing a significant decline
of fortunes after the Common Market became the Single Market. One of the seven
OECD countries, Japan, kept the UK company, and indeed suffered an even greater
reversal, having been the only advanced economy whose exports to the EU grew
faster than those of the UK in the decades 1973–1992, and the only developed
country to have grown slower than the UK in the two decades 1993–2011. While
the UK fell from 16th to 28th place over these latter decades, Japan fell from 12th
to 30th.
Japan’s decline over this period has, of course, been widely noticed and discussed,
but the UK’s has not, as the Single Market has usually been seen as rescuing the
UK from earlier decades of decline. The British political elite has been much too busy
celebrating the merits of the Single Market, making unsubstantiated claims about the
insider advantages that the UK enjoys as a member of it, and warning everyone of
the fearful consequences of losing them. This has left little space for politicians or the
media to notice and discuss the UK’s decline within the Single Market.
If it is true, to quote the Prime Minister again, that ‘our participation in the Single
Market, and our ability to help set its rules, is the principal reason for our membership
of the EU’, then plainly there are strong political reasons why the failure of the Single
0%
20%
40%
60%
80%
100%
120%
2010200520001995Seven non-EU OECD membersUK

A comparative study of UK exports to EU and non-EU nations between 1960 and 2012 • 27
www.civitas.org.uk
Market, from the UK’s point of view, should not be examined and discussed.3 It
cannot be allowed to be anything other than a resounding success. Hence, one
is now more likely, mirabile dictu, to learn of its failings from Brussels than from
London.4

www.civitas.org.uk
28 • Where’s The Insider Advantage?
6. And further back, to the pre-entry yearsHaving taken one step backwards, it is difficult to resist taking another, to examine
UK export growth in the pre-entry years and to see just when the UK’s rapid export
growth may have begun. The OECD data allows us to go back to 1960. Figure 5
shows the growth of UK exports to the countries that were to become the EU 11
over the 13 years prior to the UK’s accession in 1973. They are again presented
alongside the same seven OECD countries as in Figures 3 & 4.
Figure 5Growth in total value of UK goods exports to the future EU 11
compared with seven long-standing OECD members 1960–1972 in US$(1960)
The seven non-EU OECD members are Australia, Canada, Iceland, Japan, Norway, Switzerland and the United States Source: Monthly Statistics on International Trade, Dataset: trade in value by partner countries, www.oecd-ilibrary.org.
Apart from 1964, the UK failed over the decade 1960–1970 to keep pace with the
seven OECD countries, even though four of them could not benefit from close
proximity to the EU 11. Up to 1970, therefore, these figures fit the conventional
narrative of the era with the UK as ‘the sick man of Europe’. However, from that year
on, UK exports started to grow at a faster rate, and to close on the growth of those
of the other OECD countries. The UK overtook the others in 1975.1
The conventional narrative seems to have missed this sudden surge. Most right-
thinking people at the time, and most of the press, seem to have shared a deep
pessimism about the prospects of the UK economy and, largely for that reason,
0%
50%
100%
150%
200%
197019651960Seven non-EU OECD membersUK
A comparative study of UK exports to EU and non-EU nations between 1960 and 2012 • 29
www.civitas.org.uk
favoured the efforts to join the Common Market, even though a steep upward
trajectory in exports was under way.2 As we have seen in Figure 3 above, this upward
trajectory continued right through the two Common Market decades, with UK exports
growing at a much faster rate than those of the OECD countries. The slowdown only
begins with the Single Market, in the most recent years of which the OECD countries
once more grew at a faster rate.
Neither of these historical comparisons, therefore, casts a particularly favourable
light on the Single Market. Growth in the value of goods exports, in real terms, over
the 13 years 1960–1972 came to 137 per cent; over 20 years of the Common Market
to 171 per cent; and over 19 years of the Single Market to 81 per cent.3
www.civitas.org.uk
30 • Where’s The Insider Advantage?
7. Are services any different?All the preceding tables refer only to the export of goods, but these now constitute
only two-thirds of all UK exports, so it would be helpful to conduct the same kind of
analysis for the export of services, especially as the UK enjoys greater comparative
advantages for the export of services than for goods.1
This is not possible. Reliable data about services exports to partner countries covers
a much shorter period and, though it has a wider coverage, it is also more erratic. It
begins in 1999, which means that we cannot cover all 19 years of the Single Market.2
And no backward glance to earlier decades is possible, though since we must begin
in 1999, the three 1995 entrants to the EU will cause no distraction and may therefore
be included in the calculations. Moreover, since the data on services exports of the
2004 and 2007 entrants are, for some reason, rather better than those of goods
exports, the figures for those countries may also be included. We will therefore have
a larger number of EU countries, but over fewer years.
Other difficulties arise because, after 1999, entries of exports from particular countries
to particular EU countries are haphazardly missing. Thus, to make comparable
calculations, we are obliged to use imports to the EU from these countries. One
might imagine, on first acquaintance with this data, that these are pretty much the
same as exports from these countries, that the exports country Y reports to country
X will be much the same as the imports country X reports from country Y, or that they
are reconciled by statistical agencies. But they are not the same, the OECD does
not reconcile the difference, and the difference between them is not marginal. They
therefore provide a sharp reminder that any data depends on the method used to
collect it, and the time of collection and reporting. This might not matter too much if
we could use the same imports to figures for every single country, but we cannot.
For some unknown reason, there are no individual entries for the UK, or for other
EU member countries, in the OECD database files of imports to the EU for the years
1999–2003. They resume in 2004 which means that, for the UK alone, over the
years 1999–2003, we have to use the data of the UK exports from file.
To see whether with this makes a significant difference when measuring exports
over time, two calculations of growth are given in Table 4: in column 3 over the
twelve years 1999–2010 with UK growth alone calculated from exports to the EU 11,
and in column 4 over the seven years 2004–2010 when, as just mentioned, figures
for imports from all the EU member countries, including the UK, were recorded by
OECD. Column 4 is therefore intended to serve as a check on the calculations in

A comparative study of UK exports to EU and non-EU nations between 1960 and 2012 • 31
www.civitas.org.uk
column 3. It allows us to see whether column 4’s calculations, which include exports
to only in the case of the UK, might have give a misleading impression of UK export
performance.Table 4
Growth in services exports of 27 countries to the EU 14–26 1999–2010
% growth 1999–2010: measured in US$(1999)
% growth 2004–2010: measured in US$(1999)
Annual valuein 2010 in
US$bn(2010)
1 India 286 121 8.4
2 China & Hong Kong 250 86 25.3
3 Russia 256 66 16.2
4 Nigeria 189 87 2.0
5 Turkey 175 25 16.6
6 Egypt 148 44 7.8
7 New Zealand 141 42 0.9
8 Singapore 131 64 9.9
9 Korea 123 29 5.4
10 Israel 115 39 3.4
11 Thailand 112 54 6.0
12 Brazil 110 53 6.3
13 Switzerland 100 43 55.3
14 Mexico 95 9 3.4
15 Philippines 94 56 1.5
16 Taiwan 90 41 3.5
17 Australia 90 26 1.4
18 Argentina 82 64 2.4
19 Morocco 76 32 5.2
20 Norway 66 0.9 10.3
21 Canada 65 31 8.1
22 UK 53 14 97.6
23 South Africa 53 13 4.2
24 Japan 52 22 13.6
25 US 29 19 126.0
26 Malaysia 22 53 2.7
Note: Figures are calculated from files of imports by the EU 15 1999–2003 & by the EU 27 2004–2010, with imports by the UK subtracted from all, hence EU 14 and 26. OECD includes Bulgaria and Romania among the 26 from 2004, even though they did not actually join until 2007 (personal communication from OECD). Missing figures for the years 1999–2000 for Korea, Israel, Egypt, Singapore, Nigeria, S Africa, Taiwan, Malaysia, Thailand, Hong Kong and the Philippines were estimated by assuming they were the same percentage of world service imports as the mean of the three following years. The same method was used to estimate missing figures for Nigeria in 2001 and Malaysia in 2003. Missing figures for Norway and Switzerland for 1999 were estimated by assuming that they were lower than 2000 by the same proportion as 2000 was below 2001. UK exports alone are taken from UK services exports files. Following OECD, exports to Bulgaria and Romania were included in EU 26 from 2004. Source: www.oecd-ilibrary.org. OECD database ‘Trade in Services by partner country’ doi: 10.1787/data-00274

www.civitas.org.uk
32 • Where’s The Insider Advantage?
The results, given in Table 4, indicate that they did not. The UK ends up in 22nd
place in growth over 12 years, and had we ranked the growth over the seven years,
would have been in 23rd place. Although the countries with slower growth than the
UK are not identical over the two periods, this is not a cause for serious concern.
Since countries’ growth fluctuates year on year, growth over a period may well vary
according to the start and end dates.
Table 4 covers all 26 countries for which reasonably complete data of services
exports exist, though for a good number of them, for some years, it was necessary to
estimate by means indicated in the note. To qualify for inclusion in the table, exports
in 2010 had to exceed $1bn per annum.3
The overall result is not remarkably different from that of growth of export of goods.
The UK was 28th of 35 in the growth of exports of goods, and 22nd of 26 in the
export of services to the EU. As with the fastest-growing goods exporters table, the
results are given without any editing out of newly-emergent exporters, though given
the annual value of their services exports in the far right-hand column, most of those
above the UK might be deemed as such. Once again, therefore, the UK’s final rank
might be debated and corrected, though with equally little impact on the conclusions
that we may draw from these results.
The main fact is that the value of services exports from 21 non-member countries to
members of the Single Market has grown at a faster rate than that of the UK, even
though these non-member countries have no insider advantages in their trade with
the EU, and some of them at least may well have had to surmount the obstacles of
newcomers to world trade and of distance from the Single Market.
The growth and the value of Norway’s and Switzerland’s exports deserve particular
attention because the Director-General of the CBI recently decided to repeat the
insider advantages argument. Norway, he told readers of The Times, had ‘no clout
over EU decision-making because it has no seat at the table’ while ‘Switzerland still
has no agreement to ensure access to the European market in services – a major
part of the UK economy’.4 Nothing, therefore, is to be learned or expected from
either country, according to the Director-General of the CBI, who went on to call for
the UK’s relationship with the EU to be assessed ‘using hard facts and objective
analysis, not emotion or hollow rhetoric’.
If one refers to the OECD’s hard facts, it is strange to discover that, despite its ‘lack
of clout over EU decision-making’, the total value of Norway’s services exports to the
EU has grown 13 per cent more than those of the UK over the years 1999–2010, and

A comparative study of UK exports to EU and non-EU nations between 1960 and 2012 • 33
www.civitas.org.uk
despite Switzerland having no agreement ‘to ensure access to the European market
in services’, the total value of its services exports has grown nearly twice as much
as the UK’s over the 12 years we can measure. The total value of the two countries’
services exports, $10.3bn and $55.3bn respectively in 2010, might seem modest
by comparison with the $97.6bn of the UK, but per capita they are both much larger
than the UK’s. In 2010, the UK’s exports were $1,591 per capita, while Norway’s
were $2,073, Switzerland’s were $7,060 (well over four times the value of UK’s).
Not having ‘a seat at the table’ and not having ‘access to the European market in
services’ begin to look like decided advantages. If the UK’s services exports to the
EU had been as successful as those of Norway in 2010, they would have amounted
to $127.2bn, and if as successful as those of Switzerland to $433.1bn; rather more,
in other words, than the $97.6bn they actually reached. These two countries, one
must conclude, are not good prospects for identifying the disadvantages of not taking
part in the rule-making of the Single Market.
There are four slower-growing countries, but two of these are within one percentage
point of UK growth, so not much is to be inferred from them, which leaves just the
US and Malaysia. The latter’s services exports are diminutive, so, when looking
for countries whose performance might put us on the track of the UK’s insider
advantages, the United States looks like our best prospect. The total value of its
services exports to the EU 14–26 exceeded that of UK exports by a considerable
margin, but its slower growth might perhaps indicate that it suffered from an outsider’s
disadvantages, while, correspondingly, the UK’s slightly better performance might
indicate that it has benefited from insider advantages.

www.civitas.org.uk
34 • Where’s The Insider Advantage?
8. Do UK exporters need an insider advantage?Another way of assessing the performance of UK exports to the EU under the Single
Market is to compare their rate of growth with that of UK exports to non-member
countries over the same period. Markets for UK exports are, of course, influenced by
a great many factors that are not included in this search. However, a comparison of
the rate of growth of exports to members and non-members might still be illuminating.
If, for instance, the rate of growth to fellow members were faster than that of exports
to non-member countries, it would be consistent with the claim that the UK enjoyed
an insider advantage when exporting to fellow members of the Single Market, and
provide some reassurance that we are on the right track.
The 33 fastest-growing markets for UK exports of goods over the 19 years of the
Single Market are listed in Table 5. It shows that UK exports to the EU 11 were
not faster than those to non-member countries. Far from it. UK exports to 25 non-
member countries have grown at a faster rate, frequently very much faster. And
these results have not been seriously affected by the on-going eurocrisis. If we set
the clock back to 2008 and calculate the growth of UK exports only to that date, the
EU only moves up two places. Growth of exports to the Single Market was slow
throughout its sixteen pre-crisis years.
Since we are comparing the value of exports to 11 countries with those of single
countries, the value of exports to the EU exceeds that of all the others. And if we
adopt the habit of some EU partisans, including prime ministers, and conflate
growth of exports to a fixed number of countries with growth to all EU countries as it
expanded in 2004 and 2007, and therefore add the exports to the nine later entrants
for which we have data, growth increases slightly to 112 per cent. This puts the EU
in 24th place, just behind Brazil, and the mean monthly value in 2011 rises to $28bn.
Individually, it must also be said, some of the EU 11 were among the highest value
markets for UK exports. However, whatever way we present the evidence, it can
only reproduce, from another angle, the Single Market profile with which we have
become familiar. The EU is a high value market for UK exports, but a slow-growing
one.
This data is, however, interesting for another reason. Anyone looking at the earlier
tables will almost certainly have wondered whether UK exports to the Single Market
have grown at a slow rate simply because UK exporters have not adapted nimbly or
intelligently enough to take advantage of the opportunities presented by the Single
Market. One may infer that those who claim that the UK must continue to depend

A comparative study of UK exports to EU and non-EU nations between 1960 and 2012 • 35
www.civitas.org.uk
Table 5Top 33 fastest-growing markets for UK exports of goods
over the life of the Single Market 1993–2011% growth
in 19 yearsmeasured
in US$(1993)
Mean monthly value in $m
(2011)
1 Qatar 16141 638
2 Vietnam 5043 222
3 Nigeria 1268 746
4 Turkey* 651 815
5 Bangladesh 628 199
6 Mexico* 545 180
7 Russia 508 974
8 China & Hong Kong 492 4021
9 Algeria* 446 199
10 Canada 428 1582
11 Kuwait 368 196
12 United Arab Emirates 413 252
13 Sri Lanka 286 107
14 India 269 784
15 Norway* 255 3601
16 Columbia 244 117
17 Egypt* 190 106
18 Argentina 186 79
19 Israel* 171 291
20 Australia 159 652
21 Thailand 121 332
22 Bahrain 113 218
23 Brazil 112 373
24 South Africa* 100 389
25 Korea* 92 414
26 EU11 81 23897
27 Pakistan 80 114
28 Switzerland* 66 933
29 Singapore 62 511
30 Taiwan 41 445
31 US 36 4664
32 Indonesia 27 174
33 New Zealand 22 101
* Denotes countries with which the EU has preferential trade relations. Sources: www.oecd-ilibrary.org. OECD database Monthly Statistics of International Trade doi:10.1787/data-02279; Trade Policy Review EU, Table 2.2 page 32, Active free-trade agreements signed by the EU Dec 2012, www.wto.org
www.civitas.org.uk
36 • Where’s The Insider Advantage?
on an insider advantage provided by participation in the rule-making of the Single
Market have already made up their minds about this and accepted that UK export
performance will remain weak for the foreseeable future. Why else would they insist
that UK exporters could not cope very well without this insider advantage? Why
would they insist that the UK should at all costs cling on to it, and warn of serious
consequences for jobs in export-oriented industries if it failed to do so?
The higher rate of growth of UK exports to 25 non-member countries suggests that
UK exporters may not be quite as ineffective as their performance in the Single
Market indicates, nor as much in need of an insider advantage as the Prime Minister
and others think. Without it, they seem to have performed reasonably well. No
doubt, not well enough. The UK trade in goods account has been in deficit in every
year since 1980–82.1 But trade policy and trade analysis is, above all else, about
comparative advantage. The interest of these figures is therefore in the superior
growth of UK exports in world markets compared with the EU’s Single Market.
Moreover, this superior growth in world markets has been secured without all the
various costs that the UK has incurred in the hope, apparently, of propping up its
poor export performance in the Single Market. The direct cost to the UK taxpayer of
the annual EU subscription might properly be seen as a subsidy to UK exporters to
the EU, since their trade costs are lowered in return for the taxpayers’ payment. No
wonder, perhaps, that some of the large exporters are cheerleaders for the Single
Market. They themselves may also, of course, pay direct costs in the form of EU
regulations, but these costs are borne by all UK firms, whether or not they export
to the EU, and hence do not affect the exporters’ competitive position.2 There are
also opportunity costs of membership, because the UK, as a member of the EU,
has to wait on the cumbersome and slow EU negotiating procedures, requiring the
consent of all 28 countries, before trade agreements with fast-growing markets can
be negotiated and put into force.
As an independent country, the UK might well have concluded free trade agreements
long before the EU was able to do so. Iceland and Switzerland have already
concluded agreements with China.3 The EU has not even begun to negotiate. Its
trade negotiations with India began in 2007, but have still not been concluded.4 Mr
Blair forgot to mention that the ‘heft’ he values so much comes at a price, possibly
the high price of lengthy, even interminable delays to secure agreements which do
not match the priorities, or the revealed comparative advantages, of UK exporters.
However, we may best discuss these costs after we have completed the picture of
the UK’s fastest-growing markets.

A comparative study of UK exports to EU and non-EU nations between 1960 and 2012 • 37
www.civitas.org.uk
Table 6 shows the fastest-growing markets for UK services exports, though, for
reasons mentioned above, only for the years 1999–2010, and only for exports to 20
countries. Mexico is starred to indicate the EU had an FTA in services in force from
2001.
Overall, it does not differ greatly from the export of goods, though since the EU
was 13th of the top 20 fastest-growing markets for UK services over these years,
and only 26th of the 33 fastest-growing markets for the export of goods, it appears
that UK exports of services to the EU have been growing at a relatively faster rate
than those of goods. The main feature of the two tables is, however, the same: the
EU is a high-value market but a slow-growing one. With a total value of $91.4bn,
UK services exports to the EU 14 in 2010 constituted 37 per cent of the value of
Table 6Top 20 fastest-growing markets for UK exports
of services 1999–2010
Rank
% growth 1999–2010 In $1999
Total annual value in 2010
In $b
1 Iceland 256 0.2
2 Taiwan 231 1.7
3 India 189 3.1
4 Colombia 180 0.3
5 Switzerland 161 13.2
6 Australia 124 7.6
7 Morocco 114 0.2
8 China & Hong Kong 107 6.3
9 Turkey 104 1.7
10 Korea 99 1.7
11 Brazil 63 1.3
12 Thailand 61 0.7
13 EU 14 53 91.4
14 Norway 51 3.6
15 Egypt 46 0.8
16 Canada 44 4.3
17 Mexico* 40 0.6
18 Indonesia 39 0.5
19 US 34 49.7
20 Malaysia 31 1.1
* Denotes country with which the EU has preferential trade relations including services. The missing entry for exports to Australia in 2003 was estimated by taking the mid-point between 2002–2004 Sources: www.oecd-ilibrary.org. OECD database ‘Trade in Services by partner country’ doi: 10.1787/data-00274; Trade Policy Review EU, Table 2.2 page 32, Active free-trade agreements signed by the EU Dec 2012, www.wto.org

www.civitas.org.uk
38 • Where’s The Insider Advantage?
all services exports. Six of the top ten individual markets by value in 2010 were EU
members, with those to Germany worth $15.3bn per annum, to the Netherlands
$14.6bn, to France $12.6bn, to Ireland $12.1bn and to Spain $7.5bn.
If we again follow the common, rather misleading practice of measuring growth in all
EU countries as it expanded in 2004 and 2007 from 14 to 26 other members, then
UK exports to the EU would have grown by 63 per cent and risen to 12th place, again
marginally behind Brazil, with the EU share of services exports rising to just over 39
per cent and their total value to $97.5bn.
In the search for clues about insider advantages, the exports to the US are once
again of particular interest. The US is, by some distance, the largest single market
for UK services, and yet growth to that market is slower than exports to the EU. It
therefore repeats the pattern observed in the export of goods, where the US was
also the largest single market, and again grew slower than the EU. To understand
this difference, and the contribution that insider advantages may have made to it, is
far beyond the scope of the present analysis, but we may note that it is consistent
with the claim that the UK has enjoyed ‘insider advantages’ when trading with the EU
which it does not enjoy when exporting to the US. It may therefore be a clue as to
where we might look for insider advantages, not a strong one, because it is a solitary
example, and one is bound to wonder why the absence of insider advantages helps
to explain poor performance of service exports to the US but does not appear to
be a handicap when exporting to Switzerland, Australia or China and Hong Kong.
However, since we have few clues about where the insider advantages might be
found, we should not let slip any that do appear, however unpromising they may
seem.
A comparative study of UK exports to EU and non-EU nations between 1960 and 2012 • 39
www.civitas.org.uk
9. A country with neither heft nor cloutIn a recent policy document, the CBI referred repeatedly to what it called the ‘clout’
of the EU. It warned of the perils of the UK taking ‘the Swiss option (which) would
mean the UK negotiating global trade deals without the clout of the EU behind it’.1
Clout, we may assume, is much the same as Mr. Blair’s heft, and since this is the
only insider advantage that has been identified by name, albeit rather vaguely, it
deserves some attention.
Mr Blair spoke as if heft was an unalloyed benefit, while the CBI, to its credit,
admitted that ‘the value of the EU’s clout in trade negotiations is partially offset by
the cumbersome nature of negotiating as part of a bloc of 28 countries rather than
as a single nation’. It then went on to give ‘some downsides’ of ‘allowing the EU to
conduct trade negotiations on behalf of the UK’.
First, there is the simple fact that, as one of 28 EU states, the UK cannot guarantee
that its priorities will always be represented in trade talks and cannot fully dictate
which markets are prioritised for FTA negotiation. Some argue that the UK could have
been more nimble in negotiating its own trade deals – with the US or Commonwealth
countries, for example. Moreover, the number of places to influence the negotiation
process has resulted in competing national interests and defensive positions being
pushed by sectoral lobby groups in some EU states, slowing down some FTA
negotiations and reducing the scope for reaching agreement on contentious issues
such as agriculture. For example, this has been a feature of recent negotiations
involving both Canada and Mercosur. This is not helped by the institutional
procedures involved in negotiating FTAs that can lengthen the process and present
stumbling blocks to completion, including the need to square off interests in both the
Council and the Parliament.2
However, after mentioning these downsides, it decided, by some instant process
which it did not pause to document or explain, that these disadvantages were all
outweighed by the benefits of the EU’s ‘clout’. Coming so soon after its Director-
General’s call for the UK’s relationship with the EU to be assessed ‘using hard facts
and objective analysis’, this sleight of hand was rather less creditable, since there are
ways in which the benefits of clout in trade negotiations may be assessed. One is by
examining the experience of a country that has neither heft nor clout – Switzerland.
Switzerland has long had a pro-active strategy of negotiating trade agreements
according to two main criteria set by its Federal Council. These are the economic
importance of the possible partner country and the disadvantage its exporters might
suffer relative to its main competitors in that market.3

www.civitas.org.uk
40 • Where’s The Insider Advantage?
Table 7 lists the 26 Swiss agreements that the WTO records as currently in force,
alongside the 25 of the EU, giving the dates they came into force. Both sides have a
number of negotiations under way, a few of which have been signed, but for clarity’s
sake we list only those currently in force.
There are several points worth noting in this table. The first is that 13 of the 26 Swiss
FTAs came into force before the EU agreement and three came into force in the
same year. All 16 are highlighted in red, with the three in the same year starred. This
leaves 10 in black, which followed those of the EU. The Swiss have, in other words,
been rather quicker than the EU in negotiating and activating FTAs.
The second point to note is that the Swiss have six agreements in force for which
there are no EU counterparts: with Singapore, the Southern Africa Customs Union,
Japan, Canada, Ukraine, China and Hong Kong. Correspondingly, the EU has five
agreements in force for which there are no Swiss equivalents: with Syria, San Marino,
Algeria, Central America and Andorra. Without citing evidence for the moment, it
seems fairly safe to say that the Swiss, without the clout of the EU behind them, have
been able to conclude agreements with rather more important trading countries.
Mr Blair and the CBI seem to share a rather distinctive view of trade negotiations,
as if countries might be pushed or browbeaten by the EU into speedily concluding
FTAs favourable to the EU. The CBI argued that ‘the quality of a deal depends on the
balance of power between the parties’. Since the UK has less power or clout than the
EU, it would by itself be unable to negotiate ‘deep and ambitious’ FTAs:
It is difficult to envisage how a country the size of the UK could succeed in breaking
down the required regulatory barriers to trade with a major country in its own separate
trade negotiation… At the very least, the UK would find itself in a long queue to
sign deals with major economies on similar terms to those being signed by larger
blocs such as the EU. It is likely that FTAs with the UK would take second place to
agreements with the EU in the priorities of third countries.4
Lord Mandelson, the former EU Trade Commissioner, recently presented a similar
argument to the British Chambers of Commerce’s 2014 annual conference. He
predicted that countries like India would ‘just laugh in our faces’ and ‘walk away’
from negotiations if the UK chose not to operate as ‘a bloc with 500 million people
behind us’. Britain would, he thought, be left ‘whistling in the wind’ in its free trade
negotiations if it were no longer part of the European Union.5
Plainly, neither the CBI nor Lord Mandelson examined the WTO evidence. If they
had, they would not have found it in the least difficult to envisage how a country the
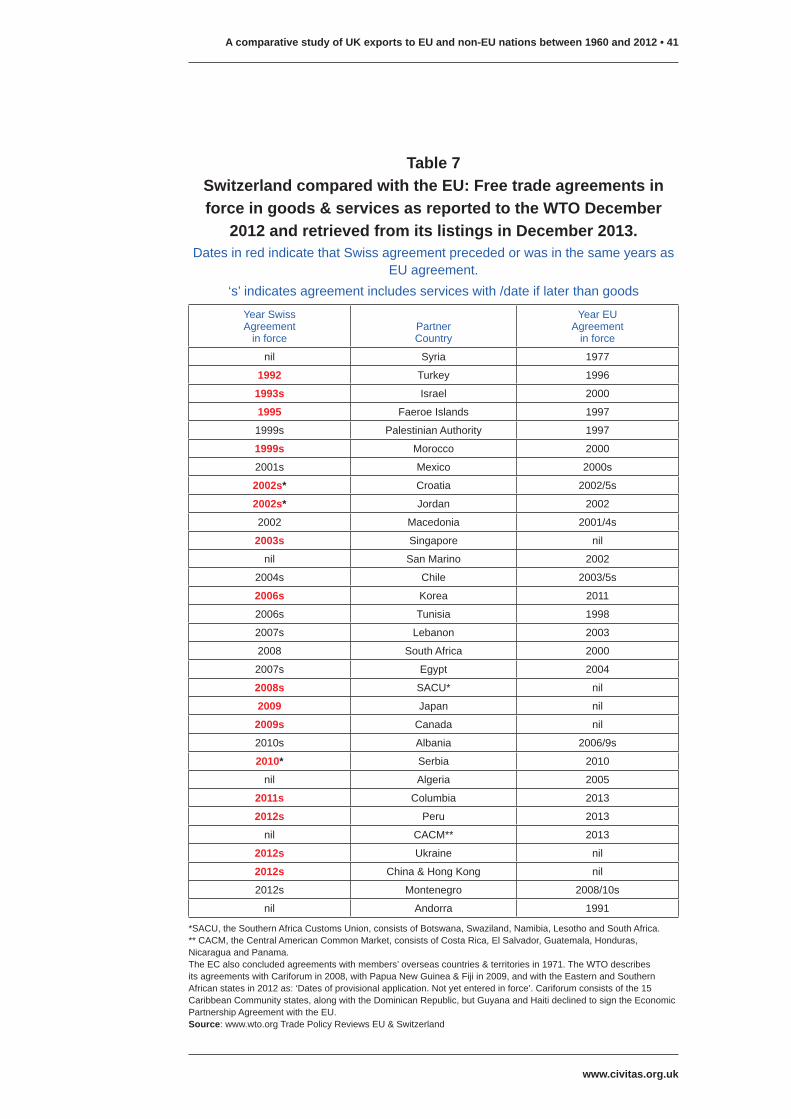
A comparative study of UK exports to EU and non-EU nations between 1960 and 2012 • 41
www.civitas.org.uk
Table 7Switzerland compared with the EU: Free trade agreements in force in goods & services as reported to the WTO December
2012 and retrieved from its listings in December 2013.Dates in red indicate that Swiss agreement preceded or was in the same years as
EU agreement. ‘s’ indicates agreement includes services with /date if later than goods
Year SwissAgreement
in forcePartnerCountry
Year EUAgreement
in force
nil Syria 1977
1992 Turkey 1996
1993s Israel 2000
1995 Faeroe Islands 1997
1999s Palestinian Authority 1997
1999s Morocco 2000
2001s Mexico 2000s
2002s* Croatia 2002/5s
2002s* Jordan 2002
2002 Macedonia 2001/4s
2003s Singapore nil
nil San Marino 2002
2004s Chile 2003/5s
2006s Korea 2011
2006s Tunisia 1998
2007s Lebanon 2003
2008 South Africa 2000
2007s Egypt 2004
2008s SACU* nil
2009 Japan nil
2009s Canada nil
2010s Albania 2006/9s
2010* Serbia 2010
nil Algeria 2005
2011s Columbia 2013
2012s Peru 2013
nil CACM** 2013
2012s Ukraine nil
2012s China & Hong Kong nil
2012s Montenegro 2008/10s
nil Andorra 1991
*SACU, the Southern Africa Customs Union, consists of Botswana, Swaziland, Namibia, Lesotho and South Africa. ** CACM, the Central American Common Market, consists of Costa Rica, El Salvador, Guatemala, Honduras, Nicaragua and Panama. The EC also concluded agreements with members’ overseas countries & territories in 1971. The WTO describes its agreements with Cariforum in 2008, with Papua New Guinea & Fiji in 2009, and with the Eastern and Southern African states in 2012 as: ‘Dates of provisional application. Not yet entered in force’. Cariforum consists of the 15 Caribbean Community states, along with the Dominican Republic, but Guyana and Haiti declined to sign the Economic Partnership Agreement with the EU. Source: www.wto.org Trade Policy Reviews EU & Switzerland

www.civitas.org.uk
42 • Where’s The Insider Advantage?
size of the UK could succeed ‘in breaking down the required regulatory barriers to
trade with a major country in its own separate trade negotiation’, since they would
have seen that Switzerland, with a GDP one quarter the size of that of the UK, has
frequently concluded agreements before those of the EU, without apparently finding
itself in ‘a long queue’ or taking ‘second place’ to ‘larger blocs’, or anyone ‘laughing
in their faces’.
The WTO evidence would, moreover, have given them still further proof that heft or
clout is not quite the all-important factor in trade negotiations they imagine. The US
has, I suppose, as much or more heft or clout than any country in the world, so if the
CBI’s fearful fantasy had any basis in reality, it would presumably have a very large
number of FTAs. It doesn’t. It currently has just 20, rather fewer than the 26 of the
Swiss, and their FTAs, like those of the EU, do not include some of the larger trading
nations.6 When one looks at their agreements, there is little sign that heft or clout
played a major part in securing them. Their agreement with Israel preceded that of
Switzerland by eight years, and that with NAFTA partner Mexico by seven, and with
Jordan by one, but their agreement with Chile was in the same year as the Swiss,
while that with Singapore came a year later, and that with Korea, where one might
suspect that heft played a part, came six years after the Swiss agreement. If there
was a queue to sign FTAs, the United States does not appear to have been at the
head of it.
The United States is, of course, the one glaring omission from the list of Swiss
agreements, despite it being a very important trading partner for the Swiss. Since
the EU has recently announced the start of negotiations for a free trade agreement
with the US, might this be a case where the EU is a step ahead of the Swiss? No!
It is not. The Swiss negotiations for an FTA with the US began in 2005, some eight
years before those of the EU, and they were terminated in 2006 on one key issue.
The small, heavily subsidized, but politically well-organized agricultural interest in
Switzerland would not contemplate free trade in agricultural products, and the US
would not contemplate an FTA without them. As very much a second best, the two
countries concluded a Trade and Investment Co-operation Forum Agreement.7
The third point to note about the Swiss agreements in force in 2012 is that 20 of
the 26 include services, whereas only six of the 25 EU agreements do so. It is no
surprise, of course, that Switzerland, a country with a large service sector, should
place such importance on securing agreements on services as well as goods, but
it is surprising, given the emphasis British governments over many years have put
on extending the Single Market in services, that the EU should have concluded so

A comparative study of UK exports to EU and non-EU nations between 1960 and 2012 • 43
www.civitas.org.uk
few. Presumably, since free trade in services between EU member countries is far
from complete, negotiating agreement with other countries is not the easiest task,
inherently far more difficult than negotiating goods agreements and at times, one
suspects, insurmountably so.
It is also surprising that, after repeatedly expressing its concern that the Single
Market in services be extended and deepened, the CBI did not rate this 20 to 6
disparity in the number of FTAs covering services a powerful consideration on
behalf of independently-negotiated FTAs. It did not even think it worth mentioning,
and pressed on regardless to argue that the EU can negotiate agreements which
would be quite beyond the UK were it to negotiate independently like the Swiss. Its
explanation is that:
The nature of the modern FTA, the quality of the FTA that UK industry requires to
properly realise global business opportunities, and the size of market the UK offers
to potential trading partners all indicate that the UK would struggle to match the
deals it can achieve and the market access it can attain if it attempted to strike out
alone with trade negotiations.8
The idea that the UK alone would be a small, inadequate, vulnerable country, quite
unable to cope in a fiercely competitive world, has long been a standard theme in the
EU supporters’ repertoire. It reappears frequently in making the case for the EU and
the Single Market, and at the time of the referendum in 1975 was a view that much
of the country, or at least of its media, seemed to share. Why the CBI has chosen to
repeat it in the context of negotiating FTAs is puzzling. What evidence do they have
that leads them to believe that the UK alone ‘would struggle to match’ the quality of
EU deals?
In the nature of things, one would expect an entirely UK negotiating team to have
a rather better understanding of the priorities and needs of British industry, and
better command of their special requirements, than the multinational appointees of
the European Commission. After all, UK representatives of all kinds in Brussels,
including the CBI, must at times struggle to make themselves heard and understood
by EC negotiators, if only because representatives of 27 other nations are, at the
same time, trying to do exactly the same thing. And one imagines that a single nation
team would not be distracted by multiple priorities, and that the feedback during
their negotiations would be more continuous, precise and intelligible than the multi-
national, and multi-sectoral inputs that accompany EU negotiations.9
Over many years the UK has, all by itself, negotiated Investment Promotion and

www.civitas.org.uk
44 • Where’s The Insider Advantage?
Protection Agreements (IPPAs), more generally known as Bilateral Investment
Treaties (BITs), which are often seen as the preliminary to full-blown FTAs. Currently,
the UK has 94 IPPAs in force, though the negotiation of new or revised ones has
lapsed of late since responsibility for them has been passed to the EU, which is
progressively incorporating them into its future FTAs.10 It almost certain that, when
these 94 IPPAs were being negotiated, the CBI was consulted frequently. Hence its
current strong preference for multinational appointees of the European Commission
to defend British interests in the negotiation of future IPPAs, along with future FTAs,
naturally raises the question of whether the CBI has found some of these 94 FCO-
negotiated IPPAs inadequate. Maybe this is why they decided that the UK on its own
lacked clout, or perhaps FCO negotiators were out-smarted by partner countries, and
therefore signed badly-framed agreements that have worked to the disadvantage
of CBI members.11 If the CBI has any evidence of this kind, it should have been
mentioned. Their argument would then hang together rather better than it does. As
it stands, we have to accept on faith the idea that multinational teams appointed by
the European Commission would always do a better job for UK exporters than teams
appointed by the FCO.
On the specific issue of the ‘quality’ of the ‘modern’ FTAs that it requires, the CBI is
still more reticent. Not only does it decline to give any evidence of pre-modern FTAs
that have, somewhere or sometime, fallen short of its quality standards, but it has
also declined even to identify the criteria by which it rates the quality of EU FTAs.12
This makes it rather difficult to evaluate their argument. Until the CBI conducts a
clause-by-clause, tariff-line-by-tariff-line, analysis of FTAs to show that the clout of
the EU has enabled it to negotiate agreements of greater quality or depth than those
of Switzerland (a task that it is well within its capabilities, and one that it should
surely should have conducted long since on its members’ behalf), we are reasonably
entitled to take the inclusion of services as an initial measure of an FTA’s quality and
depth. By this simple measure, the EU FTAs are inferior to those of the Swiss, and
the clout of the EU has been a handicap and a cost, not an insider advantage.
There is, however, a second, more persuasive and compelling way in which the
quality of FTAs may be measured, and that is by examining their results. They are
intended to increase UK exports, along with those of other members. Have they
done so?

A comparative study of UK exports to EU and non-EU nations between 1960 and 2012 • 45
www.civitas.org.uk
10. Measuring the benefits of the EU’s trade agreementsThis is a simple question, but fiendishly difficult to answer, since the impact of the
FTA has to be distinguished from the many other factors that may affect trade flows.
However, the Swiss State Secretariat for Economic Affairs (SECO) made a start in
2009. On the back of an academic study which had suggested that, on average,
FTAs doubled members’ bilateral trade after 10–15 years, it sought to discover
whether, and how far, Swiss experience thus far corroborated this finding.1 It found
that whereas between 1988 and 2008 Swiss worldwide exports increased annually
by 5.7 per cent, exports to countries with whom they had concluded agreements at
least four years previously had increased by 10.5 per cent annually. Perhaps a still
more interesting finding of its study was that, while trade was increasing, the share
of the top five Swiss export industries in those markets with which agreements had
come into force declined. This suggested, they argued, that the FTAs had helped
other Swiss firms and industries to increase their exports to those foreign markets,
and hence to diversify the Swiss export effort. 2
For many years the EC seems to have been content to make predictions about
the gains for the EU as a whole that would, it thought, follow their FTAs, just as it
routinely does with other policies, and allow these predictions, over time, to morph
into established facts, from which individual member countries were free to scale
down the supposed collective gains in exports and jobs to fit their own dimensions
and circumstances. This is, as Table 2 above suggests, a rather dangerous practice.
In any event, for a long time, there were no follow-up studies of FTAs, even though the
EC has, since 1999, been conducting ex ante ‘sustainability impact assessments’ of
proposed FTAs which focused on the environmental consequences of the proposed
agreement in the partner country.3 The breakthrough came in 2010 when the EC
decided it should ‘step up a gear in embedding impact assessments and evaluations
in trade policy making’, and ‘carry out ex post evaluation (of existing EU trade
agreements) on a more systematic basis’. This more systematic basis meant that
they would henceforth be evaluated not only for their environmental effects, but also
to see if they met their primary purpose of increasing trade.4
There have been two assessments for the EC thus far. The first, in 2011, compared
the impact of EU agreements in force with six countries and sought to isolate the
impact of the FTAs by two approaches, one relying on the gravity model and the
other on a so called ‘matched pairs’ approach, leaving the reader to decide between
them.5 The second assessment, in 2012, is a much more detailed, sectoral, tariff-

www.civitas.org.uk
46 • Where’s The Insider Advantage?
line-by-tariff-line analysis of the EU FTA with Chile which came into force in 2003.6
It was therefore able to measure the impact of tariff reductions on each sector, as
and when they were phased in, rather than taking an aggregate trade flows from the
formal starting date of the agreement.
There are, however, certain common methodological characteristics between the
two studies. Both make use of the gravity equation, though because the Chile study
thought ‘the accuracy of the gravity model’s predictions is limited’, it preferred to use
its own ‘transformed gravity equation’.7 Both make use of extensive comparisons with
other trading countries, attempting to reproduce the logic of a controlled experiment
by matching the FTA partner, as far as possible, with other trading countries and
hopefully leaving the FTA whose impact is to be assessed as the sole differentiating
factor. Both use general equilibrium models of the partner economy so that they can
trace the knock-on effects across the economy, though the authors of the Chile study
constructed their own model of the Chilean economy which included the elasticity of
substitution of EU imports, by sector, with those from other countries. It could thereby
measure the impact of Chile’s contemporaneous FTAs with other countries on its
FTA with the EU.
Both studies required comprehensive data series of numerous variables, since a
trustworthy gravity equation requires that every variable and eventuality that has
significantly affected trade between countries over time can be identified and
measured, and a trustworthy controlled experiment requires numerous other
comparable trading countries, similar to the subject country except that they are
without the FTA being analysed. Both, therefore, often had to be resourceful in
finding such data or devising acceptable substitutes. And both were, of course,
handicapped by the limited number of post-agreement years available to observe
the FTAs’ impact.
Perhaps the most significant result of these studies was that they agreed that the
extent of post-agreement trade was not, as far as they could tell, a good indicator
of the effectiveness of the FTA.8 For instance, the six-nation study decided that the
impact of the EU FTAs with South Africa and Mexico was statistically insignificant,
despite high post-agreement growth of EU exports to both countries.9 Similarly,
though EU exports to Chile recorded only modest post-agreement growth, both the
gravity approach of the six-nation study and the transformed gravity approach of the
Chile-only study agreed that the EU FTA with Chile had a strong positive impact on
EU exports, though their estimates of the amount of growth differed. The six-nation
study estimated that the FTA had increased EU exports by 148 per cent (though its

A comparative study of UK exports to EU and non-EU nations between 1960 and 2012 • 47
www.civitas.org.uk
alternative ‘matched pairs’ approach estimated that it had ‘an insignificant negative
effect that was trivially different from zero’) while the Chile study reckoned it was
between 40 per cent and 60 per cent.10 Despite these differences, they could agree
that the FTA with Chile had been effective, and that, without it, EU exports would
have grown much less than they actually did, and that the EU share of Chilean
imports from 2003 to 2008 would have fallen still further than they actually did, from
23 per cent to 16 per cent according to the IMF.11
In the present context, the main conclusion to be drawn from both studies is that
these are still early, exploratory days of attempts to isolate the impact of FTAs.12
Hence simple descriptive statistics, evidence about what has actually happened to
UK exports after the FTAs that the EU concluded on its behalf have come into force,
have a role to play, both in analysis and policy. They may be only the first step in
trying to assess what the impact of these agreements might have been, but they are
nonetheless an essential one. Why the UK government, or the CBI for that matter,
has been unwilling to take this first step is puzzling. European Commission studies
invariably amalgamate all the countries of the EU, with their several currencies,
languages, GDPs, RCAs and growth rates into a single trading unit. The resulting
statistical artefact is of limited relevance when trying to determine what the impact of
the EU FTAs might have been on UK exports. Hence, the government and the CBI
can have not the least idea of how effective or ineffective EU FTAs may have been
for UK exporters, and seemingly they have no wish to find out. Ignorance, it seems,
is bliss, and evidently no reason to hold back confident claims about the benefits of
EU FTAs.
In any event, these two pioneering European Commission studies provide a salutary
preface to the presentation of the pre- and post-agreement exports of the UK. They
remind us that FTAs do not mark an overnight transition from high to nil tariffs, but
normally phase in reductions, over shorter or longer periods of time, which are
differentiated by sector and leave some tariffs or quotas altogether unaffected. They
should, more accurately, be called freer rather than free trade agreements. Also, of
course, they hammer home the point that post-agreement exports, whatever they
may be, tell us nothing about the impact of an FTA until we have agreed a way in
which its impact can be distinguished from the multiplicity of factors that affect trade-
flows.
The evidence about UK exports presented in Table 8 refers to the 15 countries with
which the EU has an FTA which had been in force for at least five years prior to 2012,
and for which the OECD publishes adequate data. It shows the annual rate of growth

www.civitas.org.uk
48 • Where’s The Insider Advantage?
of UK exports of goods to these 15 countries over an equal number of years before
and after the agreement came into force, covering as many years as the date of
the agreement and/or the availability of the data will allow, since the impact of such
agreements may take many years to be felt. The number of years in each case is
shown in column 2. The total growth of UK exports over the years before and after
the agreement is shown (in columns 4 & 6), though since this figure depends on
start and end dates, and there are considerable annual fluctuations, the compound
annual growth rates (CAGR) over each period (columns 5 & 7) may be the more
helpful measure, and are therefore tinted. Since the OECD data for UK exports to
several of these countries is inadequate for all the years included, the fuller data of
imports from the UK was used throughout on the grounds of consistency. Growth is
measured in US$(1960) and is therefore real growth.
Table 8The impact of the EU’s Free Trade Agreements on UK exports: a
preliminary measureReal growth of UK exports of goods pre- and post- an EEC/EU agreement with 15 countries, 1960-2012, calculated in US$(1960) from data of imports from the UK by
the 15 countries
Partner country Date of FTA
Years Before & After
compared
Before agreement After agreement
Total growth %
Compound Annual Growth Rate %
Total growth %
Compound Annual Growth Rate %
Syria 1977 17 4 0.2 312 9
Turkey 1996 17 386 9.75 368 9.5
Tunisia 1998 15 168 7 286 9
Mexico 2000 13 58 4 29 2
Israel 2000 13 48 3 57 4
Morocco 2000 13 368 13 −21 −2
South Africa 2000 13 144 7 30 2
Macedonia 2001 8 −66 −13 −19 −3
Croatia 2002 9 129 10 105 8
Jordan 2002 11 90 6 58 4
Chile 2003 10 46 4 −3 −0.3
Lebanon 2003 10 24 2 122 8
Egypt 2004 9 75 6 44 4
Algeria 2005 8 391 22 284 18
Albania 2006 7 86 9 −16 −3
Korea, Peru, Columbia and others were omitted since their agreements were too recent to observe their effects. San Marino, Andorra and the Faeroe Islands were also omitted because the data was incomplete. Sources: www.wto.org Trade Policy Review EU; OECDiLibrary stats (2013), “Trade in value by partner countries”, Monthly Statistics of International Trade (database) doi: 10.1787/data-00279-en

A comparative study of UK exports to EU and non-EU nations between 1960 and 2012 • 49
www.civitas.org.uk
In the five of these 15 countries that are highlighted in red, both the total growth and
the CAGR of UK exports increased after an EU FTA came into force. In the remaining
ten countries both the total growth and the CAGR fell over the post-agreement years.
The total value of exports, in 2012, to the five countries where growth has increased
did not make up for their small number. It was $0.4bn per month, which is just short
of 20 per cent of the total exports of $2.2bn per month to the 15 countries in that year,
except for Egypt where 2011 was the latest year available.
On the face of things, these EU FTAs do not seem to have helped UK exporters
very much. However, to get an initial indication of how typical or remarkable these
results may be, we have conducted a similar analysis, according to exactly the
same rules, with 14 Swiss FTAs, before and after they came into force. As in the
UK analysis, the duration of the before and after periods is as long as the date of
the particular agreement and/or the availability of the data permit. Also as in the UK
case, adequate export data over the years being compared is available only for a
minority of countries included, so we again have to use imports from data for all 14
countries in the interests of consistency. The results are presented in Table 9.
The striking difference from the UK analysis is the number of entries highlighted in
red in column 7, which indicates those countries where the annual average rate of
growth of Swiss exports increased after the agreement came into force. There are
nine of them among the 14 countries, and the same nine also record an increase
in total growth over the post agreement years. This is in sharp contrast with the UK
where, as we have just seen, the average annual rate of UK export growth increased
in only five of the 15 countries with which the EU had negotiated an FTA.
A second contrast with the UK results is that the post-agreement increases in Swiss
exports appear to be rather larger than those of the UK. Overall, they do not quite
match the average annual doubling reported by SECO, but then the figures in Table
9 differ from those of SECO study, in that they cover longer periods of time, include
the economic crisis 2008–9, the subsequent skyrocketing Swiss franc and other
disturbing events in some Swiss export markets. Nevertheless, since Swiss exports
have more than doubled their average annual rate of growth in seven of the 14
countries after their agreements came into force, these results do not contradict the
SECO findings. By contrast, the UK managed to double its rate of growth to only two
small export markets, Syria and Lebanon, after EU FTAs.
Odds ratios provide another way of showing that the Swiss agreements are more
likely to be followed by growth. The odds of them doing so are 9:5, while the odds
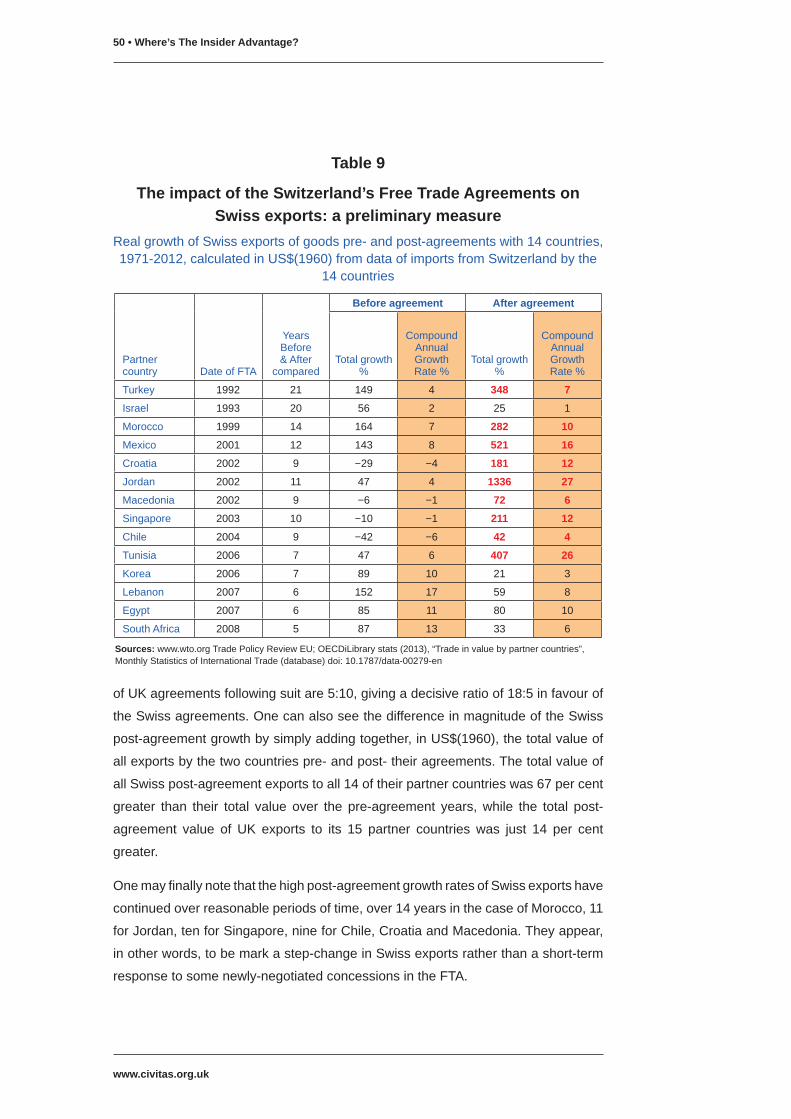
www.civitas.org.uk
50 • Where’s The Insider Advantage?
of UK agreements following suit are 5:10, giving a decisive ratio of 18:5 in favour of
the Swiss agreements. One can also see the difference in magnitude of the Swiss
post-agreement growth by simply adding together, in US$(1960), the total value of
all exports by the two countries pre- and post- their agreements. The total value of
all Swiss post-agreement exports to all 14 of their partner countries was 67 per cent
greater than their total value over the pre-agreement years, while the total post-
agreement value of UK exports to its 15 partner countries was just 14 per cent
greater.
One may finally note that the high post-agreement growth rates of Swiss exports have
continued over reasonable periods of time, over 14 years in the case of Morocco, 11
for Jordan, ten for Singapore, nine for Chile, Croatia and Macedonia. They appear,
in other words, to be mark a step-change in Swiss exports rather than a short-term
response to some newly-negotiated concessions in the FTA.
Table 9
The impact of the Switzerland’s Free Trade Agreements on Swiss exports: a preliminary measure
Real growth of Swiss exports of goods pre- and post-agreements with 14 countries, 1971-2012, calculated in US$(1960) from data of imports from Switzerland by the
14 countries
Partner country Date of FTA
Years Before & After
compared
Before agreement After agreement
Total growth %
Compound Annual Growth Rate %
Total growth %
Compound Annual Growth Rate %
Turkey 1992 21 149 4 348 7
Israel 1993 20 56 2 25 1
Morocco 1999 14 164 7 282 10
Mexico 2001 12 143 8 521 16
Croatia 2002 9 −29 −4 181 12
Jordan 2002 11 47 4 1336 27
Macedonia 2002 9 −6 −1 72 6
Singapore 2003 10 −10 −1 211 12
Chile 2004 9 −42 −6 42 4
Tunisia 2006 7 47 6 407 26
Korea 2006 7 89 10 21 3
Lebanon 2007 6 152 17 59 8
Egypt 2007 6 85 11 80 10
South Africa 2008 5 87 13 33 6
Sources: www.wto.org Trade Policy Review EU; OECDiLibrary stats (2013), “Trade in value by partner countries”, Monthly Statistics of International Trade (database) doi: 10.1787/data-00279-en

A comparative study of UK exports to EU and non-EU nations between 1960 and 2012 • 51
www.civitas.org.uk
What are we to make of these findings? They cannot tell us, we have already agreed,
to what degree FTAs might have been responsible for any increase or decline in
the growth of UK or Swiss exports. Perhaps their greatest value is the strong case
they make for continuous monitoring and analysis of the impact of EU FTAs, which
would allow us to distinguish their impact from other factors affecting export growth.
However, pending such analyses, these figures provide prima facie evidence that
Swiss FTAs have been more successful than their EU counterparts have been for
UK exporters. Until we identify the other factors that might explain the sharp contrast
between the post-agreement export performance of the two countries, we have to
give these results considerable credence, especially as no other evidence of any
kind has been collected by HMG, by the CBI or by anyone else.
They complete, one may observe, a fairly consistent picture on the impact of the
EU’s heft and clout in trade negotiations. We have already discovered that they
do not ensure speedier FTAs, do not take the EU to the front of the queue with
larger trading countries, do not help to extend their coverage to include services,
and we have now found that, in most cases, ten out of 15, the CAGR of UK exports
has actually declined after they came into force. It therefore seems highly unlikely
that either heft or clout have improved the ‘quality’ of EU FTAs, or that they have
much bearing on the successful outcome of trade negotiations. It is therefore hard to
believe that they constitute a vital insider advantage for UK exporters.
Correspondingly, the Swiss evidence strongly suggests that independently negotiated
FTAs may have considerable merits. The Swiss have been able to conclude FTAs
more speedily than the EU, with more important trading countries, more often
including services, and can reasonably point to the subsequent rate of growth of their
exports as evidence that they have been able to negotiate effective agreements. The
CBI may perhaps have some other standard of judging the quality of FTAs, but most
of its members who export goods would, I suspect, for the moment at least, accept
post-agreement export growth as the bottom line. With nine of their 14 agreements
followed by an increase in exports, they would, it seems reasonable to suggest, rate
the Swiss FTAs as being of rather higher quality than the EU-FTAs have been for the
UK, with a score of five out of 15. And would the service industry members of the CBI
accept their leader’s claims that EU FTAs are of high quality? The EU score on their
behalf is six out of 25, while the Swiss score for the inclusion of their industries is 20
out of 26. Are they expected to believe, without any further evidence, that the six the
EU has negotiated are of such quality that they compensate for the 19 agreements
from which they have been altogether excluded?13

www.civitas.org.uk
52 • Where’s The Insider Advantage?
Together, the discrediting of the heft and clout of the EU, and the vindication of
independently negotiated agreements, raise doubts about the basic principle of
the trade policy of the EU and the Single Market, i.e. that one set of negotiators
can simultaneously accommodate and effectively promote the trade interests of 28
countries, each with their distinctive comparative advantages. That doubt must be
especially strong in the case of FTAs in services.14 The record thus far suggests that,
in placing their hopes on the EC negotiating effective FTAs in services, British prime
ministers are expecting the impossible.

A comparative study of UK exports to EU and non-EU nations between 1960 and 2012 • 53
www.civitas.org.uk
11. On the opportunity costs of EU solidarityThe crux of the CBI argument in favour of outsourcing negotiations on trade with
non-member countries from the FCO to the European Commission is that the
(unmeasured) benefits and costs of doing so outweigh the (unmeasured) benefits
and costs of negotiating as an individual country. In the previous two sections, we
have sought to identify and measure the benefits for UK exporters of being insiders,
and able to take advantage vicariously of the EU’s heft and clout when negotiating
FTAs. We will now try to complete the picture by adding a word about their costs.
Since they are opportunity costs which are invisible and therefore painless to those
who pay them, they are extremely difficult to measure, and usually ignored in debates
about membership of the EU and the Single Market, since there is no one to draw
attention to them. The CBI has not, as far as I know, ever pointed out to its members
what they might have gained if EU FTAs had included coverage of countries, and of
services, to the same extent as those of the Swiss FTAs. However, a more striking
illustration of the neglect of this issue is Tim Congdon’s attempt to measure the costs
to the UK of EU membership. As a spokesman for UKIP, he had reason to count
every single cost, but he does not mention those incurred when a country delegates
its trade negotiations to the European Commission.1
One day, prior to a referendum on membership perhaps, a UK government will decide
to conduct a cost/benefit analysis of UK membership of the EU with the same rigour,
openness and impartiality as the ‘five tests’ assessments which Gordon Brown set
in train to evaluate the advantages and disadvantages of joining the euro. In the
meantime, we will simply draw attention to the points at which these costs arise, try
to get some idea of their scale, and, if at all possible, suggest how some of them
might be measured, on the grounds that it is better that there be known unknowns in
a debate rather than forgotten ones.
A country negotiating trade agreements on its own behalf sets its own priorities
about the partner countries with which it wishes to have an agreement in the light of
its own comparative advantages. The evidence presented suggests the Swiss have
done this rather well, but, as an EU member, the UK has had to give way to priorities
decided by the European Commission. We cannot know how the Commission’s
priorities have differed over the years from those of the UK government.
The EU FTAs in force suggest a slight bias towards Mediterranean and francophone
countries. It seems improbable that the UK, left to itself, would have placed Syria,
Morocco, Mexico, Algeria and Tunisia ahead of Japan, with which, as the prime

www.civitas.org.uk
54 • Where’s The Insider Advantage?
destination of Japanese FDI in Europe, it has close trading ties, or ahead of
Singapore, Canada and other Commonwealth countries. In particular, it seems hard
to believe that, if the UK had set its own priorities, negotiations with the US would
have waited until 2013. The UK would probably have been at least as enthusiastic
as the Swiss, and they, as we saw, made a start eight years earlier.
A rough measure of the difference between EU negotiated FTAs and those that
might have been negotiated independently by the UK can be obtained if we imagine
for a moment that the UK had never joined the EU and had negotiated FTAs
independently at the same rate as the Swiss. They would today not have access,
under FTA auspices, to ten markets covered by five EU agreements (with Syria,
Algeria, the six members of the Central American Common Market, San Marino
and Andorra) since Switzerland has no agreements with these countries. In their
place they would have access to ten markets with which Switzerland has concluded
agreements while the EU has not (Singapore, Japan, Canada, China and Hong
Kong, Ukraine and the four members of the Southern Africa Customs Union).
Table 10 shows that the UK, having exchanged one set of FTAs for another, would
have gained FTA access to ten far larger markets, and at the same time a great
deal more FTA coverage for its service industries, since nine of the Swiss-only
agreements include them, while none of the EU-only agreements that the UK would
have to abandon in the exchange do so.
Table 10FTAs in force in the EU in 2012
but not in Switzerland & vice versa by market size in 2012
EU only GDP(PPP)$b CH only GDP(PPP)$b
Syria 122 Singapore* 328.3
Algeria 327.7 Japan 4487
Costa Rica 62 Canada* 1484
Panama 63 Ukraine* 338
Honduras 33 China* 12471
El Salvador 45 Hong Kong* 372
Guatemala 77 Botswana* 34
Nicaragua 24.39 Lesotho* 4.0
Andorra 3.163 Swaziland* 6.5
San Marino 1.371 Namibia* 16.9
Total $758.624b Total $19541.7b
* indicates the agreement included services Source: http://data.worldbank.org/indicator/ accessed via http://en.wikipedia.org/wiki/List_of_countries_by_GDP_(PPP)

A comparative study of UK exports to EU and non-EU nations between 1960 and 2012 • 55
www.civitas.org.uk
We can, however, go further and count the costs and benefits of the exchange in
dollar terms. The aggregate 2012 GDP, in purchasing parity terms, of the five markets
in which UK exporters would have lost FTA assistance by not being a member of
the EU was $758.624bn, while the aggregate GDP (PPP) of the six countries to
which they would have gained FTA access by negotiating by themselves in the Swiss
manner was $19,541.7bn. In other words, they would have gained FTA access to
ten markets more than 25 times larger than the ten they lost. The figures are given in
Table 10. China is, of course, much the largest part of this gain. Without China, the
figure falls to $7,070bn, but the gain is still more than nine times the loss.
To return to the world as it is, with the UK a member of the EU, we must, of course,
put the figures the other way around. By allowing the EU to negotiate FTAs on the
UK’s behalf, UK exporters have gained free trade access to markets with a GDP of
$758.624bn, but have lost markets they might have had, if they had negotiated FTAs
independently as effectively as the Swiss, with a GDP of $19,541.7bn, and the FTA
coverage would, moreover, have included services in nine of these ten markets.
Another way in which the costs of these different priorities might be estimated is
to accept Switzerland simply as a marker of the time or date when an agreement
might have been concluded had the UK been negotiating on its own behalf, and then
count the cost of the years waiting for the EU agreement.2 If we do this, then we may
begin to count the costs with the four years before the EU concluded its agreement
with Turkey, the seven years before the agreement with Israel, and five years of
delay before the agreement with Korea, and so on, measuring the additional growth
attributable to the FTA, if there was any, after the EU agreement actually came into
force, to estimate what might have been achieved had the UK been negotiating on
its own behalf at the earlier date.
If we were willing to wait a while, we might do the same with the countries with which
the EU has yet to negotiate or finalise an agreement. Hence there is already ten
years’ delay waiting for an agreement with Singapore to come into force, five years
with Canada and Japan, and the wait for an agreement with China and Hong Kong
is now entering its second year, while that with the US is now entering its ninth.
At the end, after offsetting the costs of these lost years against extra growth of UK
exports in the six countries where the EU agreements preceded those of the Swiss,
we might arrive at a total of ‘the lost years of freer trade’ with the 14 countries where
the EU agreement followed the Swiss, which might reasonably be attributed to
membership of the EU.
www.civitas.org.uk
56 • Where’s The Insider Advantage?
To these lost years of freer trade, however, must be added the lost years of freer trade
in services with the 15 countries with which the Swiss already have FTAs covering
service industries in force and the EU has been unable to reach any agreement. For
a service-oriented country like the UK, the costs of these lost years of freer trade
in service industries to these 15 countries, including Korea, Canada and China, are
potentially very large indeed, and, of course, still mounting.
A grand total of the lost years of freer trade in goods and services would not, of
course, include any estimate of the differences in the substance of the agreements
that might be reached when a country negotiates for itself. Old hands in Brussels
often observe that the EU is all about compromise, and individual member countries
must inevitably compromise and sacrifice their own interests to enable EU trade
negotiators to proceed.3 These compromises or sacrifices are not merely gestures
of goodwill and community spirit, though diplomats may care to present them in
that manner. For the exporters involved, they are also costs, even though they are
seldom aware that they will be paying them. They might perhaps be best described
as solidarity costs, and they are quite distinct from the compromises that a country
must accept to secure the signature of the other party to the agreement.
Switzerland does not in fact avoid them altogether, since some of its FTAs are
negotiated under the auspices of EFTA, though the solidarity costs this entails are,
one guesses, minimal compared with those required of EU members, since they
only involve reconciling the interests of three other members: Iceland, Liechtenstein
and Norway.4 However, the critical difference between a free trade area and a single
market is that member countries of a free trade area do not surrender their freedom
of action with respect to trade policy and negotiations with other countries. The Swiss
negotiations with the US did not involve Norway and Iceland, and the agreement
that followed the failed talks did not mention them. NAFTA members have, likewise,
proceeded independently with respect to agreements with the EU. Mexico has had
an agreement in force since 2000. Canada has recently reached agreement on the
‘key elements’ of a Comprehensive Economic and Trade Agreement (CETA).5 The
Transatlantic Trade and Investment Partnership (TTIP) negotiations which have just
begun are therefore with the US alone.
The UK, by contrast, has surrendered its freedom of action in trade negotiations to
a supra-national entity, the EC, which must somehow reconcile the priorities and
interests of 28 countries. This is only possible with compromise piled on compromise
even before negotiations with the other side begin − indeed to enable them to begin.
These compromises may become known, one by one, to affected insiders and

A comparative study of UK exports to EU and non-EU nations between 1960 and 2012 • 57
www.civitas.org.uk
lobbyists, but they seldom attract public attention, and, numerous as they must be,
are therefore immeasurable. By chance, one that preceded the opening of the TTIP
negotiations between the US and the EU did attract media and public attention and
may serve as an illustration of an unknown number of others, not because it is typical
− it certainly isn’t − but because it illustrates the distinctive psycho-political dynamics
of negotiations of FTA negotiations which are a sub-plot of a greater project.
For several months in the spring and early summer of 2013, it was uncertain
whether these TTIP negotiations would go ahead at all, because France threatened
to veto them unless ‘cultural industries’ such as television, movies and online and
audio-visual entertainments were altogether excluded. However, on 15 June, EU
officials suddenly announced that the French demand had finally been met. In
her press conference after this breakthrough, the French Trade Minister, Nicole
Bricq, graciously added: ‘I am not talking about victory, because I don’t want to.
In negotiations we’re not alone. I’m all about European solidarity.’6 She could, of
course, afford to be gracious since the solidarity costs in this instance would be
paid by industries in those countries who had conceded to the French demand and
whose television, movie and online entertainment industries might have gained had
these things been included in the future agreement with the US.
Those countries were not identified, and understandably their representatives did
not hold a press conference to explain why they conceded to French demands,
and to explain or apologise to the sectors or industries directly affected that in the
interests of EU solidarity the opportunities that freer trade with the US might have
opened for them would not now be available after all. Since the UK has higher value
exports to the US in television, movies and online entertainment than any other
member, and the world trade in media goods and services is largely conducted in
English, the chances are that the costs in this instance will fall primarily on UK media
companies of all kinds. The French Trade Minister plainly knew which countries
were most affected, since they had evidently sought to avoid these costs behind the
scenes. After her comment on European solidarity, she went on to say: ‘The only
thing I regret is that, sometimes, I’ve been under the impression that some parties
were negotiating directly with the United States.’7 The parties to which she referred
were not otherwise identified, and the costs they will eventually pay are never likely
to be known.
No doubt, before these talks are brought to a successful conclusion, there will be
more smaller concessions in the cause of solidarity, and the probability is that most
of them will be towards less free trade, since vital national interests are more likely

www.civitas.org.uk
58 • Where’s The Insider Advantage?
to be served by defending existing firms and industries rather than by the prospect
of creating new ones. If the final briefings, tariff line by tariff line, given to the EU
negotiators by the EU representatives of the member countries before the talks
began, could be compared with their reviews of the agreement as a whole, tariff line
by tariff line, which they must present to their governments who must finally consent
to it, it might perhaps be possible to identify which industries and which countries will
pay the solidarity costs, though only after some years of observing the effects of the
agreement in practice. This is, however, not likely to be done, since it is not in the
interest of the Commission or any member government to do it.
FTAs of an independent country, like Switzerland or the US, are entered with a
specific, stated intent, and their results may be measured and debated as a routine,
if occasionally contentious, issue of public policy. For the EU, FTAs are very much
more. They are part of a larger project that transcends the gains or losses to
particular member countries: the building of a united Europe. They therefore have a
political dynamic that is absent from single country FTAs, which insulates them from
normal forms of accountability. Given the impenetrable confusion of the priorities
and aspirations of 28 countries, identifying winners and losers is in any case a
stupendously difficult task, but it is also vaguely ‘anti-European’ to try to do so,
which may explain why the EC never attempts the task. Losses to any one country
are therefore overlooked and forgotten, since they might generate animosities
among member countries or undermine support for the greater project among their
electorates. If by chance a loss, or potential loss, comes to light, as in the case of
the exclusion of ‘cultural industries’ from the TTIP negotiations, then it may instantly
be converted into a gain, as a contribution to the solidarity of Europe.8 The French
Minister of Trade instinctively understood this and invited the representatives of the
countries affected to consider their loss as a gain for European solidarity.
To sum up: this attempt to measure the costs of the EU’s heft and clout found some,
such as the size of lost markets and the lost years of freer trade, that might, in
principle, be estimated or measured, and suggested that these were on a scale that
could not be lightly brushed aside in any thorough cost/benefit analysis. However, the
solidarity costs which accompany them seem destined to remain unknown. Hence,
with benefits that turned out, in the preceding section, to be illusory, and costs that,
when they can be measured, look as if they might be very large indeed, the heft and
clout of the EU appear to be serious disadvantages for the UK rather than valuable
insider advantages.

A comparative study of UK exports to EU and non-EU nations between 1960 and 2012 • 59
www.civitas.org.uk
12. UK exports to new member statesIn the course of this search we have focused on founder members of the Single
Market and only incidentally referred to the new entrants of 1995, 2004 or 2007.
The reason for putting the 1995 entrants on one side was to avoid the misleading
practice of measuring growth in the Single Market while the number of economies
included within it has been increasing. An additional reason for ignoring the 2004 and
2007 entrants was that historical data about them is often incomplete and beyond
acceptable estimates.
However, the UK government report Twenty Years On: The UK and the Future of the
Single Market, published in 2012, has fewer reservations about referring to these
countries. It points to ‘the positive effect on the UK’s trade with the new Member
States’, and on three occasions tells us that UK exports ‘to the EU 12 have doubled
since 2004’, EU 12 in this context meaning the 12 who have joined since 2004.1
Since it nowhere else points to any significant improvement in UK exports to the
other member countries that might reasonably be attributed to membership of the
Single Market, this particular claim necessarily becomes the featured attraction of
the report. HMG, we must assume, wants the reader to see it as one of the major
benefits of the Single Market for the UK.
Unusually for a research report (and this one is published jointly with the Centre
for Economic Policy Research), it gives no citation saying where the evidence for
the doubling of exports to the EU 12 is to be found. Nor does it distinguish between
goods and services, or tell us whether the growth is real or nominal, or give us any
dates over which the doubling has occurred, or say which new member countries it
has in mind – a relevant consideration when trying to examine the claim since this
EU 12 have joined at different dates since 2004.
However, not wishing to let any claimed benefit of the Single Market slip by unnoticed,
we will try to evaluate it in our usual manner, by comparing the growth of UK exports
to the new members of the Single Market with the exports to them of non-members
who enjoyed none of the insider advantages of the UK. Unfortunately, this can only be
done satisfactorily with reference to three of the 2004 entrants − the Czech Republic,
Hungary and Poland − since they are the only three for which OECD publishes a full
set of data of the goods exported to them by OECD members and other countries
over the years 2004–2012. HMG may, of course, have had access to other evidence
but, as noted, did not mention any.
Table 11 presents the results, with the growth in the annualised average monthly

www.civitas.org.uk
60 • Where’s The Insider Advantage?
value of UK exports of goods, measured in current value dollars, to the three 2004
entrants over the years from 2004 to 2012, placed in an ordinal ranking of growth in
the value of the exports over these years with 24 non-member countries.
Sure enough, as HMG claimed, the UK has doubled the value of its exports to these
new members since 2004, in current value dollars at least. In real terms, when
measured in US$2004, it did not quite manage to do so. Growth was 99.47 per cent,
but there is no reason to quibble. In a comparative setting, it makes little difference
anyway. Doubling of exports may impress the uninitiated, casual reader or voter,
Table 11Percentage growth in the value of the export
of goods of 25 countries to the Czech Republic, Hungary & Poland, 2004–2012
in current value US$
1 Korea 482
2 South Africa 468
3 India 403
4 Mexico 399
5 China 332
6 Singapore 331
7 Russia 308
8 Hong Kong 302
9 Brazil 299
10 Malaysia 275
11 Israel 269
12 New Zealand 259
13 Australia 252
14 Vietnam 249
15 Canada 242
16 Turkey 229
17 Ukraine 201
18 Indonesia 197
19 Switzerland 167
20 Japan 157
21 Taiwan 151
22 UK 143
23 Norway 141
24 US 96
25 Iceland 44
Source: OECD iLibrary, Trade in value by partner countries, Monthly Statistics of International Trade (database) doi: 10.1787/data-00279-en

A comparative study of UK exports to EU and non-EU nations between 1960 and 2012 • 61
www.civitas.org.uk
and was presumably intended by HMG to do so, but by comparison with 24 non-
members, it can be seen to be a miserable performance, and certainly not something
that HMG should feature as a significant benefit of the UK being a member of the
Single Market. Like the rest of the evidence examined in this search, therefore, it
gives no indication or clue that the UK has reaped any particular insider advantages
from its membership of the EU.

www.civitas.org.uk
62 • Where’s The Insider Advantage?
13. A final look at the UK versus 11 outsiders This search began with a simple overview of UK exports of goods versus other OECD
countries, and we will end with one for the Single Market. Figure 6 compares the rate
of growth in the total value of UK exports of goods to the 11 other founder members
of the Single Market with the total value of the exports of 11 members of the OECD
who are not members of the EU and have therefore taken no part in its rule-making.
Eight are non-European OECD countries for which full data is available, and other
three are the OECD countries in Europe that remain independent.
Figure 6UK compared with 11 disadvantaged ‘outsiders’, 1993-2012.
Growth in total value of exports of goods to 11 founder members of the Single Market in US$(1993)
The OECD eight are Australia, Canada, Japan, Korea, Mexico, New Zealand, Turkey, and the United States. The three independent European countries are Iceland, Norway and Switzerland. Source: www.oecd-ilibrary.org. OECD database Monthly Statistics of International Trade doi:10.1787/data-02279
If we first consider UK exports relative to those of the eight other OECD countries
scattered around the world, it may be seen that, over the first six years of the Single
Market, UK exports of goods to the other 11 founding members of the Single Market
kept pace with theirs, indeed grew slightly faster. However, from 1999 on those eight
OECD countries, propelled disproportionately no doubt by the exports of Korea and
Turkey, began to grow at a faster rate and continued to do so until 2012 by which
time they had grown, in real terms, 64 per cent more than those of the UK.
OECD 8 UK 3 independent European countries
0%
20%
40%
60%
80%
100%
120%
140%
160%
2010200520001995

A comparative study of UK exports to EU and non-EU nations between 1960 and 2012 • 63
www.civitas.org.uk
Over the first decade of the Single Market, the performance of UK exports looks more
impressive by comparison with that of the three independent European countries.
Indeed, had this search terminated in 2002, we might well have taken the widening
gap in export growth over the preceding years as a clue that the UK was enjoying
an insider advantage in exporting to the other members of the Single Market. The
declining growth of these countries over the years 1993–2002 may have been
the result of protracted bi-lateral negotiations with the EU of their largest member,
Switzerland, a number of which dealt with tariffs, NTBs and trade facilitation issues.1
As it happens, it was in the year they came in force, 2002, that, as we can see,
the gap in the rate of growth of exports between the UK and these independent
countries started to close quite rapidly. Following the economic crisis of 2008, the
rate of growth of their exports moved ahead of those of the UK, and it continued to
do so until 2012, by which year their exports had grown by 27 per cent more than
those of the UK.
Once again, this evidence suggests that outsiders have exported to members of
the Single Market rather more successfully than the UK. At the same time, Britain’s
political and business leaders have been telling the British people of the insider
advantages that the UK enjoys as member of it. Where, one must again ask, should
we begin to look for those advantages, and for the disadvantages of not belonging
to it?

www.civitas.org.uk
64 • Where’s The Insider Advantage?
14 Twenty-one findings of this searchThis search has described and reported evidence about UK exports, primarily in the
hope of finding where best to look for the insider advantages of membership of the
Single Market. Since it has not found any strong clues, it must be deemed to have
failed in this respect. However, it has along the way reviewed a considerable body
of evidence about UK export performance in the Single Market, compared with that
of both member and non-member countries. Although all of this evidence has been
taken from the readily available and widely-used databases of the OECD, a number
of the findings that emerge from it are surprising, perhaps because the evidence
has been presented in a less common comparative format. In any event, they have
not hitherto been noticed or commented upon in discussion of the Single Market.
Twenty-one of the more important findings are summarised here.
1. The proportion of UK goods exports to 14 current EU members can be
measured as a proportion of the exports to the 22 OECD countries for which
we have data since 1960. While the proportion increased markedly in the years
before UK entry to the EEC from 50 per cent in 1960 to 62 per cent in 1972, it
fluctuated around that level through the two decades of the Common Market
(1973–1992) and the two decades of the Single Market (1993–2012), with a
high point of 70 per cent in 1986. In 2012 it was once again 62 per cent. By
this measure, membership of both the EU and the Single Market has had no
discernible impact on UK exports of goods to other member countries (p.10).
2. The proportion of services exports can only be measured in a similar manner
since 1999. In that year, the proportion of exports to 33 OECD countries going
to 14 EU countries was 49 per cent. In 2011 it was 48 per cent. Like goods
exports therefore, EU countries appear to have had a relatively stable share of
UK exports to OECD countries (pp.12–13).
3. By contrast, using these same measures, and over these same years, the
proportion of UK goods exports going to the three remaining independent
countries in Europe has doubled from 5.1 per cent in 1973 to 10.7 per cent in
2012, and of UK services exports has more than trebled from 6.1 per cent in
1999 to 20.2 per cent in 2012. In short, while the share of UK exports to fellow
EU members has been virtually stable, the share going to non-members in
Europe has risen steadily, leading one to suspect that both insider advantages
and outsider disadvantages are imaginary (pp.10–13).
4. If the UK is treated as an outsider exporting to the 11 other members of the
Single Market alongside non-members, it ranks 28th in a list of the top 35

A comparative study of UK exports to EU and non-EU nations between 1960 and 2012 • 65
www.civitas.org.uk
fastest-growing exporters to it, though the aggregate value of its exports to
these 11 countries exceeded those of the 27 non-member countries above it
(p.15).
5. When the other 11 founder members of the Single Market are treated in the
same way, as outsiders exporting to the others, the exports of goods of eight
of them have grown faster than those of the UK in total value and seven in per
capita terms. By both measures, the UK is some way below the EU 12 mean,
even though the total value of its exports to other members is the third largest of
the 12. The Single Market has not been a success for the UK in terms of export
growth relative to its EU partners (pp.17–18).
6. The growth of exports of goods of all 12 founder members of the Single Market
to each other has also been low when compared with the exports of non-
members to them. The Single Market has therefore been a low growth market
for all of its own members, but a high growth market for many non-members
(pp.15, 18).
7. The rate of growth of UK goods exports to the other 11 founder members
over the life of the Single Market contrasts sharply with their rate of growth to
these same countries during the Common Market decades 1973–1992. The
UK finished the Common Market decades in 16th place of the top 35 fastest-
growing exporters, with its exports growing more than the US and seven other
advanced OECD economies. In the Single Market decades, by contrast, the
growth of the exports of all of these advanced economies, including two of
the three non-EU members in Europe, has overtaken those of the UK. Over
the life of the Single Market, exports of the UK to other founder members of
the Single Market have therefore declined relative to those of these OECD
countries (pp.21–23, 26).
8. Japan is the only other major industrial country with a similar experience. Its
exports to the EU grew even faster than those of the UK during the Common
Market decades, and even slower under the 19 years of the Single Market
(p.26).
9. UK services exports to other members of the Single Market have grown at a
slow rate (53 per cent over 12 years) similar to that of the export of goods (81
per cent over 19 years). The UK ranks as the 22nd fastest-growing services
exporter to the Single Market, with the services exports of 21 non-member
countries having grown at a faster rate (p.31).

www.civitas.org.uk
66 • Where’s The Insider Advantage?
10. Although the services exports of these non-member countries are of much lower
gross value than those of the UK, the per capita value of those of Switzerland in
2010 ($7,060) were more than four times higher than those of the UK ($1,591),
and those of Norway ($2,073) some 30 per cent higher (pp.32–33).
11. UK exports of goods to non-EU countries have grown at a much faster pace
than those to other founder members of the Single Market. In the table of the top
33 fastest-growing markets for UK good exports, the 11 other founder members
of the Single Market are in 26th place, though the total value of exports to them
exceeded that of all the individual non-member countries ranked above them
(p.35).
12. The EU 14 finished in 13th place in the table of the top 20 fastest-growing
markets for the exports of UK services, though again with a much higher value
than the individual countries ranked above them (p.37).*
13. There is no evidence to suggest that the ‘heft’ or ‘clout’ of the EU has helped
secure more FTAs than those that might have been secured by independent
negotiations. There were 25 EU FTAs in force in 2012 while the Swiss had
independently negotiated 26, 13 of which came into force before those of the
EU, and three in the same year (p.41).
14. There is also no evidence to suggest that the ‘heft’ or ‘clout’ of the EU has
helped secure better FTAs. Twenty of the Swiss FTAs include services, while
only six of the EU FTAs do so. Moreover, the six Swiss FTAs for which there
was no EU counterpart include larger trading countries, like Japan, China and
Hong Kong and Canada, with an aggregate GDP(PPP) of $19,541bn while
the five EU FTAs for which there is no Swiss counterpart are smaller trading
countries, with an aggregate GDP(PPP) of $759bn (pp.41, 54–55).
15. The EC began to examine the effectiveness of its FTAs in 2011 and has thus far
completed one full-scale study, of the FTA with Chile. This does not consider its
impact on individual member countries. The UK government has never sought
to measure the impact on UK exports of any of the FTAs negotiated on its
behalf by the European Commission over the past 40 years. Nor as far as is
known, has anyone else. Hence comments by ministers, ex-ministers and ex-
EU trade commissioners, business leaders and others on their merits can only
be wishful thinking (pp.45–47).
* Since exports of services data is available only from 1999, there is no reason to limit the evidence to the 11 other founder members of the Single Market, and hence the three 1995 entrants, Austria, Finland and Sweden, are included in these calculations.

A comparative study of UK exports to EU and non-EU nations between 1960 and 2012 • 67
www.civitas.org.uk
16. A preliminary measure of the impact of EU FTAs on UK exports is provided by
comparing the total growth and the compound annual average growth rate of UK
exports to 15 countries before and after they came into force. Post-agreement,
both total growth and CAGR increased in five of the partner countries, and
declined in the other ten (p.48).
17. Although no conclusions can be drawn about the contribution of the EU’s FTAs
to these outcomes without analysis of the other factors which influenced UK
exports over the periods compared (pp.45–47), a preliminary assessment of
their effectiveness may be made by comparing them with the outcomes of 14
Swiss FTAs. Whereas UK exports increased in five of the 15 countries with
which the EU had negotiated FTAs, Swiss exports increased in nine of the
14 countries with which it had independently negotiated FTAs. Moreover, the
post-agreement increases in the rate of growth of Swiss exports to these nine
countries were consistently and significantly higher than the post-agreement
increases of UK exports to the five countries where there was an increase. In
seven cases, Swiss exports doubled, and in six of them more than doubled.
The UK has only two such cases (pp.48–50).
18. Since there is no evidence that the EU has been able to secure more FTAs
than the Swiss, or more quickly, or of higher quality, or with better outcomes,
this evidence raises doubts about the basic principle of EU trade policy, that the
trade interests of individual countries are best promoted collectively rather than
individually (pp.51–52).
19. Some of the costs of surrendering the right of negotiating FTAs to the EU
might be estimated by counting the size of the markets they do not cover by
comparison with those covered by Swiss FTAs, and by the lost years of freer
trade in goods and services resulting from the delays in concluding EU FTAs
with countries with which Switzerland has already concluded agreements.
However, these are opportunity costs, invisible and painless to those who
pay them, therefore unnoticed and unmeasured by any observer, and likely to
remain so in the interests of EU solidarity (pp.53–58).
20. The UK government recently claimed that one of ‘the positive effects’ of the
Single Market is ‘the doubling of UK exports to new member countries’. There
is adequate data on the growth of UK goods exports to only three of the post–
2004 EU entrants: the Czech Republic, Hungary and Poland. While UK exports
to these three new member countries had doubled, in real terms, between

www.civitas.org.uk
68 • Where’s The Insider Advantage?
2004 and 2012, this is a slower rate of growth than the exports to these same
countries of 21 non-EU member countries (pp.59–61).
21. A final overview showed that over the 19 years of the Single Market, the exports
of goods of eight OECD countries to the 11 other founder members have grown
64 per cent more than those of the UK, and the exports of the three independent
European countries have grown 27 per cent more (pp.62–63).

A comparative study of UK exports to EU and non-EU nations between 1960 and 2012 • 69
www.civitas.org.uk
ConclusionIn all the evidence reviewed, the only point at which one might have reason to believe
that the UK might have enjoyed some kind of insider advantage which helped its
exports does not refer to the Single Market at all, but to the two Common Market
decades preceding it. UK exports to EU countries then grew at a consistently faster
pace than those of other major OECD countries.
In the attempt to identify occasions and countries, over the life of the Single Market,
that might possibly lead one to suspect that the UK has enjoyed an insider advantage,
one may first identify those advanced countries whose exports of both goods and
services to the EU grew less than those of the UK. There is just one case: Japan.
And a similar filter to identify those countries to which UK exports of both goods and
services have grown slower than those to the EU, and might therefore also give rise
to the suspicion that insider advantages were helping UK exports to the EU, also
yields just one case: the United States.
The very fact that only one country, rather than a set, falls in each category makes
one doubt that the UK enjoyed some distinctive, generic advantage over outsiders in
either context. Why would the UK’s insider advantage when exporting to the EU only
stand out clearly when compared with Japan’s exports to the EU? Why would the
growth of UK exports to the EU look as though they might enjoy an insider advantage
only when compared with its exports to the United States? To eliminate other
plausible answers to these questions, and to demonstrate that insider advantages
were a factor in these two cases, would require research far beyond the scope of the
present paper. A subsequent, more thorough search for insider advantages might
perhaps consider them, though only as long shots.
Apart from these two remote possibilities, the evidence presented above contradicts
again and again those who wish to claim that the UK has enjoyed an insider
advantages in the Single Market. The growth of UK exports to other founder members
was low when compared with UK exports prior to its launch, low when compared with
the exports of goods of 27 non-members to the other founder members of the Single
Market, and low when compared with the exports of services of 21 non-members
to the other founder members. It was also low when compared with UK exports of
goods and services to non-member countries. There was therefore no prima facie
evidence that the UK enjoyed any insider advantage, and therefore no obvious place
to look for it.
To accept the idea that, despite the absence of prima facie evidence of insider

www.civitas.org.uk
70 • Where’s The Insider Advantage?
advantages, UK exporters have nonetheless benefited from them, obliges one to
accept some scarcely credible, counter-factual propositions. One would, for example,
have to accept that, had the UK not enjoyed insider advantages, the goods exports
to the EU of still more than the 27 non-member countries listed in Table 1 would have
grown faster than those of the UK, and the services exports to the EU of still more
than 21 non-member countries listed in Table 4 would have grown faster than those
of the UK over the life of the Single Market. Likewise, the EU would not have been
the 26th fastest growing market for UK exports, but the 27th or 30th or some still
lower ranking. Is this possible? Could the Single Market really have been quite such
an unpromising market for the growth of UK exports? Could it really have been still
more of a failure than the figures above suggest?
It is similarly hard to accept the idea that there are disadvantages to non-membership,
since the exports of goods and services to the EU of so many ‘voiceless’ and
‘powerless’ nations, both developed and less developed, who had never been ‘at the
table’ or even ‘in the overflow room’, have grown faster than those of the UK. Indeed,
this has been such a common occurrence that any researcher simply following the
evidence is bound to wonder whether the main research question might not be better
turned the other way around, and instead of studying the disadvantages of non-
membership it would be rather easier to analyse those of membership.
Chief among them would be the right to negotiate trade agreements independently,
since the only evidence we have suggests that the costs to UK exporters of
surrendering that right, in lost opportunities of freer trade, have been terrifyingly
large, perhaps more than all the other costs put together. It is just as well for those
who favour EU membership that successive UK governments have agreed that
these costs should never be measured, estimated or even mentioned. If they are
anything near those suggested by the Swiss comparison, it is difficult to believe that
the UK would still be a member of the EU.
Insider advantages will only rate inclusion in any serious assessment of the economic
case for EU membership when those who make claims about them identify and
document specific advantages for UK exports.* Until they do so, we may reasonably
conclude that they cannot form a sensible basis of public policy decisions and do
not contribute to an intelligent debate about the merits of EU membership. That
debate has to recognise that, thus far, the Single Market has not enabled UK exports
* As ex-EC trade commissioners, a rather special responsibility would appear to fall on Lord Brittan, Lord Mandelson and Baroness Ashton in this respect, unless their oath of loyalty to the EU should prevent them speaking freely on this subject.

A comparative study of UK exports to EU and non-EU nations between 1960 and 2012 • 71
www.civitas.org.uk
of goods or services to other members to grow at a faster rate than those of non-
member exporters, nor at a faster rate than UK exports to non-member markets. It
has been an era of decline for UK exporters, relative to both non-members in the
same market, and to UK exports to other markets.
To present it as a success, in the manner of the UK Department of Business, Innovation
& Skills’ recent portrayal of the doubling of exports to new member countries, or to
claim it is a prized achievement, or a ‘privilege’, or ‘a vital national interest’ that
must be defended at all costs, only sounds vaguely plausible if UK exporters are
never compared with those of other member or non-member countries, and if their
performance in the Single Market is never compared with their performance before
it existed, or with their performance in other markets. Once such comparisons begin
to be made, these claims are seen to be empty rhetoric, and those who repeat
them may be seen to have been misleading themselves and others about the merits
of the Single Market. Unfortunately, constant repetition of them over recent years
has already done immense harm, since they have discouraged close investigation,
measurement and analysis of the UK experience within the Single Market. We have,
therefore, still not begun to understand what has gone wrong and how it might be
fixed.


PART IIThe impact of the EU
on foreign direct investment in the UK from 1970 to 2011


The impact of the EU on foreign direct investment in the UK from 1970 to 2011 • 75
www.civitas.org.uk
IntroductionThis paper seeks to answer three questions:
► DidentrytotheCommonMarketin1973boostforeigndirectinvestment
(FDI)intheUK?
► DidtheUKdecisionnottojointheeuroadverselyaffectFDIintheUK?
► HastheSingleMarketattractedFDItotheUK?
AfterbrieflyreviewinghowFDIhasfeaturedinthedebateaboutUKmembershipof
theEuropeanUnion(EU),itwilltrytoanswerthesethreequestionsbyexaminingand
reportingtheavailableevidenceinthedatabasesoftheUnitedNationsConference
onTradeandDevelopment(UNCTAD),andtoalesserextenttheOrganisationfor
EconomicCo-operationandDevelopment (OECD),which thus farhavenotbeen
usedindiscussionsaboutFDI.
However, before examining this evidence, it is necessary to discuss some
methodological issues.TheUNCTADandOECDdatabaseswewillbeusingmay
be the best available evidence on FDI cross-national flows and stocks, but they
bothhaveflawsandlimitations,aswellasdisagreements.Whilethesecannotall
beresolvedorsettled, itseemssensible, ifwewishtodrawconclusionsfromthe
evidence,thattheyshouldatleastberecognised.Problemsalsoarisewhenmaking
thecomparisonsbetweentheEU,asitsmembershiphasincreasedovertheyears,
andindependentcountries.Suchcomparisonsareessential ifwehopetoidentify
whattheimpactoftheEUonFDIintheUKmighthavebeen,butopinionsdifferon
whichcomparisonsarethemostappropriateandlegitimate.Itagainseemssensible
toexplainthereasonsformakingcomparisonswithcertaincountrieswhilstignoring
othersbeforepresentingandexaminingtheevidence.
TheminormatterofthenameoftheEUmayalsoberesolvedbeforewebegin.Ithas,
ofcourse,changedovertheperiodunderexamination.However,touseitscorrect
nameat the time,when referring to changes that spanmore than four decades,
makes for a clutteredand confusing text.Unlessoneof theearlier names− the
EuropeanCommonMarket, theEuropeanEconomicCommunityortheEuropean
Community − can be used unambiguously, it is therefore described as the EU
throughout,eventhoughthatnamewasonlyformallyassumedin1993.
Someofthesepreliminaryissues,importantastheymaybe,willnotbeofinterestto
allreaders.ThosewhoarealreadyfamiliarwiththeUNCTADandOECDdatabases,

www.civitas.org.uk
76 • Where’s The Insider Advantage?
arenotinterestedinmethodologicalproblemsandhavenowishtoknowwhycertain
countrieshavebeenomittedfromsomeanalyses,shouldjumptopage94,where
thesearchproperbegins.Thosewhodonotwishtofolloweverystepofthesearch,
andonlywishtoknowitsmainfindingsandtheanswerstothethreequestionsthey
suggest,shouldjumpdirectlytopage133.
FDI:asuspicionbecomesafactForeign direct investment (FDI) is one of themost persistent themes in debates
aboutthemeritsofUKmembershipoftheEU,oftheeuroandoftheSingleMarket.
Theofficialdocument,draftedbythethenPrimeMinisterandsenttoeveryhome
in Britain before the referendum in 1975, tentatively suggested that ‘if we gave
upmembershipof theCommonMarket…foreignfirmsmighthesitatetocontinue
investmentinBritain.’
Overtimethissuggestionhashardenedintoaconfidentclaim.In2002,apamphlet
published by the Britain in Europe, a PR group financed by British and foreign
multinationalspushingforBritaintoadopttheeuro,claimedthat,afterdecliningto
jointhenewcurrencyfromitsstart,‘Britain’srecordforattractingforeigninvestment
hasdeclinedfairlydramatically’,while‘officialECfiguresshowadramatic384per
centincreaseinthevalueofforeigninvestmentintheeurozone’.Theywentonto
warnthat:‘thissituationwouldworsenfurtherifBritainweretostayoutinthelong
term.’1
TheissuesurfacedagaininDecember2011,whenMrCamerondeclinedtoagreeto
anewEUtreatytorescuethestrickencurrency.BBCnewsreports, correspondents
andinvitedguestsgreetedthedecisionwithdismayandhorroronthegroundsthat
itwouldleavetheUK’isolated’and‘marginalised’withintheEU,andthereforeput
at risk the inwardflowof foreigndirect investmentand the jobs that flow from it.
Referringtoconversationswithunnamed ‘business leaders’,RobertPeston,BBC
TV’sBusinessEditor,explainedtohisnationalaudiencethatifmultinationals‘begin
toseetheUKasanisolatedisland,theywillnotwishtostay.Soitwouldreallymatter
iftheUK’splaceintheworld’sbiggestmarket…weresomehowindoubt.Whichis
why…businessesarenowdesperatetohearapositivestatementfromMrCameron
abouthowtheUK’spositionintheSingleMarketcansomehowbebuttressed.’2
One year later, in early 2013, in response to press and public pressure for a
referendum on continued membership of the EU and to Mr. Cameron’s attempt
torelieve thatpressurebypromisingonefiveyearshence, ifhewerere-elected,
variousmembersofthepoliticaleliterushedtosupportcontinuedmembership.First,

The impact of the EU on foreign direct investment in the UK from 1970 to 2011 • 77
www.civitas.org.uk
theformerPrimeMinisterTonyBlair,thentheleaderoftheopposition,EdMiliband,
andthenanotherformerPrimeMinister,SirJohnMajor,allmadespeechesstressing
the importanceofEUmembership. InhisspeechatChathamHouse inFebruary
2013,SirJohnaskedwhetherforeigncarmanufacturerspresentlymanufacturingin
theUKwouldremain‘orwouldtheyrelocateandplacefutureinvestmentinsidethe
EuropeanUnionwithnotariffontheircars?’Andwould‘companiesfromaroundthe
worldwhoinvestover£30billionayearintheUnitedKingdombemore–orless–
likelytodosowithoutunfetteredaccesstotheEuropeanmarket?Tome,theanswer
isself-evident.’3
Newspaperssympathetic to theEUchimed inwithnewscoverageandeditorials
bypointingouthow leaving theEUwould threatenFDI in theUK.TheFinancial
Times went further thanmost.A long-time fervent supporter of theEUproject, it
managedtoinsertintoanewsreportofavisitbytheIrishPrimeMinistertoLondon
the followingsentence: ‘Ireland,whichholds therotatingpresidencyof theEU, is
wellplacedtowinforeigninvestmentprojectsdiscouragedfromlocatingintheUK
becauseofuncertaintycausedbyMrCameron’sreferendumpledge.’4
ThereportthenwentontoquoteotherIrishnotableswhoallhelpfullymaderemarks
supportingtheFTposition.PeterSutherland,aformerdirector-generaloftheWorld
TradeOrganisationandEuropeanCommissioner,forinstance,observedthat:‘the
prolonged period of uncertainty about the UK’s EU membership could damage
British interests…Thiswill contribute to itsmarginalisationandcouldposesome
threattoinwardinvestment.’JohnBruton,aformerIrishPrimeMinister,obligedthe
FTbysaying:‘IrelandcouldcapitaliseonuncertaintycausedbytheUK’sreferendum
pledgeasinvestorsquestionedwhetheraUKoperationwouldremaincompliantwith
EUregulations.Inthelongterm,ifyouareindoubtaboutwhethertheUKisinorout
oftheEU,thenitcouldbemuchhardertoattractinvestmenttoBritain’.Atthecostof
afewphonecalls,oneguesses,anFTheadline‘news’storywasborn,whichhappily
coincidedwithitseditorialstance.5
Itwouldnotbedifficult tofindotherexamplesofpolitical leadersandmediawho
supportEUmembershipusingthisFDIargument.Ithasbeenafavouritestandby
overtheyears,thoughtheremarkablefactisthatfewofthosewhohavemadeuseof
ithaveeverfeltthattheyneededanyevidencetosupportit,andnoneatall,asfaras
Icandiscover,haveeverreferredtothetwoprimaryandreadilyaccessiblesources
ofcross-nationalevidenceaboutFDI,thedatabasesofUNCTADandOECD.
Oncethereferendumof1975waswon,theLabourgovernmentofthedayobviously
hadnoreasontogiveanymorethoughttowhatmighthavehappenedtoFDIhad

www.civitas.org.uk
78 • Where’s The Insider Advantage?
itbeenlost,andinanycase,atthetime,cross-nationaldataaboutFDIwasrather
limited.Over thesubsequent38years,however, it isa littleodd thatwhileevery
governmenthasacknowledgedtheimportanceofFDI,andtheevidenceaboutithas
accumulated,nonehasmadeanyattempttocollectandanalyseitinordertosee
whetherandhowitmighthavebeenaffectedbyEUmembership.Thebigbusiness
pressuregroupBritaininEuropeanditssuccessorBusinessforNewEuropehave
bothcommissionedsomeresearchtomaketheircase,butneitherofthemthought
theyneededtogosofarastorefertotheprimarysourcesavailableafteracouple
ofclicksintheUNCTADorOECDdatabases.TheBBC’sBusinessEditorpreferred
his conversationswithunnamed ‘business leaders’,whileSir JohnMajor, though
havingampleopportunityoverhissevenyearsinofficetoaskforsomeresearchon
FDI,evidentlydecidedhisownintuitionswereanadequateguideforpublicpolicy.
Why should this be? Why should hearsay, intuition and inference be preferred
to readily accessible evidence?Why should peoplewho arewell able to initiate
researchonFDI,liketheeditoroftheFTorSirJohnMajor,neverdoso?Theanswer
seemstobethattheirintuitionsandinferencesabouthowforeigninvestorswill,or
must, behave seemsoutterly reasonableand commonsensical that they feel no
needtospendor,asitnodoubtseemstothem,wastetimeconfirmingthem.
Isn’titobvious,afterall,thatinvestorswouldprefertoinvestin‘theworld’slargest
singlemarket’, rather thana relativelysmallone like theUK?And isn’t itentirely
reasonabletoassumethat‘foreigninvestorswanttoserveaEuropeanmarketfree
of the riskofexchange rate fluctuations’?And that theywouldprefernot to face
tariffbarriers?Whatsaneandsober investorwouldpreferasmallmarket,witha
fluctuatingexchangerate, facingtariffbarrierstoexport tothe‘theworld’s largest
singlemarket’?Almostwithoutnoticingit,however,allthosemakingsucharguments
slipbeyondreasonableinferenceandcommonsense,andassumethattheyhave
identifiedtheprimary,andeventhesole,determinantofforeigninvestors’decisions.
Thisassumptionisfarfromreasonableandleadstoconclusionsthatarenotatall
obviousorcommonsensical.
InferenceandevidenceaboutFDIUNCTADresearchers,whoprobablyknowmorethanmostaboutinvestors’decisions
since they have been recording them systematically and analysing them since
1970,arealwaysextremelycautiouswhencommentingontheirdeterminants.They
repeatedly observe that investment decisions are influenced by a ‘host of nearly
unquantifiablesocial, politicaland institutional factors’. In1993, theynonetheless
sought to quantify ‘the nearly quantifiable’ and, after identifying eight key factors

The impact of the EU on foreign direct investment in the UK from 1970 to 2011 • 79
www.civitas.org.uk
thattheythoughtmadeacountryattractivetoforeigninvestors,constructedanFDI
PotentialIndex.6Theeightfactorswere:therateofGDPgrowth;percapitaincome;
theshareofexportsinGDP;thenumberoftelephonelinesper1000inhabitants;the
energyusepercapita;theshareofR&Dexpenditureingrossnationalincome;the
proportionoftertiarystudentsinthepopulation;andafinal,vaguefactor,whichlong
remainedunquantifiable, ‘politicalandcommercialrisk’.Theysaidnothingdirectly
aboutthesizeofthemarketorexchangeraterisksoreventariffs.
UNCTADhasbeenimprovingandamendingitsindexeversince,whileperiodically
admittingthat:‘itisnotpossible,withtheavailabledata,tocapturethehostoffactors
that can affect FDI’.7 In 2003 they added fourmore variables: a country’s share
of ‘worldexportsofnatural resourcesandservices,ofworld importsofpartsand
componentsofelectronicandautomobileproducts,andoftheworldstockofinward
FDI’.ThesecamealittlecloserperhapstothefactorsthattheEUsupportersinthe
UKthoughtweretheall-importantdeterminantsofFDI,butnotthatclose.
In2009,threeSpanisheconomistsmadeaninterestingattempttoimproveandrefine
UNCTAD’sinwardFDIPotentialIndex.8Aftersearchingthrough‘thevastempirical
literatureregardinglocationdeterminants’,theydecidedthattheyshouldincorporate
70variables,manyofwhichtheyrecognisedwouldshiftovertime.Inamongstthese
70variables,theyatlastincludedexchangeratestability,tariffratesandmarketsize
andgrowth.
Forthese,andmanyotherspecialistanalysts,thetaskofidentifyingthedeterminants
ofFDIisevidentlyanarduous,intellectuallychallengingtask,andstillverymucha
work in progress, and not quite the doddle the EU-supporters in theUK quoted
aboveseemtothinkitis.
A few researchers have preferred to ask investors directly about their decisions.
An Ernst & Young survey in 2005, for instance, included follow-up interviews
withkeydecision-makers in98of the787multinationalfirmswhichhad invested
in six European countries over the years 1997–2003.9The interviewswere non-
directiveandopen-ended,theinformantsbeingaskedtoidentifyanyofthethings
thatmighthaveaffectedtheircompany’sdecisiontoinvestinaparticularcountry.
Theproportionsofitemsmentionedintheiranswersarepresentedinthepiechart
overleaf.
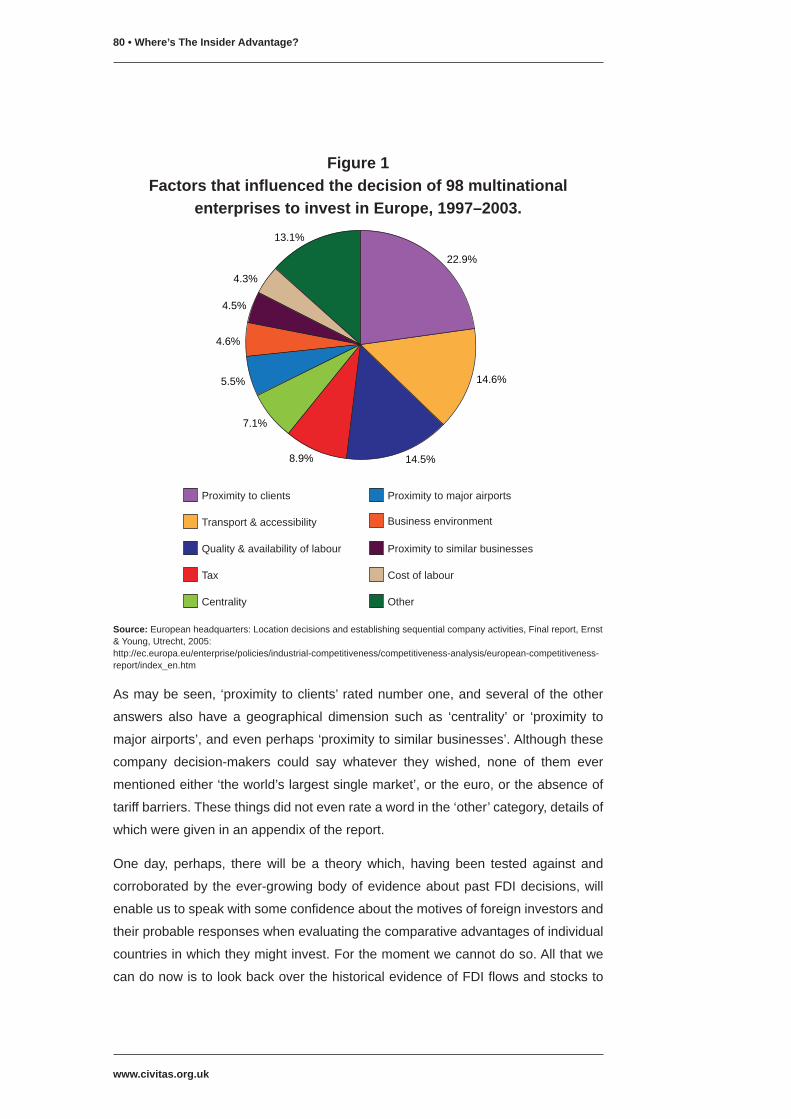
www.civitas.org.uk
80 • Where’s The Insider Advantage?
Figure 1Factors that influenced the decision of 98 multinational
enterprises to invest in Europe, 1997–2003.
Source:Europeanheadquarters:Locationdecisionsandestablishingsequentialcompanyactivities,Finalreport,Ernst&Young,Utrecht,2005:http://ec.europa.eu/enterprise/policies/industrial-competitiveness/competitiveness-analysis/european-competitiveness-report/index_en.htm
Asmaybeseen, ‘proximitytoclients’ratednumberone,andseveralof theother
answers also have a geographical dimension such as ‘centrality’ or ‘proximity to
majorairports’,andevenperhaps‘proximitytosimilarbusinesses’.Althoughthese
company decision-makers could say whatever they wished, none of them ever
mentionedeither‘theworld’slargestsinglemarket’,ortheeuro,ortheabsenceof
tariffbarriers.Thesethingsdidnotevenrateawordinthe‘other’category,detailsof
whichweregiveninanappendixofthereport.
One day, perhaps, therewill be a theorywhich, having been tested against and
corroboratedbytheever-growingbodyofevidenceaboutpastFDIdecisions,will
enableustospeakwithsomeconfidenceaboutthemotivesofforeigninvestorsand
theirprobableresponseswhenevaluatingthecomparativeadvantagesofindividual
countriesinwhichtheymightinvest.Forthemomentwecannotdoso.Allthatwe
candonowistolookbackoverthehistoricalevidenceofFDIflowsandstocksto
Other
Cost of labour
Proximity to similar businesses
Business environment
Proximity to major airports
Centrality
Tax
Quality & availability of labour
Transport & accessibility
Proximity to clients
22.9%
14.6%
14.5%8.9%
7.1%
5.5%
4.6%
4.5%
4.3%
13.1%

The impact of the EU on foreign direct investment in the UK from 1970 to 2011 • 81
www.civitas.org.uk
seejusthowwelltheinferences,intuitionsandprivateconversationsofpoliticians
andjournalistshelpustounderstandthedecisionsofforeigninvestorswithregard
toinvestmentintheUK.
Thisiswhatwewilldointhispaper,focusingonthreeeventswhichwehaveoften
beentoldhaveapositiveornegativeimpactonFDIintheUK.However,wemust
firstsaysomethingaboutthelimitationsofthebestavailableevidence.
UNCTADvsOECD:discrepanciesanddisagreementsofthetwoauthoritativesourcesTheFDIdatabasesofUNCTADandOECDhavedifferentstrengthsandlimitations.
UNCTADprovidesthemorecompleteandcomprehensivehistoricalsequencefrom
1970inthecaseofFDIflows,andfrom1980forFDIstocks,formost,thoughnot
all,developedcountries.Themissingcountrieshavebeenbroughtintothedataset
atlaterdates,asandwhendatabecameavailable.Becauseofitslongercoverage
overtime,theUNCTADdatabaseistheprimarysourceinthissearch.Ifonehopes
toidentifytheimpactofUKentrytotheEEC,onemusthavedatabefore1973,and
likewise,ifonehopestoidentifytheimpactoftheeuro,oroftheSingleMarket,we
needevidencefromtheyearsbeforetheeurobecameatradedcurrencyin1999,
andbeforetheSingleMarketwaslaunchedin1993.
TheOECD’sbasic,aggregateFDIdataforthemajorityofmembercountriesstarts
from1990. Itsdata,withbreakdownsof theoriginanddestinationof inwardand
outwardFDIflowsandstocks,bypartnercountriesandtypeofindustryinwhichthe
investmentwasmade,startsonly from2001.Thepresent investigation,however,
makesonly passinguseof industry breakdownsandnoneof ‘partner’ countries.
Beinganexploratoryinvestigation,itsticksforthemostparttoaggregatenational
flowsandstocks.TheOECDdatabaseisthereforeusedmainlyasacomplementary
sourcetocross-checkUNCTADentrieswheneveritseemedhelpfultodosobecause
thereturnforonecountrywasparticularlyimportantorunusual.
Attimes,theinwardFDIflowsfor individualcountriesfromthetwosourcesdiffer.
Allthefiguresfrombothofthemfortheyears1990–2011areshowninAppendixA,
Table11(andforFDIstockinTable12)withtheyearswherethedifferenceexceed
$US100m highlighted. There are 99 such cells out of the 384 cells which have
matchingfiguresfor18countriesfrombothagenciesinthetableasawhole.Asfaras
Iamaware,thetwoagencieshaveneverpubliclyexplainedtheirdiscrepancies,and
myattemptstodiscoverwhethertherewasaconsistent,systematicdisagreement,
andtotracethereasonforit,failed.Onesourceisnotconsistentlyhigherthanthe
other.Inflowsreportedbyonewerehigherthantheotherinroughlyhalfoftheyears,

www.civitas.org.uk
82 • Where’s The Insider Advantage?
thoughwhenthemeanannualdifferencesoverthe22yearswerecalculated,asin
theright-handcolumnofTable11ofAppendixA,theOECDrecordsahigherfigure
for6countries,andalowerfigurefortheother11(withoneequal).
Thedifferencesappear tobehaphazard,asdistinct fromrandom,so if there isa
consistentbiasinoneortheother,itssourceisunknown.However,itisimmediately
apparentthattherearemoredifferencesinthemorerecentyears.Approachinghalf
(40)ofthe99cells,wherethetwoagencieshavediffered,extractedinApril2012,
arefortheyears2008–2011,andtheremainderarespreadovertheearlier18years.
Thisisnotbecausetheyincreasinglydisagree,butbecausebothagenciesregularly
updateandamendtheirfiguresforrecentpastyears(withoutadvisingresearchers
theyhavedoneso).ThefiguresforUNCTADfor,say,2010,availableon-linein2011,
arenotthesameasthosefor2010availableon-linein2012or2013,andthe2010
discrepanciesbetween the twoagenciesdecline in theversionavailable in2012,
andagainin2013.
The other immediately noticeable difference is that a few countries consistently
provokemoredisagreementsthanothers.ThestrikingcaseistheUK,wherethetwo
agencieshavediffered,bymorethan$100m,in20ofthe22yearsofFDIflows,and
there isno indicationthereforeofdiscrepanciesdeclining in theupdatingprocess
inthiscase.TheOECDhasreportedFDIannual inflowstotheUKwhichare,on
average,nearly$2bn,oreightpercent,higherthanthosereportedbyUNCTAD.No
othercountryhassuchlargediscrepanciesoversolongaperiod.Norway’sFDIinflow,
asrecordedbyOECD,issubstantiallyhigherthanthatgivenbyUNCTAD,though
onlyoverfouryears,thelastofwhich,2011,largelyaccountsforthemeanannual
differenceover theentireperiod. In Ireland’scase, themeanannualdifference is
largelyduetothediscrepancyinjustoneyear,2010.Thediscrepancyinthecaseof
Italyislarge,butintheotherdirection.OECDthinksthatFDIwassubstantiallyless
thanthatreportedbyUNCTAD,thoughthedisagreementisfairlyevenlydistributed
overthesixyears2002–2007.
ThereareanalogousdifferencesinthefiguresofFDIstocksovertheyears1990–
2011,giveninTable12ofAppendixA.Itshowsstillmoredisagreementsbetweenthe
twodatabases.Onceagain,OECDprettyconsistentlygivesahigherfigureforthe
UKthanUNCTAD,onaverage$18bnperannumsince1990.TheUKis,however,
in this respect,surpassedbyGermanywhoseFDIstockrecordedbyOECDhas,
onaverageforeveryyearsince1997,exceededthefiguregivenbyUNCTADby
$116bn,whilethatofFrancehasbeenlowerbyanalmostsimilaramount,$114bn.10

The impact of the EU on foreign direct investment in the UK from 1970 to 2011 • 83
www.civitas.org.uk
Foranyoutsideobserver,itwillbesurprisingthattheagenciesthemselveshavenot
sought to reconcile theirdifferences,and thatgovernmentswithapro-activeFDI
policyhavenotdecidedtofindoutwhichisthemorereliable.11Forresearchers,itis
morethansurprisingtofindthattheworld’stwomostauthoritativesourcesonFDI
differbysuchmargins.Itisdisconcertingandtroublesome.
Whatistobedone?Notmuch.Giventheirdifferenttimespans,itisnotpossibleto
doubleupeveryanalysisandpresentalternativeversions.Samplegraphsdoingjust
that,andcomparinggroupsofcountrieswithpost-1990datadrawnfromonesource
againsttheother,showedthattheywouldnotleadtoradicallydifferentconclusions,
since theywereoften indistinguishable fromoneanother,or thedifferenceswere
toosmall tobeofmajorconcern.Ontwooccasions,Figure8/8aandTable10, it
waspossibletopreparereasonablycompleterivalversions,andtheyarepresented
inAppendix B.Although there are a few striking differences between individual
countriesinboth,theydidnotleadtoanysignificantlydifferentconclusions,since
theargumentinbothhingedonthecontrastbetweengroupsofcountries,andthe
majorityofthecomparisonsinthispaperareofthiskind.
Themajorproblem,therefore,isforcomparisonsofindividualcountriesofwhichwe
alsohaveafairnumber.SinceUNCTADistheprimarysource,aboutallwecando,
forthemoment,istorememberthat,ifOECDturnsouttobenearerthetruth,then
somecountriesmayhavereceivedmoreFDIthanreportedbelow,andsomemay
havereceivedless.12Thismeans,inthecaseoftheUK,thatitsFDIflowsmayhave
beenuptoeightpercenthigherthanisreportedbelow,anditsFDIstockuptosixper
centhigher.Thesameistrue,thoughonlyovertheyears2008–2011,ofFDIflows
toSwitzerland,Norway,GermanyandIreland,andperhapsalsotoLuxembourgand
Belgium, thoughotherdoubtsabout these twocountries,whichwillbeaired ina
moment,meanthatitislessimportantintheircase.Andcorrespondingly,ifOECDis
nearerthetruth,ItalywouldhavereceivedsignificantlylowerFDIinflows,alongwith
AustriaandFinland.AnalogousadjustmentswouldhavetobemadeforFDIstocks,
withGermany’sbeingmuchhigherandFrance’smuchlower.
ThemoralforresearchersisthatFDIresearchshouldberegularlyupdatedtokeep
pacewiththeupdatesofthesetwobasicsources.Hopefully,thereliabilityofthedata
willthenincreaseastheirdisagreementsdecline.Thechancesare,however,that
researchwillbeoutofdatebeforeitiscompleted.
TheproblemofSpecialPurposeEntitiesMoreimportantthanthesedisagreements,however,isoneseriousflawfromwhich
bothUNCTADandOECDsuffer.Putsimply,itisthatneitherofthemcurrentlystate

www.civitas.org.uk
84 • Where’s The Insider Advantage?
withcertaintyhowtheFDIisusedbytherecipientcountries,orevenwhetherthe
countrynamedastherecipientwastheultimatedestinationoftheinvestment.
Mostpolicy-orienteddiscussionsofFDIassumethatitreferstoinvestorswhohave
along-terminterestinthecountryinwhichtheinvestmentismadeand,whetheror
not it involvesagreenfielddevelopment,willcreatenewmanufacturingorservice
employmentinthehostcountry.Some,andnodoubtthegreaterpartoftheinward
FDIrecordedbybothUNCTADandOECD,isexactlyofthiskind,butsomeunknown
proportionofitisnot.Itisnomorethanafinancialoraccountingtransaction,often
madethroughaspecialpurposeentity(SPE)whichisusedtoparkcapital inone
country, actually intended for later onward investment in some third unnamed
country.Itthereforehaslittleornoimpactonemploymentintherecipientcountry
identifiedasthedestinationinFDIstatistics.ItistheFDIequivalentof‘theRotterdam
effect’thatlongconfusedthestudyoftradewiththeEU,becausetranshipmentsin
Rotterdam to or fromother destinationswere identified as exports to, or imports
from, theNetherlands.As it happens, theNetherlands isalso thehomeofmany
SPEs,andthestatisticaldistortiontheycauseisthereforesometimesreferredtoas
‘theNetherlandseffect’.
Over themany years that theOECDhas been concerned about this problem, it
hasorganisedmeetingsamongstcentralbanksandotherresponsibleagenciesto
agreecommonglobal standards forFDI reporting.Thedefinitive resultsof these
deliberations appeared in the fourth edition of theOECD’sBenchmark Definition
of Foreign Direct Investment of 2008which recommendedprocedures to ensure
analysts consistently identify the twoendsof the investment chain, the investing
country and ultimate investment country (UIC), omitting any SPEs in between.13
Currently,most countries still donotdo this, thoughAustriaand theNetherlands
havebegunreportingtheirFDIfreeofSPEs,apparentlysince2007,andothersare
expectedtodosoby2014.14
Inrecentyears,nationalbankshavebeguntodistinguishbetweenFDIintheauthentic
senseandthesefinancialtransactionswhichmayberecordedassuch.In2008,De
NederlandscheBankdisclosedthatonly27percentof foreigninwardinvestment
remained invested in theNetherlands,andextrapolating fromtheiroutwarddirect
investmentdata,WilliamsestimatedthattheproportionofSPEsintheNetherlands’
inwardFDIvariedbetween68percentand73percentovertheyears2004–2010.
Drawing on information published by the LuxembourgCentral Bank, hewent on
toestimate thatSPEsconstitutedbetween92percentand93percentofFDI in
Luxembourgoverthesameyears.15

The impact of the EU on foreign direct investment in the UK from 1970 to 2011 • 85
www.civitas.org.uk
Thereissimilarevidencefromothercountries.In2011,forinstance,theCentralBank
ofIrelandbegantoreporttheassetsof‘FinancialVehicleCorporations’(orSPEs)
residentinIreland.Attheendofthatyeartheyhadassetsof€491.9bn,whichisjust
overafifthofthetotalFVCassetsintheentireeurozone.16Itisalsomorethantwo-
and-a-halftimesthe€189.5bnofinwardFDIstockheldbyIrelanditselfasreported
byUNCTADfor2011.Evidently,therefore,manySPEsinIrelandarenot reported in
theUNCTADfigures,thoughexactlyhowmanyareincludedisnotknown.
Switzerland is commonly seenas thehavenof secret bankaccounts, andmight
bethoughttobesimilarlyhospitabletoSPEs.ItsNationalBanknowidentifiesthe
destinationofFDIbyindustryandthisshowsthat,overtheyears2005–2010,47per
centwenttomanufacturingandserviceenterpriseandtheremaindertobanksand
‘financialintermediaries’,whichisasteptowardsidentifyingSPEsperhaps,though
itisstillnotclearwhatproportionoftheremaining53percentmayhavebeenlong-
termjob-producing,service-industry investments in itssubstantialfinancialsector,
andwhatproportionmayhavebeentoSPEs.17Inoneofitsspecial,moredetailed
reports,supplementedwithdatafromtheSwissNationalBank,UNCTADsuggested
thatthesignificanceofpurelyfinancial transactionshadbeenvastlyexaggerated.
‘Switzerland’,itdeclared,‘isamajorhostcountryforFDIonaglobalscale…[the]
banking industry, includingprivatebanking, represents7.8percentof the inward
flowofFDI.’18Hmm.NowordofSPEs.
TheUKOfficeofNationalStatisticsstarteddistinguishingfinancialderivativesfrom
variousotherkindsof international investment in2004,sincewhentheproportion
offinancialderivativesinitsreported‘InternationalInvestmentPosition’hasvaried
between15percentand32percent(in2011)ofthetotal.19Itisthereforepossible
to do a check by comparing the FDI stock reported byUNCTADwith the direct
investment minus the financial derivatives reported by ONS. There was little
difference,apartfrom2008,whentheUNCTADfigurewas24.6percentbelow that
ofONS,whichsuggeststhattheUKFDIstockfiguresofUNCTADincludefewSPEs.
AfurthercheckofthesameONSdirectinvestmententriesbackto1991foundthe
discrepancyraninthesamedirection,i.e.theUNCTADFDIstockwasconsistently
lowerthanONS,themeandifferencebeingsixpercentoverthe21years.20
OnecanperformexactlythesameexercisecomparingUNCTADFDIflowstothe
UKwiththe‘InvestmentintheUK,FinancialAccountTransactions’recordedbythe
ONSoverthe21years.TheresultismuchthesameasforFDIstocks.UNCTAD
consistentlyreportsalowerFDIinflowthantheONSPinkBooks,onaverage,over
the21years,fourpercentlower,thoughthisaveragehidesratherlargediscrepancies

www.civitas.org.uk
86 • Where’s The Insider Advantage?
from1991 to 1997, hitting 17per cent in 1994.After 1997, they remainwithin a
percentagepointofoneanotherformostyearsuntil2011whentheONSwasfive
percenthigher.TheconclusionIdrawfromthesechecksisthattheUNCTADdata
ofUKFDIflowsandstockisnotinflatedbylargeflowstoorfromSPEs.
There is, I might add, nothing distinctive about the UK data recording. On the
contrary,theONSproudlyannouncesthatitisfollowingEuropeanandinternational
standards.21Ifthereisanythingdistinctive,itistheaccessibilityofthedetailsofUK
publicfinances. If thesameexercisewereconductedwith theother22countries
discussed,wemightofcoursebeabletoeliminateallSPEs,andthereforehavethat
muchmoreconfidenceinourfinalresults.
Pendingsuchanexercise,wewillhavetowaitforcentralbanksandotherreporting
agencies to respond to the long campaign of the OECD, joined by the IMF, to
persuadethemtodistinguishclearlybetweenFDIindicatingapermanentorlong-
terminterestintherecipientcountryandpurelyfinancialtransactions.Since2009
the IMFhasconductedaCoordinatedDirect InvestmentSurvey (CDIS) inwhich
thisdistinctionisembedded.However,thisisstillapilotsurvey,inwhichcountries
voluntarilyparticipate,andfewofthosecountriesthoughttohaveahighproportion
ofSPEshavebeenreadytosupplythedata.22TheNetherlands,forinstance,hasno
entriesatallundertheCDISheading‘ResidentFinancialIntermediaries’.
Forthemoment,wemayfairlysaythatFDIreportingisinastateoftransition,but
even if, as hoped, all countries follow theOECDBenchmark fourth edition rules
after2014, thekindof retrospective,cross-nationalanalysesof thekindwewish
toconductwillstillnotbe freeofSPEs,unlessoneorotheragencyattempts the
dauntingtaskofreconstructingpastreturns.23
Since that isunlikely,wehave littlechoicebut tocontinuewith theUNCTADand
OECDdatabasesandannualreportsastheystand,whilerecognisingthatthough
theycurrentlyprovidethebestevidenceforcross-national,retrospectiveanalyses,
theyarebothflawed.However,asanyonewhohasworkedwiththemwillknow,the
entriesforsomecountriesappeartoberathermoreflawedthanothers.Butwhich
ones?
AsearchforhiddenSPEsOneclueto thepresenceofSPEs isabnormallyhigh,orabnormallyvolatile,FDI
inflows,withprecipitous falls leading tonetdisinvestmentoveroneor twoyears,
whichismoreconsistentwithasuddenwithdrawaloffundsfromSPEsthanwitha
long-terminvestment.FurthercluesareprovidedbythetotalannualFDIinflowasa

The impact of the EU on foreign direct investment in the UK from 1970 to 2011 • 87
www.civitas.org.uk
proportionbothofthegrossfixedcapitalformation(GFCF)intherecipientcountry
andofitsGDP.IftheannualFDIinflowsexceedoneorother,astheyinvariablydoin
offshorefinancialcentres(OFCs),wemayinferthattheydonotreflectalong-term
interestbyinvestorsintherecipientcountryandincludeinflowsotherthanauthentic
FDI.
Table1(overleaf)presentsthisdataforall23countriesthatappearatsomepoint
inthefollowingsearch.Columns3and4givethenumberofyearsincludedinthe
means in columns1and2.Somecountries couldnot bemeasuredover the19
years1993–2011,havingrecordednetFDIdisinvestmentinoneormoreofthem,
whileLuxembourg’sdatawasavailableonlyfortenyears,withasingleyearofnet
disinvestment.
IfweconsiderLuxembourgfirst,itwillbeseenthatoverthenineyearsithasroutinely
receivedan inwardflowofFDIgettingon towardsdouble itsGFCF,andwemay
reasonablyinferthatmuchthegreaterpartofitsrecordedFDIisnotauthenticFDIat
all.LuxembourgmaybetheseatofagreatmanyEUinstitutions,includingtheCourt
ofAuditors,butitduplicatesthepatternfoundinOFCs,withFDIinflowsfargreater
thanGFCF.Asithappens,mostOFCshaveinfactprovidedrathermoredetailsof
theirnominalFDI,whereasLuxembourgwasunableorunwillingtodosountil2002.
Onbothcounts−theimplausibilityandtheincompletenessofitsdata−Luxembourg
isthereforeexcludedfromalltheanalysesthatfollow.
ButwhatofBelgium?Oneisnaturallyreluctanttoexcludethehomecountryofthe
EuropeanCommissionand,forpartoftheyearatleast,alsoofitsParliament.Butis
itplausibletosupposethatforeigninvestorshavebeenproviding,onaverageover
the18years,morethan80percentofBelgium’sGFCF,and,forseveralofthese
years,verymuchmore?In1999,itsFDIinflowwasmorethandoubleitsGFCF,so
itwaswell intoOFCterritory,asithasbeenin2000,2001and2008.Theinward
FDIflowtoBelgiumin2008recordedbyUNCTADwas$193.95bn(andbyOECD
as$193.57bn),a totalwhichmakes itsFDIover$50bngreater for thatyear than
thetotalinwardflowofFDItoalltheotherteneurozonecountriescombined,which
was$141.46bn.Moreover,thisFDIinwardflowwasjustoverhalfofBelgium’sentire
GDPinthesameyear.Itthereforeseemshighlyunlikelythatmuchofthiswaslong-
term,employment-creatingFDI,and therefore it toohasbeenomitted frommany
calculationsthatfollow.24
Butnotfromall.Itgoesagainstthegraintoeliminatecountriesfromsmallsamples
withoutaclear,defensibleruleappliedconsistentlyineverycase,andthisevidence
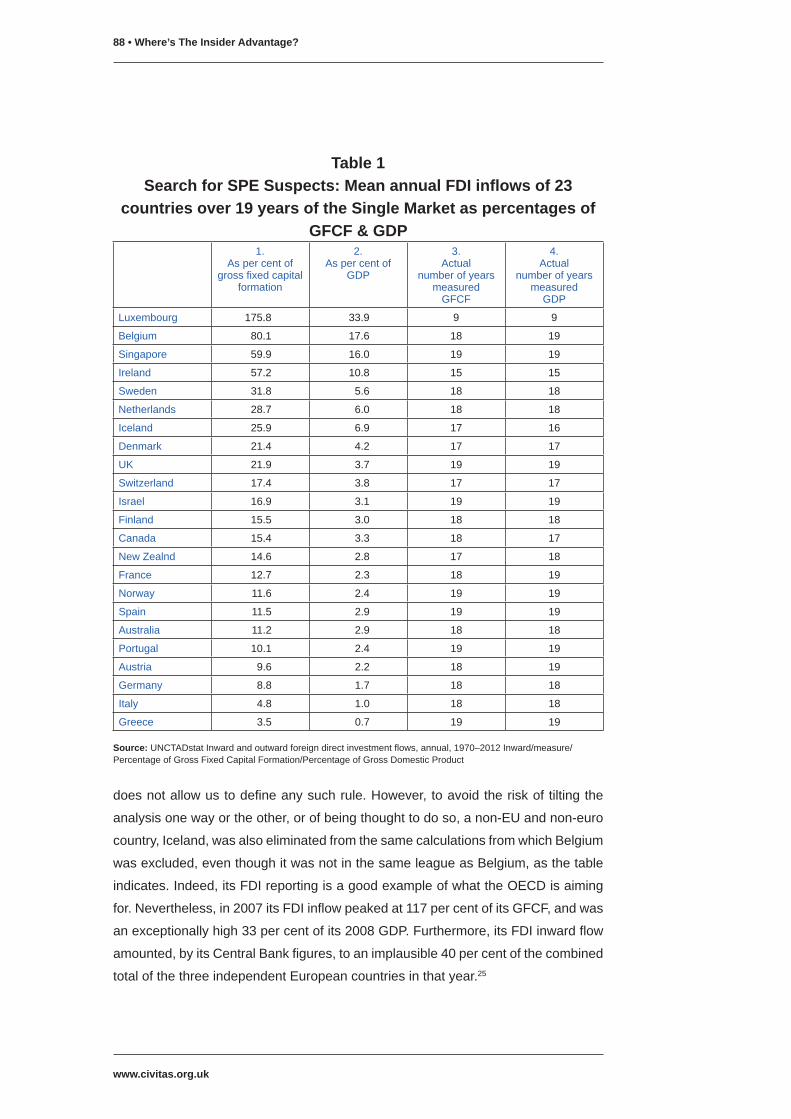
www.civitas.org.uk
88 • Where’s The Insider Advantage?
doesnotallowustodefineanysuchrule.However,toavoidtheriskoftiltingthe
analysisonewayortheother,orofbeingthoughttodoso,anon-EUandnon-euro
country,Iceland,wasalsoeliminatedfromthesamecalculationsfromwhichBelgium
wasexcluded,eventhoughitwasnotinthesameleagueasBelgium,asthetable
indicates.Indeed,itsFDIreportingisagoodexampleofwhattheOECDisaiming
for.Nevertheless,in2007itsFDIinflowpeakedat117percentofitsGFCF,andwas
anexceptionallyhigh33percentofits2008GDP.Furthermore,itsFDIinwardflow
amounted,byitsCentralBankfigures,toanimplausible40percentofthecombined
totalofthethreeindependentEuropeancountriesinthatyear.25
Table 1Search for SPE Suspects: Mean annual FDI inflows of 23
countries over 19 years of the Single Market as percentages of GFCF & GDP
1.Aspercentof
grossfixedcapitalformation
2.Aspercentof
GDP
3.Actual
numberofyearsmeasuredGFCF
4.Actual
numberofyearsmeasuredGDP
Luxembourg 175.8 33.9 9 9
Belgium 80.1 17.6 18 19
Singapore 59.9 16.0 19 19
Ireland 57.2 10.8 15 15
Sweden 31.8 5.6 18 18
Netherlands 28.7 6.0 18 18
Iceland 25.9 6.9 17 16
Denmark 21.4 4.2 17 17
UK 21.9 3.7 19 19
Switzerland 17.4 3.8 17 17
Israel 16.9 3.1 19 19
Finland 15.5 3.0 18 18
Canada 15.4 3.3 18 17
NewZealnd 14.6 2.8 17 18
France 12.7 2.3 18 19
Norway 11.6 2.4 19 19
Spain 11.5 2.9 19 19
Australia 11.2 2.9 18 18
Portugal 10.1 2.4 19 19
Austria 9.6 2.2 18 19
Germany 8.8 1.7 18 18
Italy 4.8 1.0 18 18
Greece 3.5 0.7 19 19
Source:UNCTADstatInwardandoutwardforeigndirectinvestmentflows,annual,1970–2012Inward/measure/PercentageofGrossFixedCapitalFormation/PercentageofGrossDomesticProduct

The impact of the EU on foreign direct investment in the UK from 1970 to 2011 • 89
www.civitas.org.uk
Singapore, the third country on the list, shows how difficult it is to determine
the proportion of GFCF that FDI should constitute to be considered plausible.
Singapore’sFDI inflowshavebeenonaveragenearly60percentof itsGFCF,a
veryhighproportion,butgiventhatitsdeclaredstrategy,overthehalf-centurysince
independence, has been to create amodern economy on the basis of FDI from
diverse sources, it seems entirely plausible that its FDI includes noSPEs at all,
especiallyasFDIasaproportionofitsGDPhasgrownbysteadyincrementssince
1970andhasonlyexceeded100percenttwice,andthenbysmallmargins.Over
the19yearsithasneveroncerecordedanetdisinvestment.
Singaporehasnot thereforebeeneliminatedfromanycalculations,norhaveany
othercountries,eventhoughsomemaybesuspectedofcamouflagingpaymentsto
SPEsasFDI.Irelandissuchacase,sinceithasplummetedtonetdisinvestmentin
fourofthenineteenyears,whichismorethananyothercountry.However,sinceit
hasalsoadoptedaSingaporeanstrategyofeconomicdevelopment,thismaysimply
reflectthesuddenrepatriationofprofitstoAmerican-ownedmultinationalsorhave
someotherentirelylegitimateexplanation.
Theremainingcountriesonthelistsimplyallowustoassess,orguess,thelikelihood
that therecordedFDIcontainssubstantialpaymentstoSPEs.Onemaysay,with
someconfidenceIsuppose,thatforeigninvestorshavenotsetupSPEsinthetwo
countriesatthebottomofit,ItalyorGreece,orforthatmatterinthehalf-dozenor
soabovethem.
PerhapsthebiggestsurpriseonthelististherelativelylowrankingofSwitzerland.
Despiteitsreputationforsecretbankaccounts,itemergesfromthislistasaboutas
likelytohaveSPEsinitsFDIastheUK,though,unliketheUK,ithashadtwoyears
ofsudden,precipitousnetdisinvestment.
TheunpalatableconclusionofthislittleDIYforayonSPEsisthatthebestFDIdata
intheworldisflawed,andwe,likeeveryoneelse,willhavetoworkwithit.Thereare,
however,afewgroundsforconsolingorreassuringourselves.Tobeginwith,mostof
thecalculationsinthissearch,orthemoreimportantonesatleast,arecomparisons
of theweightedmeansofgroups,non-EUvsEU,non-eurovseurozoneetc,and
since,asithappens,mostofthecountriessuspectedofhavinghighSPEtransfers
aresmall,theirdistorteddatacanhaveonlyaminorimpactonaweightedmean.
Evenif,forinstance,Luxembourghadbeenincludedinthesecomparisons,along
with its largeFDI inflows, itcould,given its tinypopulation,haveonlyamarginal
effectonaweightedmeanoftheEUoreurozonecollectively.Andevenifwewere
www.civitas.org.uk
90 • Where’s The Insider Advantage?
wrongaboutSingapore, and it should havebeenexcluded, it cannot haveabig
impactaspartofagroupofindependentcountries.
Thereisalsoacertainsafeguardinbeingabletouse,formostofthecomparisons
inmorerecentyears, twokindsofFDIdata, thatof inflowsandofstocks.Aswill
beclear,whenevergraphsofthetwokindsofdataarejuxtaposed,inflowsarefar
morevolatilethanstocks.FDIinflowsrecordtransientannualmovementsofcapital,
whereasFDI stock records the accumulation of investments, and re-investments
stretching back to unknown dates in a country’s past, and therefore seemmore
likely to be recording authentic FDI investments with a long-term interest in the
country, rather thanSPEs.There is, however, no hard evidence, as far as I am
aware,toshowwhetherthisisthecase,thoughtherecansurelybelittledoubtthat
annualreturnsofthegrowthofFDIinwardstockareamoresecurebasisfordrawing
conclusionsabouttheattractivenessofparticularcountriestoforeigninvestorsthan
volatileannualreturnsofFDIinflows.
Attheendoftheday,however,onemustkeepone’sfingerscrossedandhopethat
thehiddendistortionsoneithersideofthecomparisonsofgroupsmoreorlesseven
themselvesout.Butthatisnomorethanahope.IfweacceptTable1asarough
guidetothepresenceofSPEs,thenitseemsthatFDIinflowstoEUcountriesare
somewhatmorelikelytobeexaggerated,simplybecausetherearerathermoreof
thematthetopofthelist.
Theever-shrinkingcontrolgroupThesecondmethodologicalproblemintheanalysesthatfollowisthatwhichfaces
anyattempttoanalyseanypartoftheEUproject:findingcountrieswithwhichits
membersmaybeappropriatelycompared.
Anyinquiry,whetherinnaturalorsocialscience,thathopestodemonstrateacausal
link between two phenomena, cannot advance far without making comparisons
of some kind. Laboratory sciences surmount this problem relatively easily by
reproducingmultipleexperimentalgroupsthataresubjectedtothesameexternal
agent, experienceor stimulus,whoseeffect it is hoped to understand, alongside
multiple, otherwise identical, control groups that are not subjected to the same
agent,experienceorstimulus.Othersciences,includingthesocialsciences,have
tofindequivalentsasbesttheycan.Socialsciencesusuallydosobylargerandom
samplesof individualsorcases inwhichcertain factorsmaybeheldconstant. In
this investigation,however,since thenumberofFDI recipientcountries forwhich
wehaveevidenceovertheperiodduringwhichtheEUprojecthasbeenunderway
The impact of the EU on foreign direct investment in the UK from 1970 to 2011 • 91
www.civitas.org.uk
issmall, randomsamplesarenotpossible.Thesocialscientist’sequivalentofan
experiment is not available, and finding satisfactory control groups is thereforea
difficultproblem.
Themainexperimentalgroupsinthisinvestigationareclearenough:thosecountries
thatbecamemembersoftheEU,ormembersoftheeuro,ormembersoftheSingle
Market.Ideally,wewouldlikeacontrolgroupofEuropeancountries,similarinsize,
number,GDPandgeographical location toEUmembers, indeedsimilar inevery
respect,exceptthattheyhavenotbeensubjecttothesethreeexperienceswhose
impactwewishtoidentifyanddemonstrate,i.e.theydidnotjointheEU,ortheeuro,
ortheSingleMarket.
In pre-1980 analyses,we canmake use ofEuropean countries that had not yet
enteredtheEU,butastheanalysescontinuethroughtheʼ80sandʼ90s,thenumber
ofcomparativecasescontinuouslyfalls,asmembersofthecontrolgroupjointhe
experimentalgroup.By1995weareleftwithacontrolgroupofjustthree:Iceland,
NorwayandSwitzerland.
Thesethreesocietiesare,however,usuallydismissedbyEUenthusiastsasbeing
individually and collectively too small (in 2010 their populations totalled just 13
million), or for one reason or another are deemed ‘special cases’ which cannot
provideafaircomparisonorformasuitablecontrol.TheEuropeanCommission,for
instance,never,evermentionsthemtosupportitsclaimsaboutthebenefitsofEU
membership,eventhoughacomparisonwiththethreeEuropeansocietiesthatare
notmembersoftheEUwouldappeartobetheobvious,andeventheonlywayof
doingso.
Whether or not, and in what respects, these countries are ‘special cases’, and
incomparablewithanyothercountryisseldommadeclear,andneverdocumented.
ThePrimeMinister sometimes conveys the impression that theUK is distinctive
becauseitisatradingnation,ratherimplyingthatthesethreearenot–almostas
iftheywerenotfarremovedfromsubsistencefarming.Afairmeasureofhowfara
countrydependsoninternationaltradeisprovidedbyOECDdataoninternational
exportsingoodsandservicesasaproportionofGDP.In2010theproportionswere
54.2per centofSwitzerland’sGDP,56per centof Iceland’s,and42per centof
Norway’s,andamere29percentoftheUK’s.26Currently,therefore,theUKisrather
lessofatradingnationthananyofthem.
Theonlyoccasionwhenthereasonforthinkingthesecountriesarenotcomparable
with the UK has been made explicit is an internal report of HM Treasury, ‘EU

www.civitas.org.uk
92 • Where’s The Insider Advantage?
MembershipandFDI’,apparentlywrittenin2004,inwhichtheanonymousauthor
declaresthat‘whilstcomparisonwithNorwayandSwitzerlandasexamplesofEEA
and EFTA members are interesting and potentially useful, they have significant
limitations,giventhefundamentaleconomicdifferencesbetweentheUKandeach
ofthesecountries–e.g.Norway’seconomybenefitsheavilyfromoilandSwitzerland
frompharmaceuticalsandfinancialservices,distortinganycomparison’.27
Itisalazyandtendentiouscomment.Alltradingnationshavedistinctadvantages,
which iswhy they trade in the first place, and as they discover the comparative
advantagesthatenablethemtotradeprofitablywithothers,theyarelikelytobecome
more distinct. Do they therefore become progressively less comparable? What
countrieswouldremaintocomparewiththeUK?Inanyevent,oil,pharmaceuticals
andfinancialserviceswerethreeoftheUK’sleadingindustriesovertheperiodheor
shewasdiscussing,sotheauthorexpectsthereadertobelieve,withoutanywordof
explanation,thatNorway’soilorSwitzerland’spharmaceuticalsandfinancialservices
were‘fundamentallydifferent’fromthoseoftheUK.Itistendentiousbecauseitsoon
becomes clear that the author intends to snatch at every prediction, or scrap of
evidence,thatappearstomakeacaseforcontinuedmembershipoftheEU,andhas
nointentionofstoppingtomakeanycomparisonthatmightrequiresomethought
beforethepaperreachesitspreferredconclusion.
Are thesecountries,alongwith Iceland, theother remaining independentcountry
inEurope,toosmallindividuallyandcollectivelytoserveasacontrolgroupofnon-
members?Comparisons between theUSand theUKare routinelymadeby the
standardmethodofmakingfaircomparisonsbetweencountriesofdifferentsizes,
convertinggrosstopercapitadata,withoutanyonecomplainingthattheUKistoo
smalltomakemeaningfulcomparisons,orthatitisinappropriateorunacceptable.
WhythesamemethodshouldnotbeusedinEuropeisnotclear.
Intheend,however,whateverthecaseforexcludingthemmightbe,andhowever
wellitmightbeargued,itwillremainunpersuasive,sinceifweexcludethesethree
countriestherewouldbenocontrolgroupatall.Thisistantamounttosayingthat
theimpactofEUmembership,orofmembershipoftheeurozone,oroftheSingle
Market,andotheraspectsoftheEUproject,areforeverbeyondthenormalcanons
ofempirical inquiryandanalysis.Thiswouldbeanoddway tostartanempirical
investigation,andIhavenointention,andnoreason,tostartthisoneinthisbizarre
manner.These threecountrieswill thereforebeusedasonecomparativecontrol
group.
The impact of the EU on foreign direct investment in the UK from 1970 to 2011 • 93
www.civitas.org.uk
Inanattempt toconstructamoresatisfactorycontrolgroup,wewilladd to these
threeeconomiesall theothersremaining inUNCTAD’sdatabasethatareroughly
comparable insize tosomeEUcountries,areaseconomicallydevelopedas the
olderEUmembers,anddonothavelargeinternalmarketswhichmightmakethem
lessdependentbothon international tradeandonFDI.Onlyfiveseemtoqualify:
Australia,NewZealand,Canada, IsraelandSingapore.Whenaddedto the three
non-EUEuropeancountries,thesefivegiveusacontrolgroupofeightindependent
countries,witha totalpopulation in2011ofabout87million.For thosewhothink
overallsizeisimportant,thisgroupofindependentcountriesmightberathermore
acceptable.
They still fall, it need hardly be said, far short of an ideal control group. Indeed,
in one respect these five additional countries are entirely unsuited for this role.
The overwhelming importance of geographical proximity in determining trade
relationshipshasbeenestablishedbeyondanydoubt,butthesefivearescattered
aroundtheglobeand,apartfromCanada,ratherremovedfromanylargemarkets.28
InthecontextofFDIdecisions,whileitispossibletoimagineaninvestordeliberating
between Switzerland and surrounding EU countries, or between Norway and
Sweden,itishardlylikelythattheywouldbefindingitdifficulttochoosebetween,
say,FranceandIsrael,orNewZealandandItaly,aspossiblealternativedestinations
oftheirinvestment.However,unsuitableornot,wecanonlyworkwiththecountries
thatplanetEarth,andtheUNCTADdatabase,provide,sotheyareoccasionallyused
toaddwhatperspectivetheymayonFDIinEurope.
Whoknows?Attheendoftheday,itisjustpossiblethatEUenthusiastsmightcome
torecognizethatthesefive,plusthethreepermanentEuropeannon-members,have
someadvantagesasacontrolgroup.SincetheyoftenwarnthattheUKstanding
alone,withjust62millioninhabitants,istoosmalltosurviveandthriveinthemodern
worldwithoutthesupportandinsideradvantagesthatEUmembershipprovides,a
controlgroupofeightsmaller,generallymore isolatedand lonelysocieties,might
enable them toprove theircase,anddemonstrate thevulnerabilitiesand risks to
whichtheUKwouldbeexposedwereittoleavetheEU.

www.civitas.org.uk
94 • Where’s The Insider Advantage?
1.DidentrytotheCommonMarketin1973boostFDIintheUK?Thefirststep in this investigation is toseewhether there isany indication in the
UNCTADdatabasesthatjoiningtheEUin1973hadabeneficialimpactonFDIflows
totheUK,thoughindoingsoonehastorecognizethatweareattheedgeofthe
availabledata.UNCTADdataoninwardFDIflowsonlybeginsin1970.Ittherefore
only permits a limited three-year ‘before’ period in before/after comparisons, and
sinceFDI flows are highly volatile, this is scarcely adequate. Furthermore, since
UNCTAD only started to publish those figures on FDI stocks in 1980, it is not
possibletocorroborateevidenceaboutFDIflowswithevidenceaboutthegrowthof
FDIstockstillafterthatdate.1Forthesereasons,theevidencethisfirststageofthe
investigationshouldbeconsideredindicativeratherthanconclusive.
Although the data over these years is limited, we happen to have a reasonably
satisfactorycontrolgroupoffiveEuropeancountries,sincealongwiththetwoofthe
permanentnon-members,IcelandandNorway,wecanalsoincludeAustria,Finland
andSwedenwhoseEUmembershipwasstillinthedistantfuture.Switzerlandmust
beomittedforlackofdataovertheseyears.
InFigure2theweightedmeanoftheinwardflowofFDItothesefivenon-members
overtheyearsbeforeandaftertheUKenteredtheEECisshownwiththatofthe
UKandthetwocountrieswhichjoinedatthesametimeastheUK,Denmarkand
Ireland.
Thefirstthingitdemonstrates,Isuppose,isthatFDIflowsarevolatile,andthatthe
numberofentriesonagraphshouldbestrictlylimited.However,themainfactsin
thisonearereasonablyclear.First,thatUKperformancewasconsistentlybetter,in
mostpost-entryyearsmuchbetter,thanthatofthefivecountriesthatdidnotjoin.
Second,thatIreland,havinghadlowerflowsthanthefivenon-entrantsuntil1974,
had higher flows over seven of the subsequent eight post-entry years. Together
therefore,theUKandIrelandlendsupporttotheargumentthatentrytotheCommon
MarketboostedFDIinflows.
Denmark does not. It had higher inflows until 1975, dropped into net foreign
disinvestment in1976and,apart from1979,had lower inflows thannon-entrants
forthenextthreeyearsthanithadhadduringthethreepre-entryyears.Thefirst
questionarising fromthis initialglanceat theevidence, therefore, is todetermine
whichwasthemorenormalandrepresentativepost-entryexperienceofentrantsto
theEU:thatoftheUKandIrelandorthatofDenmark?

The impact of the EU on foreign direct investment in the UK from 1970 to 2011 • 95
www.civitas.org.uk
Figure 2FDI flows per capita pre- and post-entry to the ECM 1970–1982
of three 1973 entrants in US$(1970) compared with five European non-entrants per capita
ThefiveEuropeannon-entrantsareAustria,Finland,Iceland,NorwayandSweden. Source:UNCTADstatForeigndirectinvestmentstocksandflows,annual,1970–2012:http://unctadstat.unctad.org/UnctadStatMetadata/Classifications/Tables&Indicators.html
Oneway of deciding is to compare these three new entrants with six later new
entrants:withGreecewhich joinedin1981,withPortugalandSpainwhich joined
in1986,andwithAustria,FinlandandSwedenwhichjoinedin1995.Inthecaseof
thesesixlaterentrants,wecancompareafullpre-entrydecadewiththepost-entry
one.
Table2belowpresentstheevidenceforallninecountries.Itshowsthemeanannual
percapitavalueofFDIinthe1973entrantsforthethreeyearsprecedingtheirentry,
and for the later six over their pre-entry decade, alongside themeanannual per
capitavalueofFDIinflowsoverthepost-entrydecadesofallnine.PostentryFDI
growthismeasuredbythedifferencebetweenthesetwomeans.
Beneaththepre-andpost-entryFDIinflowsoftheninecountries,theinflowstoother
setsof other countriesover the sameperiodaregiven, so thatwehaveseveral
basesbywhichwemaydecidewhetherthegrowthwasexceptionalornormal.The
firstsetconsistsofthesamefivenon-entrantEuropeancountriesalreadyusedasa
controlinthepresentationofthe1973resultsabove.However,theycanonlyserve
asacontroluntiltheendoftheseconddecade,sinceAustria,FinlandandSweden
UKIrelandDenmark5 European non-entrants
−40
−20
0
20
40
60
80
100
198019751970
FDI i
nflo
ws
per c
apita
, US
$(19
70)

www.civitas.org.uk
96 • Where’s The Insider Advantage?
Table 2Real growth of total inward FDI flows per capita to nine late EU
entrants: pre-entry vs post-entry yearsMeanannualFDI
percapitaover(3)10yearspre-ENTRYin
US$(1970)
MeanannualFDIpercapitaover10yearspost-ENTRY
inUS$(1970)Percentgrowthpost-ENTRY
1970–72 1973–1982
Denmark (25) 16 −37
Ireland (9) 34 *260UK (26) 50 *955Europeannon-members 14 18 28
5world-widenon-members 76 71 −8
5foundingEUmembers 16 18 7
1971–1980 1981–1990
Greece 17 21 28
5Europeannon-members 18 28 56
5world-widenon-members 79 72 −8
5foundingEUmembers 19 24 30
31973entrants 44 66 50
1976–1985 1986–1995
Portugal 6 43 *570Spain 17 67 *2995Europeannon-members 15 55 270
5world-widenon-members 59 99 68
5foundingEUmembers 14 42 217
31973entrants 39 90 130
1985–1994 1995–2004
Austria 28 114 *313Finland 30 209 *601Sweden 81 458 *4683Europeannon-members 75 230 208
5world-widenon-members 86 186 116
5foundingEUmembers 39 163 323
31973entrants 83 232 180
ThefiveEuropeannon-membersareAustria,Finland,Iceland,NorwayandSweden.ThethreeEuropeannon-membersareIceland,NorwayandSwitzerland.Thefiveworld-widenon-membersareAustralia,Canada,Israel,SingaporeandNewZealand.ThefivefoundingEUmembersareGermany,France,theNetherlands,BelgiumandItaly.Luxembourgisomittedduetolackofdata.Thethree1973entrantsareUK,IrelandandDenmark.Source:UNCTADstatForeigndirectinvestmentstocksandflows,annual,1970–2012 http://unctadstat.unctad.org/UnctadStatMetadata/Classifications/Tables&Indicators.html

The impact of the EU on foreign direct investment in the UK from 1970 to 2011 • 97
www.civitas.org.uk
themselves joined theEC in1995.Post-1995, therefore, IcelandandNorwayare
joinedbySwitzerland, forwhomdatabecameavailable from1983.Asdiscussed
earlier, the five-country control group therefore shrinks to three. The additional
controlgroupoffivecountriesscatteredaroundtheworld−Australia,Canada,Israel,
SingaporeandNewZealand−isalsogiven,primarilyinthehopethattheymight
indicatewhetheranypost-entryincreaseinFDIrecordedamongthenewentrants
isnomorethananormal,regionalmanifestationofworldwideFDIgrowth,orofa
kindthatmightreasonablybeattributedtoEUentry.Finally,theFDIinflowstofive
ofthefoundingEUmembersaregiven,fiveandnotsixbecauseLuxembourghas
tobeomittedforlackofdata,alongwiththegrowthofthethree1973entrantsover
thesameyears,sothattheselaternewentrantsmaybecomparedwiththethree
earliernewentrants.
Sevenoftheninenewentrantshavebeenstarredtoindicatethattheyexperienced
amarkedjumpinFDIinflowsoverthepost-entrydecade,whichcanreasonably,and
withsomeconfidence,beattributedtoentrytotheEC.Theconfidenceisbasedon
thefactthatpost-entrygrowthofallsevenexceeded,andusuallyfarexceeded,the
growthoftheEuropeancountriesthatremainedindependent.Infouroftheseven
−theUK,Portugal,FinlandandSweden−post-entrygrowthwasmorethantwice
asgreatasthatinthefiveindependentcountries.Theirgrowthalsoexceeded,by
evengreatermargins,thegrowthofthefiveworld-widenon-members,sothereis
noreason tosuppose that theirgrowthhasanything todo theperiodicswings in
worldFDItodevelopedcountries.Theyalsoexceededbyasubstantialmarginthe
growthoffiveof the foundingmembersof theEU,Austriabeing theexception in
thisrespect,withagrowthof313percentvsthe323percentincreaseofthefive
foundingmembers.
Manyotherfactors,whichwecannotexamine,nodoubtcontributedtotheFDIgrowth
ofeachofthesecountries.However,sinceallsevenrecordmarkedincreasesafter
joiningtheEU,andsince it isdifficult to thinkofanyother factor that theyhad in
common,andwhichcoincidedwiththevaryingdatesatwhichtheyjoined,itseems
highlyimprobablethattheseotherfactorscouldhavehadasimilarbeneficialimpact
onFDIinallsevencountries.Thesesevencountriesthereforeprovidestrongprima
facieevidencethatentrytotheEUhasabeneficial impactonFDIinflowsofnew
entrants.
Two later entrants, Denmark and Greece, do not provide any such evidence.
Denmark, as we have already seen, recorded a decline in FDI after joining the
CommonMarket,andwhileFDIinGreeceincreasedpost-entry,itdidnotincrease

www.civitas.org.uk
98 • Where’s The Insider Advantage?
asmuchasthatofthefivecountriesthatdidnotjoin.Thereisthereforelittlereason
forthinkingthatentrytotheEChelpedFDIinflowstoGreece,thoughitis,ofcourse,
possiblethatitdidso,andpreventedevenlowerinflows.
Denmark’sexperiencecallsforananalysisoftheeconomicconditionsinthatcountry
duringitspost-entrydecade,andofthedisincentivesforforeigninvestorsoverthese
years,especiallyinthelightofitssubsequentFDIrecord.
Greecemayhavebeena littleunlucky.Comparisonwiththefiveworld-widenon-
membersindicatesitspost-entrydecadecoincidedwithadownturninglobalFDI.
However,itsFDIalsocomparesunfavourablywiththefiveEuropeannon-entrants,
withthethree1973entrantsandwiththefivefoundingmembers.
Thesetwocasesdonot,however,seemsufficienttocontradicttheconclusiondrawn
fromthesevenprecedingcases,eventhoughtheyobligeustoqualify it. Inmost
cases,wemaysay,itishighlyprobablethatentrytotheEUhadabeneficialimpact
onFDIflows,butentrydidnothaveanequallybeneficialimpactonallnewentrants.
OneothercontrastthatappearsrepeatedlyinTable2deservesattention.Itisthat
between the newentrants and the foundingmembers.Of the nine newentrants
considered,sixexperiencedlarger increasesinFDIovertheirpost-entrydecades
thanthefivefoundingmembersoverthesesameyears.Andtwoofthethreewhose
FDIdidnotkeeppacewiththefoundingmembers,aswehavealreadynoticed,grew
onlyslightlyless–Austriaby10percent,andthebackmarker,Greece,byjusttwo
percentless.Newmembers,thissuggests,mayhavebenefitedmorefromjoining
theEC thanexistingmembersdid frombelonging to it,and thebeneficial impact
of joining theEUmaybe just that, a response toentry rather thanapermanent
advantage.
Thissuspicionisreinforcedbythesimilarcontrastbetweenthethree1973entrants
andthesixlaterentrants.Fiveofthesesixrecordedagreaterpost-entryjumpinFDI
thanthe1973entrantscollectivelydidoverthesesameyears.Why,onewonders,
should the FDI of later entrants not only grow more than that of the founding
members,butalsomorethanthatofthosewhojoinedshortlybeforethem?Inany
event,itseemsthatananswertothequestionabouttheFDIimpactofjoiningthe
EUisnotsimultaneouslyananswertothequestionabouttheenduringFDIbenefits
ofmembershipoftheEU.
Toshedsomelightonthebenefitsofmembershipovertime,wewillreviewallfour
decadesofUKmembershipalongsideDenmarkand Ireland,which joinedat the
sametime.

The impact of the EU on foreign direct investment in the UK from 1970 to 2011 • 99
www.civitas.org.uk
Hasmembershipbeenoflastingbenefit?WhentryingtoidentifytheimpactofEUmembershiponFDIovertime,andmeasure
thedurationofitsbenefits,onetemptingshortcutdeservesafirstshot:thecorrelation
betweenthedurationofacountry’smembershipanditsaccumulatedFDIstock.If
membership of the EU had a significant, enduring, long-term impact on the FDI
inflowsofitsmembers,thenonemightexpecttoseeapositivecorrelationbetween
thetwo.Thiscorrelationwill,ofcourse,overlookthefactthatcountriesmayhave
enteredtheEUwithdifferentFDIstocklevels,andthesemayvaryconsiderably.2 It
alsoofcourseignoresthemanywaysinwhichmembercountriesdifferthathave
nothingtodowithEUmembership.
Nonetheless,ifmembershiphashadalastingimpactontheFDIinmembercountries,
thenthosethathavebenefitedfromthemoveralongperiodshouldnowhavehigher
stock than thosewho have enjoyed these benefits over a shorter period. In the
event,thecorrelationbetweenyearsofmembershipof14countriesandthevalueof
FDIstockin2012islow,r =0.216,andwithoutonefoundingmemberwhoisalsothe
primeSPEsuspect,Belgium,itdropstor =0.12.Long-standingmemberswhohave
enjoyedthebenefitsoveralongerperiodhavenot,wemayreasonablyconclude,
accumulated largerFDIstocks. It isworthadding,however, that thecorrelation is
notnegative,sowehavenoreasontothinkthatFDIstockactuallydeclineswiththe
lengthofmembership,thoughthatdoesnotdisprovetheideathatthereisaninitial
surgeinFDIflowsafterentry,sincethatmightstillbetrue,evenwithoutdecisively
affectingthetotalvalueofacountry’sFDIstock.
Table3(overleaf)reportstheFDI inflowsofthethree1973entrants intheir three
pre-entryyearsfollowedbythefourdecadesoftheirmembership.Thefirsthalfof
the fourthdecade isshownseparately in thecolumnontheright,so thatwecan
judge,superficiallyatleast,howtheresultsofthefourthdecademighthavelooked
hadtheynotbeeninterruptedbythefinancialcrisisstartingin2008.Therecordof
thefiveindependentcountriesoverthefirsttwodecadesisalsogiven,butweare
obliged,asbefore,toswitchtojustthreeindependentcountriesoverthethirdand
fourthdecades.Twoof thecountriesdropped,AustriaandFinland,generallyhad
lowlevelsofFDIpriortojoiningtheEU,whilethecountryadded,Switzerland,had
ratherhighinflowsfromthefirstyearofitspublisheddata.3Otherwise,theformatis
thesameasinTable2above,andthefirstpost-entrydecadethereforerepeatsthe
figuresgiventhere.
This table demonstrates, first of all, just how varied the experiences of the EU
countries have been. There is no common or shared EU narrative, which only
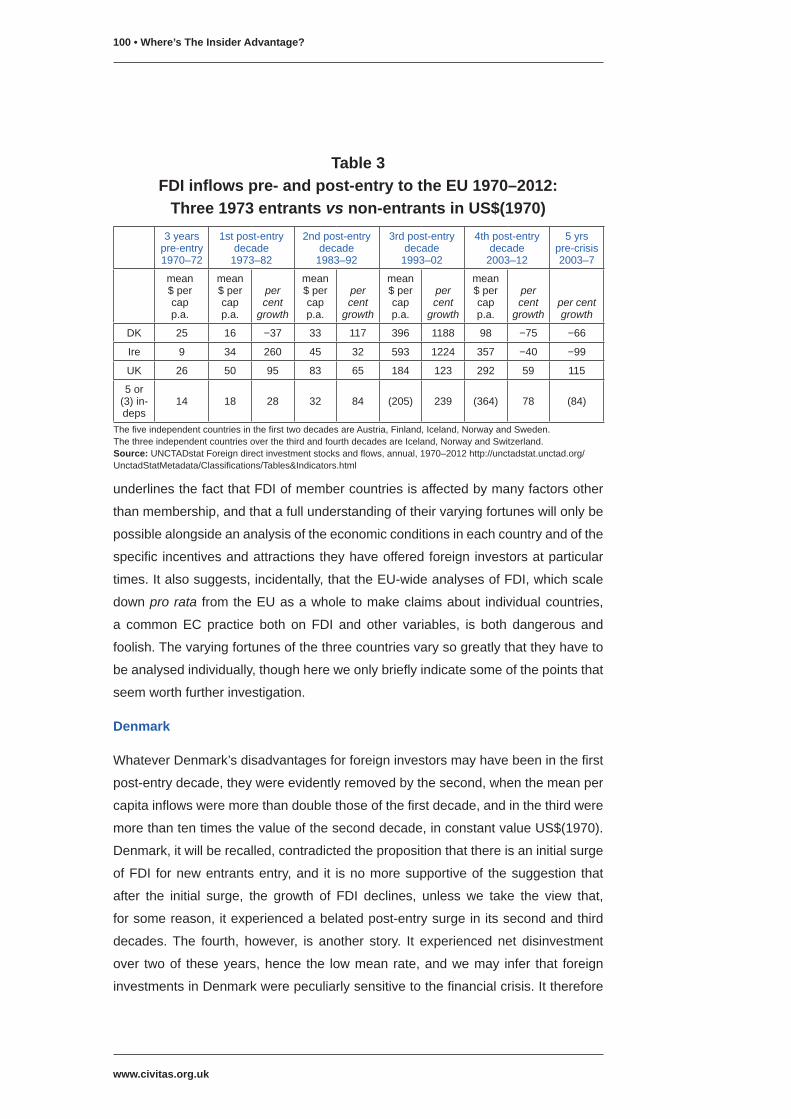
www.civitas.org.uk
100 • Where’s The Insider Advantage?
underlinesthefactthatFDIofmembercountriesisaffectedbymanyfactorsother
thanmembership,andthatafullunderstandingoftheirvaryingfortuneswillonlybe
possiblealongsideananalysisoftheeconomicconditionsineachcountryandofthe
specificincentivesandattractionstheyhaveofferedforeigninvestorsatparticular
times.Italsosuggests,incidentally,thattheEU-wideanalysesofFDI,whichscale
down pro rata fromtheEUasawholetomakeclaimsabout individualcountries,
a commonEC practice both on FDI and other variables, is both dangerous and
foolish.Thevaryingfortunesofthethreecountriesvarysogreatlythattheyhaveto
beanalysedindividually,thoughhereweonlybrieflyindicatesomeofthepointsthat
seemworthfurtherinvestigation.
Denmark
WhateverDenmark’sdisadvantagesforforeigninvestorsmayhavebeeninthefirst
post-entrydecade,theywereevidentlyremovedbythesecond,whenthemeanper
capitainflowsweremorethandoublethoseofthefirstdecade,andinthethirdwere
morethantentimesthevalueoftheseconddecade,inconstantvalueUS$(1970).
Denmark,itwillberecalled,contradictedthepropositionthatthereisaninitialsurge
ofFDI fornewentrantsentry,and it isnomoresupportiveof thesuggestion that
after the initial surge, the growth of FDI declines, unless we take the view that,
forsomereason,itexperiencedabelatedpost-entrysurgeinitssecondandthird
decades.The fourth, however, is another story. It experienced net disinvestment
over twoof theseyears,hence the lowmeanrate,andwemay infer that foreign
investmentsinDenmarkwerepeculiarlysensitivetothefinancialcrisis.Ittherefore
Table 3FDI inflows pre- and post-entry to the EU 1970–2012:
Three 1973 entrants vs non-entrants in US$(1970)3yearspre-entry1970–72
1stpost-entrydecade 1973–82
2ndpost-entrydecade 1983–92
3rdpost-entrydecade 1993–02
4thpost-entrydecade 2003–12
5yrspre-crisis2003–7
mean$ per cap p.a.
mean$ per cap p.a.
per cent
growth
mean$ per cap p.a.
per cent
growth
mean$ per cap p.a.
per cent
growth
mean$ per cap p.a.
per cent
growthper cent growth
DK 25 16 −37 33 117 396 1188 98 −75 −66
Ire 9 34 260 45 32 593 1224 357 −40 −99
UK 26 50 95 83 65 184 123 292 59 115
5or(3)in-deps
14 18 28 32 84 (205) 239 (364) 78 (84)
ThefiveindependentcountriesinthefirsttwodecadesareAustria,Finland,Iceland,NorwayandSweden.ThethreeindependentcountriesoverthethirdandfourthdecadesareIceland,NorwayandSwitzerland.Source:UNCTADstatForeigndirectinvestmentstocksandflows,annual,1970–2012http://unctadstat.unctad.org/UnctadStatMetadata/Classifications/Tables&Indicators.html
The impact of the EU on foreign direct investment in the UK from 1970 to 2011 • 101
www.civitas.org.uk
criesout for further investigationbypartner countryand the industrial locationof
foreigninvestments,thoughinthepresentcontextwewillturndeafears.
Ireland
Seenasawhole,Ireland’srecordisremarkable.Inthepre-entryyearsithadbyfar
thelowestpercapitainflows,butbythefourthdecadehadthehighest−oftheEU
membersatleast.However,itwasnotallplainsailing.Thereasonforthedipinthe
seconddecadeisworthyoffurtherinvestigation,alongsidethespectacularincrease
inthethird,whenthepercentgrowthFDIinIrelandoverthedecadewasmorethan
five times thatof the three independentcountriesandabout ten times thatof the
UK.Inthefourthdecadetherewerefouryearsofnetdisinvestment,threeofthem
beforethecrisis(2004–6),hencethenegativegrowthbeforethefinancialcrisis,and
thefourthin2008.Evenso,themeanrateremainedabovethatoftheUK,andsince
2008FDIhascontinuedatahighrate.From2009–2012,FDIflowspercapitawere
notfarshortofsixtimesthosetotheUK,indicatingthatFDIinIrelandwasnotofa
kind,andnotfromcountries,thatweredeeplyaffectedbythecrisis.FDIwaslargely
responsibleforitseconomicsuccessoverearlierdecades,andmaywellrescueit
fromitspresentproblems.
ThekeyquestioniswhetheritsFDIsuccessstoryhasanythingwhatevertodowith
itsEUmembership.Irishspokesmenusuallysaythatitdoes,oftenenthusiastically,
evenfulsomely,but then itwouldhardlybepolitic tosaypublicly it isdueto their
rate of corporation tax, or other incentives Ireland offers, since other countries
might imitate them,orcompetewith them,orworsestillclaimthat this isnot ‘fair
competition’or‘alevelplayingfield’accordingtotheprinciplesoftheSingleMarket.
OtherEUmembersmightthenseek,viatheCouncilofMinistersortheEuropean
Court, to ‘harmonise’ the incentives offered to foreign investors, citing powers
grantedtotheECunderArticle188CoftheLisbonTreaty,whichmadeFDIapart
of‘thecommoncommercialpolicy’oftheUnion.4Ireland’scomparativeadvantage
inFDI,thefoundationofitsrecenteconomicdevelopment,mightthencomeunder
seriousthreat.
They have good reason, therefore, to give all the credit for their success to EU
membership.Themost,andperhapstheonlything,thatcanbesaidforthisidea,
isthatthemassivesurgeofFDIinflowsdidindeedcomeafterEUentry.However,
Ireland’s subsequentFDI recorddiffers somarkedly fromotherEUmembers,as
wewill see inamoment, that itseems likely thatnationaldecisionsaffecting the
incentives to foreign investment, especially in the second and third decades of
membership,weremuchmoreimportantthanEUmembershipper se.

www.civitas.org.uk
102 • Where’s The Insider Advantage?
UK
Inthepre-entryyearstheUKhadthehighestmeanpercapita perannumrateofFDI
inflow,whichoverthefirstpost-entrydecadeincreasedmorethanthatof thefive
independentcountries.Howeveroverthenextthreedecades,FDIinwardflowsto
theUKincreasedbylessthanthoseoftheindependentcountries,thoughnotinthe
pre-crisisquinquennium.
Figure3presentstherawdataofFDIinflows,in1970US$,thoughthevolatility,as
wellasthesharpincreaseintheoverallvalueofFDI,ratherobscuresthetrend.
Figure 3FDI inflows per capita 1983–2012 UK vs three independent European countries and five founder members of the EU
in US$(1970)
ThethreeindependentcountriesareNorway,SwitzerlandandIceland.ThefivefoundingmembersareBelgium,France,Germany,ItalyandtheNetherlands.Luxembourghadtobeomittedduetothelackofdata.Source:UNCTADstatForeigndirectinvestmentstocksandflows,annual,1970–2012:http://unctadstat.unctad.org/UnctadStatMetadata/Classifications/Tables&Indicators.html
Apatterndoes,however,appearinthedataonFDIstock,whichUNCTADbegan
to publish in 1980, and for all three independent countries from 1983. Figure
4belowcompares thepercapitagrowthofFDIstockof theUKandof the three
independentcountriesfromthatyear,stillin1970US$.Theweightedmeanofthe
three independentcountries, indeeppurple,showstheyweregrowingmarginally
fasterfrom1983,butdrewmarkedlyaheadafter2001,andthereaftertheirFDIstock
increased at amuchmore rapid rate, and continued to do so even through the
financialcrisis.
−100
0
100
200
300
400
500
600
700
800
900
201020052000199519901985
3 independent countries Founding 5UK
FDI i
nflo
ws
per c
apita
, US
$(19
70)

The impact of the EU on foreign direct investment in the UK from 1970 to 2011 • 103
www.civitas.org.uk
Figure 4Growth of per capita FDI stock 1983–2012 UK compared with three independent European countries in US$(1970) with 2012
amount in current $
ThethreeindependentcountriesareNorway,SwitzerlandandIceland.Sources:UNCTADstatForeigndirectinvestmentstocksandflows,annual,1970–2012:http://unctadstat.unctad.org/UnctadStatMetadata/Classifications/Tables&Indicators.htmlOECDstatDataset:Foreigndirectinvestment:positionsbyindustry,ReportingcountryNorway;WTO,TradePolicyReview:SwitzerlandandLiechtenstein,Table1.4Foreigndirectinvestment,2008–11,23April2013:http://www.wto.org/english/thewto_e/countries_e/switzerland_e.htmIceland1989–2012CentralBankofIceland’swebsite:http://statistics.cb.is/en/data/set/
Thesecondandthirdpurplelineswereaddedinresponsetotheobjectionthatthe
UKcannotfairlybecomparedwiththesethreeindependentcountriesbecauseofthe
‘fundamentaleconomicdifferencesbetweentheUKandeachof thesecountries’,
astheanonymousTreasuryauthorquotedaboveputit,andinparticularbecause
Norway’s large oil and gas industry, and Switzerland’s financial services and
pharmaceuticalindustries,woulddistortanycomparison.
A brief word on how theywere calculated is necessary.UNCTAD does not give
anindustrybreakdownoftherecipientindustriesofinwardFDIflowsorstock,but
theOECDdoesidentifyindustrialsectorsintowhichtheforeigninvestorsputtheir
money,from1986onwards.ThisshowsthatthemeanpercentageofallFDIinflows
toNorwayovertheyears1986–2011goingtotheoilandgassectorwas34.5per
3 independent countries minus Norway’s oil & gas and Switzerland’s finance & holding companies
3 independent countries minus Norway’s oil & gas 3 independent countries
UK
201020052000199519901985
$61,749
$20,961
$66,720
0
2,000
4,000
6,000
8,000
10,000
12,000
14,000
$46,804
FDI s
tock
per
cap
ita, U
S$(
1970
)

www.civitas.org.uk
104 • Where’s The Insider Advantage?
cent.ThissameproportionhasthereforebeensubtractedfromthemeanoftheFDI
flowsgoingtothethreeindependentcountriesoveralltheyears1983–2012,andthe
lighterpurplelineshowstheresultwhenNorway’soilandgasiseliminatedfromthe
weightedmeanofthethreecountries.5
The lightest purple line beneath it was calculated from WTO data. The OECD
returnisunfortunatelynotdetailedenoughtodistinguishSwitzerland’sfinancialand
pharmaceuticalsectors.However,initsTrade Policy Review for SwitzerlandinApril
2013, one of those it periodically publishes for everymember country, theWTO
happenedtoincludeaclearbreakdownbyindustryofFDIinflowsandstocksoverthe
years2008–2011.Overthoseyears,‘FinanceandHoldingCompanies’consistently
constituted29percentofallSwissFDI inwardstock.6 Inflowstopharmaceuticals
weretoosmalltomeritaseparatecategory.However,if29percentissubtracted
from thegrowthofSwissFDIstockoverall theyears1983–2012,wecancome
closetoeliminatingthesupposeddistortingeffectsofSwissfinancialservices,and
inallprobabilitywearesimultaneouslyeliminatingallSPEs.
ThelightestpurplelineonFigure4showstheweightedmeangrowthofFDIstock
ofthethreecountrieswithoutbothNorway’soilandgasandSwitzerland’sfinancial
services.TheUKmeanwhile isshownwithFDI toboth itsoilandgas industries,
andtoitsfinanceandholdingcompanies,includinganySPEsitmayhave.Some
observers may, perhaps, find this a ‘fair’ comparison, but the difference is still
substantial.TheFDIstockofthesethreenon-membershasgrownmuchfasterthan
thatoftheUKoverthelifeoftheSingleMarket.Intotalvaluein2012itwasmore
thandoublethatoftheUK:$46,804versus$20,961.
EvidenceofFDIintheUKoverthefirstpost-entrydecadelentsupporttotheviewthat
ithadbeenhelpedbyentrytotheEUbecauseFDIinflowswerehigherthanthose
toindependentEuropeancountriesoverthesameyears.Bythesamereasoning,
UKperformanceoverthesecond,thirdandfourthpost-entrydecadesindicatesthat
whateversupportEUmembershipmayhavegiventoFDIintheUKhaddeclined
ordisappeared.Whilethereis,therefore,evidencethatentrytotheEUmayhave
helpedFDIoveritsfirstpost-entrydecade,thereisnoevidenceatall,eitherfrom
FDIflowsorfromthegrowthofFDIstock,thatmembershipoftheEUhasbrought
lastingbenefitstoFDIintheUK.
TherearehintsintheUNCTADdataofflowsandstocksthatthisphenomenonof
aninitialpost-entrysurgeofFDIfollowedbyadeclinetorateslowerthanthoseof
independentcountries isnotpeculiar to theUK.Table4extendstheevidenceon
flowspresentedinTable2upto2012.

The impact of the EU on foreign direct investment in the UK from 1970 to 2011 • 105
www.civitas.org.uk
ItcompareschangesinthemeanannualpercapitaamountsofinwardFDIofnine
later entrants with those of three independent countries and with five founding
membersoverthesameyears.Column1givesthepercentagedifferencebetween
thepre-entrymeanannualamountandthatovertheimmediatepost-entrydecade.
Column 2 compares themean annual amount over the decade 1993–2002with
thequinquennium2004–2007,stoppinginthatyearsothatwemayseewhatwas
happeningbeforethefinancialcrisiswhichiswidelythoughttohavedisruptedFDI
Table 4Growth of inward flows per capita to nine later entrants
compared with five independent countries and five founding members; and comparing the most recent decade 2003–2012
with their first decades in US$(1970)Increase in mean amount of annual inward flows
1.Post-entrydecadevs
pre-entry
2.Pre-crisis2003–2007
vs1993–2002
3.Thedecade2003–2012
vs1993–2002
Denmark −37 −66 −75
Ireland **260 −99 −40
UK **95 **115 *593Independents 64 84 78
Founding5 7 32 9
Greece *28 **112 **1043Independents 25 84 78
Founding5 30 32 9
Portugal **570 −14 *67Spain **299 −28 *393Independents 66 84 78
Founding5 217 32 9
Austria *313 **147 **110Finland **601 −1 −29
Sweden **468 −30 −29
3Independents 208 84 78
Founding5 323 32 9
ThethreeindependentcountriesareNorway,IcelandandSwitzerland.ThefivefoundingmembersareBelgium,France,Germany,ItalyandtheNetherlands.Luxembourghadtobeomittedduetothelackofdata.Pre-entryyearsforDenmark,IrelandandtheUKwasbasedon1970–1972only,sinceUNCTADdataisonlyavailablefrom1970.Inalltheothersothersixcountriescompareadecadepreandpostentry.ThemissingSwissdata1970–1982wasestimatedbyassumingitwasthesameproportionofthethreeindependentcountriestotalasitwasinfollowingthirteenyearsi.e.nearlytwothirds.Source:UNCTADstatForeigndirectinvestmentstocksandflows,annual,1970–2012http://unctadstat.unctad.org/UnctadStatMetadata/Classifications/Tables&Indicators.html

www.civitas.org.uk
106 • Where’s The Insider Advantage?
flows.Column3showsthepercentagedifferencebetweenthedecade1993–2002
andthelatestfulldecadeforwhichwehavedata,2003–2012.
In their first post-entry decade, eight of the nine later entrants recorded a larger
increase in inward flows of FDI than the three independent countries. They are
starredinred.InColumn2,comparingthemeanannualamountsoverthedecade
1993–2002withthefiveyearsbeforethefinancialcrisis,onlythreearestarredto
showthattheirmeanleveloftheirinwardFDIflowsincreasedmorethanthatofthe
independentcountries. InColumn3,only two laterentrants,AustriaandGreece,
arestarredtoindicatethatitsFDIflowsincreasedmorethanindependentcountries.
Henceitwouldappearthat,immediatelyfollowingEUentry,inwardFDIflowstomost
laterentrantsincreasedsharply,butinmorerecentyears,bothbeforeandafterthe
financialcrisis,FDIflowstomostofthemhavegrownmoreslowly.Itseemsunlikely
thereforethatthefinancialcrisiscouldhavebeenresponsiblefortheslowdown.
TheFDI inward flowsof later entrants also declined relative to the founding five
members.ImmediatelyaftertheirEUentry,sixofthelaterentrants,starredingreen,
recorded a larger increase in their mean annual inward FDI flows than founder
members.Only three continued to do so over the five years before the financial
crisisbegan.However,over thedecade2003–2012asawhole,FDIflowstofive
oflaterentrantsincreasedmorethanthosetothefivefoundermembers,andsince
theinflowstothefoundermembersareamongthelowestacrossEurope,itwould
appearthattheywereamongstthosemostaffectedbythecrisis.
Thisevidenceishardlyconclusive,thoughitstronglysuggeststhatthatjoiningthe
EUbrings immediatebenefits for inwardFDIbut that thesedonot continuewith
membershipofit.Thebenefitsonjoiningcanbedemonstratedfairlyconvincingly,
evenifnoteverynewmembersharedthem.Thebenefitsofcontinuedmembership
haveyettobeidentified.
Measuring and comparing shifts in the means of highly volatile FDI flows over
varyingperiodsof time is,however,a trickyandhigh-riskundertaking,especially
whenonehastoworkwithacontrolgroupwhosemembershipchangesovertime.
ComparingthegrowthofFDIstockisanaltogethersimplertask,andprobablygives
morereliable results.Wecando thispost-1980.Table5compares theFDIstock
ofthenewentrantsinthetenthyearoftheirmembershipwhensomeofthemhad
reapedthebenefitsofjoining,withtheirstockin2012,asaproportionofthatheld
bythegroupof three independentEuropeancountries. Ineightoutofninecases
thatproportionhasfallen,inmostcasesquitesignificantly.7Denmarkistheonlyone
oftheninewheretheproportionhasincreased,andthereforetheonlyonestarred.

The impact of the EU on foreign direct investment in the UK from 1970 to 2011 • 107
www.civitas.org.uk
IfFDI in independentcountriesconsistently increasesata faster rate than inEU
member countries, one has to wonder where the benefits of membership might
be found.However,wewill be lookingagain,and inmoredetail, at theseyears,
alongsideotherEUmembers,whenweexamine theUKdecisionnot to join the
euro,andattheimpactoftheSingleMarket,andthereforehaveasecondchance
tofindtheenduringbenefitsofEUmembershipforFDIintheUK,ifthereareany.
Table 5Value of FDI stock of nine EU later entrants after first ten years of EU membership vs 2012 as a proportion of weighted mean of three independent European countries measured in current
value US$
Countryand tenthyearafterentry
Percentofstockofindependent countries
intenthyear
Percentofstockof independent countries
in2012
Denmark1982 36 *39Ireland1982 677 97
UK1982 63 31
Greece1990 14 5
Portugal1995 29 16
Spain1995 43 20
Austria2004 38 28
Finland2004 48 25
Sweden2004 97 59
ThethreeindependentcountriesareIceland,Switzerland,Norway.Source:UNCTADstatForeigndirectinvestmentstocksandflows,annual,1970–2012http://unctadstat.unctad.org/UnctadStatMetadata/Classifications/Tables&Indicators.html

www.civitas.org.uk
108 • Where’s The Insider Advantage?
2.DiddecliningtojointheeuroadverselyaffectFDIintheUK?Theeurowaslaunchedasatradingcurrencyon1January1999,thoughnotesand
coinsdidnotcomeintocirculationuntil2002.Astheydidso,across-partypolitical
eliteoftheUK,includingthethenPrimeMinisterTonyBlair,launchedacampaignfor
theUKtojointhecurrency.Themediagavethecampaign,oratleastthestartofit,
considerablecoverage,thoughtherewaslittleindicationofanypopularenthusiasm
fortheidea.Inthespringof2002,accordingtoEurobarometer,thepollingarmofthe
EuropeanCommission,52percentoftheUKpopulationwereagainst joiningthe
euroand32percentthoughtit‘averybadthing’,while31percentwereinfavour.1
Journalistsofthepro-EUpressdidtheirbesttodiscreditthosewhoquestionedthe
wisdomof theproposal.AndrewRawnsley inThe Observerdescribed themasa
‘menagerieofhas-beens,never-have-beensandloonytunes’.DavidAaaronovitch
in The Independentreferredtothe‘assortedmaniacs,buffoons,empire-nostalgists,
colonialpress tycoons,SaveTheGroatanoraksandYorkshireseparatistsof the
Europhobemovement’.HugoYounginThe Guardianhadaseeminglyendlessstring
ofbizarretermstodescribethosewhospokeoutagainsttheeuro.Theywere‘men
ofintellectualviolence’,consumedby‘last-ditchextremism’.Theystoked‘thephobic
fireandscepticpropaganda’,andtheiranti-Europeanismhadan‘insidiouspotency’,
even though they ‘wereweigheddownby thebaggageofphobia,sentimentand
illusion’.2
Unfortunately, these columnists were rather short of evidence either about the
peopleorabout the issue. Inanyevent, the ‘loony tunes’and ‘buffoons’and ‘last
ditchextremists’etc.seemtohavehadlittletodowiththefailureofthecampaign.
It is usually thought to have been scuppered by theChancellor, Gordon Brown,
whodidnotshare theenthusiasmof thePrimeMinister for theeuro. In1997he
haddevisedfivetestswhichtheconvergenceoftheUKeconomywiththatofthe
eurozonehadtopassbeforehewouldcontemplateagreeingtoUKentry.Thevery
ideathattheeurocausewouldhenceforthhavetowithstandcloseandcontinuous
scrutinyandempiricalverification,andcouldno longerreston faith,brighthopes
andpromises,seemstohavedampened theenthusiasmof itssupporters. In the
thoroughreassessmentof2003,thefivetestswerestillnotpassed,andthereafter
thecampaigntojoinfizzledoutandlapsedfrompublicawareness.3
Thissearchissolelyconcernedwithdiscoveringwhether,asmanyeuroenthusiasts
warned,thedecisionnottojointhenewcurrencyhadadverseeffectonFDIinthe
UK.Itdoesnottrytodiscoverwhetherthatdecisionwasrightorwrong.Someofthe
The impact of the EU on foreign direct investment in the UK from 1970 to 2011 • 109
www.civitas.org.uk
evidencewewillconsiderwasavailableatthetimetothosewhofavouredjoining
thenewcurrency,butmostwasnot,sowewill,ofcourse,havetheadvantageof
hindsight.
ThewarningfromthebigbusinesslobbyBritaininEurope,apressuregroupfinancedbyanumberoflargeUKandforeign
multi-nationalcorporations,didatleastcommissionsomeresearchtosupporttheir
caseforjoining,forwhichweshouldbegrateful.HuhneandCanning,theauthorsof
theirreport,claimed,asmentionedearlier,that‘foreigninvestorswanttoservethe
Europeanmarketfreeoftheriskofexchangeratemovements’,andthatbyfailing
to join theeurowhen itbegan, theamountof ‘foreign investment(in theUK)has
declinedfairlydramatically’andis‘destinedtodeclinestillfurther’.4
They added a number of quotes and anecdotes to convey the impression of
officialandmultinationalconsensuson the issue.The Invest inBritainBureau, a
governmentagency,had,theysaid,warnedthatfurtherinvestmentintheUKcarries
anunnecessary riskof ‘meltdown’, aview thatHuhneandCanning thought their
researchhas ‘proved justified’.TheycitedtheUKambassador toJapanwhohad
referredto‘ageneralisedperception’thathehadfromhisinformantsthat‘untilthe
UKisclearlyontracktojointhesinglecurrencyfurtherinvestmentintheUKcarries
unnecessaryrisk’.TheymentionedthatMasseyFerguson,aCanadianmultinational,
hadswitchedproduction fromCoventry toBeauvais, and identifiedKomatsuand
BASFasexamplesofforeignmultinationalsthathadheldbackonnewinvestment
intheUK,andwereevencontemplatingmovingoutoftheUK,becauseBritainhad
notjoinedtheeuro.
The statistical evidence which they mustered to support their argument was
reproducedinasecondpublicationbyBritaininEurope,underthenamesofseveral
well-known British and American economists and commentators. However, this
bears all the signs of an intellectual celebrity endorsement, intended to convey
theimpressionthatinformedpeopleareprettymuchagreedthatenteringtheeuro
is a good thing rather than of independent research which arrived at the same
conclusions.Itaddsnothingbywayofinsight,evidenceorargumenttoHuhneand
Canning,sowewillconfineourattentiontotheirwork.5
Theypresentedtwokindsofevidence.ThefirstreferredtoafallintheUKshare of
FDIintheEU,whichtheyclaimedhaddeclinedsincethelaunchoftheeuro,andthe
secondtoadeclineinvalueoftheinwardflowofFDIintheUKupto2001,bothof
whichtheyclaimedwereaconsequenceofBritain’srefusaltojointhenewcurrency.
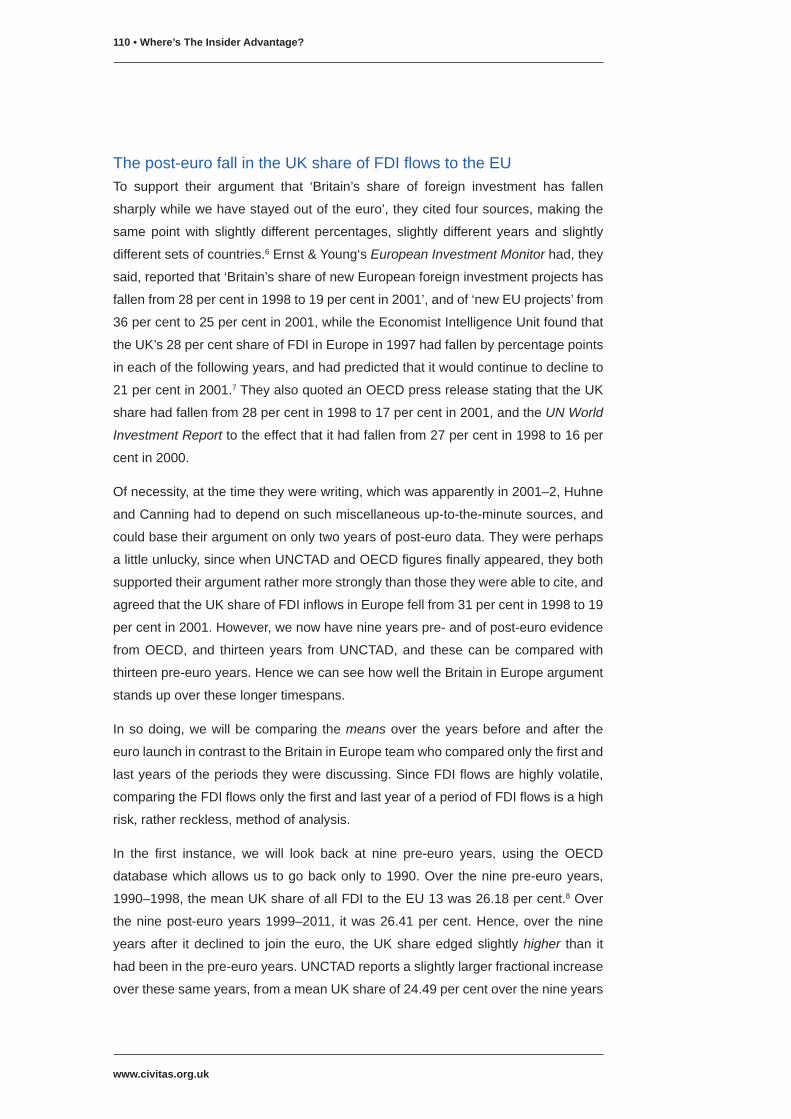
www.civitas.org.uk
110 • Where’s The Insider Advantage?
Thepost-eurofallintheUKshareofFDIflowstotheEUTo support their argument that ‘Britain’s share of foreign investment has fallen
sharplywhilewehavestayedoutoftheeuro’,theycitedfoursources,makingthe
samepointwith slightly different percentages, slightly different years and slightly
differentsetsofcountries.6Ernst&Young‘sEuropean Investment Monitorhad,they
said,reportedthat‘Britain’sshareofnewEuropeanforeigninvestmentprojectshas
fallenfrom28percentin1998to19percentin2001’,andof‘newEUprojects’from
36percentto25percentin2001,whiletheEconomistIntelligenceUnitfoundthat
theUK’s28percentshareofFDIinEuropein1997hadfallenbypercentagepoints
ineachofthefollowingyears,andhadpredictedthatitwouldcontinuetodeclineto
21percentin2001.7TheyalsoquotedanOECDpressreleasestatingthattheUK
sharehadfallenfrom28percentin1998to17percentin2001,andtheUN World
Investment Reporttotheeffectthatithadfallenfrom27percentin1998to16per
centin2000.
Ofnecessity,atthetimetheywerewriting,whichwasapparentlyin2001–2,Huhne
andCanninghadtodependonsuchmiscellaneousup-to-the-minutesources,and
couldbasetheirargumentononlytwoyearsofpost-eurodata.Theywereperhaps
alittleunlucky,sincewhenUNCTADandOECDfiguresfinallyappeared,theyboth
supportedtheirargumentrathermorestronglythanthosetheywereabletocite,and
agreedthattheUKshareofFDIinflowsinEuropefellfrom31percentin1998to19
percentin2001.However,wenowhavenineyearspre-andofpost-euroevidence
fromOECD,and thirteenyears fromUNCTAD,and thesecanbecomparedwith
thirteenpre-euroyears.HencewecanseehowwelltheBritaininEuropeargument
standsupovertheselongertimespans.
Insodoing,wewillbecomparing themeansover theyearsbeforeandafter the
eurolaunchincontrasttotheBritaininEuropeteamwhocomparedonlythefirstand
lastyearsoftheperiodstheywerediscussing.SinceFDIflowsarehighlyvolatile,
comparingtheFDIflowsonlythefirstandlastyearofaperiodofFDIflowsisahigh
risk,ratherreckless,methodofanalysis.
In the first instance, we will look back at nine pre-euro years, using the OECD
databasewhichallowsustogobackonlyto1990.Overtheninepre-euroyears,
1990–1998,themeanUKshareofallFDItotheEU13was26.18percent.8Over
theninepost-euroyears1999–2011, itwas26.41percent.Hence,over thenine
yearsafter itdeclined to join theeuro, theUKshareedgedslightlyhigher than it
hadbeeninthepre-euroyears.UNCTADreportsaslightlylargerfractionalincrease
overthesesameyears,fromameanUKshareof24.49percentoverthenineyears
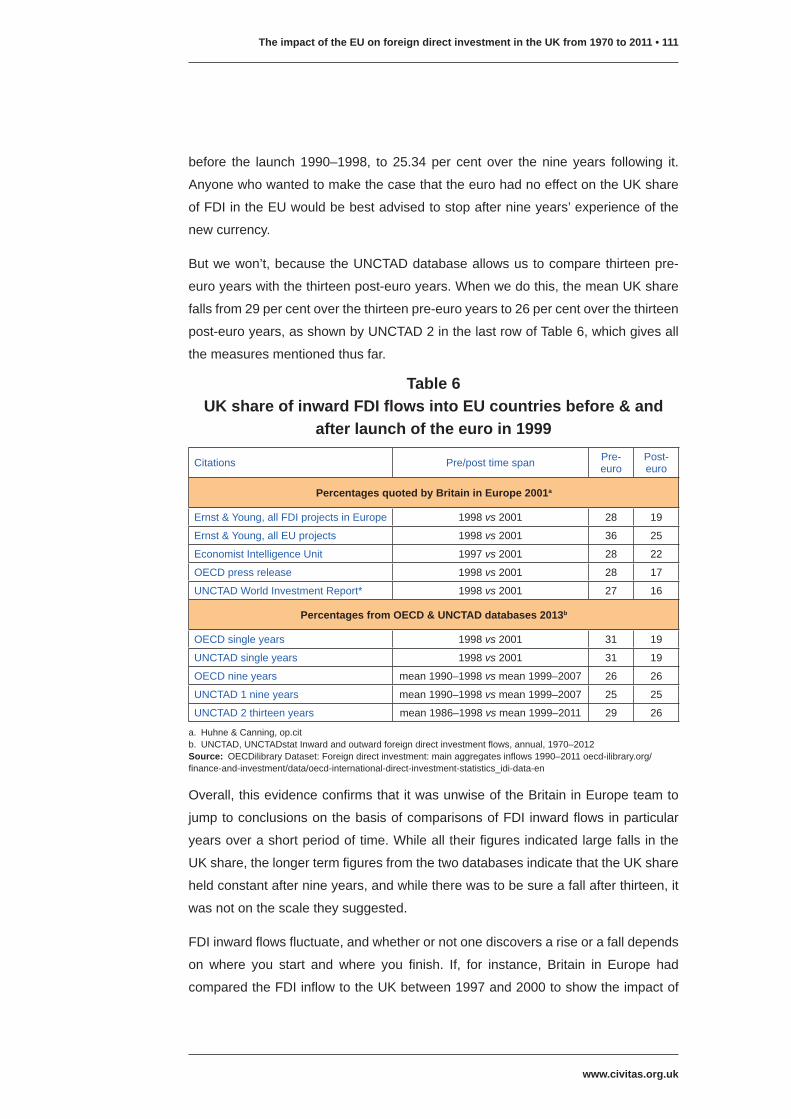
The impact of the EU on foreign direct investment in the UK from 1970 to 2011 • 111
www.civitas.org.uk
before the launch1990–1998, to25.34per cent over thenine years following it.
AnyonewhowantedtomakethecasethattheeurohadnoeffectontheUKshare
ofFDIintheEUwouldbebestadvisedtostopafternineyears’experienceofthe
newcurrency.
Butwewon’t,becausetheUNCTADdatabaseallowsustocomparethirteenpre-
euroyearswiththethirteenpost-euroyears.Whenwedothis,themeanUKshare
fallsfrom29percentoverthethirteenpre-euroyearsto26percentoverthethirteen
post-euroyears,asshownbyUNCTAD2inthelastrowofTable6,whichgivesall
themeasuresmentionedthusfar.
Overall,thisevidenceconfirmsthatitwasunwiseoftheBritaininEuropeteamto
jumptoconclusionsonthebasisofcomparisonsofFDIinwardflowsinparticular
yearsoverashortperiodoftime.Whilealltheirfiguresindicatedlargefallsinthe
UKshare,thelongertermfiguresfromthetwodatabasesindicatethattheUKshare
heldconstantafternineyears,andwhiletherewastobesureafallafterthirteen,it
wasnotonthescaletheysuggested.
FDIinwardflowsfluctuate,andwhetherornotonediscoversariseorafalldepends
on where you start and where you finish. If, for instance, Britain in Europe had
comparedtheFDIinflowtotheUKbetween1997and2000toshowtheimpactof
Table 6UK share of inward FDI flows into EU countries before & and
after launch of the euro in 1999
Citations Pre/posttimespan Pre-euro
Post-euro
Percentages quoted by Britain in Europe 2001a
Ernst&Young,allFDIprojectsinEurope 1998vs2001 28 19
Ernst&Young,allEUprojects 1998vs2001 36 25
EconomistIntelligenceUnit 1997vs2001 28 22
OECDpressrelease 1998vs2001 28 17
UNCTADWorldInvestmentReport* 1998vs2001 27 16
Percentages from OECD & UNCTAD databases 2013b
OECDsingleyears 1998vs2001 31 19
UNCTADsingleyears 1998vs2001 31 19
OECDnineyears mean1990–1998vsmean1999–2007 26 26
UNCTAD1nineyears mean1990–1998vsmean1999–2007 25 25
UNCTAD2thirteenyears mean1986–1998vsmean1999–2011 29 26
a. Huhne&Canning,op.citb. UNCTAD,UNCTADstatInwardandoutwardforeigndirectinvestmentflows,annual,1970–2012Source: OECDilibraryDataset:Foreigndirectinvestment:mainaggregatesinflows1990–2011oecd-ilibrary.org/finance-and-investment/data/oecd-international-direct-investment-statistics_idi-data-en

www.civitas.org.uk
112 • Where’s The Insider Advantage?
stayingoutoftheeuro,ratherthan1997and2001,theywouldhavebeenobligedto
reporta‘dramatic’increaseofFDIinflowtotheUKofmorethan350percent,from
$33.2bnto$118.8bn,andthenperhapstheywouldhavewrittenabouthowtheUK
decisiontoremainoutsidehadbeentriumphantlyvindicated.Orperhapsnot.The
pointholds.
Forwhatitisworth,atthetimeofwriting,UNCTADreportsfor2012werepublished.
TheyshowedtheUKshareofFDIinflowsintheEU15fortheyearhadjumpedto
32.2percent,whileOECDmadeitexactly30percent,bothcomfortablyabovetheir
respectivemeansfortheUKoverthepre-euroyears.9
SharesofFDIinflowstoEuropepre-andpost-euro:winnersandlosersInsteadofdiscussingtheUKshareofFDIinflowstotheEUorEuropeinisolation,we
maybetterassesstheUKperformancebyexaminingitspercapitasharesalongside
that of every other European country forwhich there is adequate evidence over
the thirteen years beforeandafter the launchof theeuro.Wemay then identify
thecountriesthathaveincreasedtheirshare,andmightthereforebesaidtohave
benefitedfromthenewcurrency,andperhapsevenidentifythosethathavegained
attheexpenseoftheUK.
For thiscomparison, the11eurozonecountries forwhichwehavecompletedata
maybecomparedwithareasonablecontrolgroupofsixnon-eurocountries(three
insideandthreeoutsidetheEU).However,forthiscomparisonitseemedsensible,
ongroundsmentionedearlier,toeliminateBelgiumandIceland.10
Weare therefore leftwith tencountries to represent theeurozone,andfivenon-
eurocountries.Table7presentsthesharesoftheFDIinflowstoall15countriesas
percentagesofthetotalvalueinthethirteenyearsbeforeandafterthelaunchofthe
euro(columns1and2).Column3givesthepercentageofthetotalEUpopulation
ofeachthe15countriesin1999,andColumn4providesasimpleindexoftheover-
andunder-performersinFDIbydividingthepost-euromeanshareofthetotalvalue
incolumn2bytheshareofthetotalpopulationin1999(column3).Ifacountry’s
percentageshareoftheformerisgreaterthanitspercentageshareofthelatter,it
isanover-performer,and if less it isanunder-performer.Expressedasa ratio in
column4,over-performersscoremorethan1,andareshadedorange,andunder-
performerslessthan1.
If we first consider the eurozone collectively,wemay see that the ten eurozone
countrieshavemarginallyincreasedtheirshareofthetotalvalueofinwardFDIflows
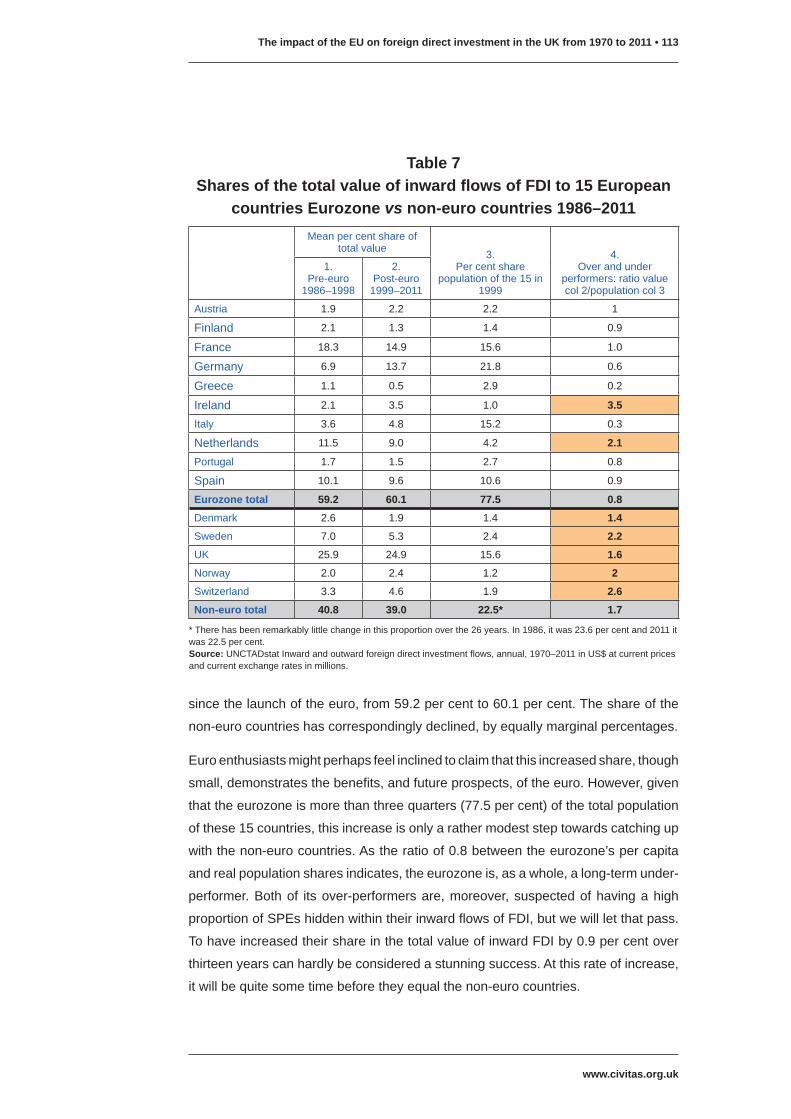
The impact of the EU on foreign direct investment in the UK from 1970 to 2011 • 113
www.civitas.org.uk
sincethelaunchoftheeuro,from59.2percentto60.1percent.Theshareofthe
non-eurocountrieshascorrespondinglydeclined,byequallymarginalpercentages.
Euroenthusiastsmightperhapsfeelinclinedtoclaimthatthisincreasedshare,though
small,demonstratesthebenefits,andfutureprospects,oftheeuro.However,given
thattheeurozoneismorethanthreequarters(77.5percent)ofthetotalpopulation
ofthese15countries,thisincreaseisonlyarathermodeststeptowardscatchingup
withthenon-eurocountries.Astheratioof0.8betweentheeurozone’spercapita
andrealpopulationsharesindicates,theeurozoneis,asawhole,along-termunder-
performer.Bothof itsover-performersare,moreover,suspectedofhavingahigh
proportionofSPEshiddenwithintheirinwardflowsofFDI,butwewillletthatpass.
TohaveincreasedtheirshareinthetotalvalueofinwardFDIby0.9percentover
thirteenyearscanhardlybeconsideredastunningsuccess.Atthisrateofincrease,
itwillbequitesometimebeforetheyequalthenon-eurocountries.
Table 7Shares of the total value of inward flows of FDI to 15 European
countries Eurozone vs non-euro countries 1986–2011Meanpercentshareof
totalvalue 3.Percentshare
populationofthe15in1999
4.Overandunder
performers:ratiovaluecol2/populationcol3
1.Pre-euro1986–1998
2.Post-euro1999–2011
Austria 1.9 2.2 2.2 1
Finland 2.1 1.3 1.4 0.9
France 18.3 14.9 15.6 1.0
Germany 6.9 13.7 21.8 0.6
Greece 1.1 0.5 2.9 0.2
Ireland 2.1 3.5 1.0 3.5
Italy 3.6 4.8 15.2 0.3
Netherlands 11.5 9.0 4.2 2.1
Portugal 1.7 1.5 2.7 0.8
Spain 10.1 9.6 10.6 0.9
Eurozone total 59.2 60.1 77.5 0.8
Denmark 2.6 1.9 1.4 1.4
Sweden 7.0 5.3 2.4 2.2
UK 25.9 24.9 15.6 1.6
Norway 2.0 2.4 1.2 2
Switzerland 3.3 4.6 1.9 2.6
Non-euro total 40.8 39.0 22.5* 1.7
*Therehasbeenremarkablylittlechangeinthisproportionoverthe26years.In1986,itwas23.6percentand2011itwas22.5percent.Source:UNCTADstatInwardandoutwardforeigndirectinvestmentflows,annual,1970–2011inUS$atcurrentpricesandcurrentexchangeratesinmillions.

www.civitas.org.uk
114 • Where’s The Insider Advantage?
Withintheeurozone,fourcountrieshaveincreasedtheirshareinthetotalvalueof
inwardflowsofFDI:Germanyby6.8percent,Irelandby1.4percent,Italyby1.2per
centandAustriaby0.3percent.Germany,withitsexceptionallylowstartingpoint,
hasmadethelargestpost-euroFDIgains,havingverynearlydoubleditsshareover
thethirteenyears.11
Irelandisfarandawaythehighestover-performerintheeurozone,withthevalue
of itsFDI inflowsmore than3.5 timesgreater than itspopulationwould leadone
to expect. The other over-performer is the Netherlands. Austria and France’s
shares are almost exactly proportionate to the size of their populations,while in
descending order, Finland, Spain, Portugal,Germany andGreece are all under-
performers.Germanymayhavebeencatchingupfastwithitspartnercountries,and
increasingitsshareattheirexpense,butitremains,asyet,anunder-performer,not
surprisinglyperhaps,sincereunificationcombinedthehistoricallylowperformerof
WestGermanywithanon-performer,EastGermany.
Amongthenon-eurocountries,thetwoindependent,non-EUmembershavebeen
theonlypost-eurobeneficiaries,while the threeEUcountries,Denmark,Sweden
andtheUK,havealllostground,albeitbysmallamounts.IntotalvaluetheUKshare
hasfallenbyonepercentagepoint,thoughitremains,bysomedistance,thelargest
recipientofFDIintotalvalueofallthese15countries.12However,measuringagain
bytheratioofFDIsharetorealpopulationshare,thenon-eurocountries,whether
insideoroutsidetheEU,areallover-performers.SwitzerlandisfollowedbySweden,
thenbyNorway,theUKandDenmark.
Sincebotheuroandnon-eurocountriesaretobefoundwithrisingandfallingshares
ofinwardFDI,thisevidenceofferslittlesupporttotheBritaininEuropeargumentthat
decliningtojointheeuroadverselyaffectedFDIintheUK.Ifanything,itsuggests
thattheeurohasnotbeenadecisivedeterminantoftheinwardflowsofFDItothese
15Europeancountriesoverthe13post-euroyears.
SharesofFDIstockinEuropepre-andpost-euro:winnersandlosersWhenmeasuring FDI inflows over time, even themeans of inflows over several
years,onehastobepreparedforsudden,sharpfluctuations,whichpromptoneto
becautiouswhendrawingconclusionsfromthedata.Onemay,however,getsome
reassurance fromtheevidenceof the inwardFDIstockheld,and from itsgrowth
overtime.SinceitrecordstheinwardFDIaccumulatedovertime,itisnecessarily
alesserraticfigurethanFDIinflows,andmightthereforebeexpectedtoprovidea
morereliablemeasureoftheattractivenessofcountriestoforeigninvestors.

The impact of the EU on foreign direct investment in the UK from 1970 to 2011 • 115
www.civitas.org.uk
In Table 8, the shares of inward FDI stock held by the same 15 countries are
comparedoverthe13yearsbeforethelaunchoftheeurowiththe13yearsafterit.
Despiteexpectations,itdoesnotrevealmanystartlingdiscrepancieswiththemean
inwardFDIflowsgiveninTable7.
IfwefirstconsiderthepercentagesharesofthetotalvalueoftheFDIstockheldin
eachcountry(columns1and2),wemayseethattheteneurozonecountrieshave
againincreasedtheirshare,thistimefrom59.3percentto61.6percent,overthe
thirteenpost-euroyears,againof2.3percent,whichismorethandoublethe0.9
percentincreaseintheirshareofthetotalvalueofannualflows.
Thisisanother,muchmoresignificant,pointfortheeurocause,thoughagainone
must add that, since theeurozone is 77.5per cent of the total populationof the
15 countries, andhasonly 61.6 per cent of the total FDI stock, it canhardly be
consideredaconvincingdemonstrationofthebenefitsofthesinglecurrency.Itmight
makeacasefortheeuro,ifweassumethebenefitforforeigninvestorsofhaving
Table 8Shares of inward FDI stock held in 15 European countries, 1986–2011, eurozone compared with non-euro countries
Meanpercentshareoftotalvalue 3.
Percentsharepopulationofthe15in
1999
4.Over-andunder-
performers:ratiovaluecol2/populationcol3
1.Pre-euro1986–1998
2.Post-euro1999–2011
Austria 1.8 2.4 2.2 1.1
Finland 1.9 1.3 1.4 0.9
France 17.9 14.5 15.6 0.9
Germany 7.0 14.1 21.8 0.6
Greece 1.0 0.5 2.9 0.2
Ireland 1.9 2.8 1.0 2.8
Italy 4.2 5.3 15.2 0.3
Netherlands 11.2 9.6 4.2 2.3
Portugal 1.9 1.3 2.7 0.7
Spain 10.6 9.7 10.6 0.9
Eurozone total 59.3 61.6 77.5 0.8
Denmark 2.4 2.2 2.4 0.9
Sweden 6.4 5.4 1.4 3.9
UK 26.6 24.6 15.6 1.6
Norway 1.9 1.9 1.2 1.6
Switzerland 3.4 4.3 1.9 2.3
Non-euro total 40.7 38.4 22.5 1.7
Source:UNCTADstatInwardandoutwardforeigndirectinvestmentstock,annual,1980–2011InUS$atcurrentpricesandcurrentexchangeratespercapita

www.civitas.org.uk
116 • Where’s The Insider Advantage?
acommoncurrencyaccumulatesovertime,andthattheeurozonehastemporarily
beenmoreaffectedby theeurocrisis than thenon-eurocountries,bothofwhich
arenotunreasonableassumptions.Wemightthentakethis2.3percentgainasan
indicationofpromisingfutureprospects.
Withintheeurozone,thebigwinner,byFDIstockvalue,wasonceagainGermany,
morethandoublingitsshareofthe15countries’FDIstocksincethelaunchofthe
newcurrency.Ireland,ItalyandAustriaagainfollowedwithmoremodestgains.The
sharesoftheothersixeurozonecountrieshaveallfallen,withFranceonceagain
standingoutasthebig loser,withafallof3.4percent,coincidentallyexactlythe
sameasitsfallinitsshareofinflows.ItisagainfollowedbytheNetherlands,witha
fallof1.6percent.
Of thenon-eurocountries, it is the two independentcountries thathavecomeoff
best in termsof the shareof total post-euro valueofFDI stock, though this isn’t
sayingmuch.Norway’sshareremainedthesame,whileSwitzerlandincreasedits
shareby0.9percent.However, theshareof the threenon-eurocountries in the
EUdeclined,theUK’smostofall,bytwopercent,doubletheonepercentfallinits
shareofFDIinflows.
Overall, itmaybeseenthatonlythreeof theteneurocountriesemergeasover-
performers,whilefourofthefivenon-eurocountriesdoso.
Themain finding to take from these comparisonsmust be that there have been
winners and losers, both inside and outside the euro. Six of the ten eurozone
countrieshaveseentheirshareofthetotalvalueofFDIinflowstothese15countries
falloverthirteenpost-euroyears,mostnotablyFrance,whilefourhaveseentheir
sharegrow,mostnotablyGermany.Andthesamesixhaveseentheirshareofthe
totalstockfall,Franceagainbeingthebiggestloser,andGermanyagainthebiggest
winner.
Ofthefivenon-eurozonecountries,thethreeEUmembershaveallseentheirshare
ofthetotalinflows,andofthetotalstock,fall,whilethetwonon-EUmembershave
faredbest,bothincreasingtheirsharesofthetotalinflows,Norwayholdingitsshare
ofthetotalstock,whilethatofSwitzerlandhasincreased.
Onceagain, it seems reasonable toconclude that theadoptionof theeurodoes
notappeartohavebeenadecisivedeterminantoftheFDI.Theunder-performance
of theeurozone countries relative to their non-euro neighbours hasnot changed
significantly.Indeed,twoeurozonecountries,FinlandandFrance,whowereover-

The impact of the EU on foreign direct investment in the UK from 1970 to 2011 • 117
www.civitas.org.uk
performerspriortothenewcurrency,havebecomeunder-performersinthethirteen
years since. The non-euro countries havemeanwhilemaintained their appeal to
foreign investors. They were all over-performers before the euro, and with the
marginalexceptionofDenmarkhaveremainedso.
GrowthofFDIinflowstoEuropepre-andpost-euroHuhneandCanning’sevidencewasnot,however,confinedtorelativesharesofFDI.
Theyhadstillmorestartlingcontrasts tocheer theirmultinationalsponsorsabout
theoverallgrowthofFDIintheeurozone,andaboutdeclineoutsideit.Theymeant
growthofinflows,sowearebackindangerousterritory.
Theyreferredto‘officialEuropeanCommissionfigures’,unfortunatelywithoutfurther
identifyingtheirsource,whichtheysaid,showed‘adramatic384percentincrease
inthevalueofforeigninvestmentintheeurozoneinthefirsttwoyearsoftheeuro’,
while‘overthesameperiodtheincreaseinFDIintoBritain,SwedenandDenmark
−non-euroareacountries−wasaneighthasmuch’.Theyillustratedthesefigures
withagraph,sourcedonlyto‘EuropeanCommission’,tracingtotalamountsofFDI
goingtotheeuroareaandthenon-euroarearunningroughlyalongsideoneanother
from1996to1999andpartingatasomethinglikearightanglefrom1999to2000.
Graphsareseldomsoemphatic.
Thus far, I have failed to find the384per cent or, for thatmatter, the ‘European
Commission’ graph, a press release I assume, but the direction of the changes
theyreportforthetwopost-euroyearsisconfirmedbytheUNCTADdata.In1999,
the FDI inflow to 11 eurozone countrieswas $316.7bn and in the following year
$498.2bn,asubstantialincreaseof57percent.Overthesametwoyearstheinflow
tothenon-eurothree−Denmark,SwedenandtheUK−alsorose,butonlyfrom
$165.9bnto$175.0bn,anincreaseofjustsixpercent,whichmightbethe‘eighth
asmuch’theyreferredto,andmightevenbeanunderstatement,57percentversus
sixpercent.However,althoughtheevidenceisintherightdirection,itisonceagain
so incomplete that it conveys awhollymisleading impression.When the data is
presentedalongsideothercountries,andoveranextendedtimeperiod,asit isin
Figure5,theeuro’s‘dramatic’successvanishes.
Thegraphdoes indeed show thepost-euroascent of the11eurozone countries
whichsoimpressedHuhneandCanning,andthatFDIflowstothemclimbedrather
morerapidlyimmediatelyafterthelaunchoftheeurothanthosetoanyofthenon-
eurocountries, though thegraphcannotconvey thisclearly.However,since they
beganfromamuchlowerstartingpointthanthenon-eurocountries,andhadbeen
growing at a lower rate over the preceding thirteen years, it hardly rates as the

www.civitas.org.uk
118 • Where’s The Insider Advantage?
astonishingachievementthatHuhneandCanningproclaimed.Moreover,thepost-
eurobounceofthethreenon-EUcountriesof43percent,from$18.6bin1999to
$26.5bin2000,wasnotthatfarshortoftheeurozone’s57percentincrease.Even
theUK,measuredonitsown,enjoyedsomethingofapost-eurobounceof35per
centfrom1999to2000,or37percent,accordingtotheOECD.
After2001,theinwardFDIflowstoallcountriesdeclined,euroandnon-euroalike,
withtheeuroofferingnospecialprotectionor,itseems,havinganyaddedappeal
toforeigninvestors.Asonecansee,overmostofthethirteenpost-euroyears,FDI
inflowstotheeurocountrieshavegenerallybeenlowerthanthosetothenon-euro
countries.Theeurozone11didnotagainapproachthesurgeof2000,whentheyhit
$1,635percapita,until2007whentheyreached$1,801percapita(and$571bnin
totalvalue),butthisrecoveryisrathermodestwhencomparedtothesurgesinall
thenon-eurocountries,bothwithinandoutsidetheEU.
Inthewakeofthefinancialcrisisstartingin2008,alltheEUcountries,botheuroand
non-eurocountries,slumped.Thethreeindependentcountriesdidnot,at leasttill
2011,whentheyexperiencedastillmoreprecipitousdeclinethantheEUcountries.
Figure 5Inward flows of FDI before & after the euro in the eurozone compared with six non-euro countries weighted means in
US$(1986) per capita
Thethreenon-euroEUcountriesareDenmark,SwedenandtheUK.Thethreenon-euronon-EUcountriesareIceland,NorwayandSwitzerland.TheEurozone11areAustria,Belgium,Finland,France,Germany,Greece,Ireland,Italy,Netherlands,SpainandPortugal.Source:UNCTADstatInwardandoutwardforeigndirectinvestmentflows,annual,1970–2011.
−500
0
500
1,000
1,500
2,000
2,500
3,000
3,500
4,000
4,500
5,000
20102005 200019951990
Euro launch
Eurozone 113 non-Euro, non-EU countries3 non-Euro, EU countries
Mea
n FD
I inf
low
per
cap
ita, U
S$(
1986
)
The impact of the EU on foreign direct investment in the UK from 1970 to 2011 • 119
www.civitas.org.uk
AccordingtoUNCTAD,theirdeclineseemstobelargelyduetoSwitzerland,where
theinflowsturnednegative, leadingonetosuspectthatboththerisein2009and
2010,andthesuddenfall in2011hadmoretodowithSPEs,andthestrengthof
theSwissfranc,thanwithauthenticFDI.Thisisoneoccasionwhentherearelarge
differenceswithOECD’srecordoftheyears2010–2011,whichshowmuchlessofa
decline,butsincenothingmuchhingesonthedifferencewewillletitpass.13
Overall,thisevidencedoesnotsupporttheviewthattheeurohashelpedthegrowth
of inward FDI flows in itsmember countries, nor does it suggest that they have
beenparticularly attractive to foreign investorswhencomparedwith independent
Europeancountrieswiththeirowncurrencies.However,westillhavetoexaminethe
growthofinwardFDIstock,which,asnotedearlier,wouldappeartoprovideamore
reliableindicationofasignificantshiftintheappealofacountrytoforeigninvestors.
GrowthofFDIstockinEuropepre-andpost-euroInthegraphbelow,therealgrowthoftheinwardFDIstockoftheEUandtheUKover
theyears1999–2011isportrayedalongsidethatofsixotherEuropeancountriesthat
arenotmembersoftheeuro(Switzerland,Norway,Iceland,Sweden,Denmarkand
Figure 6Growth of FDI stock in Europe since the launch of the euro,
1999–2011 weighted means in US$(1986) per capita with 2011 per capita stock in US$ [2011]
TheEurozone11areAustria,Belgium,Finland,France,Germany,Greece,Ireland,Italy,Netherlands,SpainandPortugalThesixnon-eurocountriesareIceland,Norway,Switzerland,Denmark,SwedenandtheUK.Thethreenon-euronon-EUcountriesare,Iceland,NorwayandSwitzerland.Source:UNCTADhttp://unctadstat.unctad.orgInwardFDIstock,annual1980–2011
3 non-Euro, non-EU countriesUK6 non-Euro countriesEurozone 11
−50
0
50
100
150
200
250
300
350
400
450
201020052000
$30,277
$14,901
$19,135
$59,194
Mea
n FD
I sto
ck p
er c
apita
, US
$(20
11)

www.civitas.org.uk
120 • Where’s The Insider Advantage?
theUK),withthethreeofthesethataremembersneitheroftheeuronoroftheEU
alsogivenseparately.
Bysomemargin,thesethreeindependentEuropeancountrieshavebeenthemost
successfulgroupof the three,withgrowth in real termsof inwardFDIstockover
these13yearsofnearly400percent.Seenasawhole,thesixnon-eurocountries,
includingthethreenon-EUmembers,appeartohavebeenthereasonablysuccessful,
withrealgrowthofnearly200percentoverthese13years.However,theirmean
growthhasobviouslybeenliftedbytheinclusionofthethreeindependentEuropean
countries.Wewillseparatethemoutinamoment.
Bycomparisonwiththesetwogroupsofcountries,theUK,onitsownhasperformed
ratherpoorly,withgrowthofonly117percent,thoughtheeurozone11havedoneno
Table 9Growth of inward FDI stock per capita in Europe before and after launch of the euro in 1999 measured in constant US$(1986) and
listed in order of growth over the post-euro years1.
Pre-europercentgrowth1986–1998
2.Post-europercentgrowth1999–2011
3.FDIper
capita1986inUS$(1986)
4.FDIper
capita2011inUS$(1986)
5.FDIper
capita2011inUS$(2011)
Eurozone
Austria 201 346 659 8610 17686
Belgium 330 272 2780 43362 89067
Spain 512 222 348 13659 13659
Finland 528 222 341 15407 15407
Portugal 351 189 437 4966 10200
Germany 166 125 634 4229 8687
Netherlands 206 115 2294 17208 35347
Italy 186 112 450 2264 5472
Ireland 9 105 10342 26192 53799
Greece −11 23 910 1173 2409
France 549 11 780 7204 14799
Weighted mean 352 110 861 7162 14901
Non-euro countries
Iceland 240 1735 327 20693 42505
Switzerland 137 427 2853 36709 75401
Norway 90 292 2032 16956 34828
Sweden 439 221 718 17455 35854
Denmark 404 127 898 13353 27428
UK 187 117 1342 9315 19135
Weighted mean 207 198 1404 13205 30277
Source:UNCTADhttp://unctadstat.unctad.orgInwardFDIstock,annual1980–2011

The impact of the EU on foreign direct investment in the UK from 1970 to 2011 • 121
www.civitas.org.uk
better,withameanpost-eurogrowthof110percent.However,themeanratehides
considerablevariationswithineachgroup,asmaybeseenfromTable9.
Atfirstglance,theUKentryonthistablemightseemtoaddsomesupporttothe
BritaininEuropeargument,sinceitshowsUKpre-eurogrowthofFDIstockof187
percentwhilepost-eurohasbeenonly117percent.AddthistothedeclineintheUK
shareofFDIflowsandstocks,andonemightjustaboutstringtogetheranarrative
oftheUK’spost-eurodecline,payingthepricefornotjoiningtheeuroetc.−aslong
asnoothercountries,eithereuroornon-euro,areincludedinit.
Oncetheyareincluded,itfallsapart,sincethereareplentyofothercountrieswith
declining post-euro growth.Theweightedmeans of theEurozone11 shows that
theirgrowthoverthethirteenpost-euroyearshasbeenlessthanathirdofthatinthe
pre-euroyears.Onlythreeeurocountries−Austria,IrelandandGreece−haveseen
anincreasedgrowthininwardFDIstocksincetheintroductionoftheeuro.Forsix
oftheothereight,thedeclineinpost-eurogrowthwasgreaterthanthatoftheUK,
mostespeciallyFrance,with549percentpre-euroFDIgrowthtoamere11percent
post-euro,thoughthisispartlytheluckofthedraworthevagariesofthestartand
enddates.Frenchstocksurgedtoapeakin1998and1999andthenfellaway,and
asaresulthadhighgrowthpre-euro,andverylowgrowthpost-euro.14Inthelight
ofallthesefigures,thenarrativethatFDIintheUKdeclinedbecauseitdidnotjoin
theeuroseemsalittlethreadbare.Despitetheluckofthedraw,aFrenchversion,
mutatis mutandis,wouldbemuchmoreconvincing.
Thenon-eurocountriesaremoreevenlysplit.InthethreeEUmembersthatelected
tokeeptheirowncurrencies,growthalsodeclined,whileinthethreeindependent
countriestherewasratherspectacularpost-eurogrowth,andtheoverallgrowthpre-
andpost-euroofallsixtogetherisalmostthesame,207percentversus198percent.
However, it isperhapsthebottomlinesofeachsectionofthetable,theweighted
meansofthetwogroups,thatprovidethestartling,evendevastating,contrast.The
amounts inUS$(1986),bothat thestartandendof theperiod incolumns4&5,
showthatthesixnon-eurocountrieshavebeennearlytwiceasattractivetoforeign
investorsasthese11eurocountriesoverthelifeoftheeuro.15Theactualamounts
ofFDIstockheldin2011confirmthisconclusion:foreigninvestorsinvested$14,901
ineveryinhabitantoftheeurozoneversus$30,277ineveryinhabitantofthesixnon-
eurocountries.
TheUK’sperformancemayhavebeenlacklustrebut,sincemanyeurozonecountries
werenobetter,itwouldbedifficulttoarguethatitsufferedbydecliningtojointhem
intheeuro,whileotherswhodidnotjointheeuroortheEUdidverymuchbetter.

www.civitas.org.uk
122 • Where’s The Insider Advantage?
HowtotellthetruthandmisleadthereaderWewillconcludethisdiscussionoftheeurobyshowinghowtheBritaininEurope
argumentscontainedelementsoftruthbut,sincetheirevidenceonlycoveredashort
periodoftime,reliedratherrecklesslyonvolatileFDIflowdata,andomittedrelevant
comparativeevidence,itendedbyconveyingawhollymisleadingimpression.16
On the UK’s declining share of FDI post-euro
There wasadeclineintheUKshareofFDIinflowstotheEU.Bycomparingjustone
yearwithanother,HuhneandCanningcouldreportfallsintheUKshareofFDIflows
inEuropeof9,11,6,11and11percentagepoints(Table6).If,bycontrast,theUK
shareiscomparedovernineyearsbeforeandaftertheeurolaunch,itmaybeseen
tohaveremainedunchanged(Table6),whileifcomparisonsareoverthirteenyears
beforeandafter,itmaybeseentohavefallenbythreepercent(Table6)orbyone
percent(Table7).Meanwhile,theUKshareofEuropeanFDIstockmaybeseento
havefallenbytwopercent,(Table8).Allofthesefallswere,inshort,farsmallerthan
BritaininEuropeclaimed.
On the UK’s declining FDI inflow post-euro
There wasafallinthevalueoftheflowofinwardFDItotheUKafterthelaunchof
theeuro,thoughtheydidnotmentionthatitwasprecededbyabrief,modestjump
immediatelyafterthelaunch,andthatthesubsequentdeclinewasaccompaniedby
asimilardeclineineveryEuropeancountry,whetherintheeuroornot(Figure5).
TheargumentofBritaininEuropewasalsofurtherflawedbyitsrepeatedreliance
on post hoc ergo propter hocarguments,theassumptionthateveryvariationinFDI
flowsthatfollowedtheeuromusthavebeenduetotheeuro.Bythisreasoning,the
datashowsthatFrancewasitsmainvictimandill-advisedtojoinit.However,the
maindefectintheirargumentwasthelackofadequatehistoricalandcross-societal
comparativeevidence,muchifnotallofwhichindicatesthatmostofthechangesin
FDIflowsandstocksthatfollowedtheeurowereunlikelytohavebeenduetothe
newcurrency.
The impact of the EU on foreign direct investment in the UK from 1970 to 2011 • 123
www.civitas.org.uk
3.HastheSingleMarketattractedFDItotheUK?Thefinalstepofthisinvestigationistodiscoverwhethertwodecadesofmembership
of theSingleMarket has had a beneficial impact onFDI in theUKand in other
membercountries.Almosteveryone, it seemssafe tosay, thinks that ithas. It is
amatter of common sense, or self-evident inSir JohnMajor’s view, that foreign
investors must have been keen to take advantage of ‘the world’s largest single
market’. Even confirmed eurosceptics have been convinced, and therefore often
makeanexceptionofthebenefitsoftheSingleMarketintheircriticismsoftheEU.
Likeeveryoneelse,theythereforefeelthatnoevidenceisrequiredtodemonstrate
suchanobvious,universally-agreedpoint,butwewillexaminetheevidenceanyway,
howeverunnecessaryitmayseem.
Arevivedpro-EUbusinesslobbygivesadifferentwarningAfter thecollapseof theeurocampaign,Business inEuropewenton forawhile
tocampaign for thenewEUconstitution,but losing furtherheart,when thatwas
rejectedbyFrenchandDutchvoters in2005, it folded.1However, inthefollowing
year,oneofitsboardmembers,RolandRudd,aPRconsultant,launchedBusiness
forNewEurope,whichhasresumedthefightonbehalfofmanyBritishandforeign
multinationalsforcontinuedUKmembershipoftheEU.
Thegroundsfordoingsoareratherdifferentfromthoseofitspredecessor,indeed
almosttheexactopposite.Thenecessityforastableexchangerateandwarnings
aboutthe‘meltdown’ofinwardFDI havebeenforgotten,anditnowarguesthatthe
UK’shighrateofinwardFDI,likeitslargevolumeoftradewiththeEU,aretheresult
ofEUmembership,andthatcontinuedEUmembershipistherefore‘indispensable’
totheUK.Hence,theargumentofitspredecessorhasbeenturnedupsidedown,
and instead of examining the decline and imminentmeltdown of FDI in theUK,
becauseof thedecisiontostayoutof theeuro,wewillnowhavetoexaminethe
remarkablesuccessofFDIintheUK,andtrytodeterminewhetherthishasbeen
duetomembershipoftheEU.Hasthebusinesslobby,onewonders,gotitrightthis
timearound?
To support their argument, they commissioned a body of research from Oxford
Economics. This documents the substantial trade, investments, emigration and
touristflowsbetweentheUKandtherestofEU,allofwhichtheyarguehavebeento
thebenefittotheUK.Itseemstobeanexemplarypieceofresearch.Unfortunately
itisallbesidethepoint,oratleastbesideBusinessforNewEurope’spoint.
WhathastobedemonstratedtomakethecaseforEUmembershipisnotthatthere

www.civitas.org.uk
124 • Where’s The Insider Advantage?
isahighvolumeoftradewithothermembersoftheEU.Therecannotnowbeany
doubtwhateverthatallcountries,everywhereontheplanet,tradedisproportionately
with their close neighbours.2 The evidence assembled by Oxford Economics
thereforeonlyconfirmsthattheUKfollowsthegeneralruleand,likeeverycountryin
theworld,tradesalotwithitsnearneighbours.Itdoesnotaddress,norevenbegin
toaddress,thequestionofwhetherUKtradewiththerestoftheEUishighbecause
ofmembershipoftheEU,orhigherthanitwouldbeweretheUKnotamember,and
thereforethatmembershipoftheEUis,asthetitleoftheBusinessforNewEurope
pamphletputsit,‘indispensable’.
Letusbrieflyconsideroneofthefirstitemsofevidencethatanyonewhoclaimsthat
theEUhasbenefitedUKtrademustconsiderandexplain.In1973,theyeartheUK
enteredtheEEC,63.9percentofUKexportstothe22OECDcountriesforwhich
dataisavailablewentto14countriesthatwere,orwerelatertobecome,members
ofwhatisnowtheEU.In2012,theproportiongoingtothosesame14countrieswas
61.9percent.3
Inotherwords,theUKhadaclosetradingrelationshipwithEUcountriesbeforeit
joinedtheEEC,and40yearslater,itstillhasaclosetradingrelationshipofalmost
exactlythesamerelativeproportions,thoughtobepreciseithasdeclinedbytwoper
cent.Meanwhile,theproportionofexportstothese22OECDcountriesgoingtothe
threeindependentEuropeancountries,withwhichtheUKhasnopoliticallinks,no
treatyobligations,andthatentailnodirectcosts,hasrisenfairlysteadilyfromseven
percentto10.7percentin2012.
How,wemayask,couldEUmembershipreasonablybesaidtohavecontributedin
anysignificantwaytothepresentlargevolumeofUKexportstradewithEUcountries
iftheproportionisvirtuallythesameasitwasinthefirstyearofEECmembership?
What,onemayreasonablyask,are thebenefitsofEUmembership forUK trade
ifour tradewithEuropeannon-membercountries increasedata faster rate?The
researchassembledbyOxfordEconomicsdoesnothelpusatalltoanswerthese
questions.Itmerelyconfirmsthatwetradealotwithournearneighbours.Thanks.
Similarquestionsmightbeaskedabout tourismtoand investment in theEU,but
wewillputthemasidesincethemaininteresthereistheBusinessforNewEurope
argumentaboutFDI.Thisisbasedontherepeatedclaimthat‘accesstotheSingle
Market is one of themain reasonswhy companies decide to invest in theUK.’4
TheyalsomentionanumberofotherfactorsthatmaketheUKanattractivelocation
forforeigninvestors,suchas‘accesstocapitalmarkets,agoodpoolofresources
The impact of the EU on foreign direct investment in the UK from 1970 to 2011 • 125
www.civitas.org.uk
(labourskills, ICT,astrongR&Dbase)anda lowlevelofregulation’,butnoneof
thesethingsoweanythingtoEUmembership.However,ratherthanfacethetough
intellectualquestion(whichOxfordEconomicswould,oneimagines,haverelished)
andmeasure their importance relative to that of EUmembership and theSingle
Market,theyputthemallononesideandconcentrateonmembershipandaccess
totheSingleMarketalone.
Bywayofexplanation,theyclaimthatthe‘UKattractssuchahighamountofFDI
frombothEUandnon-EUcountriesbecause internationalcompanieschoosethe
UKasthegatewayfortheirEuropeanoperations.26percentofnon-EUcompanies
havetheirEuropeanHeadquartersintheUK.’5Thisidea,thattheUKhasbeenthe
‘gateway’toinvestmentinEurope,ishoweveranancillary,supportivepartoftheir
argument,soitwillbeexaminedlater,aftertryingtoidentifythebenefitsoftheSingle
MarketforFDIintheUK.
SincetheeuroandtheSingleMarkethavebeenconcurrentdevelopmentsof the
Europeanproject,andtheeuroisseen,inthewordsoftheEuropeanCommission,
as‘alogicalcomplementtotheSingleMarket’wewillofcoursebecoveringmuch
ofthesamegroundasintheprecedingdiscussionoftheeurothoughoveraslightly
different timeperiod,andwithslightlydifferentparticipatingcountries.However, it
is illuminating to conduct a separate analysis of the impact of theSingleMarket
despite thedegreeof repetition thisentails.Themainaimof thisexaminationof
evidenceaboutFDIistoinformdebateabouttheEU,andthatdebatenowfocuses
ontheSingleMarket,whiletheideathattheUKshouldjointheeurohaspassedinto
history.6
GrowthofFDIflowsandstockundertheSingleMarketWemaybeginbyexaminingthegrowthofinwardflowsofFDIto11ofthefounder
membersoftheSingleMarketwhenitbeganin1993.Thetwelfth,Luxembourg,has
beenomittedasusualforthelackofdatauntil2002.Sincetheywerelatecomers,
thethree1995entrants−Austria,FinlandandSweden−havealsobeenomitted.If
theSingleMarketwereamagnetforFDI,the11foundermembersshouldbeable
todemonstrateitsappeal.WewillthereforestillbedealingwithanEU11,butwith
DenmarkandtheUKinplaceofAustriaandFinland.
ThegraphbelowpresentstheweightedmeansoftheinwardflowofFDIpercapita
overthe22yearsfrom1990to2011,inthousandsofcurrentvalueUS$,tothese
eleven foundermembers,and toeight independent countries:Australia,Canada,
Israel,SingaporeandNewZealandplusthethreeindependentEuropeancountries,

www.civitas.org.uk
126 • Where’s The Insider Advantage?
whichare,asbefore,alsoshownseparately.Thegraphstarts threeyearsbefore
theSingleMarketbegan.AnumberofthemeasurestoimplementtheSingleMarket
wereinfactimplementedinearlieryears,butthemainreasonforstartingearlieris
toseeiftherewasabounceintheFDIoftheEU11priortoitslaunch,asinvestors
savouredtheprospectofavastnewsinglemarketof350million.
Aswehavenowcometoexpect,overmostoftheyears1990–2011,16ofthe22
tobeprecise,thethreeindependentEuropeancountrieshavereceivedthehighest
inflowsofFDIpercapita.TheEU11intheSingleMarketreceivedthelargestinflows
percapitainfourofthese22years,1992,2001–2,2005,allbytinymarginswhich
arebarelyvisibleonthegraph.Thefirstofthese,1992,wasascloseasitsmembers
cametoenjoyingapre-launchbounce,meaningthepercapitaflowinthatyearwas
$12percapitaabovethatofthemeanfortheeightindependentcountries.
Over the19yearsof theSingleMarket,1993–2011, the totalvalueofFDI in the
EU11was$267bn,versus$221bn intheeight independentcountries,$112bnof
whichwent to the three independentEuropean countries.However, per capita it
Figure 7Per capita inward flows of FDI to 11 EU countries compared with
independent countries, 1990–2011, in current value US$ with totals invested 1993–2011
ThethreeindependentEuropeancountriesareNorway,IcelandandSwitzerland.TheEU11areBelgium,Denmark,France,Germany,Greece,Ireland,Italy,Netherlands,Spain,PortugalandtheUK.TheeightindependentcountriesareAustralia,Canada,Israel,Singapore,NewZealand,Norway,IcelandandSwitzerland.Source:UNCTADUNCTADstathttp://unctadstat.unctad.orgInwardFDIflows,annual1970–2011
8 independent countriesEU 113 independent European countries
−500
0
500
1,000
1,500
2,000
2,500
3,000
3,500
4,000
4,500
5,000
20102005200019951990
$267bn
$221bn
$112bn
Single Market inaugurated
FDI i
nflo
ws
per c
apita
, cur
rent
US
$

The impact of the EU on foreign direct investment in the UK from 1970 to 2011 • 127
www.civitas.org.uk
wasfarlowerthanboth.TheelevenfoundermembersoftheSingleMarketreceived
$15,507perinhabitant,theeightindependentcountriesreceived$22,305,whilethe
threeindependentcountriesontheirownreceived$27,999perinhabitant.
However,sincewehavelearnedtobewaryofFDIinwardflows,wewillalsocompare
thegrowthintheweightedmeansoftheFDIstockofeachgroupoverthesame22
years,alongsidetheUKonitsown.TheresultisshowninFigure8below,together
withweightedmeans,oftheactualamountsofpercapitaFDIstockheldbyeach
groupof countries in theyear theSingleMarketbegan,1993,and in2011.This
graphisplottedincurrentvaluedollars,andthereforeexaggeratestherealrateof
growthsomewhat.
BysubtractingtheFDIstockatthestartoftheSingleMarketfromthe2011stock,
the totals of which are both given in the graph, we can see the increase in the
valueofforeigninvestmentstock,whichincludesretainedandre-investedearnings
aswell asnew inflows,over the19yearsof theSingleMarket ineachgroupof
countriesaswellastheUK.Foreigninvestmentsincreased,incurrentvalueUS$,by
Figure 8Per capita growth of FDI stock over the life of the single market, 1993–2011, in current value US$, with weighted means of stock
held per capita in 1993 and 2011
ThethreeindependentEuropeancountriesareNorway,IcelandandSwitzerland.TheeightindependentcountriesareAustralia,Canada,Israel,Singapore,NewZealand,Norway,IcelandandSwitzerland.TheEU11areBelgium,Denmark,France,Germany,Greece,Ireland,Italy,Netherlands,Spain,PortugalandtheUK.Source:UNCTADhttp://unctadstat.unctad.orgInwardFDIstock,annual1980–2011
FDI s
tock
per
cap
ita, c
urre
nt U
S$
8 independent countries3 independent European countries
EU 11UK
0
10,000
20,000
30,000
40,000
50,000
60,000
70,000
2010 2005 200019951990
Single Market inaugurated
4,564
3,0964,431
2,340
199361,886
19,13529,363
15,721
2011

www.civitas.org.uk
128 • Where’s The Insider Advantage?
$13,381foreveryinhabitantintheEU11countries,$24,932foreveryinhabitantof
theeightindependentcountries,and$57,323foreveryinhabitantofthethreenon-
EUEuropeancountries.
ThevalueofforeigninvestmentsforeveryinhabitantoftheUKincreasedby$16,039,
andthereforeabovethemeanoftheEU11,butbelowthatofalleightindependent
countries,andofcoursefarbelowthatofthethreeEuropeanindependentcountries.7
Yetagain,thethreeEuropeancountriesthatarenotmembersoftheEUprovedtobe
themostattractivetoforeigninvestors,andtheirFDIstockhasthereforeincreased
atthefastestrateoverthelifeoftheSingleMarket.Asaresult,thedisparitybetween
theirFDIstockandthatoftheelevenmembersoftheSingleMarkethasincreased
considerably. In 1993, the stock of the three independents of $4,564was about
twice thatof the11EUcountriesbut,after19yearsof theSingleMarket, it has
becomenearlyfourtimeslarger,$61,886vs$15,721.Astheyearshaverolledby,
andtheSingleMarkethas‘widened’and‘deepened’,andevenbeen‘re-launched’,
ithasevidentlyprovedincreasinglylessattractivetoforeigninvestors,relativetothe
remaining three independentEuropeancountries.Thecommon-senseconsensus
about theFDIbenefitsof theSingleMarket,alongwithSirJohnMajor’s intuition,
takesasevereknock.
TheEU11have,however,heldtheirownrelativetotheeightindependentcountries
asawhole.In1993thepercapitaFDIstockoftheseeightcountrieswasjustunder
double thatof theEU11,and in2011, itwasstill justunderdouble.Since these
eightindependentcountriesincludethethreeEuropeanindependentcountriesthat
weknow tobehighflyers,someof theeighthaveevidentlyperformedpoorlyby
comparisonwiththeEU11mean.Wewillidentifytheminamoment.
Theonlygapthathasdeclinedoverthe19yearsoftheSingleMarketisthatbetween
theUKandtheotherEUmembers.Ortoputittheotherwayaround,theUKhas
fallentowardstheEUmean.In1993,theUKstockpercapitawas32percentabove
theEUmean,butby2011,itwasonly22percenthigher.8
Weightedmeanshidedifferencesbetweencountriesofeachgroup,so it isworth
settingoutthegrowthofpercapitaFDIstockforeverycountrysincethelaunchof
theSingleMarketin1993.InTable10countriesarerankedinorderofthegrowthof
theirFDIstockoverthelifeoftheSingleMarket,whichisgivenhereinrealterms,
that is, inUS$(1993).Among other things, this table enables us to see how the
threeindependentEuropeancountrieshaveliftedthemeanoftheeightindependent
countries.IsraelandSingapore,amongtheotherfive,haveperformedratherwell

The impact of the EU on foreign direct investment in the UK from 1970 to 2011 • 129
www.civitas.org.uk
over the period, Israel from a low starting position and Singapore from the very
highest,buttheotherthree,Canada,AustraliaandNewZealandhaveallperformed
comparativelypoorly.
AmomentagowenoticedamodestdegreeofconvergencewithintheEUSingle
Market: theUKstockhadfallentowardstheEUmean.Thedata inTable10also
allowus to see the differenceswithin theEU11, and to considerwhether, as is
sometimesthought,membercountrieshavegrownmorealikeundertheimpactof
theSingleMarket.TheECoftenclaimsthatitspolicies,regulationsandsubsidies,
togetherwith itscohesionandotherfunds,promote‘a levelplayingfield’and‘fair
competition’amongstitsmembers.OnfiveseparateoccasionsintheLisbonTreaty,
the European Commission is charged with ’the organisation of the exchange of
bestpractice’amongstmembercountries.Haveforeigninvestors,onemaywonder,
Table 10Growth of per capita FDI stock over the life of the EU’s Single Market 1993–2011 in 11
EU and 8 independent countriesPercentgrowth1993–2011inUS$(1993)
Percapitavalueofcurrentstockin
US$(2011)
Iceland 5,225 42,504
Switzerland 766 75,401
Norway 608 34,828
Denmark 525 27,428
Belgium 508 *89,067
Israel 468 8,829
Singapore 407 99,968
Netherlands 364 35,347
EU 11 mean 331 15,721
Spain 328 13,659
France 315 14,799
Portugal 300 10,200
UK 297 19,135
Germany 289 8,687
Italy 271 5,472
Canada 199 17,322
Ireland 194 53,799
Australia 187 22,103
NewZealand 147 16,744
Greece 81 2,409
*Theusualcaveatsapply.Source:UNCTADhttp://unctadstat.unctad.orgInwardFDIstock,annual1980–2011
www.civitas.org.uk
130 • Where’s The Insider Advantage?
sensedanygreaterharmonyorconvergenceamongstmembersof theEU?And
havetheyrespondedbytreatingthemasequal,oratanyrateincreasinglysimilar,
partsof‘theworld’slargestsinglemarket’?
Asa rough, initialmeasureofconvergence in theappealofmembercountries to
foreigninvestors,onemaycomparethecoefficientsofvariationinthedistributionof
FDIstockpercapita,measured,of11foundermembersoftheSingleMarketin1993
and2011,asusualexcludingLuxembourg. In1993, themeanholdingpercapita
was$3,742,thestandarddeviation$3,432,givingacoefficientofvariationof92per
cent.Overthesubsequent19years,itfluctuated,indicatingbothconvergenceand
divergence,butby2011hadrisento97percent,indicatingaslightdivergence.9
Onemightperhapshavehigher,andmore realistic,expectationsofconvergence
amongstthosemembersoftheSingleMarketthathadintegratedtheireconomies
still further by adopting the euro. The European Commission’s 1990 publication
promoting the currency certainly anticipated that it would promote convergence
amongstitsmembers,andforecastthatitwouldgive‘theleastfavouredregimes…
arealopportunityforrapidcatch-up’.10Intheevent,itseemsthat,beforetheadoption
ofthesinglecurrency,the‘leastfavoured’werecatchingupandcomingtobeseen,
intheeyesofforeigninvestors,asmorealike.Overthethirteenyears1986–1998,
thecoefficientofvariationinthepercapitavalueofinwardFDItothe11countries
fellfrom162percentto94percent.However,overthethirteenyearsfollowingthe
adoptionoftheeuro,itrosefrom94percentto108percent,suggestingthatthe
foreign investorswerediscriminatingmorekeenlybetweenmembersof thezone,
ratherthancomingtotreatthemallasmembersofthesamemarket.
OurattempttoidentifythebenefitsoftheSingleMarketforFDI,onwhichtheBusiness
forNewEuropeargumentdepends,hasnotthereforebeensuccessful,sincenone
of theevidencepresentedenablesus to identify theappealof theworld’s largest
singlemarkettoforeigninvestors.Onlythreeofthe11membercountrieswehave
examined−Denmark,BelgiumandtheNetherlands−havehadratesofgrowthin
FDIstockcomparabletothoseofthethreeindependentcountriesofEurope.Mostof
theforeigninvestorsinthesethreeindependentEuropeancountriesare,ofcourse,
fromtheEuropeanUnion.Theyarethereforepresumablyawareofsuchadvantages
astheSingleMarkethastooffer,andhavenonethelesspreferredtoinvestoutsideit.
BusinessforNewEuropehasthereforebeennomoresuccessfulthanitspredecessor,
Britain inEurope, ingettingthefactsstraight for itsmultinationalsponsors.There
is no evidence to suggest that the euro boosted FDI in the eurozone countries,
andnonetosuggestthattheSingleMarkethashadabeneficialimpactonFDIin

The impact of the EU on foreign direct investment in the UK from 1970 to 2011 • 131
www.civitas.org.uk
itsmembercountries.FDIinnon-membercountrieshasbeenashigh,orhigher−
usuallyfarhigher.
Onceuponatime,theEuropeanCommissionwouldboastoftheattractionsofthe
SingleMarkettoforeigninvestors,anditsUKsupporterslikeBritaininEuropeobligingly
echoedtheirclaims,bothofthemwithoutcheckinganyfacts.Investorsthemselves,
whohavetoputtheirmoneywheretheirmouthis,wereobviouslynotconvinced,
astheevidencefrom1993onwardspresentedinTable10indicates.Nowadays,the
ECisrathermorecircumspect.Indeed,theEuropean Competitiveness Report 2012
acknowledgedthat‘theEUʼsshareofglobalinwardFDIhasdeclined significantly’
(emphasis inoriginal)which itattributedto ‘thecrisis’andto theattractivenessof
emergingmarkets,i.e.toanyonebutus.11Thereportthenembarkedononeofits
customaryexcursions,showinghow‘moreEurope’wouldsolvetheproblem.
Fromaresearchpointofview,thisreportisgravelydeficient.Itmakesnoattemptto
understandthedifferencesbetweenEUcountries,ortoexplainwhythesedifferences
havenotdeclinedover the lifeof theeuroor theSingleMarket.Needless toadd
perhaps,itdoesnotaskwhyindependentEuropeancountrieshavedonesomuch
better,despite‘thecrisis’andthe‘attractivenessofemergingmarkets’.
Toconclude,wemayconsidertheancillaryargumentofBusinessforNewEurope
that theUKattracts foreign investorsas thegateway tootherEUcountries. It is
curiousbecauseitisdirectlyandemphaticallycontradictedbytheresearchofErnst
&Young,asourcetheyoftencite.Inoneoftheirstudies,E&Yobserve,forinstance,
thattheyhavefound‘nostrongrelationshipbetweentheestablishmentofEuropean
headquartersandtheestablishmentofothercompanyactivities’.Onthecontrary,
theyobserve that ‘otheractivitiesattractEuropeanheadquarters rather thanvice
versa’.Inotherwords,thegatewayconceptisitselfquestionable,butifanycountry
isthegatewaytotheEU,astheE&Yreportrepeatedlypointedout, it isthenon-
EUmemberSwitzerland. Ithas, theysaid, ‘thebestoverall climate forEuropean
headquarters’,whiletheNetherlandshasthesecondbest.Bycontrast,theUKand
Luxembourg‘havearelativelybadinvestmentclimateforEuropeanheadquarters’,
andtheysuggestthattheUK’smightgetworsesince‘owingtothenew2004entrants
totheEU,itsgeographicalpositionisbecominglessfavourable’.12
WhyBusinessforNewEuropeshouldignorethisevidence,andmentionasourceso
unfavourabletoitsowncause,ispuzzling.TheirpredecessorBritaininEuropewas
caughtupinamini-scandalbecauseofitsmisuseofstatisticsfromahighlyreputable
sourcewhichwould,onewouldthink,havemadeitssuccessorscrupulouslycareful
aboutthesourcestheycite.13Moreover,theyrepresent,andarefundedby,anumber

www.civitas.org.uk
132 • Where’s The Insider Advantage?
of leading British and foreign multinationals, but apparently these multinationals
nevernoticedthat themostpreferred locationofEuropeanheadquarters fornon-
EuropeanmultinationalsistobefoundoutsidetheEU.
Asithappens,onthis latterpointat least,help isprovidedbytherecentBalance
of Competences Review,whichdeclaredthat‘…halfofallEuropeanheadquarters
ofnon-EUfirmsarebasedintheUK,andtheUKhostsmoreheadquartersofnon-
EUfirmsthanGermany,France,SwitzerlandandtheNetherlandsput together’.14
Unfortunately, it did not give a source, thoughgiven thatEnglish is the common
languageoftheEUandofworldtradeitseemshighlyprobable.Mightitnotbe,one
wonders,thattheappealoftheUKhasmoretodowiththeEnglishlanguagethan
withtheSingleMarket?Woulditnotbeworthconsideringthisatleast,aswellasthe
otherpossiblereasonsfortheappealoftheUKthatBusinessforNewEuropehave
themselvesmentioned,suchasaccesstocapitalmarkets,labourskills,ICT,astrong
R&Dbaseandalowlevelofregulationbeforeattributingoverwhelmingimportance
toasupposed‘indispensable’relatonshipwiththeEU?

The impact of the EU on foreign direct investment in the UK from 1970 to 2011 • 133
www.civitas.org.uk
4.Asummaryofthefindingswithshortanswerstothe three questionsSincewehavecoveredafairamountofground,itmaybehelpfultorecapboththe
methodsandmeasuresusedinthissearch,andtheevidencepresentedinallthree
stages.
InwardFDIhasherebeenmeasuredinavarietyofways:
► asaproportionofGDPandofgrossfixedcapitalformation
► byflowsperannumorbydecadalmeanssince1970
► bytheannualgrowthofstocksor‘positions’since1980
► bothflowsandstockshave in turnbeenmeasuredbyonecountry’s
shareofasetofcountries,andbytotalandpercapita value
► byasummaryindexofover-andunder-performingcountries,beingthe
ratiobetweenacountry’sshareofthetotalinflowsandstocksandits
shareofthetotalpopulationof15Europeancountries.
TheshadowofSPEshangs,itmustbeadded,overallthemeasuresandevidence
presented, since their extent, and the degree to which they have distorted FDI
returns,isunknown.1
Theyearsandthecountries,orgroupsofcountries,comparedhavevaried,along
withthefocusofanalysisandtheavailabilityofthedata.Thetimespansofbefore/
aftercomparisonshave thereforealsovaried.Data foronly threepre-entryyears
wasavailabletoassesstheimpactofEUentryonthethree1973entrants,butfor
six laterentrantsadecadeofdatabeforeandaftercouldbeused.Toassessthe
impactoftheeuro,preferencewasgiventocomparisonsforthirteenyearsbefore
andafterthelaunchbecausetherewerethirteenyearsofpre-andpost-eurodata
availablewhenthissearchstarted,andtoassesstheimpactoftheSingleMarket,
theevidencecouldrefertonineteenyearsbeforeandafteritsinauguration.
Given the variety ofmeasurements used in this, as in other discussions of FDI,
it follows that answers to questions about itmay vary according to themeasure
chosen, aswell as the countries included in any comparison, and the time over
whichithasbeenmeasured.
Theevidenceanalysedandpresentedabovetotrytoanswerthethreequestions
willnowbesummarised,withfootnotesreferringtothepagesaboveinwhichitwas
firstpresented.Eachofthethreesummarieswillconcludewithashortanddirect
answertothequestion.

www.civitas.org.uk
134 • Where’s The Insider Advantage?
Question 1: Did entry to the Common Market in 1973 boost FDI in the UK?
► Comparisonofthepre-andpost-entryexperienceofnineentrantstothe
EUshowsthatsevenofthem,includingtheUK,experiencedsubstantial
growthinFDIinflowsovertheirfirstpost-entrydecade.Theseappear,
inallprobability,tohavebeenadirectresultofjoining,sincetheywere
higher than the growth of FDI to European and non-European non-
members, and no other known common factor could explain similar
FDIincreasestoallsevencountriesfollowingtheirdifferententryyears
(pp.94–98,Figure2,Table2).
► Twonewentrants,DenmarkandGreece,grewatalowerratethanfive
non-membercountriesof the time(Austria,FinlandSweden,Norway
andIceland).Thereisthereforenoprimafacieevidencetoshowthat
entryhadabeneficialimpactonFDIinthesecountries(pp.97–98,Table
2).
► However, from1983–1992,FDI intheUKgrewataslowerratethan
that of five independent countries, and over the years 1993–2012
muchslower than three independentcountries (Iceland,Norwayand
Switzerland),evenafterweeliminateNorway’soilandgasindustries
and most of Switzerland’s financial services from the calculation of
thegrowthoftheirFDIstock(p.103,Figure4).Thissuggeststhatthe
benefitofjoiningforFDIintheUKlastednomorethanadecade.There
isnoevidence,eitherfromFDIflowsorstock,thatmembershipofthe
EUhasbeenoflastingbenefittoFDIintheUK(pp.99–104,Table3,
Figures3&4).
► Asimilarpost-entrysurgefollowedbyadeclineofFDIinflowstoalower
level than thoseof independentEuropeancountries is found inmost
oftheother laterentrants,aswellasinthegrowthoftheirFDIstock
(pp.104–107,Tables4&5).ThissupportstheviewthatwhileEUentry
hasapositive initial impactonFDI,membershipover the longer run
doesnot.
Answer: Yes, the evidence suggests that entry to the Common Market had a
beneficial effect on FDI in the UK, but there is no evidence that any benefit continued
beyond the first post-entry decade. Since 1982, one EU member – Ireland − and
three independent European countries have been consistently more attractive than
the UK to foreign investors.

The impact of the EU on foreign direct investment in the UK from 1970 to 2011 • 135
www.civitas.org.uk
Question 2: Did declining to join the euro adversely affect FDI in the UK?
The evidence supporting the answer to this question will be summarised, first,
for the eurozone and non-euro countries collectively, then for individual countries
within each bloc, and finally for the UK alone. This is not the same sequence as the
evidence was presented on pp.108–122 above.
Euro versus non-euro Europe
► The 10 eurozone countries increased their share of the total value
ofFDI inflows to15Europeancountriesby0.9per cent to60.1per
cent,andtheirpercapitashareby0.8percentto53.2percentover
thethirteenpost-euroyears.Theshareofthefivenon-eurocountries
correspondinglydeclined(pp.112–114,Table7).
► The10eurozonecountriesalsoincreasedtheirshareoftheFDIstock
by2.3percent,from59.3percentto61.6percent,andthenon-euro
countries experienced a corresponding decline. However, since the
eurozonehas77.5percentofthepopulationofthe15countries,they
canonlybesaidtohavebeencatchingupwithnon-eurocountries–
slowly(p.115,Table8).
► Post-eurogrowthofFDIstockofthethreenon-EUnon-eurocountries,
inrealterms,hasbeenthreetimesgreaterthanthatoftheeurozone
countries,while thatof thesixnon-eurocountries togetherhasbeen
approachingdoublethatoftheeurocountries,198percentvs110per
cent(p.119,Figure6;p.120,Table9).
► Over the thirteeneuroyears to2011, foreigners invested$30,277 in
everyinhabitantofnon-eurocountries,whichisalmostexactlydouble
theamountinvestedineveryinhabitantoftheeurozone:$14,901.And
theyinvested$59,194,nearlyfourtimesasmuch,ineveryinhabitantof
thethreenon-euro,non-EUcountries(p.119,Figure6;p.120,Table9).
► Only two of the 10 eurozone countries ended in 2011 as over-
performers,meaningthevalueoftheirFDIinflowswaslargerthantheir
shareof thepopulationof the15countries,whileallfiveof thenon-
eurocountrieswereover-performers.IntermsofFDIstock,onlythree
of the10eurozonecountrieswereover-performers,while fourof the
fivenon-eurocountrieswere,Denmarkbeing themarginalexception
(pp.112–115,Table7,Table8).

www.civitas.org.uk
136 • Where’s The Insider Advantage?
Individual winners and losers in the eurozone
► Fouroftheteneurozonecountriesincreasedtheirsharesoftotalvalue
ofFDIinflowsinthethirteenpost-euroyears:Germanywastheclear
winner.Itsshareincreasedby6.8percent.Francewastheclearloser.
Itssharedeclinedby3.4percent(pp.112–114,Table7).
► Changes in shares of FDI stock were similar. Germany’s increased
most,by7.1percent,so itssharemorethandoubled inthethirteen
post-euroyears.France’ssharehasfallenmost,againby3.4percent
(p.115,Table8).
► Irelandistheoutstandingover-performerintheeurozone,andindeed
ofallthe15countries.Despiterathermodestgrowthfrom1999to2011,
itendedwithashareofFDI inflows3.5timesmorethan itsshareof
thepopulationofthe15countries,andashareofEurope’sFDIstock
more than2.8 timesgreater.TheNetherlands is theonlyotherover-
performerintheeurozoneinbothinflowsandstocks,andAustriathe
onlyotherover-performerinstocks.Alltheothersareunder-performers
inbothflowsandstocksfrom1999to2011,GreeceandItalybeingthe
leastattractivetoforeigninvestors(pp.112–115Tables7&8).
Individual winners and losers in non-euro Europe
► The only post-euro increases in the share of FDI inflows in Europe
amongthenon-eurocountriesweremadebythetwocountriesthatare
outsideboththeEUandtheeuro:Switzerlandincreaseditspost-euro
shareofFDIinflowsinEuropeby1.3percentintotalvalueandNorway
by0.4per cent.Switzerland increased its shareofFDI stockby0.9
percentinvalue,whileNorway’sshareinthetotalvalueremainedthe
same(pp.112–115Tables7&8).
► Meanwhile,thesharesoftheFDIinflowsoftheEUmembersoutside
theeuro,Denmark,SwedenandtheUK,alldeclinedpost-euro:Sweden
by1.7percent,Denmarkby0.7percentand theUKby1percent
(pp.112–115Tables7&8).
► Sweden’sshareoftheFDIstockofEuropedeclinedbyonepercent,
Denmark’sby0.2per cent,while theUK’sdeclinedby twoper cent
(p.115,Table8).

The impact of the EU on foreign direct investment in the UK from 1970 to 2011 • 137
www.civitas.org.uk
The post-euro experience of the UK
► By threemeasures, theUKhasbeenapost-euro loser. Its shareof
theinflowsto‘EUcountries’felloverthirteenyearsbythreepercent
(pp.110–112,Table6).2ItsshareofthevalueofFDIinflowsto15euro
and non-euro European countries declined by one per cent, and its
shareofthevalueoftheirtotalFDIstockbytwopercent(p.112–115,
Tables7&8).
► Beforedrawingconclusions fromthesefigures, itmustbenoted that
theUKwasnotastrongperformerintermsofpercapitagrowthover
the thirteenpre-euroyears, itbeing lowerover theseyears thanthat
ofseveneuroandfournon-eurocountries.Overthepost-euroyears
percapitagrowthwaslowerthansixeuroandfivenon-eurocountries,
thoughthiswasnonethelesshigherthantheweightedmeanofall11
eurozonecountries(p.120,Table9).Thissuggeststhecontinuationof
atrendthatbeganlongbeforethenewcurrencywaslaunched,rather
thanachangebroughtaboutbytheUKdecisiontoremainoutsidethe
newcurrency.3
► Despite its pre- and post-euro decline in its share of both inflows
andstock, theUKhasremainedby far the largest recipientofall15
countriesofpost-euroFDIinflows,andbyfarthelargestholderofFDI
stock,measuredbyshareorvalue, takingnearlyaquarter,24.9per
cent,ofallFDIinflows,andholding24.6percentofFDIstockoverthe
thirteenpost-euroyears.ItisfollowedbyFrancewith14.9percentand
14.5percent,andbyGermanywith13.7percentand14.1percent
(pp.113–115,Tables7&8).
Answer: No. While the UK share of FDI inflows and stocks in these European
countries has fallen a little, it seems highly unlikely that this was the result of not
joining the euro. There are post-euro FDI winners and losers in both euro and non-
euro countries with rather more non-euro winners.
Two eurozone members, France and the Netherlands, experienced greater falls in
their share of FDI flows flows than the UK. It is therefore unclear why the UK fall
should be attributed to the decision not to join the euro. Moreover, the UK’s FDI stock
grew faster than the weighted mean growth of the eleven eurozone countries after
the launch of the currency.

www.civitas.org.uk
138 • Where’s The Insider Advantage?
Overall, the evidence suggests that the euro has not been a significant determinant
of the inflows and stock of FDI in Europe, neither a disadvantage to those who
declined to join it nor a special benefit to those who did.4

The impact of the EU on foreign direct investment in the UK from 1970 to 2011 • 139
www.civitas.org.uk
Question 3: Has the Single Market attracted FDI to the UK and to other members?
► FDI inflows per capita to the three independent European countries
have been nearly double those to the 11 founding members of the
SingleMarket,andinflowstoeight independentcountriescollectively
havebeenonethirdhigher(pp.126–127,Figures7&8).
► TheFDIstockofthethreeindependentEuropeancountrieshasgrown
aboutfourtimesasmuchasthatofSingleMarketcountries,andthe
eightindependentcountriescollectivelynearlytwiceasmuch.Relative
toindependentcountries,membersoftheSingleMarket,includingthe
UK,havebecomelessattractivetoforeigninvestors(p.127,Figure8;
p.129,Table10).
► Growth of FDI per capita among founder members of the Single
Markethasbeenhighest inDenmark,Belgiumand theNetherlands.
TheUKhasbeenbelow theEUmean (p.128–132,Table10).There
isnoevidenceofanyconvergence in theappealofmembersof the
SingleMarkettoforeigninvestorsoveritsfirst19years.Ifanything,the
evidencesuggeststheopposite(p.129–132).
Answer: No. There is no evidence to suggest that the Single Market as a whole
has been a magnet to foreign investors, or that it has encouraged FDI in the UK
specifically. Many non-members have attracted more FDI. They may have done
so, of course, by negotiating terms so that their trade differs little from that of EU
members, and their non-membership is therefore of little or no significance to foreign
investors.

www.civitas.org.uk
140 • Where’s The Insider Advantage?
5.OnclaimsandwarningsaboutFDIindebatesabouttheEUThecaseforUKmembershipoftheEU,oftheeuroandoftheSingleMarkethas
rested toa considerableextent on claimsabout their benefits forFDI in theUK,
andwarnings about the consequences of losing them.Claims andwarnings are
sometimesaccompaniedbyabuseofthosewhodoubteitherthebenefitsclaimed,
orthewarningsmade,butwewillletthatpass.
MuchthemostcredibleoftheseclaimsisthatentrytotheCommonMarket1973
boosted FDI in theUK, since the same positive effect can be observed inmost
othernewentrants,whateverdatetheymighthavejoined.However,theclaimthat
membershipoftheEUassuchhasbeenoflastingbenefittoFDIintheUKisnot
credible,anddifficulttoreconcilewiththehigherratesofgrowthofFDIflowsand
stocksfoundinmanynon-membercountriesinEuropeandbeyond.
Theclaimthattheadoptionofasinglecurrencywouldhaveabeneficialimpacton
FDI,whichtheUKwouldforfeitbydecliningtojoin,hastorestprimarilyonthepost-
eurogrowthofFDIinGermanyandtoalesserextentonAustriaandIreland.There
are,however,moreplausiblealternativeexplanationsfortheincreasedFDIflowsto
thesethreecountries.
Pre-euroGermanyhadrather lowFDI inflowsandstockrelative to thesizeof its
economy, and over the post-euro years was still incorporating one post-socialist
country, with several others as neighbours. Austria shares that geographical
advantageandalsostartedfromarelativelylowbase,sosubstantialFDIgrowthover
thepost-euroyearsmighthavebeenexpectedinbothofthesecountries,regardless
oftheeuro.Ireland’smainappealtoforeigninvestors,itslowrateofcorporationtax,
wasevidentlongbeforetheadventoftheeuro.In1986itsFDIstockpercapitawas
ten times theeurozonemean.As ithappened, itsFDI inflowsgrew ratherslowly
afteritadoptedtheeuro,thoughwithsuchaheadstartitwasabletoremainin2011
theoutstandingFDIover-performer in theeurozone. It hasotheradvantages. Its
inhabitantsspeakEnglish.ItslawandinstitutionscloselyresemblethoseoftheUK
anditcaneasilybetreatedbyforeigninvestorsasapartofthedomesticmarketof
itslargeneighbour,muchasmanyUKfirmshaveoftendone.
Clearly,weoughttomeasurereliablythecontributionofeachofthesefactorstothe
FDIgrowthinthesecountriesoverthepost-euroyearsbeforewecanattributeany
positiveimpacttothenewcurrency.Andwhenwehavedonethat,wehavestillto
explaintheratherpoorpost-europerformanceoftheothereurozonecountries,and
The impact of the EU on foreign direct investment in the UK from 1970 to 2011 • 141
www.civitas.org.uk
toexplainwhyFDIintheUK,andthefiveotherEuropeancountriesthatremained
outsidetheeuro,subsequentlygrewatafasterratethantheeurozonemean.That
wouldbeadifficulttask.
Claims that theSingleMarket has benefited FDI in theUK have proved equally
difficulttoidentify.TherateofgrowthoftheUK’sFDIstockovertheyears1993–
2011hasbeencomparativelymediocre,slightlybelow themeanofother founder
members.Inthemeantime,FDIinmanyindependentcountries,bothinEuropeand
beyond,hasgrownatfaster−oftenfarfaster−rates.
SincetheclaimedbenefitsofEUmembership,oftheeuroandoftheSingleMarket
lackempiricalsupport,itnecessarilyfollowsthatthewarningsaboutlosingoneor
otherthem,andoftheadverseconsequencesforFDI,mustfallflat.Thisdoesnot
mean,ofcourse,thattheywillnotcontinuetobeheard.Warningshaveaccompanied
everystepofUKparticipationintheEuropeanprojectthusfar,andthereisnoreason
tothinkthattheywillnotdosointhefuture.Theyarecost-free,evidence-lite,andif
theyprovetobefalsearequicklyforgotten,andreplacedbyanewwarningsabout
someotherthreat.
Thewarningthatprecededthe1975referendumaboutthepossibleconsequences
forFDIofanovotewaspresentedinanappropriatelycautiousmanner,sinceno
onecouldthenknowonewayortheotherwhattheimpactonFDIintheUKmight
be.Duringtheeurodebate,aswehaveseen,warningsabouttheconsequencesof
remainingoutsidethenewcurrencywererathermoreconfident,perhapsbecause
scrapsofempiricalevidenceseemedtosupporttheidea.Wearenowabletosee
howselectivethisevidencewas,andthatitconveyedawhollymistakenimpression.
Nomatter,thatisnowhistory.
Morerecently,anopportunityaroseforanotherwarningaboutFDIarosewiththe
PrimeMinister’svetointheCouncilofMinistersinDecember2011.Thiswasseen
at the timeasadangerousexpressionof independence from theEUconsensus
withfearfulconsequencesforFDIintheUK.TheBBCnewscoverageseemedto
betryingtoorchestrateadayofnationalmourning,withitsBusinessEditorwarning
hisnationalaudiencethat foreign investorswouldfleeandtheUKwouldbecome
an ‘isolated island’.Thispredictioncannowbeseen tobewildlymistaken.Over
theyearfollowingthisveto,asnotedearlier,theUKshareofFDIinflowstoEurope
increasedsignificantly,while thoseofFranceandGermanyplummeted.1 But that
warningtoohasnowpassedintohistory.
Currently,wehaveotherwarningstoattendto.TheveryideathattheUKmight,at

www.civitas.org.uk
142 • Where’s The Insider Advantage?
sometimeinthefuture,holdareferendumontheissueofEUmembershipallegedly
threatens FDI in the UK, and therefore jobs and livelihoods, since it raises the
possibilitythattheUKmightendupoutsidetheEU’sSingleMarket.AndiftheUK
doesactuallydecidetoholdsuchareferendum,wemayreasonablyexpecttohear
more,muchmoreabouthowtheUKwillbecomea‘small’,‘isolated’or‘lonely’island
inwhichnoforeigninvestorwouldwishtoinvest.
Sinceourcontrolgroups includedcountries thatmightaccuratelybedescribed in
oneormoreof theseways, theevidencewehavecollectedabout theirFDImay
be useful to anyonewonderingwhether to take these futurewarnings anymore
seriouslythanthosetheyhaveheardinthepast.
Figure9presentsineachcolumnthegrowthoftheFDIstockpercapitaintheseeight
independentcountriesover20yearsoftheSingleMarket,alongsidethemeanrate
Figure 9Independent countries compared with the EU, 1993–2011:
percentage growth in FDI stock per capita with 2011 value of stock per capita
ThecolumnforIcelandhasbeenforeshortened,simplytokeeptheothersvisible.Thetrueincreasewas,inUS$(1993),from$512to$27,293percapitaor5225percent.SeðlabankiÍslands,CentralBankofIceland,Statistics,ForeigndirectinvestmentstocksinIceland:http://www.cb.is/statisticsUNCTADrecordsastillhigherrateofgrowthbut,forreasonsmentionedabove,IhaveusedtheCentralBankfigureshere,asthroughout.AlltheotherfiguresarecalculatedfromUNCTADinwardandoutwardforeigndirectinvestmentstock,annual,1980–2011:http://unctadstat.unctad.org
0%
1,000%
2,000%
5,000%
6,000%
New Zea
land
Canad
a
Austra
lia
German
yUK
France
EU mea
nIsr
ael
Singap
ore
Norway
Switzerl
and
Icelan
d
P
er c
ent i
ncre
ase
1993
-201
2
$18.3k$21.0k$129.8k$38.5k$85.7k$37.7k $9.9k $19.1k $16.7k $8.7k $26.6k $18.4k

The impact of the EU on foreign direct investment in the UK from 1970 to 2011 • 143
www.civitas.org.uk
ofgrowthoftheEU14,thethreelatecomerstotheSingleMarketAustria,Finland
andSwedenbeing includedandLuxembourgbeingomitted,asusual, for lackof
data.France,GermanyandtheUKarealsoshownseparately.Thefigurebeneath
eachcolumnisthevalueoftheFDIstockheldpercapitain2012,sincethesefigures
becameavailablewhenwriting.TheFDIstockofan islandthat iscertainlysmall,
andmightbe thought lonelyand isolated,has, itmaybeseen,grownmostover
thelifeoftheSingleMarket.Anotherlonelyandisolatedislandcountryhasgrown
least.Perhapsthatshouldworryus,butthenNewZealand’sFDIstockpercapitais
currentlymorethandoublethatofGermany.


Appendices
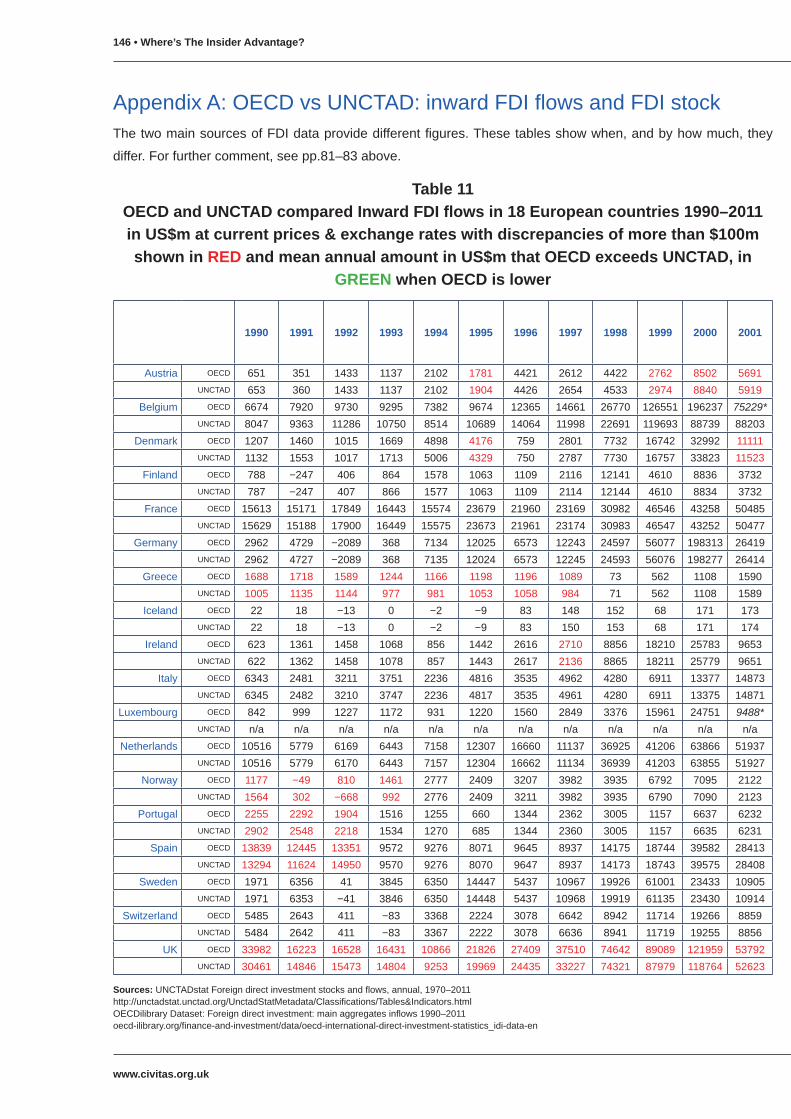
www.civitas.org.uk
146 • Where’s The Insider Advantage?
1990 1991 1992 1993 1994 1995 1996 1997 1998 1999 2000 2001
Austria OECD 651 351 1433 1137 2102 1781 4421 2612 4422 2762 8502 5691UNCTAD 653 360 1433 1137 2102 1904 4426 2654 4533 2974 8840 5919
Belgium OECD 6674 7920 9730 9295 7382 9674 12365 14661 26770 126551 196237 75229*UNCTAD 8047 9363 11286 10750 8514 10689 14064 11998 22691 119693 88739 88203
Denmark OECD 1207 1460 1015 1669 4898 4176 759 2801 7732 16742 32992 11111UNCTAD 1132 1553 1017 1713 5006 4329 750 2787 7730 16757 33823 11523
Finland OECD 788 −247 406 864 1578 1063 1109 2116 12141 4610 8836 3732UNCTAD 787 −247 407 866 1577 1063 1109 2114 12144 4610 8834 3732
France OECD 15613 15171 17849 16443 15574 23679 21960 23169 30982 46546 43258 50485UNCTAD 15629 15188 17900 16449 15575 23673 21961 23174 30983 46547 43252 50477
Germany OECD 2962 4729 −2089 368 7134 12025 6573 12243 24597 56077 198313 26419UNCTAD 2962 4727 −2089 368 7135 12024 6573 12245 24593 56076 198277 26414
Greece OECD 1688 1718 1589 1244 1166 1198 1196 1089 73 562 1108 1590UNCTAD 1005 1135 1144 977 981 1053 1058 984 71 562 1108 1589
Iceland OECD 22 18 −13 0 −2 −9 83 148 152 68 171 173UNCTAD 22 18 −13 0 −2 −9 83 150 153 68 171 174
Ireland OECD 623 1361 1458 1068 856 1442 2616 2710 8856 18210 25783 9653UNCTAD 622 1362 1458 1078 857 1443 2617 2136 8865 18211 25779 9651
Italy OECD 6343 2481 3211 3751 2236 4816 3535 4962 4280 6911 13377 14873UNCTAD 6345 2482 3210 3747 2236 4817 3535 4961 4280 6911 13375 14871
Luxembourg OECD 842 999 1227 1172 931 1220 1560 2849 3376 15961 24751 9488*UNCTAD n/a n/a n/a n/a n/a n/a n/a n/a n/a n/a n/a n/a
Netherlands OECD 10516 5779 6169 6443 7158 12307 16660 11137 36925 41206 63866 51937UNCTAD 10516 5779 6170 6443 7157 12304 16662 11134 36939 41203 63855 51927
Norway OECD 1177 −49 810 1461 2777 2409 3207 3982 3935 6792 7095 2122UNCTAD 1564 302 −668 992 2776 2409 3211 3982 3935 6790 7090 2123
Portugal OECD 2255 2292 1904 1516 1255 660 1344 2362 3005 1157 6637 6232UNCTAD 2902 2548 2218 1534 1270 685 1344 2360 3005 1157 6635 6231
Spain OECD 13839 12445 13351 9572 9276 8071 9645 8937 14175 18744 39582 28413UNCTAD 13294 11624 14950 9570 9276 8070 9647 8937 14173 18743 39575 28408
Sweden OECD 1971 6356 41 3845 6350 14447 5437 10967 19926 61001 23433 10905UNCTAD 1971 6353 −41 3846 6350 14448 5437 10968 19919 61135 23430 10914
Switzerland OECD 5485 2643 411 −83 3368 2224 3078 6642 8942 11714 19266 8859UNCTAD 5484 2642 411 −83 3367 2222 3078 6636 8941 11719 19255 8856
UK OECD 33982 16223 16528 16431 10866 21826 27409 37510 74642 89089 121959 53792UNCTAD 30461 14846 15473 14804 9253 19969 24435 33227 74321 87979 118764 52623
Sources:UNCTADstatForeigndirectinvestmentstocksandflows,annual,1970–2011 http://unctadstat.unctad.org/UnctadStatMetadata/Classifications/Tables&Indicators.htmlOECDilibraryDataset:Foreigndirectinvestment:mainaggregatesinflows1990–2011oecd-ilibrary.org/finance-and-investment/data/oecd-international-direct-investment-statistics_idi-data-en
AppendixA:OECDvsUNCTAD:inwardFDIflowsandFDIstockThetwomainsourcesofFDIdataprovidedifferentfigures.Thesetablesshowwhen,andbyhowmuch,they
differ.Forfurthercomment,seepp.81–83above.
Table 11OECD and UNCTAD compared Inward FDI flows in 18 European countries 1990–2011 in US$m at current prices & exchange rates with discrepancies of more than $100m shown in RED and mean annual amount in US$m that OECD exceeds UNCTAD, in
GREEN when OECD is lower

The impact of the EU on foreign direct investment in the UK from 1970 to 2011 • 147
www.civitas.org.uk
2002 2003 2004 2005 2006 2007 2008 2009 2010 2011OECD mean
annual difference in US$m
138 6201 3187 10778 7936 31159 6845 9304 838 11390 −414 OECD Austria356 7144 3891 10784 7933 31154 6858 9303 4265 14128 UNCTAD
16265 33508 43583 34351 58926 93448 193575 60966 85682 103376 1768 OECD Belgium16251 33476 43558 34370 58893 93429 193950 61744 81190 89142 UNCTAD
6639 2711 −10447 12873 2715 11815 1827 3942 −11549 12712 10 OECD Denmark6630 2709 −10442 12871 2691 11812 1824 3917 −7397 14771 UNCTAD
8053 3322 2828 4747 7656 12455 −1142 718 6525 2688 −350 OECD Finland8046 3319 2827 4750 7652 12451 −1144 398 6733 54 UNCTAD
49079 42538 32579 84898 71888 96240 64060 24216 30634 40982 −3 OECD France49035 42498 32560 84949 71848 96221 64184 24219 30638 40945 UNCTAD
53571 32398 −10195 47411 55657 80223 8093 22461 57432 48982 799 OECD Germany53523 32368 −10189 47439 55626 80208 8109 24156 46860 40402 UNCTAD
50 1276 2103 623 5358 2112 4490 2435 330 1144 83 OECD Greece50 1275 2102 623 5355 2111 4499 2436 373 1823 UNCTAD
87 332 737 3086 3858 6822 917 86 246 1108 5 OECD Iceland87 332 737 3081 3843 6824 917 86 246 1013 UNCTAD
29350 22803 −10614 −31670 −5545 24712 −16421 25717 42807 11478 694 OECD Ireland29324 22781 −10608 −31689 −5542 24707 −16453 25960 26330 13102 UNCTAD
14558 16430 16824 19960 39259 40209 −10814 20078 9179 29086 −865 OECD Italy17055 19424 20126 23291 42581 43849 −10835 20077 9178 29059 UNCTAD
4062 2916 5195 5976 31803 −28265 11195 20667 27677 14407 1296 OECD Luxembourg4058 2914 5192 6564 31837 −28260 11216 22408 9211 17530 UNCTAD
25060 28424 12459 39023 13984 119406 4540 38612 −7366 17195 −5 OECD Netherlands25038 32820 12453 39047 13978 119383 4549 36042 −8966 17129 UNCTAD
791 3472 2544 2181 10524 7993 10237 16637 16823 18224 924 OECD Norway791 3471 2544 5558 7085 5800 10564 13403 17519 3569 UNCTAD
1801 7155 1936 3927 10914 3063 4656 2707 2646 11160 −20 OECD Portugal1799 7149 1935 3930 10908 3063 4665 2706 2646 10344 UNCTAD
39258 25844 24775 25005 30819 64277 76843 10406 39875 26841 −173 OECD Spain39223 25819 24761 25020 30802 64264 76993 10407 40761 29476 UNCTAD
12270 4981 12218 11627 27521 28849 36855 10034 −64 9262 −107 OECD Sweden12273 4975 12122 11896 28941 27737 37153 10023 −1347 12091 UNCTAD
6284 16505 933 −949 43740 32446 15137 28945 32556 11805 1115 OECD Switzerland6276 16503 932 −951 43718 32435 15144 28642 20381 −196 UNCTAD
25176 27502 57178 177868 156218 200068 88678 76375 50587 51133 1925 OECD UK24029 16778 55963 176006 156186 196390 91489 71140 50604 53949 UNCTAD
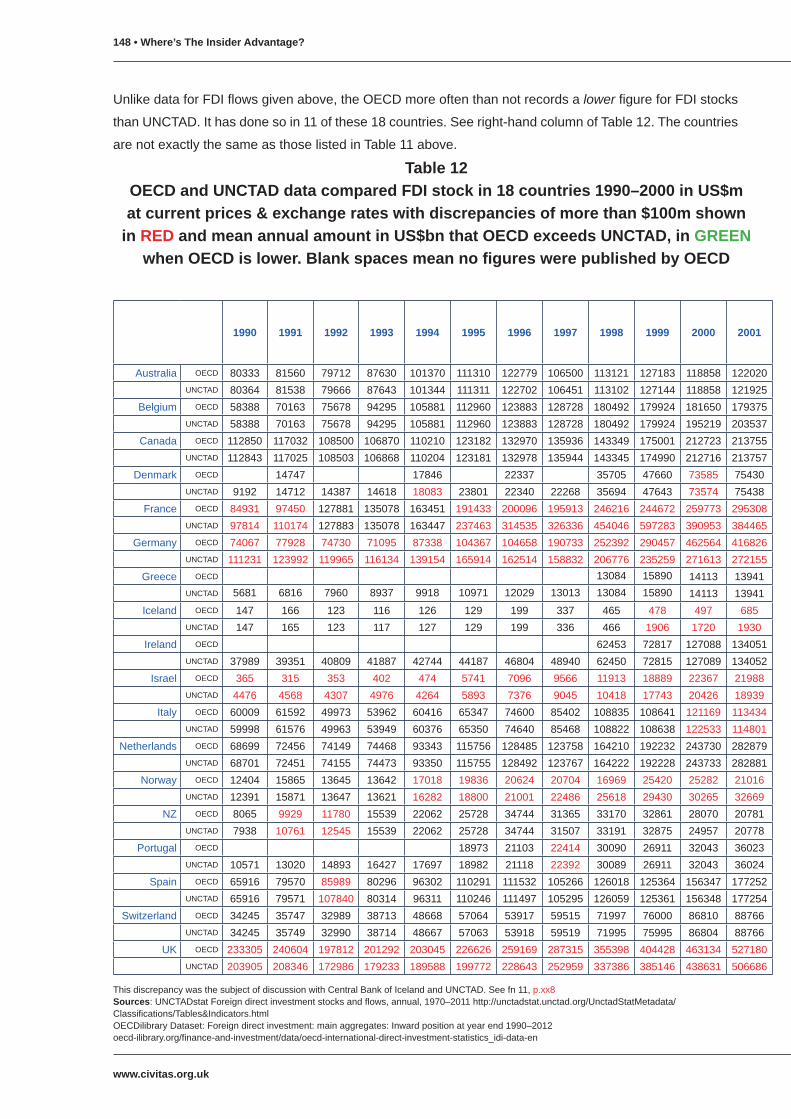
www.civitas.org.uk
148 • Where’s The Insider Advantage?
1990 1991 1992 1993 1994 1995 1996 1997 1998 1999 2000 2001
Australia OECD 80333 81560 79712 87630 101370 111310 122779 106500 113121 127183 118858 122020UNCTAD 80364 81538 79666 87643 101344 111311 122702 106451 113102 127144 118858 121925
Belgium OECD 58388 70163 75678 94295 105881 112960 123883 128728 180492 179924 181650 179375UNCTAD 58388 70163 75678 94295 105881 112960 123883 128728 180492 179924 195219 203537
Canada OECD 112850 117032 108500 106870 110210 123182 132970 135936 143349 175001 212723 213755UNCTAD 112843 117025 108503 106868 110204 123181 132978 135944 143345 174990 212716 213757
Denmark OECD 14747 17846 22337 35705 47660 73585 75430UNCTAD 9192 14712 14387 14618 18083 23801 22340 22268 35694 47643 73574 75438
France OECD 84931 97450 127881 135078 163451 191433 200096 195913 246216 244672 259773 295308UNCTAD 97814 110174 127883 135078 163447 237463 314535 326336 454046 597283 390953 384465
Germany OECD 74067 77928 74730 71095 87338 104367 104658 190733 252392 290457 462564 416826UNCTAD 111231 123992 119965 116134 139154 165914 162514 158832 206776 235259 271613 272155
Greece OECD 13084 15890 14113 13941UNCTAD 5681 6816 7960 8937 9918 10971 12029 13013 13084 15890 14113 13941
Iceland OECD 147 166 123 116 126 129 199 337 465 478 497 685UNCTAD 147 165 123 117 127 129 199 336 466 1906 1720 1930
Ireland OECD 62453 72817 127088 134051UNCTAD 37989 39351 40809 41887 42744 44187 46804 48940 62450 72815 127089 134052
Israel OECD 365 315 353 402 474 5741 7096 9566 11913 18889 22367 21988UNCTAD 4476 4568 4307 4976 4264 5893 7376 9045 10418 17743 20426 18939
Italy OECD 60009 61592 49973 53962 60416 65347 74600 85402 108835 108641 121169 113434UNCTAD 59998 61576 49963 53949 60376 65350 74640 85468 108822 108638 122533 114801
Netherlands OECD 68699 72456 74149 74468 93343 115756 128485 123758 164210 192232 243730 282879UNCTAD 68701 72451 74155 74473 93350 115755 128492 123767 164222 192228 243733 282881
Norway OECD 12404 15865 13645 13642 17018 19836 20624 20704 16969 25420 25282 21016UNCTAD 12391 15871 13647 13621 16282 18800 21001 22486 25618 29430 30265 32669
NZ OECD 8065 9929 11780 15539 22062 25728 34744 31365 33170 32861 28070 20781UNCTAD 7938 10761 12545 15539 22062 25728 34744 31507 33191 32875 24957 20778
Portugal OECD 18973 21103 22414 30090 26911 32043 36023UNCTAD 10571 13020 14893 16427 17697 18982 21118 22392 30089 26911 32043 36024
Spain OECD 65916 79570 85989 80296 96302 110291 111532 105266 126018 125364 156347 177252UNCTAD 65916 79571 107840 80314 96311 110246 111497 105295 126059 125361 156348 177254
Switzerland OECD 34245 35747 32989 38713 48668 57064 53917 59515 71997 76000 86810 88766UNCTAD 34245 35749 32990 38714 48667 57063 53918 59519 71995 75995 86804 88766
UK OECD 233305 240604 197812 201292 203045 226626 259169 287315 355398 404428 463134 527180UNCTAD 203905 208346 172986 179233 189588 199772 228643 252959 337386 385146 438631 506686
Table 12OECD and UNCTAD data compared FDI stock in 18 countries 1990–2000 in US$m at current prices & exchange rates with discrepancies of more than $100m shown
in RED and mean annual amount in US$bn that OECD exceeds UNCTAD, in GREEN when OECD is lower. Blank spaces mean no figures were published by OECD
UnlikedataforFDIflowsgivenabove,theOECDmoreoftenthannotrecordsalowerfigureforFDIstocks
thanUNCTAD.Ithasdonesoin11ofthese18countries.Seeright-handcolumnofTable12.Thecountries
arenotexactlythesameasthoselistedinTable11above.
ThisdiscrepancywasthesubjectofdiscussionwithCentralBankofIcelandandUNCTAD.Seefn11,p.xx8Sources:UNCTADstatForeigndirectinvestmentstocksandflows,annual,1970–2011http://unctadstat.unctad.org/UnctadStatMetadata/Classifications/Tables&Indicators.htmlOECDilibraryDataset:Foreigndirectinvestment:mainaggregates:Inwardpositionatyearend1990–2012oecd-ilibrary.org/finance-and-investment/data/oecd-international-direct-investment-statistics_idi-data-en
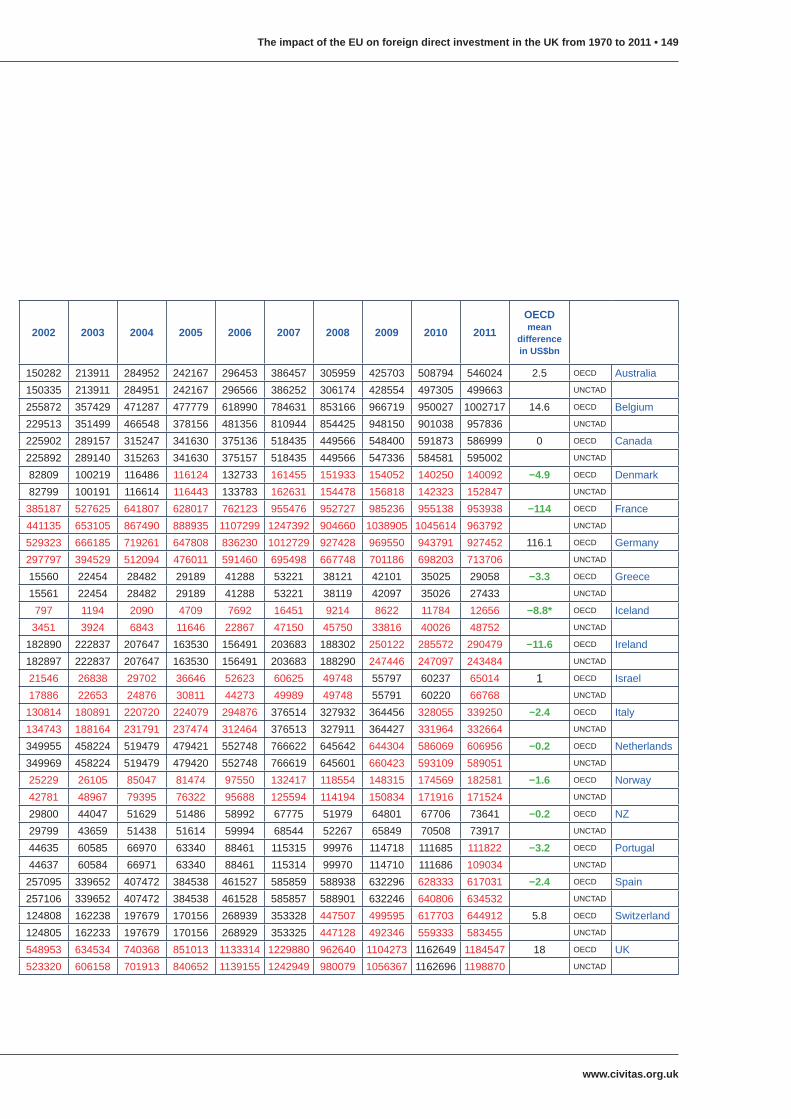
The impact of the EU on foreign direct investment in the UK from 1970 to 2011 • 149
www.civitas.org.uk
2002 2003 2004 2005 2006 2007 2008 2009 2010 2011OECDmean
differencein US$bn
150282 213911 284952 242167 296453 386457 305959 425703 508794 546024 2.5 OECD Australia150335 213911 284951 242167 296566 386252 306174 428554 497305 499663 UNCTAD
255872 357429 471287 477779 618990 784631 853166 966719 950027 1002717 14.6 OECD Belgium229513 351499 466548 378156 481356 810944 854425 948150 901038 957836 UNCTAD
225902 289157 315247 341630 375136 518435 449566 548400 591873 586999 0 OECD Canada225892 289140 315263 341630 375157 518435 449566 547336 584581 595002 UNCTAD
82809 100219 116486 116124 132733 161455 151933 154052 140250 140092 −4.9 OECD Denmark82799 100191 116614 116443 133783 162631 154478 156818 142323 152847 UNCTAD
385187 527625 641807 628017 762123 955476 952727 985236 955138 953938 −114 OECD France441135 653105 867490 888935 1107299 1247392 904660 1038905 1045614 963792 UNCTAD
529323 666185 719261 647808 836230 1012729 927428 969550 943791 927452 116.1 OECD Germany297797 394529 512094 476011 591460 695498 667748 701186 698203 713706 UNCTAD
15560 22454 28482 29189 41288 53221 38121 42101 35025 29058 −3.3 OECD Greece15561 22454 28482 29189 41288 53221 38119 42097 35026 27433 UNCTAD
797 1194 2090 4709 7692 16451 9214 8622 11784 12656 −8.8* OECD Iceland3451 3924 6843 11646 22867 47150 45750 33816 40026 48752 UNCTAD
182890 222837 207647 163530 156491 203683 188302 250122 285572 290479 −11.6 OECD Ireland182897 222837 207647 163530 156491 203683 188290 247446 247097 243484 UNCTAD
21546 26838 29702 36646 52623 60625 49748 55797 60237 65014 1 OECD Israel17886 22653 24876 30811 44273 49989 49748 55791 60220 66768 UNCTAD
130814 180891 220720 224079 294876 376514 327932 364456 328055 339250 −2.4 OECD Italy134743 188164 231791 237474 312464 376513 327911 364427 331964 332664 UNCTAD
349955 458224 519479 479421 552748 766622 645642 644304 586069 606956 −0.2 OECD Netherlands349969 458224 519479 479420 552748 766619 645601 660423 593109 589051 UNCTAD
25229 26105 85047 81474 97550 132417 118554 148315 174569 182581 −1.6 OECD Norway42781 48967 79395 76322 95688 125594 114194 150834 171916 171524 UNCTAD
29800 44047 51629 51486 58992 67775 51979 64801 67706 73641 −0.2 OECD NZ29799 43659 51438 51614 59994 68544 52267 65849 70508 73917 UNCTAD
44635 60585 66970 63340 88461 115315 99976 114718 111685 111822 −3.2 OECD Portugal44637 60584 66971 63340 88461 115314 99970 114710 111686 109034 UNCTAD
257095 339652 407472 384538 461527 585859 588938 632296 628333 617031 −2.4 OECD Spain257106 339652 407472 384538 461528 585857 588901 632246 640806 634532 UNCTAD
124808 162238 197679 170156 268939 353328 447507 499595 617703 644912 5.8 OECD Switzerland124805 162233 197679 170156 268929 353325 447128 492346 559333 583455 UNCTAD
548953 634534 740368 851013 1133314 1229880 962640 1104273 1162649 1184547 18 OECD UK523320 606158 701913 840652 1139155 1242949 980079 1056367 1162696 1198870 UNCTAD

www.civitas.org.uk
150 • Where’s The Insider Advantage?
AppendixB:UNCTADvsOECDThereareonlytwooccasionswhereasetofUNCTADdatausedtoconstructatable
orgraphcanbecomparedwitha reasonably full setofOECDdataused for the
samepurpose.ThefirstisFigure8onpage127.Itisreproducedbelow,together
withthesamegraphusingtheOECDdata−withafewnecessaryadjustmentsand
omissions−whichareexplainedintheTablebelow.TheoverallresultofusingOECD
datawouldbetoincreasethedisparitybetweentheEUandtheothercountries.
ThesecondoccasionwhenwecancompareUNCTADwithalmost-completeOECD
dataisTable10,p.129.Table10abelowextendsTable10byaddingalongsidethe
originalUNCTADdatatheequivalentOECDdata,thoughsomeestimateshavebeen
included,asshownbeneaththetable,toprovideareasonablycompletecomparison.
Cellswithmajordifferencesareshadedorange.Thoseshadedgreenindicateother
largediscrepanciesbetweenthetwodatabases.
IntheUNCTADtable,Icelandwasthefastest-growingFDIstockovertheperiod,but
itisreplacedbyIsraelwhenweuseOECDdata.Themaindifferencesbetweenthe
twosourceswhichareresponsibleforthischangearethevaluesrecordedforIsrael
overtheyears1990to1995.UNCTADfiguresfortheseyearsweremorethanten
timeshigherthanthoseofOECD(seeTable12above)hencetheveryhighgrowth
raterecordedbytheOECD.ThefiguresrecordedbythetwoagenciesforIsrael’s
2011FDIstock,itmaybenoted,differbyarelativelysmallamount.
The second striking contrast isGermany’s growth and the 2011 value of its FDI
stock. Over the years 1990–1996, Germany’s FDI stock was, according to the
OECD, roughly one third lower than UNCTAD’s figure, but quite suddenly, from
1997–2011itaveraged40percenthigherthantheUNCTADfigure.Henceitsvery
highgrowthratebyOECD’sreckoning,andthejumpfromthirteenthfastest-growing
intheUNCTADtabletofourthinOECD’s.ThehigherOECDratingofthegrowthand
valueofGermanFDIstock,nodoubt,alsolargelyexplainstheincreaseintheEU
meangrowthandstockvalue.
If IsraelorGermanyhadbeen the focusof thisanalysis, thesedifferenceswould
havebeenofsomeconsequence,overcertainyearsatleast.Sincetheywerenot,
wecanmerelynote them fora futureoccasion.Theboost to theEUmean from
Germany’sOECDfigureswouldnotrequireanyalterationtotheconclusionsofthe
paper.

The impact of the EU on foreign direct investment in the UK from 1970 to 2011 • 151
www.civitas.org.uk
0
10,000
20,000
30,000
40,000
50,000
60,000
70,000
2010 2005 200019951990
FDI s
tock
per
cap
ita, c
urre
nt U
S$ Single Market inaugurated
4,730
3,5784,391
2,158
199368,996
20,57231,723
16,752
2011
8 independent countries3 independent European countries
EU 11UK
Figure 8aOECD: Per capita growth of FDI stock over the life of the single market 1993–2011 in current value US$ with weighted means of
stock held per capita in 1993 and 2011
Thethreenon-EUEuropeancountriesareIceland,NorwayandSwitzerland.TheeightindependentcountriesarethesethreeplusAustralia,Canada,Israel,NewZealand&Singapore.Source:UNCTADhttp://unctadstat.unctad.orgInwardFDIstock,annual1980–2011
Figure 8UNCTAD: Per capita growth of FDI stock over the life of the
single market, 1993–2011, in current value US$ with weighted means of stock held per capita in 1993 and 2011
ThethreeindependentEuropeancountriesareNorway,IcelandandSwitzerlandTheeightindependentcountriesareAustralia,Canada,Israel,Singapore,NewZealand,Norway,IcelandandSwitzerlandSource:UNCTADhttp://unctadstat.unctad.orgInwardFDIstock,annual1980–2011
FDI s
tock
per
cap
ita, c
urre
nt U
S$
8 independent countries3 independent European countries
EU 11UK
0
10,000
20,000
30,000
40,000
50,000
60,000
70,000
2010 2005 200019951990
Single Market inaugurated
4,564
3,0964,431
2,340
199361,886
19,13529,363
15,721
2011
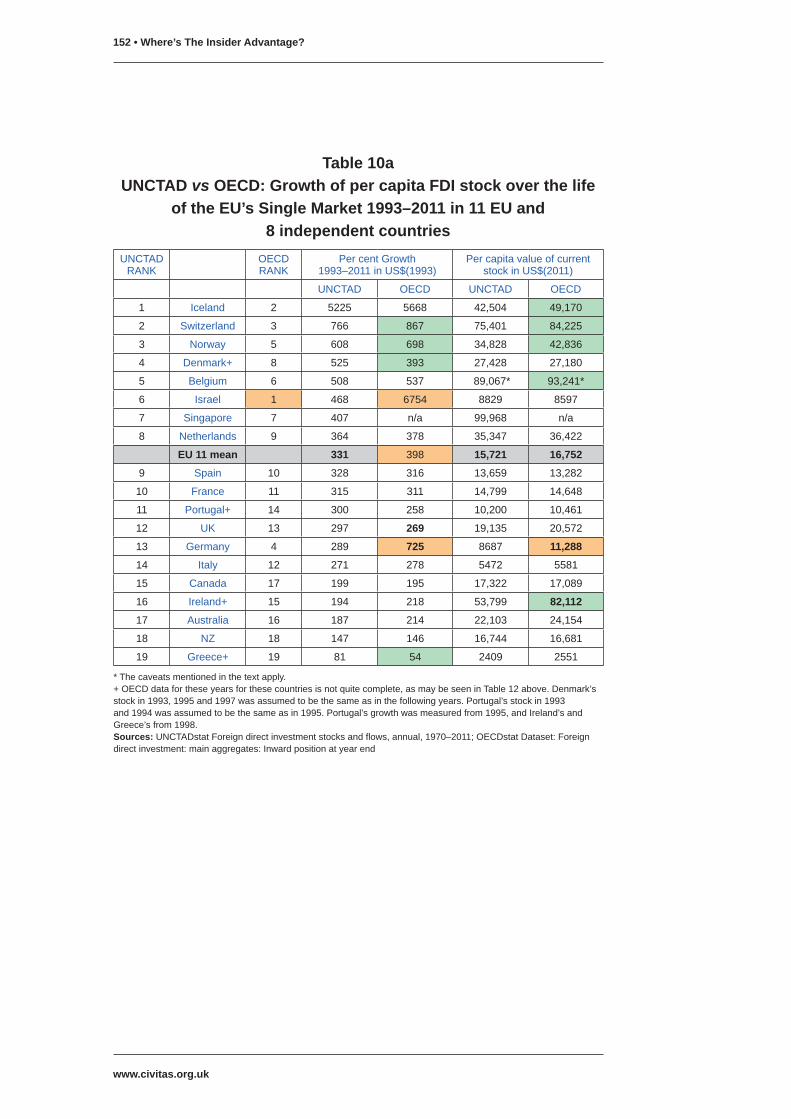
www.civitas.org.uk
152 • Where’s The Insider Advantage?
Table 10aUNCTAD vs OECD: Growth of per capita FDI stock over the life
of the EU’s Single Market 1993–2011 in 11 EU and 8 independent countries
UNCTADRANK
OECDRANK
PercentGrowth 1993–2011inUS$(1993)
PercapitavalueofcurrentstockinUS$(2011)
UNCTAD OECD UNCTAD OECD
1 Iceland 2 5225 5668 42,504 49,170
2 Switzerland 3 766 867 75,401 84,225
3 Norway 5 608 698 34,828 42,836
4 Denmark+ 8 525 393 27,428 27,180
5 Belgium 6 508 537 89,067* 93,241*
6 Israel 1 468 6754 8829 8597
7 Singapore 7 407 n/a 99,968 n/a
8 Netherlands 9 364 378 35,347 36,422
EU 11 mean 331 398 15,721 16,752
9 Spain 10 328 316 13,659 13,282
10 France 11 315 311 14,799 14,648
11 Portugal+ 14 300 258 10,200 10,461
12 UK 13 297 269 19,135 20,572
13 Germany 4 289 725 8687 11,288
14 Italy 12 271 278 5472 5581
15 Canada 17 199 195 17,322 17,089
16 Ireland+ 15 194 218 53,799 82,112
17 Australia 16 187 214 22,103 24,154
18 NZ 18 147 146 16,744 16,681
19 Greece+ 19 81 54 2409 2551
*Thecaveatsmentionedinthetextapply.+OECDdatafortheseyearsforthesecountriesisnotquitecomplete,asmaybeseeninTable12above.Denmark’sstockin1993,1995and1997wasassumedtobethesameasinthefollowingyears.Portugal’sstockin1993and1994wasassumedtobethesameasin1995.Portugal’sgrowthwasmeasuredfrom1995,andIreland’sandGreece’sfrom1998.Sources:UNCTADstatForeigndirectinvestmentstocksandflows,annual,1970–2011;OECDstatDataset:Foreigndirectinvestment:mainaggregates:Inwardpositionatyearend

The impact of the EU on foreign direct investment in the UK from 1970 to 2011 • 153
www.civitas.org.uk
AppendixC:ObiterdictaoftheBritaininEuropecaseforjoiningtheeuroThetwomainempiricalplanksoftheBritaininEuropecasefortheUKtojointhe
euro−thedeclineintheUKshareofFDIintheEUandthefallintheflowofinward
FDItotheUK−havebeenexaminedabove.1However,inthefewpagesdevotedto
FDI,theyaddedvariousotherrandomscrapsofevidencewhichtheythoughtwould
tostrengthentheircase.Sincethesewouldhaveledthesearchinalldirections,and
wereonlysupplementarytotheirargument,itdidnotseemworthexaminingeachof
thematlength.Herearesomeexamples:
► Theyclaimedthat:‘Investmentintotheeuroareahasrisenmostsharply
from(emphasisadded)EUcountriesthathaveyettojointheeuro(up
867percentbetween1998and2000).’Theygivenosource for this
figure,andtheword‘from’ispuzzling.EasternEuropecouldnothave
beenasignificantsourceofinvestmentintheEU,soatfirstIdecidedto
take‘from’asmeaning‘to’,sinceelsewhereinthetexttheyrefertoFDI
growthinEasternEurope.Onsecondthoughts,Idecidedtoignorethe
remark.EasternEuropecountrieswerestill inthethroesoftransition
fromsocialism,andFDIinthemwasstillinitsearlydays.Ittherefore
seemed unlikely that we could disentangle from their experience,
whateveritwas,muchofrelevanceabouttheimpactofthedecisionto
remainoutsidetheeuroontheUKeconomy.
► Theynote that ‘in2001Britainwasovertakenby theNetherlandsas
theprincipalrecipientofforeigninvestmentfromoutsidetheEU’.They
forgottomentionthatthishadhappenedintermittentlyduringthepre-
euroyears,in1993,1994,1996and1998.However,sincetheywere
focusingspecificallyonpost-eurodeclineininwardFDItotheUK,they
mightalsohavementionedthatin1999and2000,thefirsttwoyears
oftheeuro,inwardFDItotheUKfromthewiderworldexceededthat
totheNetherlandsbyafarlargermarginthananyrecordedsincethe
OECDbegankeeping records in1985.2Soyes,while,as theysaid,
the Netherlands did overtake the UK in 2001, it does not have the
significancetheywishedtoattachtoit.Ithasonlyhappenedoncesince
then,in2008.3
► They quote from Invest-UK Annual Report that ‘not only is Britain’s
international share of inward investment falling but the absolute
levelsofinwardinvestmentarenowfallingaswell’.Thisisacommon

www.civitas.org.uk
154 • Where’s The Insider Advantage?
occurrence, as we have often had occasion to note: FDI flows are
volatile.Thisisnotthereforethesignificantindicatortheyseemtothink.
TheabsolutelevelofinwardinvestmenttotheUKfellduring11ofthe
yearsbetween1970and1998,andhasfallenonsevenoccasionssince
1999,including2001,theyeartowhichtheyarepresumablyreferring.
► Theyobserve that: ‘US investment toEUcountriesoutside theeuro
hasfallenby71percent’butgivenosourceordate,anditistherefore
difficulttoknowhowitmightbere-examined.
Alltheserandom,scrappybitsofevidenceaddlittletotheBritaininEuropeargument.
Ifanything,theydiscreditit.
Notes • 155
www.civitas.org.uk
Notes
Preface1 AndrewRose,EMU’s Potential Effect on British Trade: A Quantitative Assessment,
2000b,p.13.
2 OECDStatdatabase,‘UnemploymentRateKeyTablesfromOECD,No.1.doi:10.1787/
unemp-table-2012-1-en
3 Asplendiddemonstrationofitsworkonvideoandpaperbyoneofitsmaininstigators,
DaveRamsden,ChiefEconomicAdvisertotheTreasury,istobefoundinthewebsiteofthe
MileEndGroup,MEG98,25June2013:‘TheEuro:10thAnniversaryoftheAssessmentof
theFiveEconomicTests’
4 TimCongdon,How much does the European Union cost Britain?UKIndependence
Party,London2012.
Part I: A comparative study of UK exports to EU and non-EU nations between 1960 and 2012
1.A39-year-oldargument1 http://www.harvard-digital.co.uk/euro/pamphlet.htm
2 ‘OneNationinEurope’,EdMiliband’sspeechattheCBIAnnualConference,19
November2012,TheLabourParty:
www.labour.org.uk/one-nation-in-europe
3 Theothertwowere‘wewouldloseourgloballeadershiprole’,and‘wewouldlosethe
opportunityforco-operationandaddedstrength.’TonyBlair,‘Europe,BritainandBusiness–
BeyondtheCrisis’attheBusinessforNewEuropeeventatChathamHouse28thNovember
2012.
http://www.bnegroup.org/events/view/event-summary-europe-britain-and-business-beyond-
the-crisis.-a-speech-by-th/
4 ForthefulltextofthePrimeMinister’sspeechabouthisplansforareferendumon
BritishmembershipoftheEuropeanUnion,see:
https://www.gov.uk/government/speeches/eu-speech-at-bloomberg
ThespeechwastrailedinhisearlierremarkstoParliamentaryPressGallery.‘Wewillbe
governed‘byfax’fromBrusselsifUKquitsEU,DavidCameronsays’,DailyTelegraph,10
December2012.
5 PeterMandelson‘DavidCameronmustnotcaveintotheUKIPthreat’,Daily
Telegraph,16May2013
6 ‘dictated’,isthewordheactuallyusedinhisspeech.Conventionally,thetermsoftrade

www.civitas.org.uk
156 • Where’s The Insider Advantage?
referstotheratiobetweenimportandexportprices,andisprimarilydeterminedbytherate
ofexchange.
7 https://www.gov.uk/government/speeches/eu-speech-at-bloomberg
2.Howcanweidentifyinsideradvantages?1 Ittookhimacoupleofhours,anditisdoubtfulwhetheranyoutsidercouldhavefollowed
it.SirJonCunliffe,UKPermanentRepresentativetotheEU,MinutesofEvidenceHC109-I
House of Commons Oral Evidence taken before the European Scrutiny Committee,Wed8
May2013.
http://www.publications.parliament.uk/pa/cm201314/cmselect/cmeuleg/c109-i/c10901.htm
2 ‘Asof1October2012,1,420directivesand1,769regulationswereinforcetoensure
thefunctioningoftheSingleMarket.’p.9,Internal Market Scoreboard.EuropeanUnion,
2013.
3 pp.82–94,EuropeEconomics,Optimal Integration in the Single Market: A Synoptic
Review, AEuropeEconomicsreportforBIS,April2013.
4 Likeallgoodcaricatures,thephrase‘governmentbyfax’distortsandexaggeratesfor
politicaleffect.Itwascoinedin2001bythethenPrimeMinisterofNorwayJensStoltenberg,
inanattempttopersuadereluctantNorwegianstosupportmembershipoftheEU.Asa
memberofEFTA,theNorwegianPMhasnoneedtositbyafaxmachineinOsloreceiving
diktatsfromBrussels,sinceNorwaynegotiatesdirectlywithEUrepresentativesand
hastherightofreservation,i.e.tooptoutofEUlegislationifitwishes,arightwhichitis
currentlyexercisingwithregardtothethirdpostaldirective.Norwaymaintainsa60-strong
representativepresenceinBrussels,participatesin,andcontributesfinanciallyto,alarge
numberofEUagencieswhicharetreaty-boundtorespecttheNorwegianandotherEFTA
representatives’pointsofview.Sincemanyoftheseagencies,andECcommitteesonwhich
Norwayisrepresented,workbyconsensus,representativesfrommembercountriesoften
donotvoteeither,andevenwhentheydo,nooneistoldhowtheyvoted.Itwilltherefore
bedifficulttodiscoverwhetherNorwayisheardlessrespectfully,orharddoneby,when
comparedwiththerepresentativesofthe28memberstates.Aninformedresponseto
Stoltenberg’scaricature,largelywrittenbytheNorwegianstaffinBrussels,isintheEFTA
BulletinDecisionShapingintheEuropeanEconomicArea1–2009.Itisworthaddingthat,
asRichardNorthhasshown,muchEUlegislationmerelygiveslegaleffecttothe‘quasi-
legislation’ofnumerousglobalstandard-settingbodiesdealingwithsuchmattersasfinancial
reporting,testingofmedicines,environmentalprotectionandclimatechange,airnavigation,
fisheries,motorvehiclesafetystandards,andhandlinghazardouschemicals.WhileNorway
retainsfullvotingmembershipinthesebodies,EUmembercountriesdonot,theirplace
havingbeentakenbyaEuropeanCommissionappointee,anditisEUmemberswhomay

Notes • 157
www.civitas.org.uk
sitbytheirfaxmachineswaitingtoheartheresults.FordetailsseeRichardNorth,The
Norway Option: rejoining the EEA as an alternative to membership of the European Union,
London,2013.WhileitiseasytoseewhyNorwegianpoliticalleaderslikeStoltenberg,
mightfeelmiffedbybeingexcludedfromthebigEUoccasions,itisdifficulttobelievethe
Norwegianpeoplefeeldeprivedordisadvantagedinanyrespect.MorethanhalfofNorway’s
contributiontotheEUisthroughtheentirelyvoluntary‘Norwaygrants’,anditisdifficultto
understandwhytheseshouldcontinueiftherewasawidespreaddiscontentamongthe
NorwegianpeopleabouttheirrelationshipwiththeEU.
5 Q.454,ProfessorSimonHix,Uncorrected Transcript of Oral Evidence,tobepublished
asHC109-ii,takenbeforetheEuropeanScrutinyCommitteeintheHouseOfCommons12
June2013.
6 PublicRadioInternational,22May2013:
http://www.pri.org/stories/2013-05-22/spaniards-outraged-new-strict-eu-regulations-olive-oil
7 COPA-COGENAvoicedits‘seriousregret’aboutthereversalofameasurethat‘has
beendiscussedforoverayearandwassupportedby15MemberStatesandpassed
throughallthecorrectlegalprocedures.’Pressrelease23rdMay2013,Committeeof
ProfessionalAgriculturalOrganizationsintheEU:
http://www.copa-cogeca.be
8 TheNorwegiansdidatleasthavetheirfaxcopy.On25thMay2013,therewasno
referencetothepressstatementonthewebsitenewsroomandEuropaPressReleases
Rapid:
http://europa.eu/newsroom/press-releases/index_en.htm
http://europa.eu/rapid/search-result.htm
9 SeeforinstanceUNCTAD’stable‘Valuegrowthratesofmerchandiseexportsand
imports,annual,1950–2012’.Theseare,however,giveninnominaldollarvalues,andin
realtermsanactualdeclineisnodoubtmorefrequent.ThelastoccasionduringwhichUK’s
exportsactuallydeclined,bothinnominalandrealterms,wasintheearly1980s.
http://unctadstat.unctad.org
3.Aviewofthehalf-century1960–20121 Althoughoverthese13years,theEUshareofUKgoodsexportsdeclinedrathermore
sharplyfrom66.5%to61.0%
2 Indeed,inwrittenevidencetotheHouseofLordsSelectCommitteeontheEuropean
UnioninOctober2010,theDepartmentforBusiness,InnovationandSkillsclaimedthatit
hadincreased,andthattheUK,alongwithotherEUcountries,‘tradetwiceasmuchwith
eachotherastheywoulddointheabsenceofthesinglemarketprogramme.’Nocitation
wasgiventosupportthisastonishingclaim,andnomembersofthecommitteequestioned
www.civitas.org.uk
158 • Where’s The Insider Advantage?
EdDavey,theMinisterresponsibleformakingit,abouttheevidencetosupportit.Irecently
askedBISforthatevidence,andintendtoreviewitinaseparatepublication.HouseofLords
SelectCommitteeontheEuropeanUnion,(Sub-CommitteeB)InquiryintoRe-launchingthe
SingleMarket,Oralandassociatedwrittenevidence,DepartmentforBusiness,Innovation
andSkills,p.110,writtenevidence(EUSM7)14October2010:
http://www.parliament.uk/documents/lords-committees/eu-sub-
com-b/singlemarketinquiry/singlemarketwo.pdf
http://www.parliament.uk/documents/lords-committees/eu-sub-
com-b/singlemarketinquiry/singlemarketwe221010.pdf
4.Thetop35fastest-growingexporterstotheEU1 TheagreementswithNorwayandSwitzerlandcameintoforcein1973,thatwithTurkey
from1996,thosewithMexico,SouthAfricaandIsraelfrom2000,thatwithEgyptfrom2004,
withAlgeriafrom2005,andwithKoreain2011.Theyarediscussedfurtherbelow.
2 Amazon.comintheUKisacaseinpoint.TheannualgrowthofitsUKsalesrevenue
hasdeclinedfrom31%in2011,to22%in2012and14%in2013.Onecommentator
observed,afteridentifyingfastergrowingrivals,that‘…mathematically,arithmetically,itgets
hardertokeepgrowingatdoubledigitrates’.Amazon,however,declinedtocomment.p.41,
Business Evening Standard,3rdFebruary2014.
3 Iwassodoubtfulonthispoint,thatIaskedfor,andreceived,writtenconfirmationfrom
OECD.
4 Hewasseekingtocounterwhathecalled‘globaloney’,exaggeratednotionsofthe
extentofglobaltrade,andtoarguethatweareonlyattheverybeginningofit.Onthe
specificpointmentioned,hereferredto‘hundredsofattemptsbyeconomiststoestimate
“gravitymodels”-modelsthatpredictinternationalflowsbasedonthegravitationalpull
createdbythemassesoftwoeconomies,offsetbythegeographicaldistancebetween
them(alongwithotherimpediments),suggestthat,otherthingsbeingequal,doublingthe
geographicdistancebetweencountrieshalvesthetradebetweenthem.’Unfortunately,
hedidnotdistinguishbetweengoodsandservicesinthisrespect.PankajGhemawatwith
StevenA.Altman,DHLGlobalConnectednessIndexof2011:
http://www.dhl.com/content/dam/flash/g0/gci/download/DHL_GlobalConnectednessIndex.pdf
5.AbackwardsglanceattheCommonMarket1 TheUnitedNationsConferenceonTradeandDevelopment(UNCTAD)TradeAnalysis
InformationSystem(TRAINS)viatheWorldIntegratedTradeSolutionat:
https://wits.worldbank.org/
TheWorldBankitselfputthesimpleaverageEUtariffonmanufacturedgoods,whichis

Notes • 159
www.civitas.org.uk
usuallylowerthantheweightedaverage,in2011at1.4%.‘TariffRate,applied,simplemean,
manufacturedproducts’availableviaWorldDevelopmentIndicators:Tariffbarriers:
http://wdi.worldbank.org/table/6.6
2 ExceptperhapstoSirJohnMajor.InaspeechinFebruary2013,hearguedthat,ifthe
UKlefttheEU,carsmadeintheUKwouldfacea10%tariffanda5%tariffoncomponents
whenexportedtotheEU.Hepredictedthatforeign-ownedcompanieswouldthenmigrate
totheEU.SirJohnMajor,The Referendum on Europe: Opportunity or Threat?,Chatham
House,14thFebruary2013:
http://www.johnmajor.co.uk/page4364.html
3 DavidCameronEUspeechatBloomberg,23rdJanuary2013:
https://www.gov.uk/government/speeches/eu-speech-at-bloomberg
4 Ina2007researchpaperoftheDirectorate-GeneralForEconomicandFinancial
AffairsoftheEuropeanCommission,forinstance,onecanfindthefollowingobservations:
‘InitialexpectationsthattheInternalMarketwouldbealaunchingpadforamoredynamic,
innovativeandcompetitiveeconomyatworldlevelhavenotbeenmet…theInternalMarket
seemstohavelostitsattractivenessforforeigninvestors…theEU25continuestoreveal
acomparativedisadvantageinhightechsectorsincludingICT…mostEUcountrieslag
behindthetopperformersliketheUSandJapanintermsofinnovation…intra-EUtrade
flowsofgoodstoGDPseemstohavelostmomentumsince2000…Thisperiodofslowdown
intradeintegrationcoincidedwiththeintroductionofthesinglecurrency.’pp.1,11,29–30N°
271January2007,Steps towards a deeper economic integration: the Internal Market in the
21st century: A contribution to the Single Market ReviewbyFabienneIlzkovitzetal:
http://ec.europa.eu/economy_finance/publications/publication784_en.pdf
6.Andfurtherback,tothepre-entryyears1 Thiswastheeraof‘JapanasNo.1’.ItledthegrowthoftheseOECDcountries,growing
by328%overtheperiod.WithoutJapan,theUKwouldhavefinishedwithinapercentage
pointofthesixremainingOECDcountries.
2 Thedeeplypessimisticmoodinthemediaofthedayisnicelycaughtbyadetailed
studyofonejournalthatopposedmembershipoftheEEC.ThomasTeodorczuk,‘Ultimate
Vindication:TheSpectatorandEurope1966–79’.BrugesGroupPapers(43).2009.
3 If,bytheway,insteadofback-datingtheEUentryofGreece,SpainandPortugal,we
hadoptedtoholdthenumberofEUcountriesconstantbyonlytrackingtheothercountries
thatactuallyweremembersin1973,thecontrastbetweenthethreeerasinthegrowthof
UKexportspresentedherewouldnothavebeendifferent.TherealgrowthofUKexportsto
theothereightovertheyears1960–1972wouldhavebeen136%(insteadof137%),from
1973–1992wouldhavebeen172%(insteadof171%),andfrom1993–2011wouldhave
been79%(insteadof81%).

www.civitas.org.uk
160 • Where’s The Insider Advantage?
7.Areservicesanydifferent?1 ThisisdemonstratedintheanalysesoftheUK’srevealedcomparativeadvantageby
sectorpp.33–38DepartmentforBusiness,Information&Skills,EconomicsPaperNo.8,UK
trade performance: Patterns in UK and global trade growth,London,2010:
https://www.gov.uk/government/uploads/system/uploads/attachment_data/file/32114/10-803-
uk-trade-performance-growth-patterns.pdf
2 UNCTADprovidesdataforservicesexportsfromamuchearlierdate(1980)butdoes
notidentifythepartnercountry,i.e.saywheretheexportswent.
3 FollowingtheOECD’sconvention,dataforservicesexportsarepresentedper annum,
bycontrastwith‘annualisedmonthlyaverages’forgoods.
4 JohnCridland,‘Inorout,BritainhastoplaybyEurope’srules’,The Times,4July
2013.ThisarticleseemstohavebeenatrailerforthepublicationoftheCBI’sextended
considerationoftheUK’srelationshipwiththeEU: Our Global Future: The business vision
for a reformed EU,ConfederationofBritishIndustry,London,2013.Thiscontinuesonthe
themeoftheseverelimitationsofSwissagreementswiththeEUonservices,pp.144–145,
ibid.
8.DoUKexportersneedaninsideradvantage?1 BalanceofPayments(MEI):Balanceongoods,OECD.StatExtracts:
http://stats.oecd.org/index.aspx?datasetcode=MEI_BOP
2 TheargumentputforwardbytheCBIthereforemakesperfecteconomicsensefromits
pointofview:thepaymentsmadebytheUKtaxpayertotheEUarereasonableandentirely
acceptable,whereastheregulatorycostsoftheEUpaiddirectlybytheirmembersarenot.
See Our Global Future, CBI, op.cit.
3 ‘IcelandandChinaEnteraFreeTradeAgreement’,New York Times,April15,2013.
‘China,SwitzerlandCompleteTradeTalks’,Wall Street Journal,May24,2013.
4 Times of India,16April2013
http://timesofindia.indiatimes.com/business/india-business/India-EU-open-new-round-of-
trade-negotiations-on-FTA/articleshow/19566574.cms
9.Acountrywithneitherheftnorclout1 p.16,Our Global Future,CBI,op.cit.
2 pp.76–77,ibid.
3 Theothercriteriaare,third,thewillingnessofthepartnercountriestoenterinto
negotiationsand,fourth,compatibilitywithSwissforeignpolicyobjectives.p.5,State
SecretariatforEconomicAffairs(SECO)byMarianneAbt,The Economic Relevance of Free
Trade Agreements with Partners outside the EU,Berne,2009:
http://www.seco.admin.ch/themen/00513/00515/01330/index.html?lang=en

Notes • 161
www.civitas.org.uk
4 pp.77,145Our Global Future,CBI,op.cit.
5 Huffington Post UK,2April2014
6 seewww.wto.orgTradePolicyReview:UnitedStates
7 TradeandInvestmentCooperationForumAgreement,www.ustr.govForabrief
accountofitsworkseeAn Overview of Switzerland’s Economic Role in the United States–
Switzerland: Trade and Investment Cooperation Forum:
http://www.ustr.gov/sites/default/files/US-Switzerland%20TIFA.pdf
8 p.77,Our Global Future,CBI,op.cit.
9 DetailsofthestakeholderfeedbackmeetingsofthepresentTTIPnegotiationsareat
Outreach – Update on the Transatlantic Trade and Investment Partnership (TTIP) – Third
Negotiation Round:
http://trade.ec.europa.eu/civilsoc/meetdetails.cfm?meet=11421
Over300lobbyistsattendedtheNovembermeeting,andsome130areregisteredforthe
mid-Januarymeeting,includingonefromtheCBI.Theyhavetwohoursbothtohearreports
fromthenegotiatorsandtoaskquestions.
10 TheDTI’sWebsiteforEurope&WorldTradeliststhe94IPPAsstillinforce:
http://webarchive.nationalarchives.gov.uk/+/http://www.dti.gov.uk/ewt/investment.htm
http://www.dti.gov.uk/ewt/investment.htm
Thetransitionarrangementsareexplainedin‘Regulation(Eu)No1219/2012ofThe
EuropeanParliamentandofTheCouncilof12December2012establishingtransitional
arrangementsforbilateralinvestmentagreementsbetweenMemberStatesandthird
countries’,Official Journal of the European Union:
http://eur-lex.europa.eu/LexUriServ/LexUriServ.do?uri=OJ:L:2012:351:0040:0046:EN:PDF
11 Atonepoint,theCBIarguesthathavingdelegatedthenegotiationofFTAstotheEC,
Britainisnolongerabletonegotiatethemsince‘…itwouldtaketimefortheUKtofirst
regrowthecapabilitytonegotiateFTAs’andtherewouldbe‘aperiodofdislocation–perhaps
formanyyears’,p.155,Our Global Future,op.cit
12 TheonlyspeckofevidencethatmightrelatetothequalityofanyFTAsisareferenceto
aKPMGreportwhichsuggestedthattheSwiss-ChinaFTAmightbeasymmetricalinsome
respectsi.e.moreaccessopportunitiesforChineseproductsinSwitzerlandthanvice versa.
p.145,CBI, Our Global Future,op.cit. Itisdifficulttoknowwhattomakeofthisremark.
SymmetricalFTAsare,forobviousreasons,rare.Asonotheroccasions,thisCBIdocument
ispuzzling.Itproudlyproclaimsendorsementsfrom16chiefexecutivesandchairmenof
leadingBritishandforeignmultinationalscompanies,froma‘challengeteam’ofacademics
andresearchersfromsixleadinguniversitiesandthinktanks,andwasadvisedbyaleading
multinationalconsultancy,McKinsey.Arewetoassumethatnoneofthemeveraskedfor
evidencethattheEUFTAswereofhighquality?Wouldtheyhaveacceptedthisargument,
withoutanyevidence,ifithadbeenputtothembyanyoftheirmanagers,stafforstudents?

www.civitas.org.uk
162 • Where’s The Insider Advantage?
10.MeasuringthebenefitsoftheEU’stradeagreements1 Baier,ScottL.,Bergstrand,JeffreyH.,2009,‘Estimatingtheeffectsoffreetrade
agreementsoninternationaltradeflowsusingmatchingeconometrics’,Journal of
International Economics,Vol.77(1),pp.63–76.
2 StateSecretariatforEconomicAffairs(SECO)op. cit.,en32, pp.4–8.
3 Forfurtherinformationandcopiesof18finalreports:
http://ec.europa.eu/trade/policy/policy-making/analysis/sustainability-impact-assessments/
CurrentlyoneisbeingundertakenfortheTTIPnegotiations.
4 http://trade.ec.europa.eu/doclib/docs/2010/november/tradoc_146955.pdf
5 CopenhagenEconomics,‘Ex-PostAssessmentofSixEUFreeTradeAgreements:An
econometricassessmentoftheirimpactontrade’,preparedfortheEuropeanCommission,
DGTrade,February2011:
http://trade.ec.europa.eu/doclib/docs/2011/may/tradoc_147905.pdf
6 ItaqaSarl,‘EvaluationoftheeconomicimpactoftheTradePillaroftheEU-Chile
AssociationAgreement:FinalreportfortheEuropeanCommission’,DirectorateGeneralfor
Trade,March2012:
http://trade.ec.europa.eu/doclib/docs/2012/august/tradoc_149881.pdf
Twoofthekeymethodologicalappendicesofthisstudy,thosetoChapters2&3,are
missingfromthewebversionofthereport,andIhavenotbeenabletoconsultthem.
Despitetheearliersix-nationstudy,thisreferstoitself,andisreferredtoelsewherebythe
EC,as‘thefirstwide-ranging,ex-postassessmentofaspecificbilateraltradeagreement
carriedoutattherequestoftheEuropeanCommission’,p.29,op.cit.Itmaybethefirst
‘wide-ranging’,and‘specific’assessment,butitisnotthefirstassessment.TheECmay
perhapshaveconsideredtheearliersix-nationassessmentcomparisonapilot.
7 p.99, ibid.
8 Astheauthorsofthesix-nationstudyputit:‘Theevolutionofbilateraltradebetweenthe
partnersinitselfisnotagoodindicatorofthesuccessofaFTA’.Copenhagen Economics,
op.cit.,p.6.GivenEC’spreferenceforpredictionsoffuturegainsfromitsFTAs,itmightbe
that,inanothercontext,themostimportantresultoftheChilestudywas‘…thatthetrade
impactsitcouldmeasuredifferedsubstantiallyfromthosepredictedintheex-anteECstudy
ofChile’.pp.84–86,Itaqa,op.cit.
9 pp.9–15,63–66,CopenhagenEconomics,op.cit.
10 pp.63–64,ibid;p.62,Itaqa,op.cit.
11 pp.58–63,Copenhagen Economics;p.53,62,Itaqa,op.cit
12 Athirdstudyisontheway.TheInvitationtotenderrelatedtoacontracttocarryoutan
evaluationoftheimplementationoftheEU-MexicoFreeTradeAgreementclosedonthe30
September2013:
http://trade.ec.europa.eu/doclib/docs/2013/august/tradoc_151698.pdf

Notes • 163
www.civitas.org.uk
13 Asithappens,intheonespecificcomparisonmadebetweentheinvestmentprotection
clausesoftheEUFTAwithChileandearlierindependently-negotiatedagreements,the
Itaqaresearchersdecidedthat:‘EUinvestorswouldactuallybelessprotectedthaninvestors
fromothercountriesthathavesignedagreementswithChiletoregulateinvestments…’
p.112,Itaqa,op.cit, suprafn53
14 Themanufacturedandagriculturalexportsofthe28membercountriesaremore
interchangeable,moreeasilyplacedinstandardizedWTOcategoriesthantheirservices
andhencecanbemorereadilydiscussedintradenegotiations.Servicesfrequentlyinvolve
professionalpersonnel,whosecorporateinstitutionsandinterrelationshipsarehighly
distinctivetoeachmembercountry.Indeed,tolargeextenttheydefinethenationalcharacter
ofmembercountries,andaretheproductofuniquerelationshipsbetweenthestate,
practitionersandeducationalinstitutionsthathavebeencreatedandevolvedovercenturies
ineachofthem,andwhichtheircurrentmembersareusuallypreparedtodefend.FTAs
inservicesarethereforeonlylikelytobesuccessfullynegotiatedwhentheprofessional
institutionsofthe28membercountrieshavebeen‘harmonized’toafargreaterdegree
thantheycurrentlyare.Anegotiationbetweentwocountriesis,bycontrast,likelytobea
muchsimplermatter,whichis,oneguesses,whySwitzerlandhasmanagedtoincorporate
servicesinsomanyofitsFTAs.However,thereis,asfarasIknow,nodetailedcomparative
analysisofthecontentoftheserviceelementofSwissFTAsversusthoseoftheEC.
11.OntheopportunitycostsofEUsolidarity1 TimCongdon,How much does the European Union cost Britain?UKIndependence
Party,London,2012:
http://www.timcongdon4ukip.com/docs/UKIP%20Cost%20of%20the%20EU.pdf
2 GiventhearmlockthatSwissagriculturalinterestshaveontheirtradenegotiators,the
likelihoodisthattheUKwouldhaveenteredmorenegotiations,andconcludedthem,more
rapidlythantheSwiss.
3 InhisappearancebeforetheCommonsEuropeanScrutinyCommitteementioned
above,theUKPermanentRepresentativetotheEUdescribedtheprocessofnegotiation
thatprecedesEUlegislation.‘Therearemanyindividualelementsoflegislationthatwe
wouldnothaveputinbutwhenwelookattheoverallproposal,thejudgmentisthatthe
overallcompromise−Iamafraiditisvirtuallyalwaysacompromisebecausethatisthe
natureoftheEuropeanUnion−isonewecanaccept,exceptinthecaseswhereMinisters
say“No,voteagainst”andwevoteagainst.’OralEvidence,SirJonCunliffe,European
ScrutinyCommittee,MinutesofEvidence,HC109-IHouseofCommons8May2013.Trade
negotiationsarepresumablysimilar:
http://www.publications.parliament.uk/pa/cm201314/cmselect/cmeuleg/c109-i/c10901.htm
www.civitas.org.uk
164 • Where’s The Insider Advantage?
4 de factoonlytwo,sinceSwitzerlandnegotiatesonbehalfofLiechtenstein,andits
agreementsapplytoboth.Unfortunately,onecannotuseNorwayasasecondexample
oftheopportunitiesopentoanationthatnegotiatesFTAsonitsownbehalfbecauseit
hasdeclinedtodoso.Ratherthanvigorouslydefenditsowninterestsinthemannerof
theSwiss,ithaspreferredtofollowtheEUasmuchaspossible,andmaintainalevel-
playingfieldwithEUmembers,inthehopeperhapsthatitwillbereadyforimmediateEU
membershipwhentheelectoratechangesitsmindinafuturereferendum.
5 Though‘technicaldiscussionswillhavetobecompletedsoastofinalisethelegaltextof
theagreement’.See:
http://europa.eu/rapid/press-release_IP-13-972_en.htm
6 ‘FranceLiftsBlockonEU-USTradeNegotiations’Euronews15June2013:
http://www.euronews.com/2013/06/15/france-lifts-block-on-eu-us-trade-negotiations/
7 ibid.
8 Itseemsunlikelythatitwillbediscussed,orevenmentioned,again.Accountabilityhas,
onemightsay,beensuppressedintheinterestsofsolidarity
12.UKexportstonewmemberstates1 pp.2,10,19,Twenty Years On,op.cit
13.AfinallookattheUKversus11outsiders1 Sevenofthesebilateralagreementsaresummarizedat:
http://www.vorarlberg.at/english/vorarlberg-english/regions_europe/europe/eu-
switzerland_sevenbilat.htm
Part II: The impact of the EU on foreign direct investment in the UK from 1970 to 2011 • 164
Introduction1 ChristopherHuhneandNickCanning,Crystal Balls: false prophecies from anti-
European economists,BritaininEurope,nd,2002ca,pp.22–26.
2 Anenlargedversionofhisreportappearedonhiswebsite.‘BigBusinessDeeply
TroubledByCameron’sVeto’,RobertPeston,11December2011.
3 SirJohnMajor,‘TheReferendumonEurope:OpportunityorThreat?’,ChathamHouse,
14February2013.Hehascontinuedinthesameveinandclearlyintendstorelyonhis
intuitionsratherthanlookatanyevidence.AtanInstituteofDirectors’dinnerinNovember
2013,hepronouncedconfidently:‘Wewouldloseinwardinvestment–askJapanorKorea,
Notes • 165
www.civitas.org.uk
orevenAmerica.’Andheleftitatthat.
www.johnmajor.co.uk/page4370.html
attheInstituteofDirectorson28November2013.Hemightperhapshaveglancedat
page35ofErnst & Young’s attractiveness survey, UK 2013,whoseresearchersdidask
companiesinJapan,KoreaandAmerica.‘Thepicturethatemergesfromourresearchis
thatEuropeancompaniesregardtheUK’sintegrationintotheEUasbeingimportanttothe
country’sattractivenessforFDI,whilethoseintheUSandAsiadonot.’
4 ‘BritainwarnedbyDublinoverEuropeexit’,Financial Times,10March2013
5 ibid.
6 http://www.oecd.org/investment/globalforum/44246319.pdf
7 p.232002World Investment Report,UNCTAD.
8 CarlosRodríguez,CarmenGómezandJesúsFerreiro,‘Aproposaltoimprovethe
UNCTAD’sinwardFDIpotentialindex’,Transnational Corporations,Vol.18,No.3,2009:
http://ea5.codersnest.com/images/files/Ferreiro1.pdf
9 European headquarters: Location decisions and establishing sequential company
activities,Finalreport,Ernst&Young,Utrecht,2005.
10 AppendixTable2b,p.60,
11 Irequestedanexplanationofthediscrepanciesfromthehelplinesofbothagencies,but
havethusfarnotreceivedareply.
12 Inthecourseoftheseinitialcross-checks,andfollowingemailexchangeswithSigrún
DavíðsdóttirtheLondoncorrespondentofIcelandicRadio,theUNCTADdataforIceland
overtheyears1989to2011wasalsocheckedagainstthatissuedbytheCentralBank
ofIceland,whichrevealedlargediscrepanciesbetweenthetwo.Bothwereapproached
forclarification.TheCentralBankinsisteditsfigureswerecorrect,and,aftersomeemail
exchanges,UNCTADconcededthatitsfigureswouldbecorrectedinaccordancewiththose
oftheCentralBankinfuturepublications.Thefiguresusedinthisinvestigationaretherefore
notthoseprovidedintheUNCTADdatabaseuptoApril2013(withafinalreportedyearof
2011)butthosepublishedontheCentralBankofIceland’swebsite:
http://statistics.cb.is/en/data/set/
SeeForeigndirectinvestmentpositioninIceland:TotalFDIposition&TotalFDIflows.
13 OECDBenchmark Definition of Foreign Direct Investment,FourthEdition,OECD,Paris,
2008Accessthecompletepublicationat:
http://dx.doi.org/10.1787/9789264045743-en
14 FDIinfiguresOECDParis,January2013,andpersonalcommunicationEmilie.Kothe@
oecd.org
15 NigelWilliams,Trade Distortions and the EU,Civitas:InstitutefortheStudyofCivil
Society,London,2011.07/2011:
http://www.civitas.org.uk/eufacts

www.civitas.org.uk
166 • Where’s The Insider Advantage?
16 http://www.centralbank.ie/polstats/stats/fvc/Pages/fvc.aspx
Sinceitbeganreportingthesefigures,Ireland’sshareofthetotalassetsofallFVCsand
FSVsintheeuroareahasdeclinedfrom24.2%inQ22011to21.9%inQ32012.Theother
countrieswithsignificantsharesareNetherlands,Luxembourg,SpainandFrance.The
aggregatefiguresfortheentireeuroareaaregivenintheStatisticalDataWarehouseof
ECB:
http://sdw.ecb.europa.eu/
17 http://cdis.imf.org
and
http://www.imf.org/external/NP/ofca/OFCA.aspx
18 InvestmentCountryProfiles:Switzerland,UNCTAD,Oct2011.
19 Table2.3,rowHBWI,‘Summaryofinternationalinvestmentposition,financialaccount
andinvestmentincome’,OfficeofNationalStatistics,The Pink Book 2012,Cardiff,2012,pdf
page42.
20 p.104,Table10.1;p.106,Table10.3,rowHBWI,OfficeofNationalStatistics,The Pink
Book 2002,HMSO,London,2002.
21 Pink Book 2012, op.cit.,p.1.
22 http://elibrary-data.imf.org
TheIMFalreadyprovidesacatalogueofthe28OffshoreFinancialCenters,manyofthemin
receiptofveryhighamountsofFDI,withalmost100%goingtoSPEs.However,wearehere
concernedwithSPEswithinnormaltradingcountries.
23 Since1996,thedatacollectedbyE&Y’sEuropean Investment Monitoroffersapotential
solutiontothisproblem–atleastforrecentyears.Itsfiguresarebasedoncompany
announcementsaboutnewinvestmentsacrossEuropeandcompaniesareunlikelyto
announcebypressreleasethattheyintendtoestablishanSPEinaparticularcountry.
Theonlydisadvantageisthatmuchofthisevidenceisforthebenefitofpayingcommercial
clientsandremainsconfidential.Itcannotthereforecontributeagreatdealtopublicdebate.
24 OneincidentaladvantageofomittingBelgiumisthatitallowsstraightcomparisonswith
OECDdatawithoutmakingthereconstructionsneededtoseparatereturnsforBelgiumfrom
thoseofLuxembourgpriorto2002.Untilthatyear,thetwocountriesmadeonlyjointreturns
totheBelgo-LuxembourgEconomicUnion.InanFDIcontext,atleast,thesereconstructions
arehighrisk.
25 UNCTADstatInwardandoutwardforeigndirectinvestmentflows,annual,1970–2011
US$atcurrentpricesandcurrentexchangeratesinmillions.
26 ‘ShareofInternationaltradeinGDP’,[email protected]:
http://www.oecd-ilibrary.org/economics/data/oecd-factbook-statistics_factbook-data-en
27 HMTreasury,‘EUMembershipandFDI’.ThisisoneoffiveinternalTreasuryanalyses

Notes • 167
www.civitas.org.uk
ofthirdpartyassessmentsofthecost-benefitsofEUmembership.Theywerereleasedin
2010,apparentlyasaresultofanFOIrequest,thoughtheydonotindicatewhichthirdparty
isbeingassessed,orwhomadetheFOIrequest.Thispaperhas21pages,andisundated,
butwasapparentlycompletedin2005:
https://www.gov.uk/government/publications/treasury-analysis-of-third-party-assessments-of-
cost-benefit-analyses-of-eu-membership
28 Foramountainofevidencetodemonstratetheimportanceofproximityin
determiningtraderelationshipsseePankajGhemawatwithStevenA.Altman,DHL Global
Connectedness Indexof2011:
http://www.dhl.com/content/dam/flash/g0/gci/download/DHL_GlobalConnectednessIndex.pdf
Thecentralpropositionofthemostpopulartheoryofinternationaltrade,theso-calledgravity
theory,isthattradebetweentwocountriesisproportionaltotheirnationalincomeand
inverselyproportionaltotheirdistancefromoneanother.
1.DidentrytotheCommonMarketin1973boostFDIintheUK?1 UNCTADwill,however,runspecialanalyses,byrequest,inreturnforasuggested
donation.Thesuggesteddonationfollowingmyrequestwas$6,938.Ihavethusfar
declined,andnotsimplybecauseIdidnothavethedollarstohand.Oneofthepurposesof
thepresentinvestigationwastoshowthatthoughHMGovernmenthasdeclinedtoprovide
thedatatosupporttheclaimsofvariousministersandprimeministersabouttheEU,the
ordinaryvotermightneverthelessstillobtainitfromreadilyaccessiblesources,andthatany
argumentsinthisresearchcouldbecheckedinthesamereadilyaccessiblesources.
2 Forinstance,thevalueofDenmark’s1980stock,was7.5%ofitsvaluein2011,
measuredinconstantUS$(1980),whileIreland’swas39.8%,andtheUK’swas14.4%.
3 Curiouslyenough,thisswitchdidnotcauseasuddenjumpeitherinthepercapita
amountorthedecade-to-decadegrowthoftheindependentcountries.Bothwouldhave
beensubstantiallyhigherifwehadcontinuedwiththeoriginalfivecountries,thoughthis
disparitywouldhavebeenstrikinglyreversedoverthefourthdecade.
4 Article188Creads:‘Thecommoncommercialpolicyshallbebasedonuniform
principles,particularlywithregardtochangesintariffrates,theconclusionoftariffand
tradeagreementsrelatingtotradeingoodsandservices,andthecommercialaspectsof
intellectualproperty,foreign direct investment,theachievementofuniformityinmeasuresof
liberalisation,exportpolicyandmeasurestoprotecttradesuchasthosetobetakeninthe
eventofdumpingorsubsidies.Thecommoncommercialpolicyshallbeconductedinthe
contextoftheprinciplesandobjectivesoftheUnion’sexternalaction.’[Emphasisadded]
ThefullscopeofArticle188ChasneverbeendeterminedbytheECorbytheEuropean
Court,andnodoubtwilltakemanyyearstodoso,butactionstoimposecommonEUrules

www.civitas.org.uk
168 • Where’s The Insider Advantage?
forincentivestopromoteinwardFDIarenotintheleastunrealistic,thoughforthemoment
actionunderArticle188Cappearstorequireunanimity.InitsAugust2013updateon‘Trade
andInvestmentagreements’,theECproudlyannouncedthatthenegotiatingdirectives
ithaddraftedfortheCounciltoapprovebeforetalkswithChinabegin‘isthefirstever
proposalforastand-aloneinvestmentagreementsinceforeigndirectinvestmentbecame
theexclusivecompetenceoftheEUundertheLisbonTreaty’.The EU’s bilateral trade and
investment agreements – where are we?p.4:
http://trade.ec.europa.eu/doclib/docs/2012/november/tradoc_150129.pdf
5 Notquiteentirelyeliminateditseems.TheOECDclassdescriptionreads:‘Extraction
ofcrudepetroleumandnaturalgas;serviceactivities,incidentaltooilandgasextraction,
excludingsurveying.’ThemeanpercentageofUKFDIgoingtooilandgasovertheyears
1989–2011was16.9%,abouthalftheproportionofNorway’s.
6 ‘Services’was,bysomedistancethelargestrecipientindustry,with44%ofthetotal.
Manufacturingofvariouskindsreceived7%,trade4%,banks3%andinsurance2%.
Theremainingproportionswenttochemicals,electronics,machinery,constructionand
transportation.
7 ThisargumentwillcomeasnoparticularsurprisetotheresearchstaffoftheEuropean
Commission.Aslongagoas2007,oneoftheirreportsnotedthat:‘WhileEuropean
integrationseemstobeassociatedwithanincreaseofintra-EUFDIactivity,theavailable
evidencesuggeststhattheInternalMarkethasnotbeenabletodeliverintermsof
promotingfurthertheroleoftheEUwithrespecttoglobalinvestmentflows…Since2001
thevolumeofFDIfromtherestoftheworldintotheEU25hasgraduallydeclined…until
2005whenitrecoveredslightly…TheInternalMarket’stwo-foldobjectiveofmaking
theEUamoreattractiveplaceforforeigninvestorsandofboostingthepresenceand
competitivepositionofEUfirmsinworldmarketsseemsfarfrombeingachieved.’Fabienne
llzkovitz,AdriaanDierx,ViktoriaKovacs&NunoSousa,Steps towards a deeper economic
integration: the Internal Market in the 21st Century – a contribution to the Single Market
Review,EuropeanCommission–DGEcFin;EuropeanEconomyNo.27,2007,p.49.
2.DiddecliningtojointheeuroadverselyaffectFDIintheUK?1 StandardEurobarometer57,Fig.6.3b,Surveyno.57.1–FieldworkMarch–May2002:
http://ec.europa.eu/public_opinion/archives/eb/eb57/eb57_en.pdf
2 AllthesequotationsaretakenfromPeterOborneandFrancesWeaver,Guilty Men,
CentreforPolicyStudies,2011.Theygivethedatesofthecolumnsfromwhichtheyare
taken.
3 Inhismemoirs,Blairrejectsthisversionofevents.‘InprincipleIwasinfavourandfor
methepoliticswereclear:bettertojoinandbefullplayersinEurope’seconomicdecision-
making…Thetroublewastheeconomiccasewasatbestambiguous…Iftheeconomics
Notes • 169
www.civitas.org.uk
hadchanged,Iwouldhavegoneforit.Theydidn’t.Andformethatwasthat.’TonyBlair,
A Journey,Hutchinson,London,2010,p.536.Hefooledeverybody,oneistemptedtosay,
includinghisfellowcampaignersandsupporters.
4 Huhne&Canning,op.cit.
5 RichardLayard,WilliamBuiter,ChristopherHuhne,WillHutton,PeterKenenandAdair
TurnerwithaforwardbyPaulVolcker,Why Britain should join the euro,BritaininEurope,
London,2002:
www.britainineurope.org.uk
6 ibid.,p.24
7 ThesedatesoftheEconomistIntelligenceUnitareinferred.Sincethepublicationhas
nodate,andthetextrefersto‘thisyear’,‘nextyear’etc.
8 Here,andinthesectionthatfollows,EU13willbeused,andreferstotheEU15of
2000,minusBelgiumandLuxembourg.ItisnotclearwhatnumberofEUmemberstates
BritaininEuropewasreferringto−probablyEU14,sincetherewasnodataforLuxembourg
until2002.
9 ThepublicationofthelatterwasfollowedbycelebrationsatUKTrade&Investment,
thegovernmentagencyresponsibleforpromotingFDI.Itsannualreportfor2012pointed
outthattheincreaseinFDIintheUKovertheyearmeantthattheUKnotonly‘retainedits
numberonepositioninEurope’,butcontrastedsharplywithsignificantdeclinesinFDIin
bothGermanyandFrance.UKTI,Inward Investment Report 2012/13:
http://www.ukti.gov.uk/
10 Seepp.87–88
11 TheNetherlandsissuspectedofhavinghadaratherhighproportionofSPEsinthe
past.However,ithasrecentlybecomeoneofthefirstcountriestoreportitsFDItotheOECD
minusSPEs,sofurtherresearchwouldberequiredtodeterminewhetherthisisarealor
nominaldecline.
12 This1%falldiffersfromthe3%inTable6becausethenumberofEUcountriesinthe
calculationdiffers,suggestingthattheapparentdeclineintheUKsharewasinfluencedby
thepresenceofBelgium,whoseFDIreturnswerestronglysuspectedofbeingdistortedby
theinclusionofSPEs.
13 Table1bAppendix.MoreoverOECDshowsanincreasein2011forNorway,theother
largeindependentEuropeancountry.Thethreenon-eurocountrieswouldthereforehave
endedcomfortablyaheadoftheothertwogroups.
14 Ifwehadmeasuredthegrowth,inUS$(1986),from2000insteadof1999,to2011it
wouldhavebeen75%whichisstillbelowtheweightedmeanoftheEurozone11,butnotas
farbelowas11%.
15 Iftheweightedmeansofcolumn3aresubtractedfromthoseofcolumn4,itmaybe

www.civitas.org.uk
170 • Where’s The Insider Advantage?
seenthat,overthelifeoftheeuro,foreigninvestorsinvestedUS$(1986)6,301inevery
inhabitantintheeurozoneandUS$11,801ineveryinhabitantofthenon-euroEuropean
countries.
16 SomeotherbitsofevidencementionedintheBritaininEuropepamphletarediscussed
intheAppendixC.
3.HastheSingleMarketattractedFDItotheUK?1 en.wikipedia.org/wiki/Britain_in_Europe
2 IreferagaintothemountainofevidenceassembledbyPankajGhemawatwithSteven
A.Altman,DHL Global Connectedness Indexof2011.Seenote28,p.167,supra.
3 Monthly Statistics on International Trade, Dataset: trade in value by partner countries,
United Kingdom.SinceexportstoBelgiumandLuxembourgwerenotrecordedfrom1960–
1993,importsfromtheUKrecordedbytheBelgiumandLuxembourgEconomicUnionwere
substitutedovertheseyears.Bothdatabasesareat:
www.oecd.ilibrary.org
IhaveexaminedthisdatainmoredetailinmypaperWhere’s The Insider Advantage? A
comparative study of UK exports to EU and non-EU nations between 1960 and 2012:
http://www.civitas.org.uk/pdf/insideradvantage.pdf
4 ThesourcetheyciteforthisclaimisUKInvest,‘AGuidetoForeignInvestment’,
London,2005.
5 An Indispensable Relationship, op.cit,p.43,
6 Obviously,ifbothpartsoftheEUproject,theeuroandtheSingleMarket,had
performedastheirsupportersclaimed,thetaskofthisinvestigationwouldbemuchsimpler,
sincethebenefitsforthosecountriesthatweredoubly-blessed,meaningmembersofboth
euroandtheSingleMarket,wouldbedoubly-easytoidentify.
7 ThecontrastbetweenthesefiguresonthegrowthofFDIstockandthoseonthe
precedingpageonthevalueofinflowsoverthesameperiodsuggeststheratiobetween
thetwovariesenormouslyindifferentdestinationcountries(UICs).InSwitzerland,for
instance,thepercapitavalueoftheinflow1993–2011wasamere39%oftheincreasein
thevalueofthestockovertheperiod,whileinGermanyitwas123%andintheUK138%.
Thereasonsforthisdifferenceareunknown.Atfirstglance,itsuggeststhatinvestmentsin
somedestinationcountriesaremoreprofitablethaninvestmentsinothersand/orthatsome
countriesaremorelikelytoattractre-investmentofearnings,whileinothersearningsare
speedilyrepatriated.Thereis,asfarasIamaware,noresearchonthisimportantaspectof
FDI.
8 Euroscepticswillnodoubtnoticetheironyinthisfinding,anddrawcomfortand
encouragementfromit.WhensimilarlymeasuringUK’spercapitaFDIgrowthasanoutsider
sincethelaunchoftheeuro(inTable9,p.120),UKgrowthwashigherthantheeurozone

Notes • 171
www.civitas.org.uk
mean,whilehere,measuringgrowthasanEUinsider,alongsideotherfoundermembersof
theSingleMarket,growthislowerthantheEUmean.
9 InUS$(1993),themeanwas$16,345andthestandarddeviation$15,834.
10 Itwentontosaythat‘EMU,like1992,(meaningtheSingleMarket)isapositivesum
game’,pp.9&31,One Market, One Money: an analysis of the potential benefits and costs of
forming and economic and monetary union.EuropeanEconomy,No.44,Commissionofthe
EuropeanCommunities,D-GforEconomic&FinancialAffairs,October,1990:
http://ec.europa.eu/economy_finance/publications/publication7454_en.pdf
11 Forexample,pp.9,10&119,EuropeanCompetitivenessReport2012,Reaping the
benefits of globalization,EuropeanCommission,2012:
http://ec.europa.eu/enterprise/policies/industrial-competitiveness/competitiveness-analysis/
european-competitiveness-report/index_en.htm
12 European headquarters: Location decisions and establishing sequential company
activities,Finalreport,Ernst&Young,Utrecht,2005.Switzerlandhasotheradvantages.
Itcansignitsowntradeagreements.AftersigningafreetradeagreementwithChinain
May2013,italsosigned‘araftofcooperationdeals…including…financialsectorties.’
Inresponsetospeculationthatselectedoffshorecentrescouldbechosen(byChina)as
currencytradinghubs,theAFPcorrespondentspeculatedthatSwitzerland‘…hopesto
bepicked’.SincetheEUhasnotevenbegunfreetradenegotiations,itprobablyhasa
goodchance,hethought.‘SwissfreetradedealunderscoresChina’sglobalisation:Li’by
JonathanFowler,AFP,24May2013:
https://uk.news.yahoo.com/swiss-free-trade-deal-underscores-192815812.html#seotJwc
ThemeritsofSwitzerland’sbilateraltradeagreementsareexaminedindetailabove,
pp.39–44
13 In1999theNationalInstituteofEconomicandSocialResearch(NIESR)publisheda
reportsayingthat3millionjobsintheUKareinvolvedinexportingtotheEU.Thiswas,in
ChristopherBooker’saccount,‘pickedupbyBritaininEuropeasthebasisforitsslogan
“outofEurope,outofwork”,anditsclaimthatifwelefttheEU…3millionjobswouldbelost.
ThiswassuchatravestyofwhattheNIESRactuallysaid…thatitsdirectorcalledit“pure
Goebbels…inmanyyearsofacademicresearchIcannotrecallsuchawilfuldistortionof
thefacts”.’ChristopherBooker‘EvenUKIPmissesthekeypointinthistireddebateover
Europe’,Daily Telegraph,29Mar2014.AcontributortotheNIESRreport,ProfessorIain
Begg,hasalsocommentedonthemisuseofthereport’sfindingthat‘threemillionjobswere
associatedwithEUdemand,’addingthatthisisnot‘thesameassayingthatthesejobs
woulddisappearifwelefttheEU’.Daily Telegraph,23Jan2013.
14 p.39,para3.14HMGovernment,2013,note19supra.TheCBIrecentlyaddedsome
supportivecommentsabouttheUKasagatewayonthestrengthofaE&Ysurveyofactual
andpotentialinvestorsin2012whichfoundthatthe‘abilitytousetheUKasabasetoexport

www.civitas.org.uk
172 • Where’s The Insider Advantage?
toothermarkets’wasthesecondmostmentionedfactorofnineinfluencingthedecisionto
investintheUK.ConfederationofBritishIndustry,Our Global Future: The business vision
for a reformed EU,London,2013,p.64.Thiswouldhavebeenalittlemorepersuasiveifthe
E&YsurveyhadreferredtootherEUmarketsratherthansimplytoothermarkets.Inthe
2013E&Yattractivenesssurveyofthe14factorsthatmaketheUKattractiveforexisting
orpotentialinvestors,theexportbaseforothermarketsisnotmentioned,northeUKas
agateway,norindeedanythingthatrelates,evenvaguely,totheEU.Ernst & Young’s
attractiveness survey, UK 2013: No room for complacency,London,2013,p.26:
http://www.ey.com/Publication/vwLUAssets/Ernst-and-Youngs-attractiveness-survey-UK-
2013-No-room-for-complacency/$FILE/EY_UK_Attractiveness_2013.pdf
4.Asummaryofthefindingswithshortanswerstothethreequestions1 pp.83–90,above
2 Thoughbytwoothermeasures,comparingninepre-andpost-euroyears,theshare
ofUKFDIinflowstotheEUremainedvirtuallythesame,accordingtobothOECDand
UNCTAD.Perhapsatthispoint,itshouldberememberedthattheOECDrecordsinflowsfor
theUKwhichare,onaverageovertheyears1990–2011,eightpercenthigherthanthose
reportedbyUNCTAD.p.83,aboveandAppendixA,Table11,pp.146–147.
3 Onepossibleexplanationisthatinpost-World-War-IIdecades,outwardFDIwas
overwhelminglyfromtheUSanditspreferreddestinationwas,alsooverwhelmingly,the
UK.Initially,atleast,thesecondmajorsourceofFDIinEurope–Japan−seemstohave
followedtheAmericanexample.ThedeclineinUKsharemaythereforesimplyreflectthe
lateremergenceofothersourcesofFDI,andthegradualrecognitionofotheracceptable
destinations.Butthisisguesswork.Obviously,itisasubjectworthyofresearch.
4 EvidenceconsistentwiththisconclusionistobefoundinErnst&Young’sAttractiveness
Surveyfor2013.Theynotethattheir‘parallelresearchstudyonGermany’sattractiveness
suggeststhatinvestorsworldwidearenotconvincedthatmembershipoftheEurozone
makesGermanymoreattractiveasanFDIlocation.Only42%ofinvestorssaythattheeuro
currencyisapositivestrengthforGermany’sattractiveness,while35%areneutraland20%
regarditasaweakness.Whilejustoverhalf(52%)ofexistinginvestorsintoGermanyrate
theeuroasastrength,onlyaquarterofinvestorsnotestablishedinGermanysharethis
view.’Ernst&Young,Attractiveness Survey,UK2013,op.cit,.p.35.Theseresponsesmay,
ofcourse,betimesensitive.
5.OnclaimsandwarningsabouttheFDIindebatesabouttheEU1 Therewas,asfarasIcandiscover,ratherlittlemediacoverageoftheeuphoricUKTI
reporton23rdJuly2013ofthespurtinFDIintheUK.Seenote9,p.169,supra