when less is more
TRANSCRIPT
NATURE BIOTECHNOLOGY VOLUME 25 NUMBER 8 AUGUST 2007 853
When less is moreBruce L Booth
An analysis of recent returns from venture-backed biotech firms reveals that companies receiving the most financing do not necessarily deliver the best returns.
Investors are pouring cash into biotech com-panies today at a pace near historic highs.
Young biotech companies eager to grow and to fund their pipelines are aggressively raising larger amounts of capital from an increasingly diverse set of investors. However, in contrast to biotech’s traditional ‘raise as much as you can’ thinking, larger financings are not necessarily the best path to superlative returns. In fact, great returns are most commonly linked to superior capital efficiency: progressing high-potential drug programs or platforms through value inflection points (e.g., from preclinical candi-date through clinical proof-of-concept) while burning less capital than their competitors. In the presence of so much capital, and given the ease with which less value-added uses can be found, biotech investors and entrepreneurs should vigilantly manage their company’s cash needs and proactively focus on exploiting their startup’s intrinsic capital-efficiency advantages. Amid an abundance of capital, the path to great returns is using less of it.
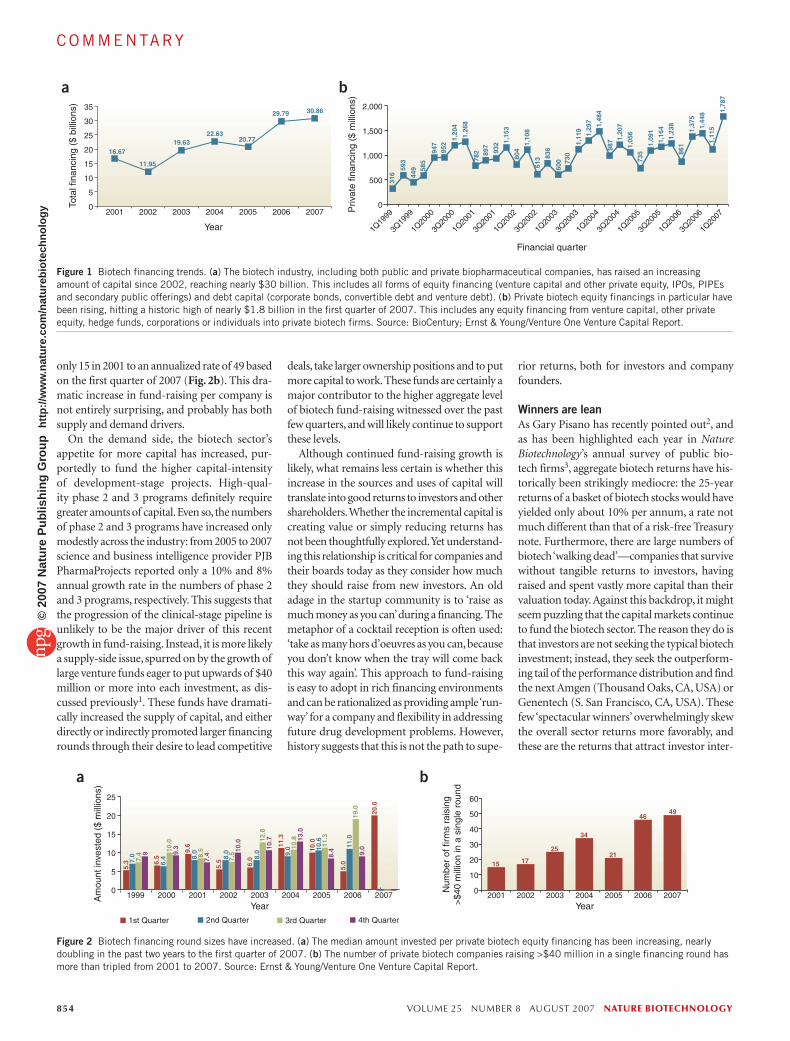
Never had it so good?The fund-raising environment for biotech com-panies has rarely been so good. According to the biotech industry research firm and publisher BioCentury, in the first quarter of 2007, public and private biotech fund-raising exceeded $7.7 billion in new capital. This continues an upward trend following the 2002 nadir in the biotech market (Fig. 1).
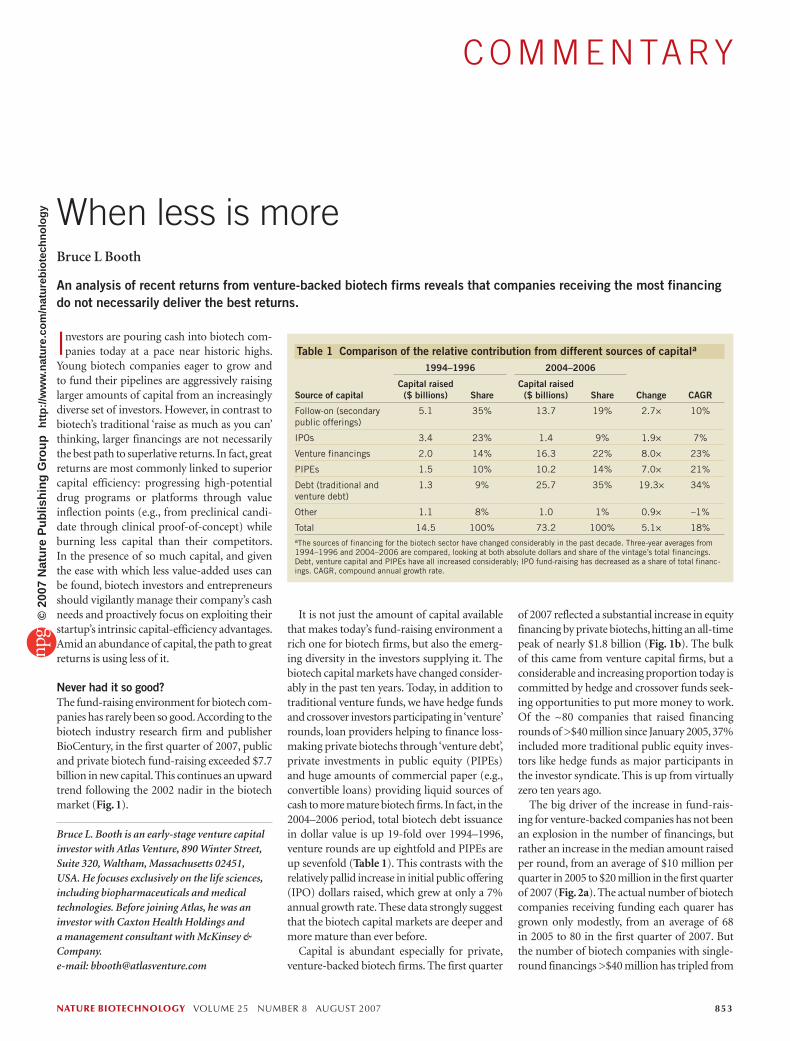
It is not just the amount of capital available that makes today’s fund-raising environment a rich one for biotech firms, but also the emerg-ing diversity in the investors supplying it. The biotech capital markets have changed consider-ably in the past ten years. Today, in addition to traditional venture funds, we have hedge funds and crossover investors participating in ‘venture’ rounds, loan providers helping to finance loss-making private biotechs through ‘venture debt’, private investments in public equity (PIPEs) and huge amounts of commercial paper (e.g., convertible loans) providing liquid sources of cash to more mature biotech firms. In fact, in the 2004–2006 period, total biotech debt issuance in dollar value is up 19-fold over 1994–1996, venture rounds are up eightfold and PIPEs are up sevenfold (Table 1). This contrasts with the relatively pallid increase in initial public offering (IPO) dollars raised, which grew at only a 7% annual growth rate. These data strongly suggest that the biotech capital markets are deeper and more mature than ever before.
Capital is abundant especially for private, venture-backed biotech firms. The first quarter
of 2007 reflected a substantial increase in equity financing by private biotechs, hitting an all-time peak of nearly $1.8 billion (Fig. 1b). The bulk of this came from venture capital firms, but a considerable and increasing proportion today is committed by hedge and crossover funds seek-ing opportunities to put more money to work. Of the ~80 companies that raised financing rounds of >$40 million since January 2005, 37% included more traditional public equity inves-tors like hedge funds as major participants in the investor syndicate. This is up from virtually zero ten years ago.
The big driver of the increase in fund-rais-ing for venture-backed companies has not been an explosion in the number of financings, but rather an increase in the median amount raised per round, from an average of $10 million per quarter in 2005 to $20 million in the first quarter of 2007 (Fig. 2a). The actual number of biotech companies receiving funding each quarer has grown only modestly, from an average of 68 in 2005 to 80 in the first quarter of 2007. But the number of biotech companies with single-round financings >$40 million has tripled from
Bruce L. Booth is an early-stage venture capital investor with Atlas Venture, 890 Winter Street, Suite 320, Waltham, Massachusetts 02451, USA. He focuses exclusively on the life sciences, including biopharmaceuticals and medical technologies. Before joining Atlas, he was an investor with Caxton Health Holdings and a management consultant with McKinsey & Company. e-mail: [email protected]
Table 1 Comparison of the relative contribution from different sources of capitala
1994–1996 2004–2006
Source of capital
Capital raised ($ billions)
Share
Capital raised ($ billions)
Share
Change
CAGR
Follow-on (secondary public offerings)
5.1 35% 13.7 19% 2.7× 10%
IPOs 3.4 23% 1.4 9% 1.9× 7%
Venture financings 2.0 14% 16.3 22% 8.0× 23%
PIPEs 1.5 10% 10.2 14% 7.0× 21%
Debt (traditional and venture debt)
1.3 9% 25.7 35% 19.3× 34%
Other 1.1 8% 1.0 1% 0.9× –1%
Total 14.5 100% 73.2 100% 5.1× 18%aThe sources of financing for the biotech sector have changed considerably in the past decade. Three-year averages from 1994–1996 and 2004–2006 are compared, looking at both absolute dollars and share of the vintage’s total financings. Debt, venture capital and PIPEs have all increased considerably; IPO fund-raising has decreased as a share of total financ-ings. CAGR, compound annual growth rate.
C O M M E N TA RY©
2007
Nat
ure
Pub
lishi
ng G
roup
ht
tp://
ww
w.n
atur
e.co
m/n
atur
ebio
tech
nolo
gy
854 VOLUME 25 NUMBER 8 AUGUST 2007 NATURE BIOTECHNOLOGY
only 15 in 2001 to an annualized rate of 49 based on the first quarter of 2007 (Fig. 2b). This dra-matic increase in fund-raising per company is not entirely surprising, and probably has both supply and demand drivers.
On the demand side, the biotech sector’s appetite for more capital has increased, pur-portedly to fund the higher capital-intensity of development-stage projects. High-qual-ity phase 2 and 3 programs definitely require greater amounts of capital. Even so, the numbers of phase 2 and 3 programs have increased only modestly across the industry: from 2005 to 2007 science and business intelligence provider PJB PharmaProjects reported only a 10% and 8% annual growth rate in the numbers of phase 2 and 3 programs, respectively. This suggests that the progression of the clinical-stage pipeline is unlikely to be the major driver of this recent growth in fund-raising. Instead, it is more likely a supply-side issue, spurred on by the growth of large venture funds eager to put upwards of $40 million or more into each investment, as dis-cussed previously1. These funds have dramati-cally increased the supply of capital, and either directly or indirectly promoted larger financing rounds through their desire to lead competitive
deals, take larger ownership positions and to put more capital to work. These funds are certainly a major contributor to the higher aggregate level of biotech fund-raising witnessed over the past few quarters, and will likely continue to support these levels.
Although continued fund-raising growth is likely, what remains less certain is whether this increase in the sources and uses of capital will translate into good returns to investors and other shareholders. Whether the incremental capital is creating value or simply reducing returns has not been thoughtfully explored. Yet understand-ing this relationship is critical for companies and their boards today as they consider how much they should raise from new investors. An old adage in the startup community is to ‘raise as much money as you can’ during a financing. The metaphor of a cocktail reception is often used: ‘take as many hors d’oeuvres as you can, because you don’t know when the tray will come back this way again’. This approach to fund-raising is easy to adopt in rich financing environments and can be rationalized as providing ample ‘run-way’ for a company and flexibility in addressing future drug development problems. However, history suggests that this is not the path to supe-
rior returns, both for investors and company founders.
Winners are leanAs Gary Pisano has recently pointed out2, and as has been highlighted each year in Nature Biotechnology’s annual survey of public bio-tech firms3, aggregate biotech returns have his-torically been strikingly mediocre: the 25-year returns of a basket of biotech stocks would have yielded only about 10% per annum, a rate not much different than that of a risk-free Treasury note. Furthermore, there are large numbers of biotech ‘walking dead’—companies that survive without tangible returns to investors, having raised and spent vastly more capital than their valuation today. Against this backdrop, it might seem puzzling that the capital markets continue to fund the biotech sector. The reason they do is that investors are not seeking the typical biotech investment; instead, they seek the outperform-ing tail of the performance distribution and find the next Amgen (Thousand Oaks, CA, USA) or Genentech (S. San Francisco, CA, USA). These few ‘spectacular winners’ overwhelmingly skew the overall sector returns more favorably, and these are the returns that attract investor inter-
0
5
10
15
20
25
30
35
2007200620052004200320022001
Year
Tota
l fin
anci
ng (
$ bi
llion
s)
16.67
11.95
19.6322.63
20.77
29.79 30.86
0
500
1,000
1,500
2,000
1Q20
07
3Q20
06
1Q20
06
3Q20
05
1Q20
05
3Q20
04
1Q20
04
3Q20
03
1Q20
03
3Q20
02
1Q20
02
3Q20
01
1Q20
01
3Q20
00
1Q20
00
3Q19
99
1Q19
99
Priv
ate
finan
cing
($
mill
ions
)
Financial quarter
316
593
449 58
5
947
952
1,20
4
1,26
8
782 89
7
932 1,
153
804
1,10
8
613 83
6
600 73
0
1,11
9
1,29
7 1,48
4
987 1,
207
1,05
6
735
1,09
1
1,16
4
1,23
8
861
1,37
5
1,44
81,
115
1,78
7
a b
Figure 1 Biotech financing trends. (a) The biotech industry, including both public and private biopharmaceutical companies, has raised an increasing amount of capital since 2002, reaching nearly $30 billion. This includes all forms of equity financing (venture capital and other private equity, IPOs, PIPEs and secondary public offerings) and debt capital (corporate bonds, convertible debt and venture debt). (b) Private biotech equity financings in particular have been rising, hitting a historic high of nearly $1.8 billion in the first quarter of 2007. This includes any equity financing from venture capital, other private equity, hedge funds, corporations or individuals into private biotech firms. Source: BioCentury; Ernst & Young/Venture One Venture Capital Report.
0
5
10
15
20
25
� 4th Quarter� 3rd Quarter� 2nd Quarter� 1st Quarter
200720062005200420032002200120001999Am
ount
inve
sted
($
mill
ions
)
Year Year
0
10
20
30
40
50
60
2007200620052004200320022001
Num
ber
of fi
rms
rais
ing
>$4
0 m
illio
n in
a s
ingl
e ro
und
5.3 7.
07.
4 9 9.3
7.4
10.0
10.7 13
.0
8.4 9.010
.0
8.5
7.5
12.8
10.8
11.3
19.0
6.4 8.
0
8.0
8.0 9.0 10
.6
11.0
6.5
9.6
5.5 6.0
11.3
10.0
5.0
20.0
15 17
25
34
21
4649
a b
Figure 2 Biotech financing round sizes have increased. (a) The median amount invested per private biotech equity financing has been increasing, nearly doubling in the past two years to the first quarter of 2007. (b) The number of private biotech companies raising >$40 million in a single financing round has more than tripled from 2001 to 2007. Source: Ernst & Young/Venture One Venture Capital Report.
COMMENTARY©
2007
Nat
ure
Pub
lishi
ng G
roup
ht
tp://
ww
w.n
atur
e.co
m/n
atur
ebio
tech
nolo
gy
NATURE BIOTECHNOLOGY VOLUME 25 NUMBER 8 AUGUST 2007 855
est. For an early-stage biotech, understanding the attributes of spectacular winners is therefore important for directing company strategy.
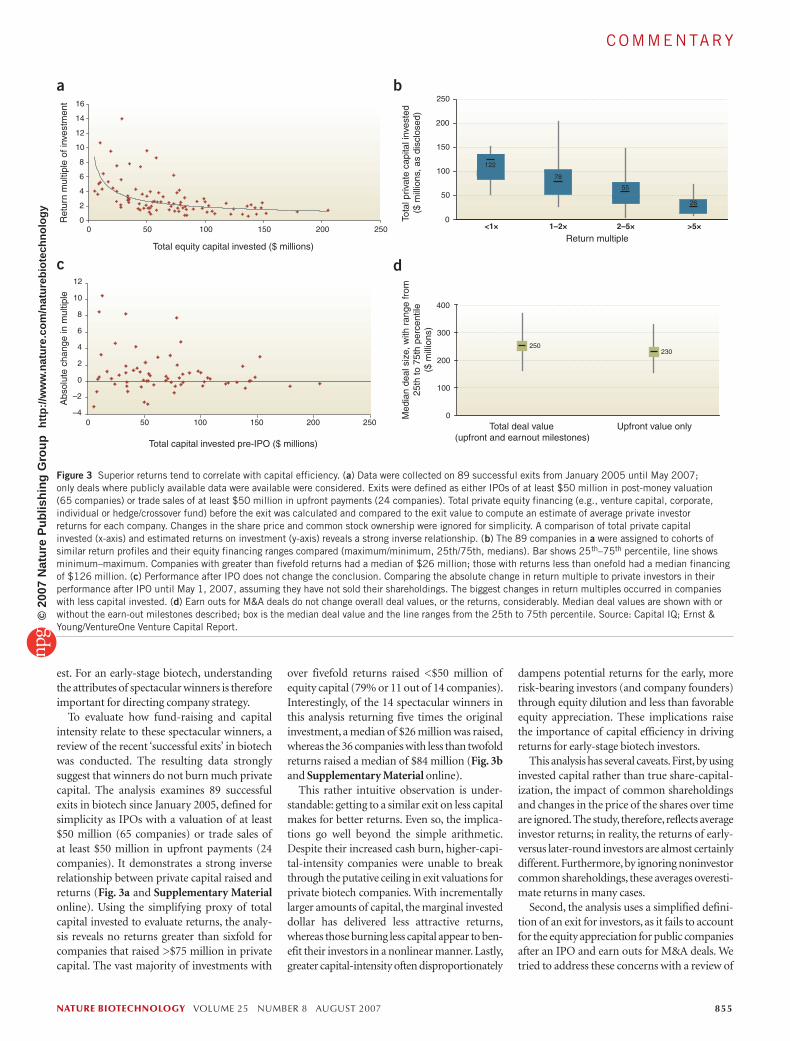
To evaluate how fund-raising and capital intensity relate to these spectacular winners, a review of the recent ‘successful exits’ in biotech was conducted. The resulting data strongly suggest that winners do not burn much private capital. The analysis examines 89 successful exits in biotech since January 2005, defined for simplicity as IPOs with a valuation of at least $50 million (65 companies) or trade sales of at least $50 million in upfront payments (24 companies). It demonstrates a strong inverse relationship between private capital raised and returns (Fig. 3a and Supplementary Material online). Using the simplifying proxy of total capital invested to evaluate returns, the analy-sis reveals no returns greater than sixfold for companies that raised >$75 million in private capital. The vast majority of investments with
over fivefold returns raised <$50 million of equity capital (79% or 11 out of 14 companies). Interestingly, of the 14 spectacular winners in this analysis returning five times the original investment, a median of $26 million was raised, whereas the 36 companies with less than twofold returns raised a median of $84 million (Fig. 3b and Supplementary Material online).
This rather intuitive observation is under-standable: getting to a similar exit on less capital makes for better returns. Even so, the implica-tions go well beyond the simple arithmetic. Despite their increased cash burn, higher-capi-tal-intensity companies were unable to break through the putative ceiling in exit valuations for private biotech companies. With incrementally larger amounts of capital, the marginal invested dollar has delivered less attractive returns, whereas those burning less capital appear to ben-efit their investors in a nonlinear manner. Lastly, greater capital-intensity often disproportionately
dampens potential returns for the early, more risk-bearing investors (and company founders) through equity dilution and less than favorable equity appreciation. These implications raise the importance of capital efficiency in driving returns for early-stage biotech investors.
This analysis has several caveats. First, by using invested capital rather than true share-capital-ization, the impact of common shareholdings and changes in the price of the shares over time are ignored. The study, therefore, reflects average investor returns; in reality, the returns of early- versus later-round investors are almost certainly different. Furthermore, by ignoring noninvestor common shareholdings, these averages overesti-mate returns in many cases.
Second, the analysis uses a simplified defini-tion of an exit for investors, as it fails to account for the equity appreciation for public companies after an IPO and earn outs for M&A deals. We tried to address these concerns with a review of
0
2
4
6
8
10
12
14
16
0 50 100 150 200 250
–4
–2
0
2
4
6
8
10
12
0 50 100 150 200 250
0
50
100
150
200
250
<1× 1–2× 2–5× >5×
0
100
200
300
400
Total equity capital invested ($ millions)
Total capital invested pre-IPO ($ millions)
Ret
urn
mul
tiple
of i
nves
tmen
tA
bsol
ute
chan
ge in
mul
tiple
Tota
l priv
ate
capi
tal i
nves
ted
($ m
illio
ns, a
s di
sclo
sed)
Med
ian
deal
siz
e, w
ith r
ange
from
25th
to 7
5th
perc
entil
e($
mill
ions
)
a b
c d
Total deal value(upfront and earnout milestones)
Upfront value only
Return multiple
122
78
55
26
250230
Figure 3 Superior returns tend to correlate with capital efficiency. (a) Data were collected on 89 successful exits from January 2005 until May 2007; only deals where publicly available data were available were considered. Exits were defined as either IPOs of at least $50 million in post-money valuation (65 companies) or trade sales of at least $50 million in upfront payments (24 companies). Total private equity financing (e.g., venture capital, corporate, individual or hedge/crossover fund) before the exit was calculated and compared to the exit value to compute an estimate of average private investor returns for each company. Changes in the share price and common stock ownership were ignored for simplicity. A comparison of total private capital invested (x-axis) and estimated returns on investment (y-axis) reveals a strong inverse relationship. (b) The 89 companies in a were assigned to cohorts of similar return profiles and their equity financing ranges compared (maximum/minimum, 25th/75th, medians). Bar shows 25th–75th percentile, line shows minimum–maximum. Companies with greater than fivefold returns had a median of $26 million; those with returns less than onefold had a median financing of $126 million. (c) Performance after IPO does not change the conclusion. Comparing the absolute change in return multiple to private investors in their performance after IPO until May 1, 2007, assuming they have not sold their shareholdings. The biggest changes in return multiples occurred in companies with less capital invested. (d) Earn outs for M&A deals do not change overall deal values, or the returns, considerably. Median deal values are shown with or without the earn-out milestones described; box is the median deal value and the line ranges from the 25th to 75th percentile. Source: Capital IQ; Ernst & Young/VentureOne Venture Capital Report.
COMMENTARY©
2007
Nat
ure
Pub
lishi
ng G
roup
ht
tp://
ww
w.n
atur
e.co
m/n
atur
ebio
tech
nolo
gy

856 VOLUME 25 NUMBER 8 AUGUST 2007 NATURE BIOTECHNOLOGY
the change in the absolute return to the private investors after IPO. The review reveals a similar inverse relationship; that is, the biggest positive change in the return-on-investment multiple after an IPO occurred in companies with less invested capital (Fig. 3c). Looking at perfor-mance more directly, of the 19 companies whose stock prices have risen >50% since their IPO, 58% consumed >$50 million in private capital; however, 70% of the 23 companies that have had negative returns after IPO consumed more than $50 million before their offering, suggesting at the very least that strong performance after an IPO is not determined by pre-IPO financ-ing. These data suggest that performance after an IPO, at least in this cohort with an average history after IPO of 13 months, does not fun-damentally change the findings. With regard to M&A, only 29% of the acquisitions involved payment of milestone earn outs in addition to the upfront cash payments; when these were taken in account, the median deal values did not change considerably (Fig. 3d) and therefore neither did the investment multiples.
A third concern is that a conscious selec-tion bias is introduced by analyzing only the pool of successful exits. Although high-capital-intensity companies have historically been less likely to offer spectacular returns, they may also
be less likely to lose all their investors’ money. Historically, nearly 30% of venture capital invest-ments never return any capital and an additional 10% return less than their invested capital4. It’s worth considering that companies that raise greater amounts of capital are less likely to fall into the former category. This is certainly the thesis of later-stage, growth-equity investing: building a lower risk, reduced volatility port-folio by accepting lower return expectations. However, in the early-stage venture-capital busi-ness, aiming for outsized returns (over fivefold) is essential for balancing the high-risk nature of the investments in the portfolio.
Caveats aside, these findings reinforce the rather axiomatic theme that spectacular win-ners in private biotech are frequently defined by greater capital efficiency. In fact, above-average returns to biotech venture capitalists have been overwhelmingly driven by those lean companies with lower capital-intensity.
Efficient portfoliosIn light of the link between supranormal returns and capital efficiency, will returns get compressed across the industry as capital floods in? It is a seri-ous threat, given the abundant supply of capital and ease at which less productive uses for it can be found. However, depressed returns are unlikely
to occur across the board. Smart investors will be aggressively focused on finding ever more effi-cient ways to deploy capital (versus simply more ways to deploy capital). Indeed, for a number of early-stage venture capital funds this ongoing focus is already being reflected in their portfolios’ higher aggregate level of capital efficiency than elsewhere in the biopharma sector.
For example, the aggregate life sciences port-folio of my own firm, Atlas Venture (Waltham, MA, USA), certainly reflects this emphasis on higher capital-efficiency. A comparison of the integrated development pipeline of 20 private biotech firms in our portfolio at the end of 2006 to 10 mid-sized biopharma companies reveals a similar pipeline distribution (Fig. 4a). However, despite similar numbers and stages of projects, the venture portfolio exhibits an order of magnitude advantage in terms of both people employed and R&D spending (Fig. 4b).
Of course, many caveats exist here too: larger companies may target more expensive disease areas, like those in primary care, requiring more extensive clinical studies, or failure rates could be different, although both of these are unlikely to be driving a substantial difference here. In addi-tion, the simplifying assumptions (described in legend for Fig. 4) underlying the analysis may be exaggerating the difference.
Nevertheless, the general observation is com-pelling and the portfolio effect of integrating a number of capital-efficient biotech models is quite significant. The Atlas portfolio should be representative of those of other like-minded venture capital funds that favor capital effi-ciency.
Capital (in)efficienciesBoth of these findings reinforce the message to investors and entrepreneurs alike that efficient use of capital is essential for driving spectacular returns in early-stage biotech. Although there is no specific rule of thumb for how much a company should raise or spend, it is crucial to understand the drivers of capital efficiency and their link to governance.
Companies with lower capital-intensity typi-cally have fewer shareholders (each with a larger ownership percentage) and simpler governance in the board room. There is also less room for tolerating management issues (e.g., mismanage-ment of resources or staff) and usually more collaborative and intimate board and investor involvement. This translates into a focus on fis-cal accountability, a continual dialog on man-agement talent and a proactive focus on strategic opportunities facing the company. In particu-lar, this often results in configuring company financings to encourage good governance by holding teams accountable for tangible progress before additional funding. This accountability is
19
19
16
22
6
5
1,800
240
5,200
550
Sel
ecte
d m
id-c
apph
arm
a (m
edia
n)E
arly
-sta
ge V
C
Development pipeline(publicly disclosed)
� Preclinical development� Phase 1 and phase 2 trials� Phase 3 and regulatory stage
R&D spending($ millions)
R&D FTEs Rough productivity(drug projects per
annual $100 million)
~2–3
~20
a b
Figure 4 Capital efficiency of a venture capital portfolio compared to mid-sized biopharma. (a) Pipeline information was collected on ten mid-sized drug companies (Abbott (Deerfield, IL, USA), Amgen (Thousand Oaks, CA, USA), Biogen-Idec (Cambridge, MA, USA), Bristol-Myers Squibb (Princeton, NJ, USA), Eli Lilly (Indianapolis, IN, USA), Genentech (S. San Francisco, CA, USA), Genzyme (Framingham, MA, USA), Gilead Sciences (Foster City, CA, USA), Schering-Plough (Kenilworth, NJ, USA) and Wyeth (Madison, NJ, USA)). The median number of projects per stage was then compared to the integrated pipeline of the 20 private biotech firms in Atlas Venture’s Life Sciences portfolio (as of Dec 2006; public and medtech companies excluded). These pipeline distributions display a similar contour, suggesting the underlying companies are working on similar distributions of early- and later-stage projects. (b) Overall 2006 R&D spending of the group of drug companies. These R&D figures for the mid-sized drug companies reflect a 20% discount to overall R&D spending to account for life-cycle management studies (versus new projects). The overall 2006 spending, a majority of which is in R&D, of the 20 private biotechs in the Atlas portfolio was compiled and compared (overall spending represents the total operating costs for these companies). These numbers reveal a striking eightfold difference in overall spending. The number of R&D personnel in the mid-sized pharmaceutical companies is also compared and a nearly tenfold difference exists. These very rough comparisons suggest an order-of-magnitude improvement in efficiency. Source: PJB PharmaProjects; Capital IQ.
COMMENTARY©
2007
Nat
ure
Pub
lishi
ng G
roup
ht
tp://
ww
w.n
atur
e.co
m/n
atur
ebio
tech
nolo
gy

NATURE BIOTECHNOLOGY VOLUME 25 NUMBER 8 AUGUST 2007 857
frequently achieved through highly structured, multistep funding rounds, with several cash infusions linked to delivery of specific mile-stones over time. This not only promotes good fiscal discipline, but it also enables investors to ensure incremental ‘derisking’ before taking on greater capital exposure.
Active governance helps early-stage biotech companies exploit the many intrinsic, capital-efficiency advantages they possess relative to larger biopharmaceutical companies. Capturing these advantages gives startups an immediate capital efficiency edge over larger established firms, and failure to capture these invariably leads to higher spending and reduced efficiency. Three major advantages are worth highlighting: lack of costly legacy infrastructure, greater R&D program flexibility and tight alignment of indi-vidual performance incentives.
First, the lack of ‘legacy infrastructure’ allows entrepreneurs and their venture capital partners to design a capital-efficient organization from inception, tailored to the new company’s needs. Efficient use of resources requires these new companies to outsource many functions, par-ticularly those that are not core to a small firm’s expertise. By not relying on a full-time in-house organization, startups can rent talent on an as-needed basis rather than buying it and therefore access top-tier capabilities at discounted cost.
Conversely, management teams with abun-dant resources may be tempted to overbuild infrastructure. Common mistakes include hiring an extensive suite of full-time internal capabilities, especially in corporate or business functions, acquiring or leasing expensive space in high-rent districts, building out a facility more extensively than necessary. These behav-iors run counter to the zero-base advantage of having no legacy infrastructure and will often lead to suboptimal returns.
Second, small startup companies with fewer decision-makers have the potential to be far more nimble and flexible in their R&D pro-cesses. In short, small startups are not bound by the stage-gate culture of bigger organizations, where every program needs to have every box checked at each stage of R&D to progress to the next key milestone. It is obviously important to articulate clear go/no-go criteria, but get-ting a program to its key value inflection point with less capital should be the aim. For novel drug targets, this means managing the key risk (e.g., an unprecedented biologic mechanism of action) rather than all the risks (e.g., whether the phamacokinetics support oral daily dosing). The latter is important in many diseases, but getting proof of concept on a novel mechanism is far more important. The management team and board in capital-efficient biotechs are both actively involved in approving the important
study designs and program-funding decisions, so all are held accountable.
Third, startup ventures that are capital effi-cient succeed in aligning the performance incentives of their employees with the com-pany’s mission. In this respect, it is important to design compensation packages for person-nel that deemphasize base salary and cash bonuses, and focus more on company equity. A comparison of compensation among clinical research vice presidents at big pharma and chief medical officers at venture-backed biotech firms reveals the striking difference in equity align-ment: whereas base salaries and bonuses are potentially 10% lower at venture-backed bio-techs, the equity incentive is close to 10 times greater (Russell Reyonds, unpublished data, courtesy of Thomas Carey). Even adjusting for increased risk, that is a considerable imbalance of incentives. This creates a huge motivation for hard work, long days and a desire to help shape the company outcome, all of which contribute favorably to the enhanced efficiency of well-run, early-stage biotechs.
Thus, when biotech companies recruit manag-ers on the basis of high salary and bonus com-pensation packages, rather than asking them to belt-tighten in exchange for more equity, the effi-ciency advantage they would otherwise naturally enjoy disappears. This may also result in the hir-ing of managers who are less collaborative or keen on working closely with their boards and inves-tors. What’s more, if management knows their equity positions will be ‘reloaded’ with options in the next financing, they also will become less focused on capital efficiency. Both of these prob-lems can weaken the alignment between inves-tor and manager, and often create a difference of opinion on the optimal use of capital.
To bias an early-stage biotech toward the favorable end of the capital-intensity spectrum, management and investors must work closely together to exploit these three intrinsic advan-tages and avoid the risks.
Getting it rightIn funding early-stage biotechs, investors and their entrepreneurs must walk a fine line. Too little financing and a company will starve and almost certainly fail. Too much financing and the surplus cash (and dilution) will depress returns. This ‘Goldilocks’-like problem is dif-ficult to solve and, unsurprisingly, there is no algorithmic answer. The optimal amount for an early-stage company to raise depends on the details of its business model and product can-didates, and on how much nondilutive funding can be raised through partnerships or grants. Platform companies require more capital than ‘project-based’ companies, yet both should still aspire to be capital efficient within their busi-
ness model. A virtual preclinical-stage company requires very little, whereas a development-stage company with many high-burn clinical programs may need 10–30 times more capital. There are ways of achieving great returns, at least theoretically, with either of these models.
The optimal amount would enable a com-pany to hit the top of the ‘capital-response curve’, to paraphrase a pharmacology metaphor. In this dose-response curve, there is a situation-depen-dent level of capital below which it is impossible to create value, and conversely an upper limit beyond which there is little or no further value creation. A company focused on capital effi-ciency should aim its fund-raising to hit, rather than overshoot, the peak response.
Conceptually, venture capital returns in biotech are often about the arbitrage between moving a program up a value inflection from point A to point B (e.g., from lead optimization to phase 2a) and the risk-adjusted cost of accomplishing it. Big pharma and the public markets will reward early-stage companies with a return on equity proportional to the scale of that arbitrage (that is, the relative difference in value and cost). Because the relative risk of failure for most pro-grams is likely to be similar across biotech and big pharma (as it is often defined by the intrinsic biology of the drug target), managing the rela-tive costs is one of the primary drivers of gener-ating great venture capital returns.
This theme is reinforced by the two analyti-cal findings presented here: great returns from early-stage private biotech companies have been inversely correlated with capital intensity, and actively governed early-stage portfolios can exhibit striking levels of capital efficiency when properly managed.
These findings help make the case that, in today’s environment, delivering the real prom-ise of early-stage biotech will require that com-panies resist the temptation to ‘take as many hors d’oeuvres as you can’ during fund-raising, and focus on the paths that enable them to put equity capital to work most efficiently.
Note: Supplementary information is available on the Nature Biotechnology website.
ACKNOWLEDGMENTSThe author would like to thank his colleagues at Atlas Venture for their advice and feedback, and in particular Kevin Clancy for his assistance with the article.
COMPETING INTERESTS STATEMENTThe author declares competing financial interests: details accompany the full-text HTML version of the paper at http://www.nature.com/naturebiotechnology/.
1. Booth, B.L. Nat. Biotechnol. 25, 1335–1340 (2006).2. Pisano, G. Science Business (Havard Business School
Press, Cambridge, MA, 2006).3. Lähteenmäki, R. & Lawrence, S. Nat. Biotechnol. 25,
729–737 (2007).4. <http://www.evca.com/images/attachments/tmpl_26_
art_94_att_499.pdf>
COMMENTARY©
2007
Nat
ure
Pub
lishi
ng G
roup
ht
tp://
ww
w.n
atur
e.co
m/n
atur
ebio
tech
nolo
gy