when is a design in rock engineering acceptable? · when is a design in rock engineering...
TRANSCRIPT
When is a design in rock engineering acceptable?
Müller Lecture
Presented by Evert Hoek, September 1991
Proceedings of the 7th International Congress on Rock Mechanics, Aachen
Rotterdam: A.A. Balkema
Volume 3
Original pagination: 1485-1497.

Hoek - When is a design in rock engineering acceptable?
2
When is a design in rock engineering acceptable?
Abstract
Each structure in rock engineering is unique and the acceptability of the design has to
be considered in terms of the particular set of circumstances, rock types, design loads
and end uses for which it is intended. The responsibility of the geotechnical engineer
is to find a safe and economical solution which is compatible with all the constraints
which apply to the project. Four case histories are presented to illustrate the variety of
factors which have to be considered in a rock engineering design.
Introduction
Professor Leopold Müller played a very important role in the development of rock
mechanics and rock engineering and in the establishment of the International Society
for Rock Mechanics. It is appropriate that the premier award of this society should
bear his name and it is a great honour for me to present this, the first Müller Lecture.
The theme of the lecture is ‘When is a design in rock engineering acceptable?’. It is
my intention to demonstrate that there are no simple universal rules for acceptability
nor are there standard factors of safety which can be used to guarantee that a rock
structure will be safe and that it will perform adequately. Each design is unique and
the acceptability of the structure has to be considered in terms of the particular set of
circumstances, rock types, design loads and end uses for which it is intended. The
responsibility of the geotechnical engineer is to find a safe and economical solution
which is compatible with all the constraints which apply to the project. Such a
solution should be based upon engineering judgment guided by practical and
theoretical studies such as stability or deformation analyses, if and when these
analyses are applicable.
Tables 1 to 4 summarize some of the typical problems, critical parameters, analysis
methods and acceptability criteria which apply to a number of different rock
engineering structures. These examples have been drawn from my own consulting
experience and I make no claims that this is a complete list nor do I expect readers to
agree with all of the items which I have included under the various headings. The
purpose of presenting these tables is to demonstrate the diversity of problems and
criteria which have to be considered and to emphasize the dangers of attempting to
use standard factors of safety or other acceptability criteria.
In order to amplify some of the items included in Tables 1 to 4, several case histories
will be discussed in terms of the factors which were considered and the acceptability
criteria which were used.
Landslides in reservoirs
The presence of unstable slopes in reservoirs is a major concern for the designers of
dams for hydroelectric and irrigation projects. The Vajont failure in 1963 alerted the
engineering community of the danger of underestimating the potential for the
mobilization of existing landslides as a result of submergence of the slide toe during
impounding of the reservoir. Since that time, significantly more effort has been
devoted to the investigation, analysis and stabilization of potential slides in reservoirs.

Hoek - When is a design in rock engineering acceptable?
3
Table 1: Typical problems, critical parameters, methods of analysis and acceptability
criteria for slopes.

Hoek - When is a design in rock engineering acceptable?
4
Table 2. Typical problems, critical parameters, methods of analysis and acceptability
criteria for dams and foundations.

Hoek - When is a design in rock engineering acceptable?
5
Table 3. Typical problems, critical parameters, methods of analysis and acceptability
criteria for underground civil engineering excavations.

Hoek - When is a design in rock engineering acceptable?
6
Table 4. Typical problems, critical parameters, methods of analysis and acceptability
criteria for underground hard rock mining excavations.

Hoek - When is a design in rock engineering acceptable?
7
During the construction of the Mica and Revelstoke dams on the Columbia River in
British Columbia, Canada, several potential slides were investigated. Two of these,
the Downie Slide, a 1.4 billion cubic metre ancient rock slide, and Dutchman’s Ridge,
a 115 million cubic metre potential rock slide, were given special attention because of
the serious consequences which could have resulted from failure of these slides
(Imrie, 1983, Lewis and Moore, 1989, Imrie, Moore and Enegren, 1992).
The Downie Slide and Dutchman’s Ridge are located in steep, narrow, V-shaped
sections of the Columbia River valley which has been subjected to several episodes of
glaciation. The bedrock at these sites consists mainly of Pre-Cambrian para-gneisses
and schists within or on the fringe of the Shuswap Metamorphic Complex. In both
cases, the potential slide planes, determined by diamond drilling and slope
displacement monitoring, are relatively flat lying outward dipping tectonic faults or
shears which daylight in the base of the river valley.
Based on thorough investigation and monitoring programs, British Columbia Hydro
and Power Authority (BC Hydro) decided that remedial measures had to be taken to
improve the stability of both the Downie Slide and Dutchman’s Ridge. These
remedial measures consisted of drainage adits extending within and/or behind the
failure surfaces and supplemented by drainholes drilled from chambers excavated
along the adits. Work on the Downie Slide was carried out in the period 1977 to 1982
(which included a 3 year observation period) and work on Dutchman’s Ridge was
carried out from 1986 to 1988.
A section through Dutchman’s Ridge is given in Figure 1 and this shows the water
levels in the slope before reservoir filling and after reservoir filling and the
construction of the drainage system. Figure 2 shows contours of reduction in water
levels as a result of the installation of the drainage system which consisted of 872 m
of adit and 12,000 m of drainhole drilling. Note that the drawdown area on the right
hand side of the potential slide was achieved by long boreholes from the end of the
drainage adit branch.
Figure 1. Section through Dutchman's Ridge showing potential slide surface and
water levels before and after drainage.

Hoek - When is a design in rock engineering acceptable?
8
Figure 2. Contours of water level reduction (m) as a result of the implementation of
drainage in Dutchman's Ridge.
Comparative studies of the stability of the slope section shown in Figure 1, based
upon a factor of safety of 1.00 for the slope after reservoir filling but before
implementation of the drainage system, gave a factor of safety of 1.06 for the drained
slope. This 6% improvement in factor of safety may not seem very significant to the
designer of small scale rock and soil slopes but it was considered acceptable in this
case for a number of reasons:
a: The factor of safety of 1.00 calculated for the undrained slope is based upon a
‘back-analysis’ of observed slope behaviour. Provided that the same method of
analysis and shear strength parameters are used for the stability analysis of the
same slope with different groundwater conditions, the ratio of the factors of
safety is a very reliable indicator of the change in slope stability, even if the
absolute values of the factor of safety are not accurate. Consequently, the
degree of uncertainty which has to be allowed for in slope designs where no
back-analyses have been performed can be eliminated and a lower factor of
safety accepted.
b: The groundwater levels in the slope were reduced by drainage to lower than the
pre-reservoir conditions and hence the stability of the slope is at least as good
if not better then these pre-reservoir conditions. This particular slope is
considered to have withstood several significant earthquakes during the 10,000
years since the last episode of glaciation which is responsible for the present
valley shape.
c: Possibly the most significant indicator of an improvement in stability, for both
the Downie Slide and Dutchman’s Ridge, has been a significant reduction in
the rate of down-slope movement which has been monitored for the past 25
years. In the case of the Downie Slide, this movement has practically ceased
while, for Dutchman’s Ridge, the movements are significantly slower and it is
anticipated that they will stabilize when the drainage system has been in
operation for a few more years.
Hoek - When is a design in rock engineering acceptable?
9
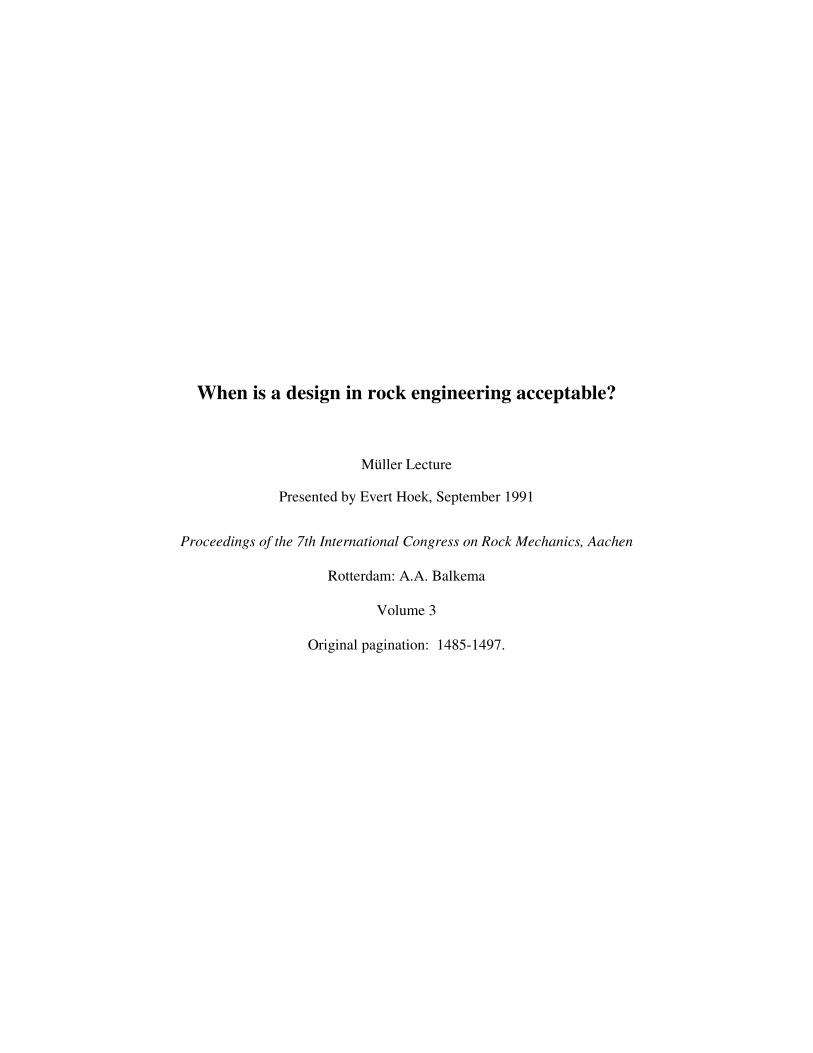
Figure 3. Cross-section through a section of the Wahleach power tunnel showing the
original tunnel alignment and the location of the replacement conduit. The dashed line
is the approximate location of a gradational boundary between loosened, fractured and
weathered rock and more intact rock. Down slope movement currently being
monitored is well above this boundary.
Deformation of rock slopes
In a slope in which the rock is jointed but where there are no significant
discontinuities dipping out of the slope which could cause sliding, deformation and
failure of the slope is controlled by a complex process of block rotation, tilting and
sliding. In an extreme case, where the rock mass consists of near vertical joints
separating columns of massive rock, toppling movement and failure may occur.
Figure 3 is a section through part of the power tunnel for the Wahleach hydroelectric
project in British Columbia, Canada. A break in the steel lining in this power tunnel
occurred in January 1989 and it is thought this break was caused by a slow down-
slope gravitational movement caused by block rotations, sliding and tilting of a near
surface zone of loosened jointed rock.
The Wahleach project is located 120 km east of Vancouver and power is generated
from 620 m of head between Wahleach lake and a surface powerhouse located
adjacent to the Fraser River. Water flows through a 3500 m long three metre diameter
unlined upper tunnel, a rock trap, a 600 m two metre diameter concrete encased steel
lined shaft inclined at 48º to the horizontal, a 300 m long lower tunnel and a 485 m
long surface penstock to the powerhouse.
The tunnels were excavated mainly in granodiorite which varies from highly fractured
and moderately weathered in the upper portions of the slope to moderately fractured
and fresh in both the lower portions of the slope and below the highly fractured mass.
Two main joint sets occur in the rock mass: one set striking parallel to the slope and
the other perpendicular to it; both dip very steeply. Average joint spacings range from
0.5 to 1 m. A few joints occur sub-parallel to the ground surface and these joints are

Hoek - When is a design in rock engineering acceptable?
10
most well developed in the ground surface adjacent to the inclined shaft. Thorough
investigations failed to reveal any significant shear zones or faults, oriented in a
direction conducive to sliding.
The toe of the slope is buried beneath colluvial and fan deposits from two creeks
which have incised the Fraser Valley slope to form the prominence in which the
inclined shaft was excavated. This prominence is crossed by several linear troughs
which trend along the ground surface contours and are evidence of previous down-
slope movement of the prominence. Mature trees growing in these troughs indicate a
history of movement of a least several hundred years (Moore, Imrie and Baker,
1991).
The water conduit operated without incident between the initial filling in 1952 and
May 1981 when leakage was first noted from the upper access adit located near the
intersection of the inclined shaft and the upper tunnel (see Figure 3). This leakage
stopped when two drain pipes embedded in the concrete backfill beneath the steel
lining were plugged at their upstream ends. Large holes had been eroded in these
drainage pipes where they were not encased in concrete and it was concluded that this
corrosion was responsible for the leakage. This conclusion appeared to be valid until
25 January 1989 when a much larger water flow occurred.
Investigations in the dewatered tunnel revealed a 150 mm wide circumferential
tension crack in the steel lining of the upper tunnel, about 55 m from its intersection
with the inclined shaft. In addition, eight compressional buckle zones were found in
the upper portion of the inclined shaft. Subsequent investigations revealed that
approximately 20 million cubic metres of rock are involved in down-slope creep
which, during 1989-90, amounted to several centimetres per year and which appears
to be ongoing. This down-slope creep appears to be related to a process of block
rotation rather than to any deep seated sliding as was the case at both the Downie
Slide and Dutchman’s Ridge.
While discrete element models may give some indication of the overall mechanics of
this type of slope deformation, there is no way in which a factor of safety, equivalent
to that for sliding failure, can be calculated. Consequently, in deciding upon the
remedial measures to be implemented, other factors have to be taken into
consideration.
After thorough study by the BC Hydro and their consultants, it was decided to
construct a replacement conduit consisting of an unlined shaft and tunnel section and
a steel lined section where the rock cover is insufficient to contain the internal
pressure in the tunnel. This replacement conduit, illustrated in Figure 3, will remove
the steel lined portions of the system from zones in which large displacements are
likely to occur in the future. This in turn will minimize the risk of a rupture of the
steel lining which would inject high pressure water into the slope. It was agreed that
such high pressure water leakage could be a cause for instability of the overall slope.
Further studies are being undertaken to determine whether additional drainage is
required in order to provide further safeguards.
Careful measurements of the displacements in the inclined shaft, the length of the
steel lining cans as compared with the original specified lengths and the opening of

Hoek - When is a design in rock engineering acceptable?
11
the tensile crack in the upper portion of the steel lined tunnel provided an overall
picture of the displacements in the rock mass. These observed displacements were
compared with displacement patterns computed by means of a number of numerical
studies using both continuum and discrete element models and the results of these
studies were used in deciding upon the location of the replacement conduit.
In addition to the construction of this replacement conduit to re-route the water away
from the upper and potentially unstable part of the slope, a comprehensive
displacement and water pressure monitoring system has been installed and is being
monitored by BC Hydro (Baker, 1991, Tatchell, 1991).
Structural failure in rock masses
In slopes, foundations and shallow underground excavations in hard rock, failure is
frequently controlled by the presence of discontinuities such as faults, shear zones,
bedding planes and joints. The intersection of these structural features can release
blocks or wedges which can fall or slide from the surface of the excavation. Failure of
the intact rock is seldom a problem in these cases where deformation and failure are
caused by sliding along individual discontinuity surfaces or along lines of intersection
of surfaces. Separation of planes and rotation of blocks and wedges can also play a
role in the deformation and failure process.
An analysis of the stability of these excavations depends primarily upon a correct
interpretation of the structural geological conditions in the rock mass followed by a
study of the blocks and wedges which can be released by the creation of the
excavation. Identification and visualization of these blocks and wedges is by far the
most important part of this analysis. Analysis of the stability of the blocks and
wedges, and of the reinforcing forces required to stabilize them is a relatively simple
process once this identification has been carried out.
The Río Grande Pumped Storage Project is located in the Province of Córdoba in the
Republic of Argentina. Four reversible pump-turbines operating at an average head of
170 m give the project a total installed capacity of 750 MW. These turbines are
installed in a 25 m span, 50 m high, 105 m long cavern at an average depth of 160 m
below surface.
The rock in which the underground excavations are situated is a massive tonalitic
gneiss of excellent quality (Amos et al, 1981). The gneiss has an average uniaxial
compressive strength of 140 MPa. The maximum principal stress, determined by
overcoring tests, is 9.4 MPa and is almost horizontal and oriented approximately
normal to the cavern axis. In massive rocks, this 15:1 ratio of uniaxial strength to
maximum principal stress is unlikely to result in any significant failure in the rock and
this was confirmed by numerical stress analyses (Moretto 1982, Sarra Pistone and del
Río, 1982). The principal type of instability which had to be dealt with in the
underground excavations was that of potentially unstable blocks and wedges defined
by intersecting structural features (Hammett and Hoek, 1981).
In one section of the cavern, the axis of which is oriented in the direction 158–338,
four joint sets were mapped and were found to have the following dip/dip direction
values:
Hoek - When is a design in rock engineering acceptable?
12
Table 5. Dip and dip direction values for joints in one location in the Río Grande
cavern excavation.
No. Dip Dip Direction Comments
1 50 131 infrequently occurring joints
2 85 264 shear joint set
3 70 226 shear joint set
4 50 345 tension joint set
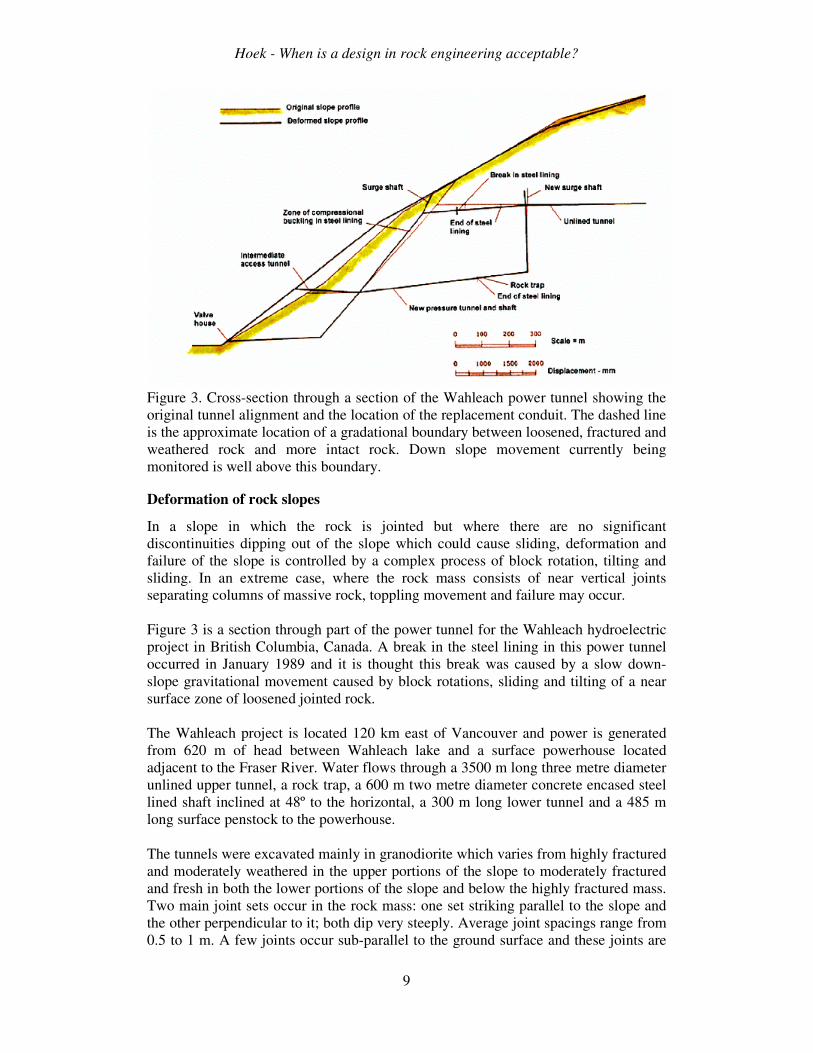
Figure 4 is a perspective view of the Río Grande power cavern showing typical
wedges which can be formed in the roof, sidewalls, bench and floor by joint sets 2, 3
and 4. These figures represent the maximum possible sizes of wedges which can be
formed and, during construction, the sizes of the wedges were scaled down in
accordance with average joint trace lengths measured in the excavation faces.
In Figure 4 it is evident that the roof and the two sidewall wedges were potentially
unstable and that they needed to be stabilized. This stabilization was achieved by the
placement of tensioned and grouted rockbolts which were installed at each stage of
the cavern excavation. Decisions on the number, length and capacity of the rockbolts
were made by on-site geotechnical staff using limit equilibrium calculations based
upon the volume of the wedges defined by the measured trace lengths. For those
wedges which involved sliding on one plane or along the line of intersection of two
planes, rockbolts were installed across these planes to bring the sliding factor of safety
of the wedge up to 1.5. For wedges which were free to fall from the roof, a factor of
safety of 2 was used. This factor was calculated as the ratio of the total capacity of the
bolts to the weight of the wedge and was intended to account for uncertainties
associated with the bolt installation.
Figure 4. Perspective view of Rio Grande power cavern showing potentially unstable
wedges in the roof, sidewalk, bench and floor.

Hoek - When is a design in rock engineering acceptable?
13
The floor wedge was of no significance while the wedges in the bench at the base of
the upstream wall were stabilized by dowels placed in grout-filled vertical holes
before excavation of the lower benches.
Early recognition of the potential instability problems, identification and visualization
of the wedges which could be released and the installation of support at each stage of
excavation, before the wedge bases were fully exposed, resulted in a very effective
stabilization program. Apart from a minimal amount of mesh and shotcrete applied to
areas of intense jointing, no other support was used in the power cavern which has
operated without any signs of instability since its completion in 1982.
Excavations in weak rock
In contrast to the structurally controlled failures in strong rock discussed in the
previous section, there are many cases where tunnels and caverns are excavated in
rock masses which are weak as a result of intense jointing or because the rock
material itself has a low strength. Rocks such as shales, mudstones, siltstones,
phyllites and tuffs are typical weak rocks in which even moderate in situ stresses are
likely to induce failure in the rock surrounding underground excavations.
Progressive failure of this type, which can occur in the rock surrounding an
underground excavation in a weak rock mass, is a difficult analytical problem and
there are no simple numerical models nor factor of safety calculations which can be
used to define acceptable limits to this failure process. Judgment on the adequacy of a
support design has to be baed upon an evaluation of a number of factors such as the
magnitude and distribution of deformations in the rock and the stresses induced in
support elements such as grouted cables, steel sets or concrete linings. This design
process is illustrated by means of an example.
The Mingtan pumped storage project is located in the central region of the island of
Taiwan and utilizes the 400 m head difference between the Sun Moon Lake and the
Shuili River to generate up to 1600 MW at times of peak demand. The power cavern
is 22 m wide, 46 m high and 158 m long and a parallel transformer hall is 13 m wide,
20 m high and 17 m long. The caverns are 45 m apart and are located at a depth of
30 m below surface in the steep left bank of the Shuili river. (Liu, Cheng and Chang,
1988).
The rock mass consists of weathered interbedded sandstones, siltstones and shales
dipping at about 35º to the horizontal. Weak beds of siltstone, up to 2 m thick, appear
to have caused a concentration of shear movements during tectonic activity so that
fault zones have developed parallel to the bedding. The common feature observed for
all these faults is the presence of continuous clay filling with a thickness varying from
a few mm to 200 mm. The cavern axis is intentionally oriented at right angles to the
strike of these faults.
The Rock Mass Ratings (RMR) (Bieniawski, 1974) and Tunnelling Quality Index Q
(Barton, Lien and Lunde, 1974) and approximate shear strength values for the various
components of the rock mass are given in Table 6 below.

Hoek - When is a design in rock engineering acceptable?
14
Table 6. Rock mass classifications and approximate friction angles (φ’) and cohesive
strengths (c’) for the rock mass in which the Mingtan power cavern is excavated.
Rock type RMR Q φ’ deg. c’ MPa
Jointed sandstone 63–75 12–39 50 1.0
Bedded sandstone 56–60 7–13 45 0.8
Faults or shears 10–33 0.1–1.1 30–40 0.15–0.3
The measured in situ stresses in the rock mass surrounding the cavern are
approximately:
Maximum principal stress (horizontal) σmax = 10.9 MPa
Minimum principal stress (vertical) σmin = 7.5 MPa
The maximum principal stress is oriented parallel to bedding and normal to the cavern
axis.
The results of a simple analysis of the zones of overstress in the rock mass
surrounding the Mingtan underground excavations are presented in Figure 5. The
crosses in this figure are directions along which shear failure is predicted in the
bedded sandstone while the horizontal lines indicate slip along the faults (assuming
c’ = 0.15 MPa, φ’ = 30º). While it is not claimed that this analysis adequately
represents the complex process of failure initiation and propagation on the inclined
faults and in the jointed rock mass surrounding the caverns, it does give sufficient
information to suggest that the cavern can be stabilized by means of a pattern of long
grouted cables supplemented by a layer of shotcrete on the excavation surface.
Figure 5. Predicted zones of over-stress along faults and in bedded sandstone
surrounding the power cavern and transformer hall of the Mingtan Project.

Hoek - When is a design in rock engineering acceptable?
15
Figure 6. Lengths of rockbolts and cables used for roof support in some large caverns
in weak rock. Equations defining trend lines were suggested by Barton (1989).
Figure 7. Lengths of rockbolts and cables used for sidewall support in some large
caverns in weak rock. Equations defining trend lines were suggested by Barton
(1989).

Hoek - When is a design in rock engineering acceptable?
16
The design of the reinforcing cables was based upon experience and precedent
practice. Figures 6 and 7 give the lengths of rockbolts and cables in the roof and
sidewalls of some typical large powerhouse caverns in weak rock masses. Plotted on
the same graphs are empirical relationships suggested by Barton (1989) for bolt and
cable lengths for underground powerhouses.
Bedding faults of significant thickness which were intersected in the roof of the
cavern were treated by using high pressure water jets to remove the clay and then
filling the cavities with non shrink cementitious mortar (Cheng 1987, Moy and Hoek,
1989). This was followed by the installation of 50 tonne capacity untensioned grouted
cables from a drainage gallery 10 m above the cavern roof in order to create a pre-
reinforced rock mass above the cavern. All of this work was carried out from
construction adits before the main contract for the cavern excavation commenced.
During benching down in the cavern, 112 tonne capacity tensioned and grouted cables
were installed on a 3 m x 3 m grid in the sidewalls. The final layout of the cables in
the rock surrounding the power cavern and the transformer hall is illustrated in Figure
8. Five metre long grouted rockbolts were installed as required at the centre of the
squares formed by the cable face plates. A 50 mm layer of steel fibre reinforced
micro-silica shotcrete was applied within 5 to 10 m of the face. This shotcrete was
later built up to a thickness of 150 mm on the roof and upper sidewalls and 50 mm on
the lower sidewalls where it would eventually be incorporated into the concrete
foundations.
A key element in the decision making process on the adequacy of the support system
was a monitoring and analysis process which involved the following steps:
a. Displacements in the rock surrounding the excavations monitored by means
of convergence arrays and extensometers, some of which had been installed
from construction galleries before excavation of the caverns commenced.
b. Numerical modelling of each excavation stage using non-linear multiple-
material models. The material properties used in the models of the early
excavation stages were adjusted to obtain the best match between predicted
and measured displacements.
c. Prediction of displacements and support loads during future excavation
stages and adjustment of support capacity, installation and pretensioning to
control displacements and cable loads.
d. Measurement of displacements and cable loads (using load cells on selected
cables which had been de-bonded) and comparison between measured and
predicted displacements and cable loads.
e. Installation of additional cables or adjustment of cable loads to control
unusual displacements or support loads.
The aim of this program was to maintain as uniform a displacement pattern around the
excavations as possible and to keep the loads on the cables at less than 45% of their
yield load. The intermediate rockbolts and the shotcrete were not accounted for in the

Hoek - When is a design in rock engineering acceptable?
17
numerical modelling since it was assumed that their role was confined to supporting
the rock immediately adjacent to the excavations and that the overall stability was
controlled by the 10 to 15 m long grouted cables.
Figure 8 shows the combination of materials used in analyzing one section of the
cavern, assuming that the bedding faults could be represented by horizontal layers in
the two-dimensional model. In order to match the measured and predicted
displacements in the rock mass, it was found that a 2.5 m thick zone of softened and
weakened material had to be wrapped around the excavations to account for blast
damaged material (achieving good blasting results was difficult in this interbedded
rock).
Figure 8. Layout of cables used to support the rock surrounding the power cavern and
the transformer hall in the Mingtan pumped storage project. The location and
properties of the rock units represent those used in the numerical analysis of failure,
deformation and cable loading in a typical vertical section.
Figure 9. Comparison between calculated and measured displacements along six
extensometers installed in the sidewalls of the Mingtan power cavern.

Hoek - When is a design in rock engineering acceptable?
18
Figure 10. Surface displacements and cable loads measured at seven stations along the power cavern axis.
In Figure 9, the predicted and measured displacements along six extensometers
installed in the power cavern sidewalls are compared. The overall agreement is
considered to be acceptable. Maximum sidewall displacements were of the order of
100 mm at the mid-height of the upstream wall, adjacent to one of the major faults.
Elsewhere, displacements were of the order to 25 to 46 mm.
Figure 10 shows the results of monitoring at seven stations along the axis of the
power cavern. Before excavation of the cavern commenced, extensometers were
installed at each of these stations from a drainage gallery above the roof arch and
from construction galleries as shown in the upper part of Figure 10. In addition, load
cells were installed on cables adjacent to some of the extensometers.
Rapid responses were recorded in all extensometers and load cells as the top heading
passed underneath them. Further responses occurred as the haunches of the cavern
arch were excavated and as the first bench was removed. As can be seen from the
plots, after this rapid response to the initial excavation stages, the displacements and
cable loads became stable and showed very little tendency to increase with time. The
difference in the magnitudes of the displacements and cable loads at different stations
can be related to the proximity of the monitoring instruments to faults in the rock
above the cavern arch.

Hoek - When is a design in rock engineering acceptable?
19
The rapid load acceptance and the modest loading of the cables together with the
control of the displacements in the rock mass were the goals of the support design.
Measurements obtained from the extensometers and cable load cells indicate that
these goals have been met.
Factor of safety
The four case histories, discussed in previous sections, have been presented to
demonstrate that a variety of criteria have to be considered in deciding upon the
adequacy of a rock structure to perform its design objectives. This is true for any
design in rock since the performance of each structure will be uniquely dependent
upon the particular set of rock conditions, design loads and intended end use.
In one group of structures, traditional designs have been based upon a ‘factor of
safety’ against sliding. These structures, which include gravity and fill dams as well
as rock and soil slopes, all involve the potential for sliding along well defined failure
surfaces. The factor of safety is defined as the factor by which the shear strength
parameters may be reduced in order to bring the slope (or dam foundation) into a state
of limiting equilibrium (Morgenstern 1991). The numerical value of the factor of
safety chosen for a particular design depends upon the level of confidence which the
designer has in the shear strength parameters, the groundwater pressures, the location
of the critical failure surface and the magnitude of the external driving forces acting
upon the structure.
Figure 11 illustrates a set of hypothetical distribution curves representing the degree
of uncertainty associated with available information on shear strength parameters and
disturbing stresses for different stages in the design of a rock or soil structure. The
factor of safety is defined as A/B where A is the mean of the distribution of shear
strength values and B is the mean of the distribution of driving stresses. For the
purposes of this discussion, the same factor of safety has been assumed for all three
cases illustrated.
During preliminary design studies, the amount of information available is usually very
limited. Estimates of the shear strength of the rock or soil are generally based upon
the judgement of an experienced engineer or geologist which may be supplemented,
in some cases, by estimates based upon rock mass classifications or simple index
tests. Similarly, the disturbing forces are not known with very much certainty since
the location of the critical failure surface will not have been well defined and the
magnitude of externally applied loads may not have been established. In the case of
dam design, the magnitude of the probable maximum flood, which is usually based
upon probabilistic analysis, frequently remains ill defined until very late in the design
process.
For this case, the range of both available shear strength and disturbing stresses which
have to be considered is large. If too low a factor of safety is used, there may be a
significant probability of failure, represented by the section where the distribution
curves overlap in Figure 11. In order to minimize this failure probability, a high value
for the factor of safety is sometimes used. For example, in the 1977 edition of the US
Bureau of Reclamation Engineering Monograph on Design Criteria for Concrete Arch
and Gravity Dams, a factor of safety of 3.0 is recommended for normal loading
conditions when ‘only limited information is available on the strength parameters’.

Hoek - When is a design in rock engineering acceptable?
20
This value can be reduced to 2.0 when the strength parameters are ‘determined by
testing of core samples from a field investigation program or by past experience’.
During detailed design studies, the amount of information available is usually
significantly greater than in the preliminary design stage discussed above. A
comprehensive program of site investigations and laboratory or in situ shear strength
tests will normally have been carried out and the external loads acting on the structure
will have been better defined. In addition, studies of the groundwater flow and
pressure distributions in the rock mass, together with modifications of these
distributions by grouting and drainage, will usually have been carried out.
Consequently, the ranges of shear strength and driving stress values which have to be
considered in the design are smaller and the distribution curves are more tightly
constrained.
The case histories of the Downie Slide and Dutchman’s Ridge, discussed earlier, are
good examples of designs based upon back-analyses. In both of these cases, very
extensive site investigations and displacement monitoring had established the location
of the critical failure surfaces with a high degree of certainty. Careful monitoring of
the groundwater in the slopes (256 piezometer measuring points were installed in
Dutchman’s Ridge) had defined the water pressures in the slopes and their
fluctuations over several years. Some shear testing on fault material recovered from
cores was carried out but, more importantly, the mobilized shear strength along the
potential failure surfaces was calculated by back-analysis, assuming a factor of safety
of 1.00 for existing conditions.
Figure 11 illustrates the hypothetical distribution curves for the range of values for
shear strength and driving stresses for the case of a structure in which an existing
failure has been carefully back-analyzed. Depending upon the degree of care which
has been taken with this back-analysis, these curves will be very tightly constrained
and a low factor of safety can be used for the design of the remedial works.
Figure 11. Hypothetical distribution curves representing the degree of uncertainty
associated with information on driving stresses and shear strengths at different stages
in the design of a structure such as a dam foundation.

Hoek - When is a design in rock engineering acceptable?
21
This discussion illustrates the point that different factors of safety may be appropriate
for different stages in the design of a rock structure. This difference is primarily
dependent upon the level of confidence which the designer has in the values of shear
strength to be included in the analysis. Hence, a critical question which arises in all of
these cases is the determination or estimation of the shear strength along the potential
sliding surface. In a paper on the strength of rockfill materials, Marachi, Chan and
Seed (1972) summarize this problem as follows: ‘No stability analysis, regardless of
how intricate and theoretically exact it may be, can be useful for design if an incorrect
estimation of the shearing strength of the construction material has been made’.
Except in simple cases involving homogeneous soils or planar continuous weak
seams, determination of the shear strength along potential sliding surfaces is a
notoriously difficult problem. This is particularly true of the determination of the
cohesive component, c’, of the commonly used Mohr-Coulomb failure criterion.
Laboratory test specimens tend to be too small to give representative results while in
situ tests are difficult and expensive and, unless carried out with very great care, are
liable to give unreliable results.
For failure surfaces which involve sliding on rough or undulating rock surfaces such
as joints or bedding planes, the methodology proposed by Barton (1976) is
appropriate for estimating the overall shear strength of the potential sliding surface.
This involves adding a measured or estimated roughness component to the basic
frictional strength which can be determined on sawn and polished laboratory shear
test specimens.
For heavily jointed rock masses in which there are no dominant weakness zones such
as faults or shear zones, a crude estimate of the shear strength of the rock mass can be
obtained by means of the use of rock mass classification systems as proposed by Hoek
and Brown (1988).
In all cases, a greater reliance can be placed upon the frictional component, φ’, of the
Mohr-Coulomb shear strength equation and extreme care has to be taken in the
estimation of the cohesive strength, c’ . Where no reliable estimates of this value are
available from carefully conducted shear tests or from back-analysis of existing
failures, it is prudent to assume a cohesive strength of zero for any stability analysis
involving structures such as dam foundations.
In the design of fill and gravity dams there is a tendency to move away from the high
factors of safety of 2 or 3 which have been used in the past, provided that care is taken
in choosing sensible conservative shear strength parameters, particularly for
continuous weak seams in the foundations. An example of the range of factors of
safety which can be used in the design of earth or rockfill dams is given in Table 7.
Probabilistic analysis
The uncertainty associated with the properties of geotechnical materials and the great
care which has to be taken in selecting appropriate values for analyses has prompted
several authors to suggest that the traditional deterministic methods of slope stability
analyses should be replaced by probabilistic methods (Priest and Brown 1983,
McMahon 1975, Vanmarcke 1980, Morriss and Stoter 1983, Read and Lye, 1983).

Hoek - When is a design in rock engineering acceptable?
22
Table 7. Factors of safety for different loading conditions in the design of earth and
rockfill dams.
Loading condition S F Remarks
End of construction porewater pressures
in the dam and un-dissipated porewater
pressures in the foundation. No reservoir
loading.
1.3
Reservoir at full supply level with steady
state seepage in the dam and undissipated
end-of-construction porewater
1.3 Possibly the most critical (even if
rare) condition.
Reservoir at full supply level with steady
state seepage.
1.5 Critical to design.
Reservoir at probable maximum flood
level with steady state seepage conditions
1.2
Rapid reservoir drawdown from full
supply level to minimum supply level
1.3 Not significant in design. Failures
very rare and, if they occur are
usually shallow.
Reservoir at full supply level and steady
state seepage with maximum credible
horizontal.
1.0 Psuedo-static analysis generally
conservative. Detailed
seismic/deformation analysis is
preferable.
One branch of rock mechanics in which probabilistic analyses have been accepted for
many years is that of the design of open pit mine slopes. This is because open pit
planners are familiar with the concepts of risk analysis applied to ore grade and metal
price fluctuations. Probabilistic methods are used in estimating the economic viability
of various options in developing an open pit mine and hence it is a small step to
incorporate the probability of a geotechnical failure into the overall risk assessment of
the mine. The mine planner has the choice of reducing the probability of failure, by
the installation of reinforcement or by reducing the angle of the slope, or of accepting
that failure will occur and providing for extra equipment which may be needed to
clean up the failure. Since the mine is usually owned and operated by a single
company and access to the mine benches is restricted to trained personnel, accepting a
risk of failure and dealing with the consequences on a routine basis is a viable option.
On the other hand, the emotional impact of suggesting to the public that there is a
finite risk of failure attached to a dam design is such that it would take a very brave
(or foolhardy) engineer to propose the replacement of the standard factor of safety
design approach with one which explicitly states a probability of failure or a
coefficient of reliability. The current perception is that the factor of safety is more
meaningful than the probability of failure. Even if this were not so, there is still the
problem of deciding what probability of failure is acceptable for a rock structure to
which the general public has access.
From a statistical analysis of dam failures published by the International Commission
on Large Dams (ICOLD), Silveira (1990) has established that 75% of concrete dam
failures were due to failure through the foundation rock and that the present
probability of foundation failure is 1.0 x 10⁻⁵
per dam-year. Hence, in order to
Hoek - When is a design in rock engineering acceptable?
23
improve on the safety of new dams, a probability of failure of less that 1.0 x 10⁻⁵
per
dam-year would have to be used for design. Small quantities of this magnitude are
associated with extreme values of the data distribution curves and fall into a region
which is very poorly defined and where classical probability analyses lose their
engineering meaning.
In spite of these difficulties, there does appear to be a slow but steady trend in society
to accept the concepts of risk analysis more readily than has been the case in the past.
The geotechnical community has an obligation to take note of these developments and
to encourage the teaching and practical use of probabilistic as well as deterministic
techniques with the aim of removing the cloak of mystery which surrounds the use of
these methods.
Fortunately, there is a compromise solution which is a form of risk analysis used
intuitively by most experienced engineers. This is a parametric analysis in which a
wide range of possibilities are considered in a conventional deterministic analysis in
order to gain a ‘feel’ for the sensitivity of the design. Hence, the factor of safety for a
slope would be calculated for both fully drained and fully saturated groundwater
conditions, for a range of friction angles and cohesive strengths covering the full
spectrum which could be anticipated for the geological conditions existing on the site,
for external forces ranging from zero to the maximum possible for that slope. The
availability of user-friendly microcomputer software for most forms of limit
equilibrium analysis means that these parametric studies can be carried out quickly
and easily for most designs. It is strongly recommended that the reader consider
making the use of parametric studies a habit in the performance of any geotechnical
design.
Acknowledgements
At the ISRM Congress in Aachen I distributed preliminary copies of Tables 1 to 4
with a request that interested readers should send me comments or suggestions. I was
overwhelmed by the response and would like to thank those who wrote to me with
helpful suggestions, criticisms and comments. I apologize that it has not been possible
to incorporate all of this material into the text. In particular I wish to thank Vic
Milligan, Orestis Papageorgio, Al Imrie, David Wood and Jean Hutchinson who
provided very detailed discussions and assistance in checking the text.
References
Amos, A.J., A. Granero Hernandez, and R.J. Rocca. 1981. Problemas de
meteorizacion del geneis en la Presa Principal del complejo hidroeléctrico Río
Grande I. Proc. VIII Cong. Geol. Arg. Actas, II: 123-135.
Baker, D.G. 1991. Wahleach power tunnel monitoring. Proc. 3rd Int. Symp. on Field
Measurements in Geomechanics, Oslo, Norway, in press.
Barton, N. 1989. Cavern design for Hong Kong rocks. Proc. Rock Cavern Seminar,
Hong Kong, A.W. Malone and P.G.D. Whiteside (eds), 179-202.
Barton, N. 1976. The shear strength of rock and rock joints. Int. J. Rock Mech. Min.
Sci. & Geomech. Abstr. : 1-24.
Barton, N.R., R. Lien and J. Lunde. 1974. Engineering classification of rock masses

Hoek - When is a design in rock engineering acceptable?
24
for the design of tunnel support. Rock Mechanics, : 189-239.
Bieniawski, Z.T. 1974. Geomechanics classification of rock masses and its
application in tunnelling. Proc. 3rd Cong. ISRM, Denver, A: 27-32.
Cheng, Y. 1987. New development in seam treatment of Feitsui arch dam foundation.
Proc. 6th Cong. ISRM, Montreal, 319-326.
Hammett, R.D. and E. Hoek. 1981. Design of large underground caverns for hydro-
electric projects, with reference to structurally controlled failure mechanisms.
Proc. American Society of Civil Engineers Int. Conv. on Recent Developments in
Geotechnical Engineering for hydro projects, New York, 192-206.
Hoek, E. and E.T. Brown. 1988. The Hoek-Brown failure criterion - a 1988 update.
Proc. 15th Canadian Rock Mech. Symp. J.H. Curran (ed.), 31-38.
Imrie, A.S., D.P. Moore and E.G. Enegren. 1992. Performance and maintenance of
the drainage system at Downie Slide. Proc. 6th Int. Symp. on Landslides,
Christchurch, New Zealand, in press.
Imrie, A.S. 1983. Taming the Downie Slide. Canadian Geographic, .
Lewis, M.R. and D.P. Moore. 1989. Construction of the Downie Slide and
Dutchman’s Ridge drainage adits. Canadian Tunnelling, 163-172.
Liu, S.C., Y. Cheng and C.T. Chang. 1988. Design of the Mingtan cavern. Proc.
ISRM sym. on Rock Mech. and Power Plants, Madrid, 199-208.
Marachi, N.D., C.K. Chan and H.B. Seed. 1972. Evaluation of properties of rockfill
materials. J. Soil Mechs. Foundns Div., Am. Soc. Civ. Engrs. : 95-114.
McMahon, B.K. 1975. Probability of failure and expected volume of failure in high
rock slopes. Proc. 2nd Aust.-New Zealand Conf. on Geomech., Brisbane.
Moore, D.P., A.S. Imrie and D.G. Baker. 1991. Rockslide risk reduction using
monitoring. Proc. Can. Dam Safety Assoc. Annual Meeting, Whistler, British
Columbia, in press.
Moretto, O. 1982. Mecánica de rocas en el complejo hidroeléctrico Río Grande No. 1.
Proc. Primer. Cong. Sudamericano de Mecánica de Rocas, Bogotá, Colombia.
Morgenstern, N.R. 1991. Limitations of stability analysis in geo-technical practice.
Geotecnia, : 5-19.
Morriss, P. and H.J. Stoter. 1983. Open cut slope design using probabilistic methods.
Proc. 5th Cong. ISRM, Melbourne. Sec. C, 107-113.
Moy, D.M. and E. Hoek. 1989. Progress with the excavation and support of the
Mingtan power cavern roof. Proc. Rock Cavern Seminar, Hong Kong, A.W.
Malone and P.G.D. Whiteside (eds), 235-245.
Priest, S.D. and E.T. Brown. 1983. Probabilistic stability analysis of variable rock
slopes. Trans. Inst. Min. Metall. A, : 1-12.
Read, J.R.L. and G.N. Lye. 1983. Pit slope design methods: Bougainville Copper
Limited open cut. Proc. 5th Cong. ISRM, Melbourne. Sec. C: 93-98.
Sarra Pistone, R.E. and J.C. del Río. 1982. Excavation and treatment of the principal
faults in the tailrace tunnel of the Río Grande hydroelectric complex. Proc. IV Int.
Cong. IAEG, New Delhi, India. : Theme 2.

Hoek - When is a design in rock engineering acceptable?
25
Silveira, A.F. 1990. Some considerations on the durability of dams. Water Power and
Dam Construction, 19-28.
Tatchell, G.E. 1991. Automatic data acquisition systems for monitoring dams and
landslides. Proc. 3rd Int. Symp. on Field Measurements in Geomechanics, Oslo,
Norway, in press.
Vanmarcke, E.H. 1980. Probalistic analysis of earth slopes. Engineering Geology. :
29-50.