when does advertising - columbia business school · when does advertising have an impact? a study...
TRANSCRIPT

RAJEEV BATRADONALD R. LEHMANNJOANNE BURKEANDJAE PAE
WHEN DOES ADVERTISINGHAVE AN IMPACT?A STUDY OFTRACKING DATA
RAJEEV BATRA.Associate Prolessor
ot MarketingUniversity of Michigan
DONALD R. LEHMANNGeorge £. Warren
ProfessorGraduate School of
BusinessColumbia University
JOANNE BURKESenior Vice President.
Worldwide Director ofMedia Research
TN Media Inc.
This paper attempts to find characteristics of product categories,brands, and ad copy that lead to either increased or decreased effec-tiveness of advertising spending on ad awareness, brand awareness,or purchase intentions, as measured through tracking data. Using ameta-analysis of such data for frequently purchased packagedgoods, we find that advertising spending has a greater effect onawareness for less-visible brands in growing product categories anda greater effect on purchase intentions when the ad features a newstrategy or new copy or new benefits; when the brand has signifi-cant trade promotion support; when the ad copy is not "soft sell";and when the brand is not already a "declining brand." These re-sults are generally consistent with earlier field studies examiningthe effects of advertising weight on sales.
JAE PAEDoctoral StudentColumbia University
Recent years have seengreat interest, both aca-demic and managerial, in
the issue of whether advertisinghas any appreciable impact onshort-term sales and—if itdoes—the types of situationsthat magnify or attenuate thisimpact. Academic studies havebeen published that argue thatthe direct short-term sales effectof advertising is, in general,quite low {Aaker and Carman,1982; Assmus, Farley, and Leh-mann, 1984; Tellis, 1988). Somepublished industry tests of in-creased advertising spending,using "single-source" data, havefound that increased advertisingleads to short-term sales in-creases (in the current week)about 70 percent of the time,with these increases being mod-est or better only 50 percent ofthe time (Jones, i995a, 1995b).Other industry studies have alsofound that advertising pays offonly in limited situations, suchas in the case of new/smallbrands or, for old/large brands.
only when new marketing strat-egies, new copy, or new reach-maximizing media plans areused (Eastlack and Rao [1986,1989] on the Campbell Soup Co.tests; Lodish et al. [1995] and Lu-betkin [1992] on the IRl tests).Taken together, these recent re-sults support the earlier findingof generally decreasing (concave)returns to increased advertisingspending or exposures (Simonand Arndt, 1980).
However, while these studiessupport the belief that mass me-dia advertising has a limitedability to increase short-termsales, they also raise the ques-tion of whether the same patternof low/diminishing/situationallycontingent returns also exist forother marketing variables thatare influenced by advertising.Two sets of such variables arerelevant here. There are first thecluster of brand awareness, atti-tudes, purchase intent, andquality beliefs that are frequentlycalled "brand equity" or brand"goodwill" (Aaker, 1991; Keller,
Journal of ADVERTISING RESEARCH—SEPTEMBER/OCTOBER 1995 19

T R A C K I N G D A T A
1993). A case could well bemade that while advertising hasonly a limited short-term salesimpact, it may have a bigger(but less easily quantifiable) ef-fect on such "equity" variables,which in turn lead to long-runsales. On the other hand, it isalso possible to conceive of adsthat increase short-term sales butdamage longer-term brand eq-uity. In fact, Jones (1995a, 1995b)reported that while 70 percent ofad campaigns are effective in thecurrent week, only 46 percentsustain that success over thecourse of a year. This differencein short-term versus long-termresults suggest that it is clearlydesirable to also examine theimpact of advertising spendingon variables other than short-term sales.
Second, there are the various"intermediate communicationvariables," such as ad and brandawareness and brand beliefs,attitudes, and intent, that areargued to be "purer" measuresof an ad's communication effec-tiveness than are sales measuresbecause they are not influenced(as are sales) by other market-ing-mix inputs and exogenousevents (Colley, 1961). Since theCampbell Soup, Jones, and IRlstudies cited earlier measuredadvertising effects under experi-mental conditions (and/or usedsingle-source data) that con-trolled for (or covaried out) othermarketing-mix inputs, their salesmeasures effects should be avalid measure of ad effectivenesswhen such experimentally-con-trolled sales data are available.However, experimental and/orsingle-source data are expensiveand limited, so that many stud-ies of advertising effectivenesson sales are forced to use nonex-perimental regression-type mod-els that only incompletely con-trol for these other marketing-mix influences. Since trackingdata on the "intermediate vari-
ables" are frequently collectedby agencies and advertisers, andsince they may be "purer" mea-sures of advertising effect thanincompletely controlled sales ef-fect measures, it is clearly worth-while to see if advertising effectson "intermediate" tracking dataare consistent with advertisingeffects on well-controlled salesdata. If this is found to be thecase, models created on "inter-mediate" tracking data could becreated that have ready and on-going usefulness.
While there have previouslybeen scattered reports in thepublished literature that havequantified the effects of advertis-ing on awareness, attitudes, etc.,under field conditions (e.g., Gei-ger, 1971; Time/Seagram, 1982),such studies have typically beenlimited to one or very fewbrands and product categories,making it difficult to draw con-clusions about the factors thatmoderate (magnify or reduce) theeffects of advertising on suchvariables (such as new versusold brand, new versus old copystrategy, etc.). Studies of moder-ating variables can obviously bedone only if there is enoughvariance, in the data, acrossthese potentially moderatingvariables.
It would therefore seem po-tentially very useful to be able todo the kinds of meta-analysesreported by Assmus, Farley, andLehmann (1984) or Lodish et al.(1995) on dependent variablesother than short-term sales, byidentifying the factors that mag-nify or attenuate the impact ofadvertising and using a databasethat provides adequate variationacross potentially moderatingvariables. This paper reportssuch an analysis. Using a uniqueand comprehensive "tracking"data base developed by an ad-vertising agency, it explores thefactors that appear to moderatethe effects of advertising spend-
ing (GRPs) on ad and brandawareness and on brand pur-chase intent. Many of the inde-pendent or moderating variablesare similar to those used in theCampbell Soup, IRI, and Nielsenanalyses, allowing for a compari-son of findings.
Literature Reviewand Hypotheses
Since our main focus in thisstudy is an investigation of thefactors that appear to moderatethe effects of advertising spend-ing, rather than its "main ef-fect," we limit this review to re-ports of these interacting factors.Most of these studies are "lab"studies, investigating the effectson various dependent measuresof variations in exposure fre-quency. For example, Batra andRay (1986) found that higher lev-els of advertising exposure led toincreasing levels of brand atti-tudes and purchase intentionswhen the product categorieswere such that consumers wereless motivated to process admessage arguments (so-called"low involvement" situations),because more motivated con-sumers "absorbed" the ad mes-sage more quickly, reducing theneed for further exposures.Other lab studies have foundthat heavier levels of repetitioncan be more profitably employedwhen the consumer is more fa-miliar with or loyal to the brand(Raj, 1982); when the ad mes-sage is more complex (Anandand Sternthal, 1990); when thereis more competitive spending(Burke and Srull, 1988) and moreadvertising clutter (Webb andRay, 1979); etc. (See Ostrow[1984] and Pechman and Stewart[1988] for extensive reviews ofthis prior work.)
Among studies using "field"data, similar to the data used inthis study, Tellis (1988) found
20 Journal of ADVERTISING RESEARCH—SEPTEMBER/OCTOBER 1995

T R A C K I N G D A T A
advertising's effect on sales(brand choice) to be strongeramong consumers already loyalto the brand, i.e., a strong "rein-forcement" effect, than in win-ning new buyers for newbrands. Aaker and Carman(1982), reviewing the resultsfrom AdTel split-cable studies ofchanges in advertising weightand copy conducted during the1970s, reported that while only30 percent of the "weight" testsshowed significant differences,47 percent of the copy tests did,suggesting that changes in ad-vertising copy were more likelyto lead to sales gains thanchanges in media weight alone.Assmus, Farley, and Lehmann(1984), in a meta-analysis of thepublished econometric literature(M = 128 models), found thatfood products had elasticities ofsales response to advertisingthat were higher than the mean,while elasticities in Europe were(at that time) higher than thosein the United States.
The three sets of previousstudies that are of most rele-vance to the present researchcome from 19 field experimentscarried out by Campbell Soupduring the mid 1970s (Eastlackand Rao, 1986, 1989), an analysisby IRI of the results of 389 split-cable tests conducted during1982-1988 (Lodish et al., 1995),and analysis of Nielsen "single-source" data by Jones (1995a,1995b) using scanner data col-lected during 1991-1992.
In the Campbell Soup tests,the company found that for thewell-established, mature brandstested, short-term sales effects ofincreased ad expenditures (mea-sured through SAMI warehousewithdrawals) were significantonly when the advertising testednew copy or a new strategy, orwhen a new media mix was em-ployed that attempted to in-crease reach by targeting newaudiences or utilizing different
media or day-parts. In theirwords, "consumers did not re-spond to being told the samething more often" (Eastlack andRao, 1989). Very relevant to thepresent study, they report thattheir tracking data on aware-ness, trial, and usage did nottend to correlate with the salesresults seen, though attitudeshifts tracked did appear to bemore correlated with the ob-served sales changes.
The IRI analysis of 389 split-cable advertising experiments(Lodish et al., 1995; Lubetkin,1992) also comes from the pack-aged-goods domain and in-cluded 217 weight tests for es-tablished brands, 76 weight testsfor new brands, and 86 copytests for established brands. Tosummarize, these tests toofound that there was no simplerelationship between the size ofthe increase in television adver-tising spending weight and theincrease in sales and/or marketshare. Instead, they found(among other results) that higheradvertising spending was morelikely to lead to higher saleswhen:
1. There was a change in brandor copy strategy, and thecopy strategy aimed at chang-ing rather than reinforcingold attitudes.
2. Media plans attempted addi-tional reach and/or used rela-tively less prime-time.
3. The product category wasgrowing, and/or the numberof purchases per buyer washigh.
4. The brand was newer (hadless prior awareness) or wassmailer/medium-sized.
5. Higher levels of consumercouponing existed.
6. The brand had lower levels oftrade dealing (in-store dis-plays, store coupons, etc.).
These were some of the 350
independent category, brand,copy, and media variables thatproved to be significant predic-tors of obtained sales changes atthe 80 percent level of signifi-cance. Some of their results notpertinent to the present studyare omitted here. Importantly,weak or nonexistent relation-ships were found, in the aggre-gate, between standard recall(normalized) copytest scores andsales effects, or standard persua-sion (normalized) copytest scoresand sales effects, unless thosescores were at extremes. Notests were reported of relation-ships between the sales changesfound and tracking data onawareness, attitudes, orintentions.
The study of Nielsen single-source data by Jones (1995a,1995b; see also Ephron, 1995,and Reichel, 1994) is based ondata collected from 2,000 house-holds in 1991-1992 on 78 TV-advertised brands in 12 productcategories. Jones finds, based ona "quintile analysis," that thekey characteristics of the mostsuccessful ad campaigns are thatthey are creatively effective(1995a) and that they are forbrands that command a higher-than-average price (1995a). Jonesalso reports very high synergiesbetween advertising intensityand promotions (1995a). Finally,Jones (1995b) finds support forthe superiority of media strate-gies that emphasize reach overfrequency, because the first ex-posure (in the week-before-pur-chase) provides the biggest ef-fect, with further exposures add-ing very little. Ephron (1995) andReichel (1994) provide furthersupport for the superiority ofsuch reach-enhancing mediastrategies, also using Nielsensingle-source data.
The consistency of resultsamong the three sets of studiesis remarkable. Both the Camp-bell Soup and IRI studies point
Journal ot ADVERTISING RESEARCH—SEPTEMBER/OCTOBER 1995 21

T R A C K I N G D A T A
to the importance, for increasingsales, of having new brand orcopy strategies and/or new me-dia (reach-enhancing) strategies.The Nielsen (Jones) studies alsosupport the importance of cre-atively-superior copy and ofreach-enhancing media strate-gies. The IRI studies, in addi-tion, point to the facilitating roleof category growth, and of con-sumer promotions, in moderat-ing the effect of advertisingweight on sales.
While these empirical resultsmay appear to be somewhat "adhoc" and atheoretical, most ofthem are, in fact, consistent witha conceptual framework inwhich increased advertisingspending pays off only to theextent that there is further"room" for it to have an effect.In other words, increased adver-tising spending could logicallybe expected to result in measur-able effects (on sales, attitudes,intent, etc.) only if prior levels ofconsumer knowledge about thebrand were not already as highas they could be. Such consumerknowledge levels would be atalready very high levels if thebrand was already extremelywell-known, or was an old/ma-ture brand, or had high con-sumer penetration or very highmarket share, or had very highprior ad support levels. Con-versely, such existing consumerknowledge would be at rela-tively low levels if the consumerwas new to the category and/orthe brand, either because thecategory was growing fast orbecause the brand was new orrelatively less known, or becausethis consumer had not been ex-posed to the media that tradi-tionally carried that brand's ad-vertising. Consumer knowledgewould also have more room tobe affected by advertising if themessage in the ad was substan-tially different from that commu-nicated in earlier ads; if not, the
ad would only be attempting tocommunicate something alreadyknown by the consumer, leadingto no measurable change. Insum, such a conceptual frame-work could explain most of theresults found in the CampbellSoup, IRI, and Nielsen results,and we could logically use it toanticipate results in the presentdata set.
As mentioned, the distinctivefeature of this present data set isthe availability of data on adver-tising weight effects, not onshort-term sales, but on trackingdata on ad and brand awarenessand brand purchase intent. Theobvious question in developingour hypotheses is whether weshould expect the effects of adweight on our tracked variablesto parallel the effects found onshort-term sales.
Using the conceptual frame-work just suggested, we shouldexpect increased advertisingweight to lead to increases inthese tracking communicationmeasures of ad awareness,brand awareness, and purchaseintent more when existing con-sumer knowledge of that ad'smessage was relatively low, e.g.,for changed ad strategy or newcopy, for newer brands, forfaster growing product catego-ries drawing in newer consum-ers, for situations where prior adsupport levels were relativelylow, etc. There are several rea-sons, however, why this "over-all" expectation may not applyto our three tracking variablesequally. Note that, as mentionedearlier, the Campbell Soup stud-ies (Eastlack and Rao, 1989)found that their ad (weight andcopy) effects on sales were paral-leled somewhat by effects onbrand attitudes but not by ef-fects on brand awareness. Thismight seem to suggest that inour data such ad effects shouldemerge most clearly on ourbrand purchase intent variable.
since that is conceptually closerto brand attitudes (and to actualsales) than either of our aware-ness variables.
However, there are severalreasons why this may not hap-pen. First, the Campbell Soupresults (of no ad effects ontracked brand awareness) maysimply be due to "ceiling ef-fects": for their tested brands,prior brand awareness may sim-ply have been at such high lev-els that further increases wereclose to impossible, while saleslevels still had "room to grow"(e.g., through increases in percapita consumption among al-ready-aware consumers) andthus did so. It is possible thatthese particular results may behard to generalize to less well-known brands.
Second, the hierarchy-of-ef-fects model suggested by Colley(1961) and others would indicatethat ad effects should lead firstto increases in ad awareness,which should precede any ef-fects on brand awareness, whichthemselves should then lead toany changes in brand purchaseintent. This would then suggestthat any increases in ad weightshould be felt most strongly onad awareness (the first stepamong our three dependentvariables), next most strongly onbrand awareness (the second"step" in our set of variables),and least strongly on purchaseintent (the final "step"). Ad ef-fects on ad awareness shouldalso be greater than effects onbrand awareness, because thelatter should be more stable andless volatile than the former,since brand awareness also de-pends on other marketing fac-tors like distribution. Indeed,using the "hierarchy-of-effects"idea that effects on a lower"step" of the hierarchy must bepreceded by effects on earliersteps, it might even be arguedthat increased ad weight would
22 Journal ot ADVERTISING RESEARCH—SEPTEMBER/OCTOBER 1995

T R A C K I N G D A T A
Table 1Moderating Variables Available in Data Set
A. Product category characteristics1. Category penetration (<20%/20-50%/50-80%/80% +)2. Category life-cycle stage (new/growing/mature/declining)3. Category annual growth rate (decline/<5%/5-10%/10-25%/>25%)4. Number of purchases per year
S. Brand characteristics5. Brand life-cycle stage (new/growing/mature/declining)6- Brand annual growth rate {decline/<5%/5-10%/10-25%/>25%)7. Relative market share (low/be!ow average/average/above average/high)8. Relative price (low/below average/average/above average/high)9. Relative advertising level (low/below average/average/above average/high)
10. Relative promotion support (low/below average/average/above average/high)11. Relative quality reputation (low/beiow average/average/above average/high)
C. Advertising characteristics12. Use ol image in copy (yes/no)13. Use of humor in copy (yes/no)14. Use of emotion in copy (yes/no)15. Use of product benefits in copy (yes/no)16. Use of product demonstrations in copy (yes/no)17. Use of technical facts in copy (yes/no)18. Use of comparative techniques in copy (yes/no)19. Was a new use or benefit highlighted (yes/no)20. Was the copy new/old21. Was the strategy nevi//old
D. Sales promotion characteristics22. Use of money-off coupons (yes/no)23. Use of product sampling (yes/no)24. Use of in-store display (yes/no)25. Use of direct mail (yes/no)26- Use of trade promotions (yes/no)
have no effects on purchase in-tentions if ad and brand aware-ness were not already at highlevels.
Third, as pointed out by themarketing consultancy Millward-Brown, the tracked awarenessmeasures may well be conse-quences of actual sales, ratherthan predictors of it in the hier-archy-of-effects sense just dis-cussed. To quote: "The brandsthat come most readily to peo-ple's minds are the ones they'verecently bought!" {Brown, n.d.).These arguments too suggestthat ad effects on both brandand ad awareness should thusalso correlate highly with effectson sales, albeit not for the hier-archy-of-effects reason justdiscussed.
Finally, for packaged goodssuch as the ones in our data set,advertising-induced changes in
ad and brand awareness couldboth be expected to correlatehighly with eventual changes insales, and thus track the Camp-bell Soup/IRl/Nielsen results onsales, because (inadequate) dis-tribution and (too-high) price areunlikely to be barriers to pur-chase. The correlation betweenbrand recall and purchase intentis usually high for low-involve-ment goods such as these (Beat-tie and Mitchell, 1983), so thatthe same factors that moderatead-weight effects on sales shouldalso moderate ad-weight effectson ad and brand awareness.
For these reasons, we take asour working hypothesis the ex-pectation that the moderatin<^ fac-tors that proved significant in theCampbell Soup, IRI, and Nielsendata, on sales effects, will alsoprove to be significant modera-tors of ad-weight effects on ad
and brand awareness and pur-chase intent in our tracking data.However, since advertising ef-fects are probably most directlyrelated to our measures of adawareness, next closest to brandawareness, and least close topurchase intentions, we expectthe nmin effect of advertising tobe strongest for ad awarenessdata, less so for brand aware-ness data, and least for purchaseintentions data.
Data and Method
The data for this study werecollected by the Media ResearchGroup at the Foote, Cone andBelding advertising agency (nowcalled True North Communica-tions) in New York, from theirarchived data on campaigns runduring the late i980s and early1990s. For each campaign, track-ing data on various measureshad been collected, usually fromongoing telephone interviewswith target consumers (such asfemale heads of household/pri-mary grocery shopper), usingnational probability samples.The period of these data variedacross cases (in some cases theywere quarterly, in othersmonthly or weekly). Theseserved as the dependent vari-ables in the analysis. Reach andFrequency data, and thus GrossRatings Points (GRP) data, werealso collected for matching timeperiods, by individual medium(these were aggregated across allmedia in the analysis, withoutany weighting). This served asthe main predictor variable. Theagency person(s) involved witheach campaign also filled out aquestionnaire providing data onthe product category, brand,brand ad campaign, and concur-rent promotional campaigns,which served as potential mod-erator variables. A listing ofthese is provided in Table 1.
Journal of ADVERTISING RESEARCH—SEPTEMBER/OCTOBER 1995 23

T R A C K I N G D A T A
Data were obtained for a totalof 29 separate campaigns, witheach campaign providing be-tween 2 and 25 observations,some for multiple target audi-ences. (For example, one subsetof the data covered a campaignfor confectionery products, withquarterly tracking data fromeach of two teen and adult tar-get markets, from the secondquarter of 1989 to the first quar-ter of 1992.) From these data, aset of matched observations wascreated using every pair of adja-cent time periods: e.g., the adawareness of the third quarter of1989 (time period "t") waspaired for modeling purposeswith the GRPs for that sametime period t, the ad awarenessin the prior second quarter (timeperiod M), and the coded mod-erating variables (which did notchange across time periods).This led to a total set of 230 such"matched" observations. Itshould be apparent that thesewere not 230 technically inde-pendent observations, since sev-eral of them came from the sameset of product/campaign/yearfactors. Thus their use in theOLS regressions reported belowas if they were independent ob-servations does constitute a tech-nical limitation, to be discussedlater.
Since the data available foreach campaign often covereddifferent dependent and moder-ating variables, leading to largeamounts of missing data, theanalysis below was restricted tothat subset of the data and thosevariables where enough data ex-isted to allow analysis. Usabledata were available for 224 ob-servations for ad awareness, 230for brand awareness, and 159 forpurchase intentions, before afew outliers were excluded (de-scribed below). The dependentvariables were ad awareness,brand awareness, or brand pur-chase intent, in time period
f-l-1. The independent vari-ables and moderating variableswill be discussed below.
1. Outlier Exclusion. The dis-tribution of each variable poten-tially usable in the analysis waschecked, through histograms,stem-and-leaf plots, and normalprobability plots. The cases thatwere causing outliers (observa-tions more than 2 standard devi-ations from the mean) were iter-atively deleted, starting with themost severe offenders first. Itwas discovered that the ninemost problematic cases could bedeleted by applying the rule thatcases should be limited to thosewhere the year-to-year percent-age change in the reported levelsof brand awareness, ad aware-ness, brand purchase intentions,and media GRPs were each lessthan 200 percent above their pre-vious-year levels. In otherwords, outliers tended to comefrom those cases where one ormore of these variables changedby more than 200 percent fromtheir year-ago levels, and thesecases were excluded. Another 3cases were excluded becausethey came from Europe, thuslimiting the final 218 cases toUnited States data only. In sum,12 cases (5 percent) of the origi-nal usable cases were excludedfrom the cases either becausethey represented extreme levelsof change (200 percent +) in keyvariables, or because they camefrom an isolated set of non-U.S.data, leaving 218 cases for brandawareness, 213 for ad aware-ness, and 147 for purchaseintentions.
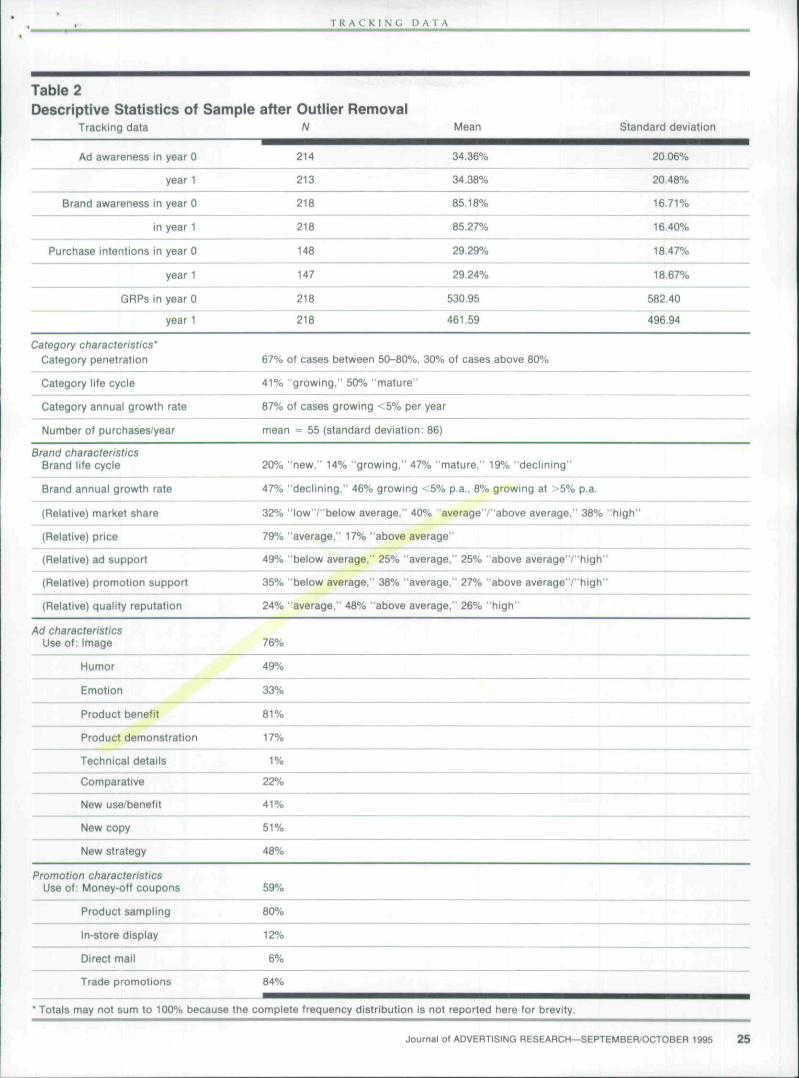
2. Descriptive Statistics. Se-lected descriptive statistics of thedata set (after outlier removal)are presented in Table 2. Theaverage level of base period adawareness of the brands in thesample was about 34 percent(range: 2 percent to 96 percent),of brand awareness 85 percent(range: 22 percent to 100 per-
cent), and of purchase intentions29 percent (range: 3 percent to75 percent). The level of GRPsper four-week tracking periodaveraged about 500 (rangingfrom 0 to 3612). The change inad awareness averaged -1-0.16percentage points (range: -31percentage points to + 31 per-centage points). For brandawareness the change averaged-f0.18 percentage points (range:- 20 percentage points to -\- 20percentage points), while forpurchase intentions there wasessentially no increase on aver-age, though the change rangedfrom -14 percentage points to+ 18 percentage points.
A "profile" of our data set, interms of the potential moderator(category, brand, ad execution,and promotion support) charac-teristics, is aiso in Table 2. Ourdata typically came from fre-quently purchased products, incategories that are mature andslow-growing, with high cate-gory penetration rates. Onlyabout a third of the brands werenew or still in their growthstages. Most had average pricebut above average quality, withrelatively stronger promotionsupport than advertising sup-port. The ad executions usedtended to rely more on image(76 percent) than on productdemonstration (17 percent) or acomparative format (22 percent).About half used a new ad strat-egy and/or new ad copy. Promo-tional support tended to consistmostly of trade promotions(used by 84 percent), productsampling (used by 80 percent),and money-off coupons (used by59 percent).
3. Analysis Overview. Ourconcern in this study is the iden-tification and statistical testing ofinteractions: variables that eithermagnify or reduce the effect ofadvertising spending (measuredvia GRPs) on the three depen-dent variables of interest (cur-
24 Journal of ADVERTISING RESEARCH—SEPTEMBER/OCTOBER 1995
T R A C K I N G D A T A
Table 2Descriptive Statistics of Sampie after Outiier Removai
Tracking data N Mean Standard deviation
Ad awareness in year 0
year 1
Category characteristics'Category penetration
Category lite cycle
Category annual growth rate
Number of purchases/year
214 34.36% 20.06%
213 34.38% 20.48%
Brand awareness in year 0
in year 1
Purchase intentions in year 0
year 1
GRPs in year 0
year 1
218
218
148
147
218
218
85.18%
85.27%
29.29%
29.24%
530.95
461.59
16.71%
16.40%
18.47%
18.87%
582.40
496.94
87% of cases between 50-80%. 30% of cases above 80%
4 1 % "growing," 50% "mature"
87% ot cases growing <5% per year
mean = 55 (standard deviation: 86)
Brand characteristicsBrand lite cycle 20% "new," 14% "growing," 47% "mature," 19% "declining"
Brand annual growth rate
(Relative) market share
(Relative) price
(Relative) ad support
(Relative) promotion support
(Relative) quality reputation
47% "declining," 46% growing <5% p.a.. 8% growing at >5% p.a.
32% "low"/"be!ow average," 40% "average"/"above average," 38% "high'
79% "average," 17% "above average"
49% "below average," 25% "average," 25% "above average'V'high"
35% "below average," 38% "average," 27% "above average " / "h igh"
24% "average," 48% "above average," 26% "high"
Ad characteristicsUse of: Image
Comparative
New use/benefit
New copy
76%
Humor
Emotion
Product benefit
Product demonstration
Technical details
49%
33%
81%
17%
1%
22%
4 1 %
51%
New strategy 48%
Promotion characteristicsUse of; Money-off coupons
Product sampling
59%
80%
In-store display 12%
Direct mail
Trade promotions
6%
84%
' Totals may not sum to 100% because the complete frequency distribution is not reported here for brevity.
Journal of ADVERTISING RESEARCH—SEPTEMBER/OCTOBER 1995 25

T R A C K I N G D A T A
rent period ad and brand aware-ness and purchase intentions).The regression models to be esti-mated therefore include as inde-pendent variables (a) current pe-riod GRPs, (b) the main effectsof these moderator (interaction)variables, (c) the interactions ofthese moderator variables withGRPs, and (d) the lagged depen-dent variable, measuring carry-over effects. We used as the de-pendent variable the logit of ad,brand, or purchase intentions.{The logit of any dependent vari-able expressed as a percentage[e.g., of percent ad awareness] iscomputed as the natural log of[percent ad awareness/(l - per-cent ad awareness)].) This trans-formation of the dependent vari-able adjusts for ceiling effects. Italso has the advantage that, un-like the untransformed aware-ness or intentions dependentvariable, it is constrained to amaximum of 100 percent and istherefore logically consistent.
Gorrelations among our mod-erator category/brand/ad/pro mo-tion variables were high enoughto be potential sources of mul-ticollinearity in such a model.For instance, product categorypenetration correlated 0.58 withcategory life cycle stage, highbrand market share correlated0.72 with high brand promo-tional support, and the presenceof image in the ad execution cor-related -0.54 with the use of acomparative claim—while rawGRPs correlated only in the 0.05to 0.33 range with the depen-dent variables. Because suchmulticollinearity would make itdifficult to obtain significant co-efficient estimates using themodel above, several collinear-ity-reducing changes were madeprior to obtaining our regressionestimates.
First, instead of using eachmoderator variable as a separateindependent variable (with itsown interaction term with ad
spending), we create and useprincipal components based onthose moderator variables,where each principal componentis orthogonal (unrelated) to eachother and thus does not sufferfrom multicollinearity.
Second, we use these principalcomponents (created from themoderator variables) to clusterour cases (observations) into ho-mogenous subsets of advertisingsituations sharing the same lev-els of the principal components.In other words, our data set ofproduct categories, brands, andad campaigns was broken upinto smaller clusters or groups,each group being internally simi-lar on those moderator variables,with the different groups differ-ing maximally on those modera-tor variables. Thus one clustermight potentially consist ofnewer brands in younger prod-uct categories with newer admessages, while another mightpotentially consist of olderbrands in mature categories thatare simply repeating old copy.Dummy variables for these clus-ters (and their interactions) werethen used as the independentvariables in our regressionmodel. This approach allows thenaturally occurring pattern ofrelationships that exist in thedata (e.g., new ad strategy andcopy are more likely from newerbrands in growing categories) tobe used in the model, withoutcreating artificially orthogonalconstructs while also reducingmulticollinearity. This approachis recommended by Farley andLehmann (1986).
Third, since each main effectin the model is highly coUinearwith its interaction with GRPs,making interpretation of maineffects problematic, we obtainour model estimates not on theraw independent variable (clus-ter dummy variable) data butinstead on mean-centered data.That is, each of the independent
cluster dummy variables wasfirst rescaled to a mean of zerobefore its interactions with GRPswas computed. As pointed outby Ross and Creyer (1993), thecoefficients estimated for themain effects are interpretablewhen such mean-centered dataare used but not if the raw dataare used.
Our final modification wasmade not to reduce collinearitybut to allow for the effects ofadvertising GRPs on the trackeddependent variables to be nonlin-ear. It is well known that the ef-fects of advertising on variousmeasures have most frequentlybeen found to fit a downwardconcave (decreasing returns)function (Simon and Arndt,1980). We therefore checked tosee if the relationship betweenthe current period awareness/intentions measures and currentperiod advertising GRPs wentup if those GRPs were trans-formed to either their natural logor their square root. We foundsubstantial increases when thesquare-root transformation wasused. As a consequence, GRPswere used in the model after asquare-root transformation, andthe interaction terms for thedummy variables were createdby multiplying the mean-cen-tered dummy variables with thesquare root of GRPs.
To summarize, the regressionmodels estimated below were ofthe following form: Logit of thecurrent-period dependent vari-able (ad awareness/brand aware-ness/purchase intentions) as afunction of:
1. square root of current periodadvertising GRPs
2. the dependent variable onetime-period ago
3. dummy variables for the clus-ter into which each case (ob-servation) fell, these clustersbeing based on principal com-ponents of the moderator
26 Journal of ADVERTISING RESEARCH—SEPTEMBER/OCTOBER 1995

T R A C K l N t ; D A I A
variables (each dummy vari-able being mean-centered),and
4. interaction terms of eachmean-centered clusterdummy variable times thesquare root of current periodadvertising GRPs
4. Analysis of Moderator Vari-ables. All moderator variablesavailable in the data set wereused in a principal componentsanalysis, except for four that hada relatively high number of miss-ing values. The 22 moderatorvariables yielded a scree patternin which the first 8 components
had gradually declining eigenvalues greater than 0.99, fol-lowed by a drop to 0.87; these 8components were thus retained,cumulatively explaining 85 per-cent of the variance. The vari-max-rotated loadings for theseeight components are repro-duced in Table 3.
Table 3 shows that the firstcomponent consists of the adstrategy being old, the brandbeing a mature/declining brand,the ad copy being old, and thead copy being comparative. It isnegatively related to the ad copybeing image-oriented (so the adis not image oriented) and the
ad copy showing a new use orbenefit (so the ad copy is notshowing a new use or benefit).We therefore call this first com-ponent "Old News."
The second component is pos-itively related to the ad copy be-ing emotional and using humorand, less strongly, on emphasiz-ing image. It loads negatively onthe ad copy featuring productbenefits (so the ad copy does notemphasize product benefits). Wecall this second component "SoftSell."
The third component relatespositively to the brand using in-store displays, the ad copy using
Table 3Principal Components Loadings (Varimax-Rotated)
Ad strategy - old
Brand mature/declining
Ad copy = old
0.83 -0.06 0.17 0.03 0.23 -0.12
0.81
0.77
Ad copy = comparative 0.66
0.19
0.41
0.38
Ad copy = image 0.61 0.49
Ad copy = new use -0.79 -0.36
0.11
0.07
3.13
-0.30 0.04
0.10 -0.28
0.10
0.26
0.12 0.05 0.00
Ad copy = emotional
Ad copy = humorous
Ad copy - product benefits
0.19 0.77 0.06 0.03 0.26 -0.14
Promotions = in-store display
Ad copy = demonstration
Price high
Promotions = sampling
-0.07 0.02 0.65 -0.17
-0.07 0.05 -0.79 0.12
0.29
0.04
0.37
0.27
-0.04
0.47
0.02
0.35
-0.27
0.37
-0.26
-0.19
0.05
-0.17
0.20
-0.19
0.22
-0.17
-0.10
-0.16
0.02
0.07
0.27
-0.05
0.11
0.12
0.18
0.05
0.07
tits -0.11
i splay 0.05
n 0.07
0 ^
-0.89
0.08
-0.12
-0.08
0.08
0.81
0.76
0-30
0.29
-0.00
0.06
0.16
-0.23
0.02
0.19
0.08
-0.09
-0.01
0.02
-0.00
-0.02
0.13
-0.22
-0.08
0.00
0.31
-0.08
0.18
-0.09
High purchase frequency
Category = mature/declining
Brand = high quality
Promotions = trade promotions
Promotions = coupons
Category = high growth
Category = high penetration
Promotion = direct maii
Ad copy = technical
-0.04
-0.03
0.15
0.01
0.31
-0.30
-0.22
-0.05
0,08
0.06
-0.10
0.47
-0.03
-0.45
-0.11
-0.15
-0.12
ao2
-0.30
0.44
0.12
0.13
0.29
0.00
0.19
0.20
0.28
0.88
0.71
-0.65
-0.22
-0.28
-0.01
0.39
0.00
0.01
-0.20
0.04
0.18
0.91
-0.60
0.09
0.25
0.03
0.01
-0.04
-0.20
0.28
-0.09
-0.15
0.82
-0.74
-0.09
0.06
-0.02
-0.07
-0.07
0.08
-0.19
-0.10
-0.04
0.83
0.15
0.07
-0.18
-0.35
0.05
0.16
-0.01
0.11
-0.17
0.82
Journal of ADVERTISING RESEARCH—SEPTEMBER/OCTOBER 1995 27

T R A C K I N G D A T A
product demonstrations, and thebrand being relatively highpriced. It loads negatively andstrongly on the brand usingsampling (so no sampling is be-ing used). This component is noteasy to describe, but we label it"Visibility."
The fourth component is posi-tively related to the ad copy us-ing humor, the purchase fre-quency being high, and on theproduct category being in its ma-ture or declining life-cycle stage.It relates negatively to the levelof relative brand quality (sobrand quality is relatively low).We label this component "De-clining Brand."
The fifth component is posi-tively related to the use of tradepromotions and negatively tothe use of coupon promotions.We call this component "Empha-sis on Trade Promotions."
The sixth component is posi-tively related to product-categorygrowth and negatively to cate-gory penetration. We call thiscomponent "GrowingCategory."
The seventh component ispositively related to the use ofdirect mail and also to the ad
copy being comparative. We callthis component "Hard Sell."
The eighth and final compo-nent is positively related to thead copy being technical. We callthis component "TechnicalCopy."
5. Clustering Results. Princi-pal component scores were com-puted for each of the eight com-ponents for each observation inthe data set and were then stan-dardized to a mean of zero anda standard deviation of 1.K-means clustering analysis (im-plemented through the SAS pro-cedure FASTCLUS) was thenused to cluster the 218 observa-tions, on the basis of the stan-dardized principal componentscores. Cluster solutions wereobtained for two through eightclusters and the resulting statis-tics (pseudo-F statistic, approxi-mate overall R-squared, and cu-bic clustering criterion) com-pared across the differentsolutions. The comparison sug-gested using the seven-clustersolution, because it yielded thehighest values for the three sta-tistics. Two of the seven clusterswere large {n = 113 andn = 53), two were small {n = 20
and u = 19), while three wereessentially trivial {n's = 7 orunder).
A "profile" of the means ofthe seven clusters on the eightstandardized principal compo-nent scores is provided in Table4. For brevity, this discussionlimits itself to the four "nontriv-ial" clusters (numbers 3, 4, 5,and 7).
The brands and campaigns inCluster 3 appear to be above av-erage on the first component("old news"), the second com-ponent ("soft sell"), and on thefourth component ("decliningbrand"). They appear to be wellbelow average on the fifth com-ponent ("emphasis on trade pro-motions"), implying the brandsare not being supported by hightrade promotions. We call thiscluster of brands/campaigns "Nonews/no trade promotions."
The brands and campaigns inCluster 4 appear to be above av-erage on both the second ("softsell") and third components("visibility"). We call this clusterof brands/campaigns "Visible/soft sell."
The brands and campaigns inthe biggest cluster. Cluster 5, are
Table 4Cluster Scores on Standardized Principle Components
Principal component
1
Cluster
1
2
3
4
5
6
7
n
3
7
19
20
113
3
53
"Old" News
-0.26
0.08
0.73
0.32
-0.02
-0.71
-0.31
"Soft Seli"
-0.53
-0.54
0.47
0.40
0.07
-0.18
-0.37
"Visibility"
0.99
-0.06
-0.43
2.20
-0-53
2.32
0.28
"Declining Brand"
-0.40
-0.30
1.61
-0.04
-0.69
0.09
0.96
"Emphasison TP"
-0.25
-0.15
-2.20
0.06
0.08
0.07
0.68
"GrowingCategory"
4,91
-3.02
0.07
0.22
0.19
-0.49
-0.35
•Hard Sell"
3.77
3.42
-0.39
0.67
-0.16
-1.28
-0,36
"Technical Copy"
0.17
-0.75
-0.09
-0.06
0.02
6.96
0.27
28 Journal of ADVERTISING RESEARCH—SEPTEMBER/OCTOBER 1995

I K .A C K I i \ G D A T A
not surprisingly pretty average.They are low on the third "visi-bility" component and most neg-ative on the fifth "decliningbrand" component. Thus theseare relatively high-quality brandsin new/growing categories that,at least for now, are not yet sa-lient and visible. We call thiscluster of brands/campaigns"Emergers."
Our last major cluster. Cluster7, has brands and campaignsthat are noticeable most for theirabove-average level of trade pro-motions {component 5), thoughthey are also relatively high onthe 4th "declining brand" com-ponent (mature categories, par-ity equality, etc.). We call thiscluster "Promoted life-support."
6. Prediction of Awarenessand Intentions. OLS regressionestimates were obtained formodels in which the logit of thedependent variable (ad aware-
ness, brand awareness, or pur-chase intentions) in the currenttime period "t" depended onthat same variable in the priortime period "t-\"; the square-root of GRPs in that same time-period; the dummy variables forclusters 3, 4, 5, and 7; and theinteraction term of the square-root of same-period advertisingGRPs times the cluster dummyfor clusters 3, 4, 5, and 7. Thedata for the dummy variableswere mean-centered before thesedummy variables, and their in-teraction terms with the square-roots of GRPs, were created. Thefew observations from the threetrivial-sized clusters (1, 2, and 6)were omitted both because theirestimates would be unstable andbecause at least one cluster hasto be dropped to allow themodel to be estimated.
The results, presented in Table5, provide both the unstandard-
ized and standardized coefficientestimates. Many previous fieldstudies of advertising effective-ness (e.g., Haley and Baldinger,1991; Lodish et al., 1995) haveonly found significant effects atp < .20, so this seemingly looselevel of significance should beconsidered a reasonable onehere. Note that a significant co-efficient for a dummy variablefor a cluster merely means thatthe particular dependent variabletends to be higher for brands/campaigns in that situation.What is of interest to this studyis the significance of the interac-tion terms, which imply thathigher advertising weight has adifferential effect (higher orlower, depending on the sign)on that dependent variable forbrands/campaigns falling intothat cluster.
Ad Awareness. The resultsshow first that carryover effects.
Table 5OLS Regression Results
n
R'
Intercept
Dependent variable in last time period
Square-root ot GRPs in this time-period
Square-root of GRPs' Cluster 3
Cluster 3 dummy {No news/No TP)
Square-root of GRPs* Cluster 4
Cluster 4 dummy (Visible/soft sell)
Square-root of GRPs* Cluster 5
Cluster 5 dummy (Emergers)
Square-root of GRPs* Cluster 7
Cluster 7 dummy (Promoted Life Support)
Standardized Coefficients in parentheses,•p < .01
•*p < .05* " p < .10
****p< .20
Logit of AdAwareness,
212
0 826
-2.14 (0.00)
0.04 (0.82)*
0.01 (0.15)'
-0.00 (-0.00)
-0.20 (-0.06)
0.02 (0.05)
0.02 (0.01)
0.02 (0.11)*'**
0.03 (0.01)
0.01 (0.02)
-0.21 ( - 0 . 0 9 ) " "
Logit of BrandAwarenesSr
205
0.797
-2.98 (0.00)
0.06 (0.78)*
0.02 (0.17)*
0.02 (0.06)
-0.07 (-0.01)
0.00 (0.01)
0.34 (0.07)""
0.05 (0.21)"
0.41 (0.15)***
0,01 (0.03)
0.13 (0.04)
Logit of PurchaseIntentions,
146
0.910
-2.24 (0.00)
0.04 (0.79)'
0.00 (0.01)
-0.02 ( 0.13)****
0.09 (0.03)
-0.03 ( - 0 .08 ) " '
0.61 (0.14)*
-0.01 (-0.08)
0.45 (0.23)"
-0.03 ( -0 .18 ) "
0,22 (0,10)
I1
Journal of ADVERTISING RESEARCH—SEPTEMBER/OCTOBER 1995 29

T R A C K I N G D A T A
and the main effect of advertis-ing weight, are both highly sig-nificant {p < .01). We see nextthat ad awareness tends to behigher in general (i.e., a signifi-cant "main effect" exists) forcluster 7, brands that are highlytrade-promoted. This could ei-ther be because highly trade-promoted brands are alreadyhigh awareness brands, or be-cause the trade promotions drawconsumer attention to thesebrands' ads. More importantly,advertising weight effects on adawareness are higher for cluster5 brands (p < .20). This clusterconsists of brands that are ofrelatively high quality, in new/growing product categories, andthat do not already have a highlevel of "visibility," what weearlier called "Emergers."
Brand Awareness. The resultsagain show first that carryovereffects, and the main effect ofadvertising weight, are bothhighly significant {p < .01). Theclusters that have a significant"main effect" here are clusters 4{p < .20) and cluster 5 (p < .10).This implies that brand aware-ness tends to be higher in gen-eral for brands that are either"Visible/soft sell" of the "Emerg-ers" (as for ad awareness). Moreimportantly for our purposes, asignificant interaction betweencluster membership and adweight emerges only for cluster5 (at p < .05), the "Emergers."As for ad awareness, it appearsthat ad weight has a greater ef-fect on brand awareness forbrands that are of relatively highquality, in new/growing productcategories, and that do not al-ready have a high level of"visibility," our so-called"Emergers."
Purchase Intentions. For in-tentions, while carryover effectsare again significant {p < .01),there is no statistically significantmain effect of ad spending. Wedo, however, find three statisti-
cally significant interactions ofad spending weight with clustermembership.
First, it appears that ad weightappears to have a significantlylower effect on purchase inten-tions for cluster 3, the "no news/no trade promotions" cluster(p < .20). By implication, thismeans that ad weight effects onpurchase intentions are signifi-cantly higher when there (s"news" (such as a new ad strat-egy, new ad copy, or ad copyshowing new benefits or uses)and/or when there is tradesupport.
Second, it appears that adweight has a significantly lowereffect on purchase intentions forcluster 4, the "Visible/soft sell"cluster (p < .10). By implication,this means that ad weight effectson purchase intentions are sig-nificantly higher when the adcopy is not "soft sell"—orientedtoward image, emotion, or hu-mor—but instead focuses moreon product benefits (which pro-vide a specific reason for buy-ing). Further, these effects arehigher when a brand does notalready have high in-store dis-plays, does use sampling, and isnot relatively high priced.
Finally, ad weight effects onintentions appear to be signifi-cantly lower for cluster 7(p < .05). These are the "declin-ing brands" (mature categories,parity quality) getting high tradepromotion support. It appearsthat increasing ad spending isrelatively ineffective for suchbrands.
Discussion
In summary, our results showboth similarities and differenceswith the earlier results found inthe Campbell Soup, IRI, andNielsen studies. In terms of sim-ilarities, we too find a strongand significant increase in the
effect of advertising when theproduct category is new orgrowing. This effect emerges forour dependent measures oftracked ad and brand awareness.Also like those earlier studies,we too find that a new ad strat-egy or new copy or ad copystressing new uses of benefitsmagnifies the effect of higher adweight, though this resultemerges in our tracking dataonly for purchase intentions.
In terms of differences, wefind (and the other studies didnot) a role for product quality, inthat ad weight increases ad andbrand awareness more for rela-tively high-quality brands. Fur-ther, we find that a high-pricedbrand tends to gain less in ad-induced purchase intent than anaverage-priced brand, presum-ably because the higher priceitself communicates or serves asa quality or image cue, thus re-ducing the relative impact of adweight. Finally, we find (andthey did not) that ad weight ef-fects on intentions go up withad copy that focuses on productbenefits and down with copystressing image, humor, or emo-tion, at least for brands that donot already have high in-storedisplays or use sampling. Nosuch result apparently emergedin the earlier studies.
In fact, the effects we foundfor promotional variables arecomplex and do not alwaysagree with those from the IRIstudies. Lodish et al. (1995)found that high trade promotionsupport reduced ad weight ef-fects on sales. We found tradepromotion support to be helpfulin increasing ad effects on pur-chase intentions as long as thead copy or strategy was new,but not if the brand was matureand of low quality (a "de-cliner"). And while Lodish et al.found that higher levels of con-sumer couponing increased adweight effects on sales, no such
30 Journal of ADVERTISING RESEARCH—SEPTEMBER/OCTOBER 1995

T R A C K I N G D A r A
effects appeared in our data. Wealso found results for in-storedisplays and sampling on ourawareness and intentions vari-ables that were complex andhard to understand. Perhaps ourpromotion variable results aresuspect because of the limitedquality and reliability of our pro-motional support data.
In terms of the "main effects"of advertising weight, we foundthe effects of advertising GRPsthemselves to be highly signifi-cant (and about equal) for adand brand awareness, butnot significant for purchaseintentions.
Limitations and Future Re-search. Our data sample issomewhat small, our intermediaaggregation of GRPs ignoresqualitative differences across themedia where the money isspent, and our subjectivelycoded moderating variables po-tentially contain significant mea-surement error. Perhaps the big-gest limitation of the presentstudy, however, is our technicalinability to correct for the "lackof independence" of many ofthe observations. It would havebeen desirable to model this ex-plicitly and to estimate the ef-fects of advertising separately foreach of the 29 separate cam-paigns for which data were pro-vided. Unfortunately, most testscovered only a few (typically 4)time periods, so that after usinga lagged dependent variablethey usually only generated 3 orso observations. Since the mod-els had at least 4 parameters,estimation at the campaign levelwas infeasible. We thereforepooled the observations acrosstests in our meta-analytic design.Given the number of campaigns(29), it was also not possible toreliably estimate individual testvariances/effects. We thereforemade the reasonable but untest-able assumption that systematicdifferences are largely accounted
for by the situational moderatingvariables modeled in our meta-analysis. The disadvantages ofour "forced pooling" are hope-fully offset by the advantages ofour meta-analytic approach.However, future research mustclearly try to use bigger samples,with longer test periods, to cor-roborate our results.
Contributions and Manageriaiimplications. Despite the limita-tions just discussed, this studyshould contribute significantly toour understanding of the condi-tions under which increased adspending pays off. it serves tocorroborate some of the keyfindings of the Campbell Soup,IRI, and Nielsen studies, espe-cially the importance of boostingad spending when the categoryand brand are new or growing,and when the ad strategy is newrather than old. In addition, thefact that we obtain findings us-ing easily available tracking datathat corroborate results obtainedearlier using hard-to-get experi-mental or single-source data isitself a valuable result, suggest-ing that tracking data may be ofgreater use than earlier assumedin building models predictive ofsales results. •
References
Aaker, David A. Managing BrandEquity. New York: The FreePress, 1991.
, and James M. Carman."Are You Overadvertising?"journal of Advertising Research 22,4 (1982): 57-70.
Anand, Punam, and Brian Stern-thai. "Ease of Message Process-ing as a Moderator of RepetitionEffects in Advertising." fournal ofMarketing Research 27, 3 (1990):345-53. '
Assmus, Gert; John Farley; andDonald Lehmann. "How Adver-
RAJEEV BATRA is associate professor ofmarketing at the University of Michigan Busi-ness School He has published widely onadvertising issues and is coauthor of awidely used M B A textbook on advertisingmanagement He has a Ph D in business(marketing) from the Stanford BusinessSchooi, an M S m advertising from the Uni-versity of Iliinois, and an M B A -equivalentfrom the Indian Institute of Management Hawas a brand manager with Chesebrough-Pond's before entering academics and hasconsulted with various advertising agenciesand direct marketing companies
DONALD R. LEHMANN is George E War-ren Professor of Business at the ColumbiaUniversity Graduate School of Business Hehas a B S degree in mathematics fromUnion College, Sohenectady, New York, andan M S I A and Ph.D from the KrannertSchool of Purdue University.
His research interests include modelingindividual ohoice and decision making, un-derstanding group and interdependent deci-sions, meta-analysis, and the introductionand adoption of innovations He has taughtcourses m marketing, management, and sta-tistics He has published in and served onthe editorial boards of numerous putnalsand is founding editor of Marketing Letters.In addition to numerous journal articles, hehas published four books. Market Researchand Analysis. Analysis for Marketing Plan-ning. Product Management, and Meta Anal-ysis in Marketing Professor Lehmannserved as Executive Director ol the Market-ing Science Institute from 1993-1995 and asPresident of the Association for ConsumerResearch in 1995
JOANNE BURKE loined True North Commu-nications iric as vice president/corporatedirector of media research in 1988, thenFCB Communications, Inc . and was pro-moted to senior vice president m 1991 Shewas named worldwide director of media re-search in 1993 Today, as TN Media's seniorexecutive in charge of all media researchactivity, she is responsible tor both day-to-day operations and long-range planning anddevelopment of TN Media's expertise in me-dia research areas worldwide
Prior to joining True North Communica-tions Inc . she served eight years at NWAyer as a media research senior analystand later as director of media research. Shebegan her career in 1978 as a media re-search intern at Ted Bates and later workedlor William Esty.
JAE H. PAE is currently a doctoral studentat Columbia Business School He receivedhis B A. in anthropology from Seoul NationalUniversity, Korea His research interests arein the areas of new-product forecasting, in-novation, and advertising effects.
tising Affects Sales: Meta-Analy-sis of Econometric Results." jour-ml of Marketing Research 21, 1(1984): 65-74.
Batra, Rajeev, and Michael Ray."Situational Effects of Advertis-ing Repetition." journal of Con-
Journal of ADVERTISING RESEARCH—SEPTEMBER/OCTOBER 1995 31

T R A C K I N G D A T A
sumer Research 12, 4 (1986):432-45.
Beattie, Ann E., and Andrew A.Mitchell. "The Relationship Be-tween Advertising Recall andPersuasion: An ExperimentalInvestigation." In PsychologicalProcesses and Advertising Effects,Linda F. Alwitt and Andrew A.Mitchell, eds. Hillsdale, NJ:Lawrence Erlbaum, 1985.
Brown, Gordon. "How Advertis-ing Works: Findings from Track-ing Studies." London: MillwardBrown International PLC, n.d.
Burke, Raymond R., and Thom-as K. Srull. "Competitive Inter-ference and Consumer Memoryfor Advertising." Journal of Con-sumer Research 15, 1 (1988): 55-68.
CoUey, Russell H. Defmmg Ad-vertising Goals for Measured Adver-tising Results. New York: Associ-ation of National Advertisers,1961.
Eastlack, Joseph O., Jr., andAmbar G. Rao. "Modeling Re-sponse to Advertising and Pric-ing Changes for 'V-8' CocktailVegetable Juice." Marketing Sci-ence 5, 3(1986): 245-59.
. "Advertising Experi-ments at the Campbell SoupCompany." Marketing Science 8, 1(1989): 57-71.
Ephron, Erwin. "More Weeks,Less Weight; The Shelf-SpaceModel of Advertising." journal ofAdvertising Research 35, 3 (1995):18-23.
Farley, John U., and Donald R.Lehmann. Meta-Analysis in Mar-keting: Generalizations of Response
Models. Lexington, MA: Lexing-ton Books, 1986.
Geiger, Joan A. "Seven Brandsin Seven Days." journal of Adver-tising Research 11, 5 (1971): 15-22.
Haley, Russell I., and Allan L.Baldinger. "The ARF Copy Re-search Validity Project." journalof Advertising Research 31, 2(1991): 11-32.
Jones, John Philip. VSlhen AdsV^ork: New Proof that AdvertisingTriggers Sales. New York: Simonand Schuster, The Free Press/Lexington Books, 1995(a).
. "Single-Source ResearchBegins to Fulfill Its Promise."journal of Advertisitig Research 35,3 (1995b): 9-16.
Lodish, Leonard; Magid Abra-ham; Stuart Kalmenson; JeanneLivelsberger; Beth Lubetkin;Bruce Richardson; and MaryEllen Stevens. "How T.V. Ad-vertising Works: A Meta-Analy-sis of 389 Real World Split CableT.V. Advertising Experiments."journal of Marketing Research 32, 2(1995): 125-39.
Lubetkin, Beth. "Additional Ma-jor Findings from the 'How Ad-vertising Works' Study." InTranscript Proceedings of the Adver-tising Research Foundation's Mar-ketplace Advertising Research Work-shop. New York: Advertising Re-search Foundation, 1991.
Keller, Kevin. "Conceptualizing,Measuring, and Managing Cus-tomer-Based Brand Equity."journal of Marketing 57, 1 (1993):1-22.
Ostrow, Joseph W. "Setting Fre-quency Levels: An Art or a Sci-
ence?" journal of Advertising Re-search 24, 4(1984): I-9-M1.'
Pechmann, Cornelia, and DavidW. Stewart. "Advertising Repeti-tion: A Critical Review of Wearinand Wearout." In Gurrent Issues& Research in AdiJcrtising 1988,James H. Leigh and Claude R.Martin, Jr., eds. Ann Arbor, MI:University of Michigan, 1989.
Raj, S. P. "The Effects of Adver-tising on High and Low Con-sumer Segments." Journal of Gon-sumer Research 9, 1 (1982): 77-89.
Reichel, Walter. "Beyond Effec-tive Frequency." In TranscriptProceedings of the ARF EffectiveFrequency Research Day. NewYork: Advertising ResearchFoundation, 1994.
Ross, William T., Jr., and Eliza-beth H. Creyer. "InterpretingInteractions: Raw Means or Re-sidual Means?" Journal of Gon-sumer Research 20, 2 (1993): 330-40.
Simon, Julian N., and JohanArndt. "The Shape of the Ad-vertising Response Function."journal of Advertising Research 20,4 (1980): 11-28.
Tellis, Gerard J. "AdvertisingExposure, Loyalty and BrandPurchase: A Two-Stage Model ofChoice." journal of Marketing Re-search 25, 2 (1988): 134-44. '
Time Inc., and Joseph E. Sea-gram & Sons, Inc. "A Study ofthe Effectiveness of AdvertisingFrequency in Magazines." NewYork: Time Inc., 1982.
Webb, Peter, and Michael L.Ray. "Effects of TV Clutter."journal of Advertisin*^ Research 19,3 (1979): 7-12.
32 Journal of ADVERTISING RESEARCH—SEPTEMBER/OCTOBER 1995
