wheat in ethiopia: production, marketing, and...
TRANSCRIPT

Wheat in Ethiopia:
Production, marketing, and consumption
28 July 2015
Prepared for the Ethiopian Agricultural Transformation Agency (ATA)
Prepared by Nicholas Minot, James Warner, Solomon Lemma, Leulsegged Kasa, Abate Gashaw, and Shahidur Rashid
Markets, Trade, and Institutions Division International Food Policy Research Institute
Wheat in Ethiopia Page ii
Table of contents
1 Introduction ............................................................................................................................. 1
1.1 Background ..................................................................................................................... 1
1.2 Objectives ....................................................................................................................... 1
1.3 Outline of the report ...................................................................................................... 2
2 Data and methods ................................................................................................................... 2
2.1 Data sources ................................................................................................................... 2
2.2 Data issues ...................................................................................................................... 3
2.3 Methods ......................................................................................................................... 4
3 Results ..................................................................................................................................... 4
3.1 Wheat production .......................................................................................................... 5
3.2 Storage, marketing, and processing ............................................................................. 15
3.3 International trade ....................................................................................................... 36
3.4 Consumption of wheat and wheat products ............................................................... 41
3.5 Impact of the wheat import subsidy policy .................................................................. 48
4 Summary and recommendations .......................................................................................... 52
4.1 Summary ....................................................................................................................... 52
4.2 Recommendations........................................................................................................ 55
References .................................................................................................................................... 58

Wheat in Ethiopia Page iii
List of tables Table 1. Wheat balance in 2013..................................................................................................... 4
Table 2. Number of wheat farmers and average wheat area by region ....................................... 5
Table 3. Area cultivated under different management practices by crop in 2003/04 and 2013/14 ........................................................................................................................................... 6
Table 4. Fertilizer application by crop in 2003/04 and 2013/14 ................................................... 7
Table 5. Variability in cereal area, yield, and production ............................................................ 10
Table 6. Wheat area, yield, and production by region (2013-14) ............................................... 13
Table 7. Grain storage capacity .................................................................................................... 18
Table 8. Grain storage capacity on farms and in cooperatives .................................................... 18
Table 9. Wheat storage behavior of farm households ................................................................. 19
Table 10. Patterns of marketed surplus of wheat ....................................................................... 20
Table 11. Determinants of share of wheat production that is sold ............................................. 22
Table 12. Share of wheat production that is marketed ............................................................... 22
Table 13. Wheat production, consumption, and surplus in surplus zones ................................. 26
Table 14. Wheat production, consumption, and surplus in deficit zones ................................... 27
Table 15. Marketing margins for imported wheat ....................................................................... 32
Table 16. Marketing margins for different channels for Ethiopian wheat .................................. 32
Table 17. Distribution of small-scale grain mills by region .......................................................... 34
Table 18. Distribution of large-scale flour factories .................................................................... 35
Table 19. Quantity and value of wheat imports .......................................................................... 38
Table 20. Distribution of EGTE wheat to millers .......................................................................... 41
Table 21. Staple foods and their contribution to the Ethiopian diet (2011) ............................... 42
Table 22. Consumption of wheat by type of household .............................................................. 43
Table 23. Econometric analysis of determinants of demand for wheat and wheat products .... 46
Table 24. Income elasticity of different wheat products ............................................................. 47
Table 25. Prices and costs of wheat imported by EGTE............................................................... 49
List of figures
Figure 1. Wheat production, area cultivated and yield, Ethiopia (1995/96 – 2012/13) ............... 9
Figure 2. Relative importance of main cereals in production and area ...................................... 10
Figure 3. Wheat yields in Ethiopia and other countries from 1994 to 2013 ............................... 11
Figure 4. Concentration of wheat production across zones ........................................................ 13
Figure 5. Spatial distribution of wheat production ...................................................................... 14
Figure 6. Cumulative distribution of household by share of wheat marketed ........................... 20
Figure 7. Spatial distribution of wheat sales ................................................................................ 23
Figure 8. Per capita production and sales of wheat by woreda .................................................. 25
Figure 9. Map of wheat surplus and wheat deficit zones ............................................................ 28
Figure 10. Estimated flows of wheat among zones in Ethiopia ................................................... 31
Figure 11. Wheat production, consumption and import, Ethiopia (1995/96 – 2012/13) ........... 37
Figure 12. Wheat and wheat flour delivered to Ethiopia as food aid.......................................... 40
Figure 13. Wheat consumption in selected countries over 1995-2011 (kg/capita/year) ............ 48
Figure 14. Diagram of supply of and demand for wheat in Ethiopia ........................................... 50
Wheat in Ethiopia Page 1
1 Introduction
1.1 Background
Wheat has been an important staple food in Ethiopia for centuries if not millennia. In his seminal work on crop domestication in the 1920s, Vavilov proposed that Ethiopia was one of eight centers of diversity in the world. He identified 38 crops which were domesticated in the region, including teff, pearl millet, cowpea, sesame, enset, okra, myrrh, coffee, and some subspecies of wheat and barley. More recent research suggests that teff and millet were domesticated in northern Ethiopia at least 4,000 years ago, and wheat and barley were later brought to the region from southwestern Asia (Ofcansky and Berry, 1991). In any case, the earliest European explorers to Ethiopia in 1520 reported widespread production of wheat, teff, and barley, as well as bread-making (Alvarez and Stanley, 1961).
Today, wheat is among the most important crops grown in Ethiopia, both as a source of food for consumers and as a source of income for farmers. Wheat and wheat products represent 14% of the total caloric intake in Ethiopia. This makes wheat the second-most important food, behind maize (19%) and ahead of teff, sorghum, and enset (10-12% each) (FAO, 2014). With regard to the area of cultivation, wheat is the fourth most widely grown crop after teff, maize, and sorghum. In terms of the gross value of production, wheat is ranked 4th or 5th, after teff, enset, and maize and approximately tied with sorghum.
Unlike other staple grains, wheat is imported in large volumes. The percentage of domestic wheat consumption coming from imports varies between 25% and 35%, depending on the size of the harvest and other factors. The government of Ethiopia currently subsidizes the importation of wheat, providing it to large-scale flour mills on the condition that the flour be sold to bakeries by at controlled prices with the goal of making bread affordable to poor consumers.
Because wheat is a preferred food and incomes are rising, the demand for wheat has grown significantly over the past decade and is expected to continue doing so. Unless wheat productivity can keep pace, the cost of wheat imports will place an increasing burden on the Ethiopian balance of trade. Because of the importance of the crop and its growing import burden, the government of Ethiopia gives a high priority to efforts to increase wheat productivity and improve wheat marketing efficiency.
1.2 Objectives
The report is one of a series of commodity studies to be carried out by the International Food Policy Research Institute (IFPRI) at the request of the Ethiopian Agricultural Transformation Agency (ATA). The general goal of these studies is to provide a comprehensive description of the commodity marketing channel from production to consumption in order to assist the ATA in its work of raising crop productivity and improving market efficiency.
The terms of reference, jointly prepared by IFPRI and ATA, identifies nine questions to be addressed with these commodity channel studies.
• What proportion of production is marketed by type of farm and by location?
Wheat in Ethiopia Page 2
• What are the major routes to market, from surplus producers to consumers?
• What is the volume and value of these channels and how does it vary by season?
• What are the margins for smallholders and other value chain actors?
• What is the status of the market infrastructure in terms of storage, processing,
wholesaling, and retailing?
• Who are the major market actors in the marketing of the commodity?
• What are the main challenges in increasing marketable surpluses as well as expanding
the market infrastructure to handle larger volumes?
• What are the main challenges to achieving competitive markets and becoming
competitive on international markets?
1.3 Outline of the report
Section 2 describes the data and methods used in this study. Section 3 provides the results of the analysis, including sections on production, storage, marketing, international trade, consumption, and an evaluation of the wheat import subsidy. Section 4 offers a summary and recommendations.
2 Data and methods
2.1 Data sources
This study uses information from a range of different sources, including interviews with stakeholders, survey data, secondary data, and web-bases statistical databases. Each is described briefly below.
The authors of the report carried out two field trips in October 2014 to talk to various stakeholders in the wheat marketing channels. These included farmers, millers, wholesalers, retailers, agronomists, development agents (DAs), local officials, and cooperative leaders. Each trip was about one week long, and included a team of three IFPRI researchers. One team went to the south, visiting surplus wheat production zones in Bale, Arsi, and West Arsi. The other team covered production zones in the north, including West Shewa, North Gonder, East Gojam, and West Gojam.
The interviews with stakeholders were complemented with data from three household surveys listed below:
The 2011 Household Income, Consumption and Expenditure (HICE) Survey. This survey was carried out by the Central Statistics Agency and had a stratified random sample of 17,513 households. It covered a wide range of topics including household composition, assets, income, expenditure, health, and education. We rely on the HICE for the analysis of wheat consumption patterns.
The 2012-13 Agricultural Sample Survey (AgSS). This survey was implemented by the Central Statistics Agency (CSA). It is based on a large sample (approximately 45,000 farm households) allowing it to be used to generate zonal estimates. The questionnaire covers

Wheat in Ethiopia Page 3
input use, crop production, and crop marketing. We use it to generate maps of the spatial distribution of production and marketed surplus.
The 2012 IFPRI-ATA Baseline Survey. This survey was carried out by IFPRI for the ATA. It collected information on a wide range of topics including asset ownership, input use, crop production, marketing, storage, livestock, non-farm income, and credit. The survey uses a stratified random sample of 3000 rural households representing the four main regions of the country, with oversampling of high-potential woredas targeted for intervention by the ATA. This dataset is used for information on input use and marketing patterns.
The study also makes use of data from other sources, including the following:
Historical AgSS production data from Central Statistics Agency. Data on area, yield, and production of different crops over time is used to provide some historical perspective on current patterns of wheat production and marketing.
Data from the Food and Agriculture Organization (FAO). FAO data are used to describe trends in wheat production, trade, and consumption. The production estimates in the FAO database are generally based on CSA AgSS estimates, but consumption estimates are derived by combining information on production, trade, and population.
Finally, the study made use of a number of earlier reviews of the wheat sector and studies of the agricultural sector as a whole.
2.2 Data issues
The analysis of the wheat sector in Ethiopia is hampered by a discrepancy between wheat production and consumption statistics. The Central Statistical Agency (CSA) estimates that wheat production in 2013 was 3.9 million tonnes. The 2011 Household Income, Consumption, and Expenditure (HICE) survey indicates that per capita consumption of wheat (including the wheat equivalent of wheat products) is about 32 kg/person. Given the population of 94 million, this implies a total of 3.0 million tonnes of wheat used for direct human consumption. At the same time, wheat imports are estimated to be almost 0.9 million tonnes. This implies that 1.8 million tonnes of wheat are used in seed, feed, industrial uses, and other uses. Given that wheat is rarely used in animal feed and manufacturing, and that seed use is probably no more than 5% of production (0.2 million tonnes), it is difficult to believe that these four uses can account for 1.8 million tonnes.
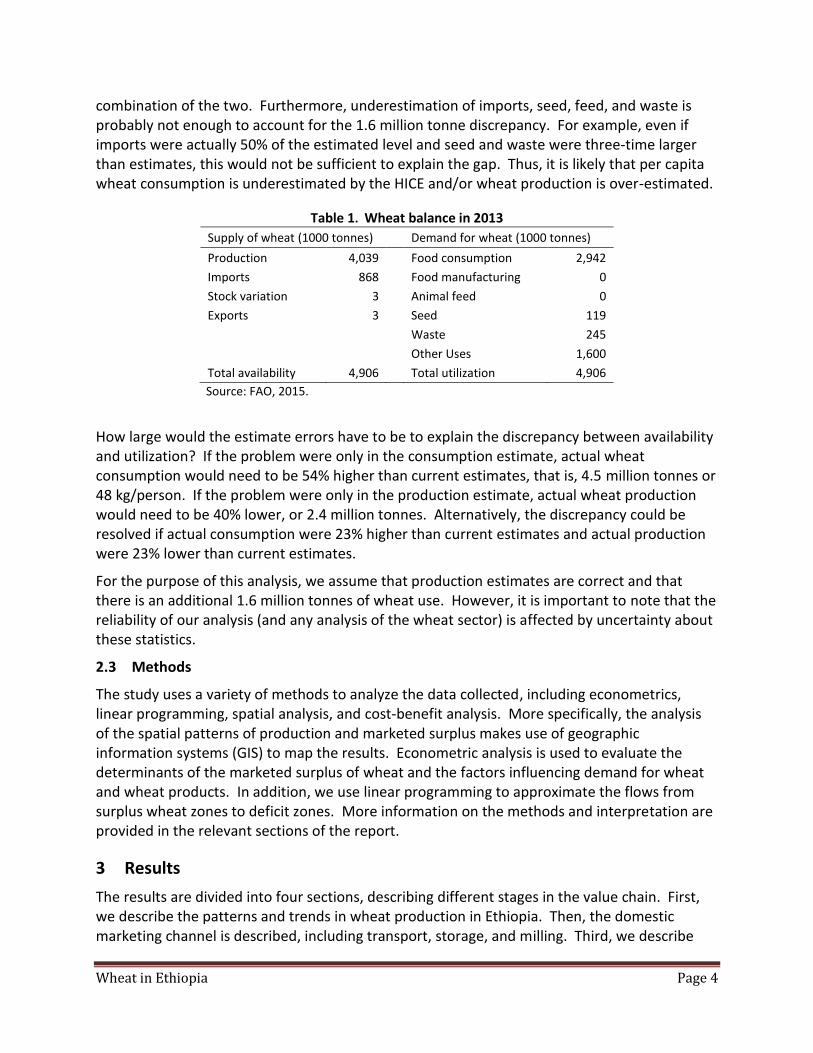
This discrepancy is also apparent in the FAO food balance sheets for Ethiopia (see Table 1). The FAO estimate of production in 2013 (4.0 million tonnes) is very close to the CSA estimate, as is the FAO estimate of human consumption (2.9 million tonnes). As shown below, the FAO food balance sheet also includes estimates for exports, stock variation, food manufacturing, animal feed, seed, and waste. The FAO table balances, but only by including 1.6 million tonnes of “other uses”, in addition to consumption, manufacturing, feed, seed, and waste. It seems likely that this figure is not estimated based on known uses of wheat, but rather calculated as a residual to make availability and utilization balance.
It seems unlikely that 1.6 million tonnes of wheat disappears into “other uses”. This suggests that either availability is over-estimated, utilization is under-estimated, or perhaps a
Wheat in Ethiopia Page 4
combination of the two. Furthermore, underestimation of imports, seed, feed, and waste is probably not enough to account for the 1.6 million tonne discrepancy. For example, even if imports were actually 50% of the estimated level and seed and waste were three-time larger than estimates, this would not be sufficient to explain the gap. Thus, it is likely that per capita wheat consumption is underestimated by the HICE and/or wheat production is over-estimated.
Table 1. Wheat balance in 2013
Supply of wheat (1000 tonnes) Demand for wheat (1000 tonnes)
Production 4,039 Food consumption 2,942
Imports 868 Food manufacturing 0
Stock variation 3 Animal feed 0
Exports 3 Seed 119
Waste 245
Other Uses 1,600
Total availability 4,906 Total utilization 4,906
Source: FAO, 2015.
How large would the estimate errors have to be to explain the discrepancy between availability and utilization? If the problem were only in the consumption estimate, actual wheat consumption would need to be 54% higher than current estimates, that is, 4.5 million tonnes or 48 kg/person. If the problem were only in the production estimate, actual wheat production would need to be 40% lower, or 2.4 million tonnes. Alternatively, the discrepancy could be resolved if actual consumption were 23% higher than current estimates and actual production were 23% lower than current estimates.
For the purpose of this analysis, we assume that production estimates are correct and that there is an additional 1.6 million tonnes of wheat use. However, it is important to note that the reliability of our analysis (and any analysis of the wheat sector) is affected by uncertainty about these statistics.
2.3 Methods
The study uses a variety of methods to analyze the data collected, including econometrics, linear programming, spatial analysis, and cost-benefit analysis. More specifically, the analysis of the spatial patterns of production and marketed surplus makes use of geographic information systems (GIS) to map the results. Econometric analysis is used to evaluate the determinants of the marketed surplus of wheat and the factors influencing demand for wheat and wheat products. In addition, we use linear programming to approximate the flows from surplus wheat zones to deficit zones. More information on the methods and interpretation are provided in the relevant sections of the report.
3 Results
The results are divided into four sections, describing different stages in the value chain. First, we describe the patterns and trends in wheat production in Ethiopia. Then, the domestic marketing channel is described, including transport, storage, and milling. Third, we describe
Wheat in Ethiopia Page 5
the role of international trade, particularly the importation of wheat and wheat products. Next, the patterns of wheat consumption are discussed, including the consumption of wheat products such as flour and bread. Finally, we examine the benefits and costs of the wheat subsidy policy as well as the distributional impact of the policy.
3.1 Wheat production
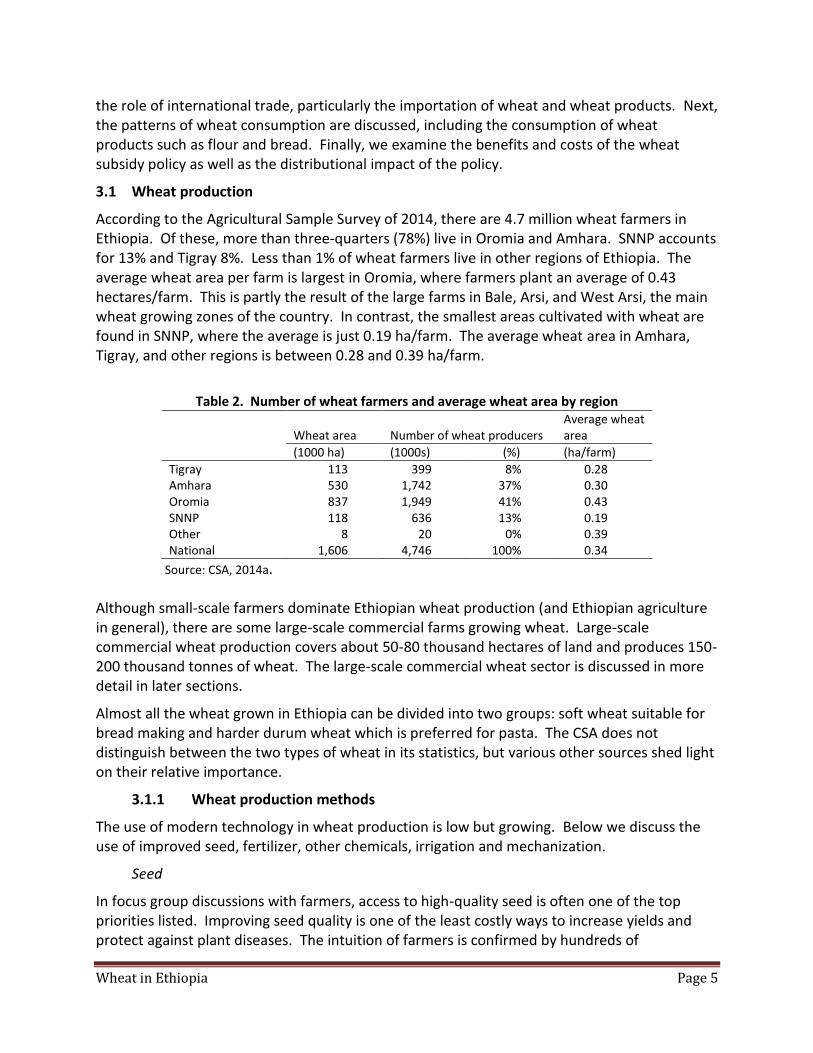
According to the Agricultural Sample Survey of 2014, there are 4.7 million wheat farmers in Ethiopia. Of these, more than three-quarters (78%) live in Oromia and Amhara. SNNP accounts for 13% and Tigray 8%. Less than 1% of wheat farmers live in other regions of Ethiopia. The average wheat area per farm is largest in Oromia, where farmers plant an average of 0.43 hectares/farm. This is partly the result of the large farms in Bale, Arsi, and West Arsi, the main wheat growing zones of the country. In contrast, the smallest areas cultivated with wheat are found in SNNP, where the average is just 0.19 ha/farm. The average wheat area in Amhara, Tigray, and other regions is between 0.28 and 0.39 ha/farm.
Table 2. Number of wheat farmers and average wheat area by region
Wheat area Number of wheat producers Average wheat area
(1000 ha) (1000s) (%) (ha/farm)
Tigray 113 399 8% 0.28 Amhara 530 1,742 37% 0.30 Oromia 837 1,949 41% 0.43 SNNP 118 636 13% 0.19 Other 8 20 0% 0.39 National 1,606 4,746 100% 0.34
Source: CSA, 2014a. Although small-scale farmers dominate Ethiopian wheat production (and Ethiopian agriculture in general), there are some large-scale commercial farms growing wheat. Large-scale commercial wheat production covers about 50-80 thousand hectares of land and produces 150-200 thousand tonnes of wheat. The large-scale commercial wheat sector is discussed in more detail in later sections.
Almost all the wheat grown in Ethiopia can be divided into two groups: soft wheat suitable for bread making and harder durum wheat which is preferred for pasta. The CSA does not distinguish between the two types of wheat in its statistics, but various other sources shed light on their relative importance.
3.1.1 Wheat production methods
The use of modern technology in wheat production is low but growing. Below we discuss the use of improved seed, fertilizer, other chemicals, irrigation and mechanization.
Seed
In focus group discussions with farmers, access to high-quality seed is often one of the top priorities listed. Improving seed quality is one of the least costly ways to increase yields and protect against plant diseases. The intuition of farmers is confirmed by hundreds of

Wheat in Ethiopia Page 6
econometric studies that consistently show high rates of return to investment in agronomic research (Alston et al, 2000).
An important indicator of the performance of the seed sector is the seed replacement rate, defined as the share of seed planted that is official or certified seed as opposed to saved seed or grain purchased from other farmers. As shown in Table 3, less than 6% of wheat area in Ethiopia is planted with first-generation improved seed, defined as seed obtained from the Ministry of Agriculture, a cooperative, a seed company, or another source of varietally-pure seed. This means that, on average, wheat farmers purchase improved seed roughly every 17 years. It should be noted that wheat is a self-pollinated crop, so that wheat retains its yield and other characteristics over several generations of saved seed. Although the seed replacement rate for wheat has increased somewhat in the past decade, it remains low by international standards. In the United States, the seed replacement rate for wheat is 37%, meaning that farmers purchase seed roughly every three years. In India, the rate is 20%, so farmers purchase seed every five years.
In contrast, about 40% of maize area in Ethiopia is planted with (first-generation) improved seed. Since maize is cross-pollinated, it quickly loses its yield and other attributes of the original after a few years of recycling, so there is a stronger incentive for farmers to purchase improved seed.
Table 3. Area cultivated under different management practices by crop in 2003/04 and 2013/14 Crops Improved seed applied Pesticide applied
Irrigated
2003/04
2013/14
Annual growth (%)
2003/04
2013/14
Annual growth (%)
2003/04
2013/14
Annual growth (%)
Cereals 4.9 10.1 7.5% 12.4 26.1 7.7% 0.9 0.7 -2.5% Teff 0.6 3.1 17.8% 19.8 39.5 7.2% 0.4 0.4 0.0% Barley 0.4 0.6 4.1% 8.4 23.0 10.6% 0.6 0.4 -4.0% Wheat 4.1 5.6 3.2% 30.4 47.2 4.5% 0.3 0.4 2.9% Maize 20.1 40.0 7.1% 1.4 5.7 15.1% 2.4 1.4h -5.2% Sorghum 0.5 0.2 -8.8% 1.2 9.2 22.6% 0.9 1.0 1.1%
Source: CSA-AgSS (2003/04 – 2013/14)
Focus group discussions with farmers reveal at least three factors that constrain the purchase of improved seed. First, the availability of wheat seed is limited. The Ethiopian Seed Enterprise and regional seed companies do not produce as much as is demanded by farmers, so the limited supplies are rationed by Bureaus of Agriculture and cooperatives. Second, seed quality is variable, so farmers are reluctant to purchase a product that may not perform as expected. Finally, farmers are cash-constrained and are sometimes unable to purchase inputs even if they would be profitable.
A second performance indicator for the seed sector is the varietal replacement rate, the rate at which new varieties are introduced. Because pests and diseases evolve over time, each variety becomes more vulnerable to their attacks over time. Without a certain minimal level of “maintenance” breeding and new varieties, the yield of existing varieties decline.
In the case of wheat, yellow rust and stem rust have become serious problems. One of the most popular wheat varieties, Kubsa, was “lost” (became susceptible) to rust in 2010, leading to

Wheat in Ethiopia Page 7
an intensive search for varieties that remain resistant. It was replaced by a variety called Digalu, but this became susceptible to “Digalu rust” in 2013. Wheat varieties are being obtained from CIMMYT and ICARDA, as well as being imported from Kenya and Nepal. They undergo local testing for yield and resistance under Ethiopian conditions before being registered and released in the country. A variety called Kingbird from Kenya is now being tested and may be released this year. In the meantime, Kubsa continues to be used, but it requires spraying to control the rust.
These threats to the wheat sector are particularly worrisome given that Ethiopia spends just 0.2% of its agricultural gross domestic product on agricultural research. By comparison, Kenya, Uganda, and Tanzania allocate 0.5% to 1.2% of their agricultural GDP (Beintema et al, 2014).
Although only a small portion of wheat seed used each year is first-generation improved seed, much of the seed is descended from improved varieties. According to the DIIVA project, 78% of bread wheat in Ethiopia is produced with improved varieties, while xx% of durum wheat is (CGIAR, 2015).
Fertilizer
A relatively large share of wheat area in Ethiopia is fertilized, and the proportion is increasing over time. According to the results of the CSA Agricultural Sample Survey, the proportion of wheat area that is fertilized has increased from 54% in 2003-04 to 73% last year (see Table 4). Among the cereals, wheat is the most widely fertilized, followed by teff, maize, and barley. The proportion of sorghum area that is fertilized is relatively low (15%), but it has increased dramatically from ten years ago.
Table 4. Fertilizer application by crop in 2003/04 and 2013/14 Crops
Area over which fertilizer applied (% of area cultivated)
Fertilizer application rate (kg/fertilized ha)
2003/04
2013/14
Annual growth (%)
2003/04
2013/14
Annual growth (%)
Cereals 33.4 53.1 4.7% 98.9 121.8 2.1% Teff 45.9 68.7 4.1% 83.7 106.0 2.4% Barley 26.7 42.3 4.7% 85.8 103.1 1.9% Wheat 53.6 73.4 3.2% 107.7 137.8 2.5% Maize 30.5 50.8 5.2% 138.5 164.0 1.7% Sorghum 3.3 14.7 16.1% 124.1 82.8 -4.0%
Source: CSA-AgSS (2003/04 – 2013/14)
The application rate among wheat plots that are fertilized is 138 kg/ha, having increased from 108 kg/ha ten years before. Wheat is the second-most intensively fertilized cereal crop after maize (see Table 4).
The 2012 IFPRI-ATA Baseline Survey confirms these figures in general terms. For example, according to the IFPRI-ATA Baseline, 65% of farmers apply fertilizer to their wheat fields and the average application rate is 95 kg/ha across all wheat plots (including those not fertilized), which implies an application rate of 146 kg/ha among those wheat plots that were fertilized.

Wheat in Ethiopia Page 8
Ethiopia is moving from uniform recommendations for fertilizer application rates to recommendations that are customized based on soil type and crop. This implies diversification away from DAP and urea, which have long been the only types of fertilizer imported for grain crops. Some farmers in Bale reported experimented with NPS, a new fertilizer designed to address sulphur deficiency in the soil. Although Bale was not part of the pilot project to introduce NPS, farmers heard about it and managed to obtain supplies of it. Fertilizer recommendations need to be appropriate for the type of wheat. For example, durum wheat has a higher protein content, which means that it requires more urea (for the nitrogen) than bread wheat does. The customization of fertilizer recommendations will improve the cost-effectiveness of fertilizer, but it will also require new expertise and greater outreach on the part of development agents.
Pesticides
Pesticides are applied to almost half (47%) of the wheat area in Ethiopia, having risen from just 30% ten years ago (see Table 3). A larger share of wheat receives pesticide than any other cereal crops. Pesticides are applied to a significant portion of teff and barley area (39% and 23%, respectively), but pesticide use on maize and sorghum is remains quite rare. As in the case of improved seed, all cereals crops show an increase in the use of pesticides over the past ten years.
According to the 2012 IFPRI-ATA Baseline Survey, about 36% of farmers used pesticides on their wheat fields.
Other technology
Table 3 indicates that irrigation is quite rare in Ethiopian cereal crop production. Less than 1% of the area of wheat, barley, and teff production is irrigated, while less than 2% of maize and sorghum is. Because of the high cost of irrigation, it is usually reserved for high-value crops such as fruits, vegetables, and flowers.
In addition, the 2012 Baseline Survey indicates that 99% of wheat plots are cultivated using animal traction, so tractor ploughing is quite rare. This is confirmed in the community questionnaire, which indicates that just 4% of the 200 kebeles visited had any privately-owned tractors. The development of a market for combine rental is becoming more common in areas with commercial wheat production, such as Bale. On a national level, however, it remains quite rare.
3.1.2 National area, yield, and production
According to CSA estimates, Ethiopia produced 3.9 million tonnes of wheat in 2013, making it the largest wheat producer in sub-Saharan Africa by a considerable margin. The second-largest producer is South Africa with 1.7 million tonnes, followed by Kenya with just 0.5 million tonnes. On the other hand, Ethiopian production is relatively small by global standards. Its production is surpassed by two North African countries, Egypt and Morocco, with more than 7 million tonnes each, and 27 other countries. Ethiopia represents just 0.6 percent of the 713 million tonnes produced globally (FAO, 2015). One implication of this is that changes in the volume of Ethiopian wheat imports are unlikely to have a noticeable impact of world prices.

Wheat in Ethiopia Page 9
Wheat production has grown significantly in the country, rising from around 1.1 million tonnes in 1995-96 to 3.9 million tonnes in 2013. This represents an average annual growth of 7.5% (see Figure 1). In spite of this rapid growth, there is significant annual fluctuation in production, primarily due variation in rainfall. The coefficient of variation of wheat production over this period is 44%, but the Cuddy-Della-Valle (CDV) index, which measures variability around the trend, is 12%1. By this measure, the variability of wheat production is substantially lower than that of maize and sorghum production, somewhat lower than that of teff, and marginally higher than that of barley production (see Table 2). In more intuitive terms, wheat production deviates from the trend growth by an average of positive or negative 11%.
Wheat is currently grown on 1.6 million hectares in Ethiopia. This makes wheat the fourth most widely grown crop in the country, after teff, maize, and sorghum. Wheat area has risen to this level from 900 thousand hectares in 1995-96, representing an annual growth of 3.4% (see Figure 1). In spite of the rapid growth in wheat area, the importance of wheat among cereals does not appear to have changed significantly. According to data from the AgSS, the proportion of cereal area cultivated with wheat has fluctuated between 15% and 18% over the past ten years with no discernable trend (see Table 5). This implies that other cereals have expanded their cultivated areas at similar rates over the past 20 years.
Figure 1. Wheat production, area cultivated and yield, Ethiopia (1995/96 – 2012/13)
Source: Central Statistics Authority (2013).
1 The coefficient of variation (CV) is defined as the standard deviation divided by the mean. However, the CV is biased upward if there is a trend. The Cuddy-Della-Valle index measures the coefficient of variation around the trend. It can be calculated as CV*(1-R2)0.5, where R2 is the correlation coefficient between the variable and a time trend. The CDV index is a better measure of variability in variables with a trend.
0
500
1000
1500
2000
2500
3000
3500
4000
4500
-
500
1,000
1,500
2,000
2,500
3,000
Pro
du
ctio
n (
10
00
to
nn
es)
Are
a (1
00
0 h
a) a
nd
Yie
ld (
kg/h
a)
Area( In '000 Ha)
Yield ( In Kg/Ha)
Production (In'000 Mt)

Wheat in Ethiopia Page 10
Table 5. Variability in cereal area, yield, and production
Figure 2. Relative importance of main cereals in production and area
According to estimates from the Central Statistics Agency, the average wheat yield was 2.4 tonnes/hectare in 2012-13. Compared to other major producers in Africa, Ethiopian wheat yields are low. For example, wheat yields are 6.7 t/ha in Egypt. 3/5 t/ha in South Africa, and 3.0 t/ha in Kenya. However, these comparisons are somewhat misleading because Ethiopia’s production is dominated by rain-fed smallholder agriculture. In other countries, like Egypt,
Crop Variable Coefficient of variation
Cuddy-Della-Valle index
Wheat Area 24% 8% Yield 22% 9% Production 44% 12%
Maize Area 11% 9% Yield 27% 15% Production 36% 20%
Sorghum Area 22% 14% Yield 24% 12% Production 46% 25%
Teff Area 17% 12% Yield 26% 14% Production 38% 17%
Barley Area 11% 11% Yield 24% 12% Production 25% 10%
Source: FAO (2014)

Wheat in Ethiopia Page 11
wheat is grown under irrigated conditions, while in countries like Kenya and South Africa, a significant share of production takes place on large-scale commercial farms. However, when compared to other African countries where wheat production is rainfed and grown mainly by smallholders, Ethiopia has similar or higher yields. Yields of 7-9 t/ha in countries such as New Zealand, Germany, and France, demonstrate that, in the long run, there is considerable scope for improvement in Ethiopian wheat yields (see Figure 3).
As mentioned earlier, Ethiopia does have a large-scale commercial farm sector, which is the subject of a survey carried out by the CSA. According to this survey, roughly 150-200 thousand tonnes of wheat is produced by large-scale commercial farms (see Table 6). Although the area planted with wheat by these farms appears to be increasing, this is offset by a declining trend in wheat yields. The wheat yield among large-scale commercial farms in 2013 was 2.57 t/ha, which is just slightly higher than the average yield for the country. Large-scale commercial farms account for about 5% of wheat production in Ethiopia.
Table 6. Wheat production by large-scale commercial farmers
2010 2011 2012 2013
Area (1000 ha) 59 46 64 80
Yield (t/ha) 3.33 3.30 2.62 2.57
Production (1000 t) 197 150 168 206
Source, CSA, 2011, 2012, 2013, and 2014b.
Figure 3. Wheat yields in Ethiopia and other countries from 1994 to 2013
Source: FAO (2014).
Current wheat yields are roughly double the average wheat yield in 1995-96, implying an annual growth rate of 3.9%. This means that more than half the growth in production since
0.0
1.0
2.0
3.0
4.0
5.0
6.0
7.0
8.0
9.0
10.0
19
94
19
95
19
96
19
97
19
98
19
99
20
00
20
01
20
02
20
03
20
04
20
05
20
06
20
07
20
08
20
09
20
10
20
11
20
12
20
13
Russia
German
France
Ukraine
Ethiopia
New Zealand
South Africa
Kenya
Zimbabwe
World
Africa

Wheat in Ethiopia Page 12
1995-96 can be attributed to yield growth. The rate of yield growth has been even higher in recent years: since 2008, yield has increased at more than 7% per year.
Some sources suggest that wheat yields in Ethiopia may be somewhat lower than official estimates. For example, the U.S. Department of Agriculture estimates that wheat yields in Ethiopia are about 2.1 t/ha compared to official estimates of 2.4 t/ha (USDA, 2014). Similarly, the results of a 2008 household survey suggested that wheat yields were about 1.0 t/ha, during a year when official estimates were 1.6 t/ha (Alemu et al, 2008). Finally, the IFPRI-ATA Baseline Survey found average wheat yields of about 1.4 t/ha as compared to the 2.1 t/ha estimate by CSA in the same year, though the former result was based on a much smaller sample size (750 farmers) and a different yield-estimation methodology. More specifically, the CSA uses crop cuts to determine yield while the IFPRI-ATA Baseline relied on farmer recall (Minot and Sawyer, 2013). Some experts, in other countries, have questioned the overall reliability of large-scale crop cuts for yield determination (Sud et al. 2011) although the reliability of farmer recall has been questioned as well.
3.1.3 Spatial distribution of wheat production
The main factors influencing the distribution of wheat production in Ethiopia are rainfall and altitude. Wheat grows best at temperatures between 7 C and 21 C and with rainfall between 750 mm/year and 1600 mm/year. Since temperature in Ethiopia is strongly influenced by altitude, this means that most wheat is grown at altitudes of 1500 meters above sea level and above. For this reason, wheat is grown on the central plateau in the regions of Oromia, Amhara, Tigre, and the SNNP. In fact, less than 1% of the wheat area is outside these four regions. Furthermore, as shown in Table 7, Oromia accounts for about half the total wheat area and Amhara another third. Tigray and SNNP together represent just 14% of wheat production.
Wheat yields are highest in Oromia (2.7 t/ha), which has the important wheat surplus zones of Bale and Arsi with prime growing conditions. Wheat yields are lower in SNNP (2.4 t/ha) and Amhara (2.1 t/ha). In Tigray, wheat yields are just 1.8 t/ha, as a result of the low rainfall and poor soils in some parts of the region.
As would be expected, wheat area roughly determines wheat production, although there are some variations because of yield differences. For example, Oromia accounts for 59% of production, which is even more than its share of area because of the relatively high yields in that region. In contrast, Amhara represents only 29% of production, somewhat below its share of national wheat area. SNNP and Tigray account for just 12% of national wheat production.
The concentration of wheat production across zones is shown in Figure 5. The zones are organized in order of wheat production and the cumulative wheat production plotted. Arsi and Bale, the two largest wheat-producing zones and the first two points on the graph, account for over one-quarter of national wheat production. And more than half of Ethiopian wheat production takes place in the top six zones: Arsi, Bale, West Arsi, East Gojjam, East Shewa, and South Wello. The top 20 zones account for over 90% of national wheat production in Ethiopia.

Wheat in Ethiopia Page 13
Table 7. Wheat area, yield, and production by region (2013-14)
Wheat area Wheat yield Wheat production
(1000 ha) (%) (t/ha) (1000 t) (%)
Tigray 113 7% 1.82 205 5% Amhara 530 33% 2.11 1,120 29% Oromia 837 52% 2.75 2,303 59% SNNPR 118 7% 2.38 282 7%
Other 8 0% 1.99 16 0% National 1,606 100% 2.44 3,925 100%
Source: CSA (2014).
Figure 4. Concentration of wheat production across zones
Source: Analysis of the 2014 CSA Agricultural Sample Survey
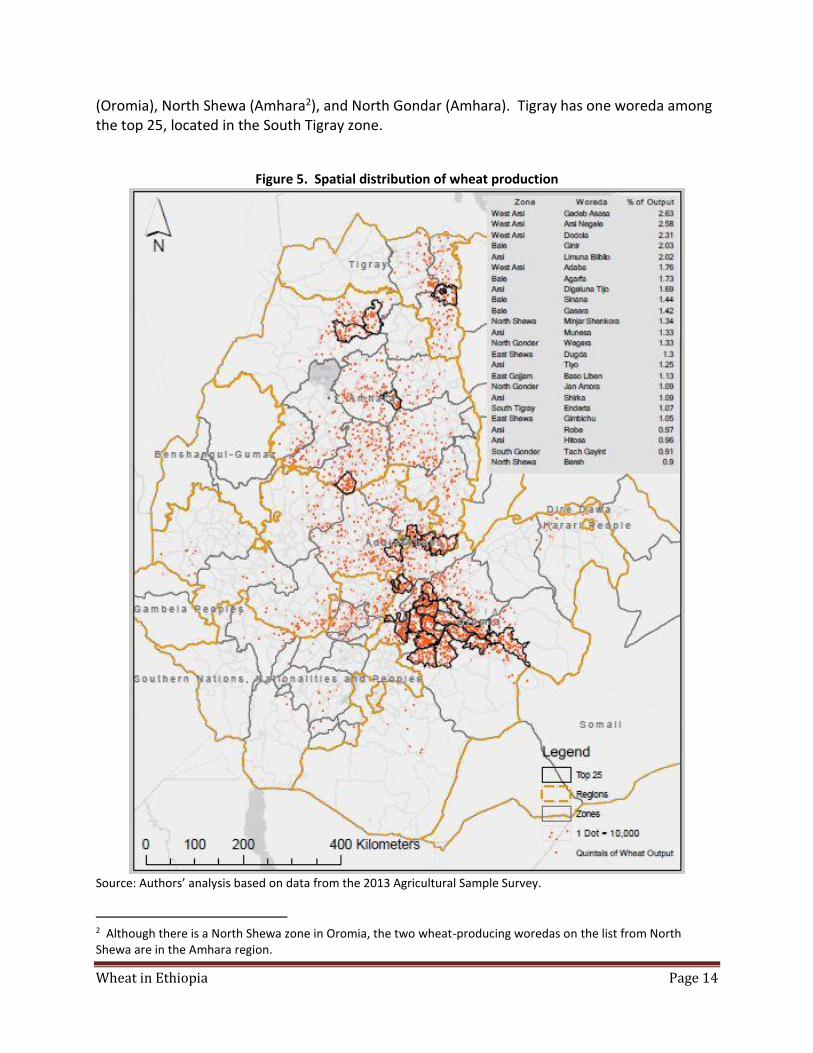
Figure 5 provides a higher-resolution picture of the spatial patterns in Ethiopian wheat production. This map is generated from woreda-level estimates of wheat production from the Agricultural Sample Survey. For every 1000 tonnes of wheat production, one dot is placed in the woreda. Although the position of the dots within the woreda is random, the density of dots across the country illustrates the areas of concentrated wheat production. The top 25 woredas in wheat production are shown with black borders and listed on the map.
The map highlights the concentration of wheat production in Bale, Arsi, and West Arsi in southeastern Ethiopia. These three zones contain all the top ten wheat-producing woredas in the country, as well as five other woredas in the top 25. The top ten wheat-producing woredas account for about 20% of national wheat production, while the top 25 woredas represent about 36% of the total. Other zones with important wheat-growing woredas include East Shewa
0%
10%
20%
30%
40%
50%
60%
70%
80%
90%
100%
0 5 10 15 20 25 30 35 40 45 50 55 60
Cu
mu
lati
ve s
har
e o
f to
tal w
hea
t p
rod
uct
ion
Zones (in order of wheat production)
Wheat in Ethiopia Page 14
(Oromia), North Shewa (Amhara2), and North Gondar (Amhara). Tigray has one woreda among the top 25, located in the South Tigray zone.
Figure 5. Spatial distribution of wheat production
Source: Authors’ analysis based on data from the 2013 Agricultural Sample Survey.
2 Although there is a North Shewa zone in Oromia, the two wheat-producing woredas on the list from North Shewa are in the Amhara region.
Wheat in Ethiopia Page 15
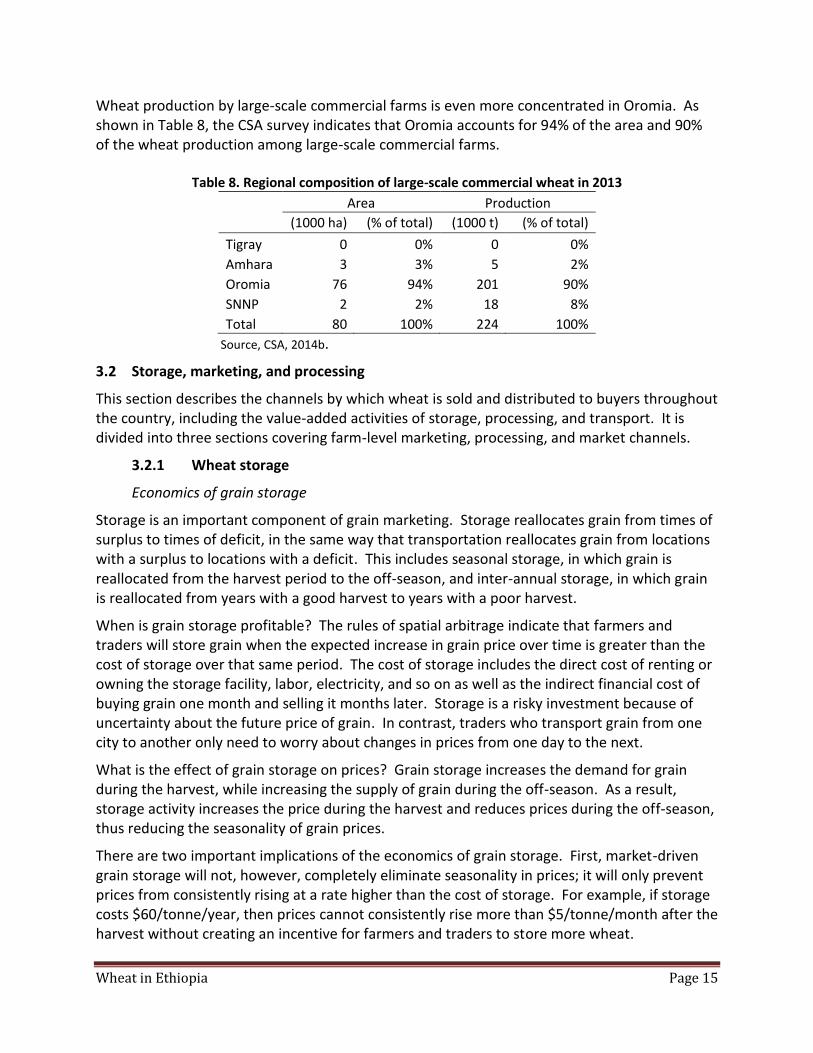
Wheat production by large-scale commercial farms is even more concentrated in Oromia. As shown in Table 8, the CSA survey indicates that Oromia accounts for 94% of the area and 90% of the wheat production among large-scale commercial farms.
Table 8. Regional composition of large-scale commercial wheat in 2013
Area Production
(1000 ha) (% of total) (1000 t) (% of total)
Tigray 0 0% 0 0%
Amhara 3 3% 5 2%
Oromia 76 94% 201 90%
SNNP 2 2% 18 8%
Total 80 100% 224 100%
Source, CSA, 2014b.
3.2 Storage, marketing, and processing
This section describes the channels by which wheat is sold and distributed to buyers throughout the country, including the value-added activities of storage, processing, and transport. It is divided into three sections covering farm-level marketing, processing, and market channels.
3.2.1 Wheat storage
Economics of grain storage
Storage is an important component of grain marketing. Storage reallocates grain from times of surplus to times of deficit, in the same way that transportation reallocates grain from locations with a surplus to locations with a deficit. This includes seasonal storage, in which grain is reallocated from the harvest period to the off-season, and inter-annual storage, in which grain is reallocated from years with a good harvest to years with a poor harvest.
When is grain storage profitable? The rules of spatial arbitrage indicate that farmers and traders will store grain when the expected increase in grain price over time is greater than the cost of storage over that same period. The cost of storage includes the direct cost of renting or owning the storage facility, labor, electricity, and so on as well as the indirect financial cost of buying grain one month and selling it months later. Storage is a risky investment because of uncertainty about the future price of grain. In contrast, traders who transport grain from one city to another only need to worry about changes in prices from one day to the next.
What is the effect of grain storage on prices? Grain storage increases the demand for grain during the harvest, while increasing the supply of grain during the off-season. As a result, storage activity increases the price during the harvest and reduces prices during the off-season, thus reducing the seasonality of grain prices.
There are two important implications of the economics of grain storage. First, market-driven grain storage will not, however, completely eliminate seasonality in prices; it will only prevent prices from consistently rising at a rate higher than the cost of storage. For example, if storage costs $60/tonne/year, then prices cannot consistently rise more than $5/tonne/month after the harvest without creating an incentive for farmers and traders to store more wheat.

Wheat in Ethiopia Page 16
Second, this reduction of price seasonality occurs regardless of whether the grain is stored by farmers, cooperatives, traders, or other agents. Government policy appears to discourage traders from holding stocks, but supports on-farm storage in various ways, but if the objective is to reduce the seasonality in grain prices, a more balanced approach of promoting grain storage by all parties would be more effective.
Grain storage is carried out by various government agencies, international relief agencies, private traders, cooperatives, and farmers. The storage capacity, the quality of storage facilities, and storage behavior varies widely across different participants in the wheat sector. Each is briefly described below.
Government agencies
The Ethiopia Grain Trading Enterprise (EGTE) plays an important role in wheat markets as the main wheat importer. The EGTE imports wheat and sells it to large-scale flour mills, primarily in Addis Ababa, at subsidized prices. The mills are required to sell flour to selected bakeries at subsidized price, and the bakeries to sell bread at subsidized prices. Since 2008, the EGTE has replaced private wheat importers partly because private importers cannot compete with subsidized wheat and partly because they do not have access to foreign exchange, whose distribution has been more tightly regulated since 2008. The EGTE has 820 thousand tonnes of storage capacity distributed throughout the countries, though only some of this is available for wheat storage. In addition, warehouses are leased to other agencies such as the Emergency Food Security Reserve Administration (EFSRA), the Ethiopia Commodity Exchange (ECX), and the World Food Programme (WFP), among others (EGTE, 2015; WFP, 2013). The role of the EGTE in wheat markets is discussed in more detail in section 3.3.
The Ethiopian Emergency Food Security Reserve Administration (EFSRA) is a key actor in the distribution of wheat as food aid. The EFSRA stock of wheat and other grains was established by the government with support from the international relief agencies. These agencies, including the World Food Programme and CARE, “borrow” from the reserve for distribution in the country with the understanding that they will replace the grain at a later time by importing grain or procuring it locally (Rashid and Lemma, 2011). The EFSRA has roughly 322 thousand tonnes of storage capacity distributed across seven locations (Rashid and Lemma, 2011; WFP, 2013).
Warehouses are also owned by other government agencies such as the regional Bureaus of Agriculture, Merchandise Wholesale & Import Trade Enterprise (MEWIT), the Agricultural Input Supply Enterprise, and the Ethiopian Seed Enterprise, but the capacities are smaller.
Non-governmental organizations such as CARE, Catholic Relief Service, and Concern also own and lease warehouse space which they use for their food aid distribution activities.
Cooperatives
The grain storage capacity of the cooperatives was estimated in an IFPRI study using a random-sample phone survey of 217 primary cooperatives and 17 cooperative unions. Extrapolating these results to the four main regions of Ethiopia, it is estimated that the grain storage capacity

Wheat in Ethiopia Page 17
of the cooperative unions is 187 thousand tonnes, while that of the primary cooperatives is 1.7 million tonnes (Minot and Mekenon, 2012).
However, the main activity of most cooperatives is the distribution of fertilizer. Farmers generally sell their crops to traders and rarely sell grains through cooperatives. According to the IFPRI-ATA Baseline Survey, just 0.5% of wheat sales transactions went through a cooperative. For this reason, it is likely that cooperative storage is primarily used for fertilizer rather than wheat or other crops.
Traders
Although precise estimates are difficult to obtain, the WFP (2013) estimates that traders have about 300 thousand tonnes of grain storage capacity. In interviews with IFPRI staff during the field visits, traders almost invariably reported that they do not store grains for more than a few days or a week. When asked why they don’t store for longer periods, such as between harvest and the off-season, some said that liquidity constraints prevented them from doing so. Others reported that they were concerned about being accused of “hoarding” and “speculation”. During the 2007-08 rise in prices, government officials blamed the price increases on traders, claiming that traders had purchased large stocks of grain and were refusing to sell it in hopes of driving the price up and making a profit. Ultimately, traders were worried that local officials could confiscate their stocks, causing significant losses. Although traders in Bale and Arsi could not identify any traders whose stocks had been confiscated, some traders in the north knew of traders who had lost their stocks to confiscation by local authorities.
Farmers
Information regarding on-farm storage capacity was collected as part of the 2012 IFPRI-ATA Baseline Survey using a stratified random sample of 3000 farmers in the main four regions of Ethiopia. The most common method was to store grain in bags or other containers in the house (66% of households) and the use of a gotera (traditional grainery) (38% of households), but some farmers used gudegade (pit storage), modern graineries, and storage of grain in piles in the house (less than 10% each).
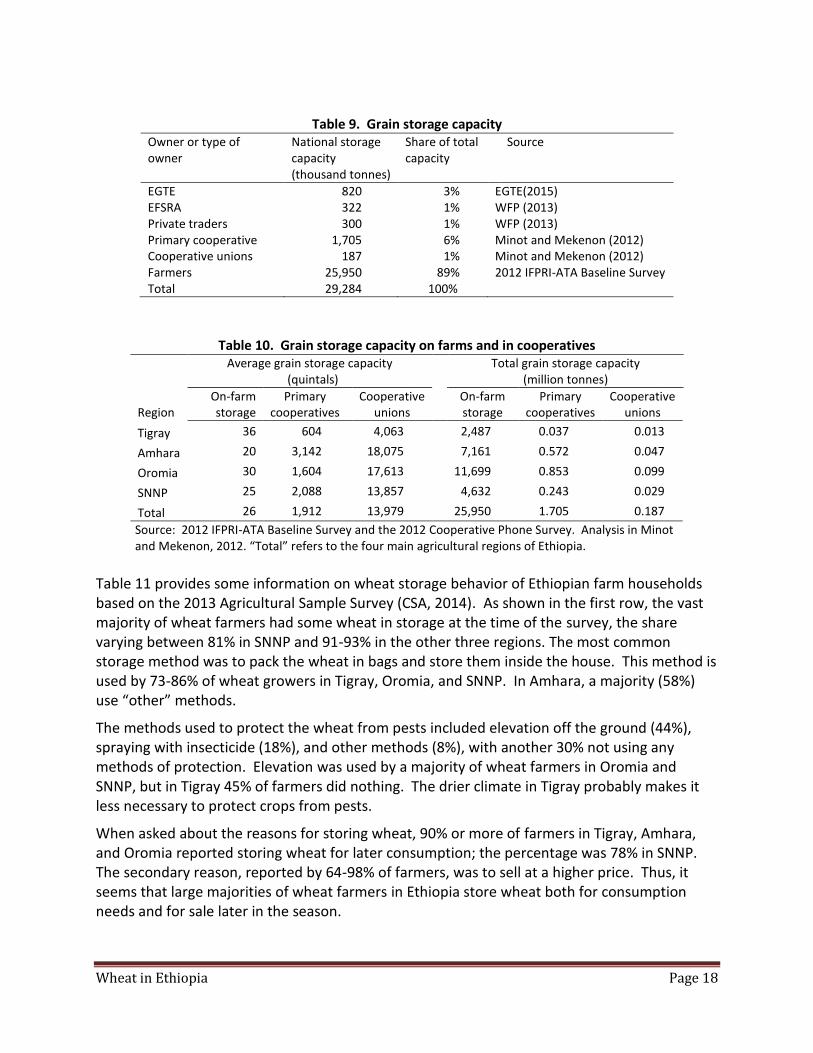
The mean storage capacity was 2.6 tonnes per farm household. Extrapolating to the national level using the sampling weights, we estimate that there is almost 26 million tonnes of on-farm grain storage capacity in the four main regions of Ethiopia. Table 9 shows the total on-farm grain storage capacity in the context of other grain storage capacity. The total capacity is almost 30 million tonnes, with farmers accounting for 89% of the total. Table 10 shows the regional breakdown of the storage capacity of cooperatives and farmers.
Wheat in Ethiopia Page 18
Table 9. Grain storage capacity
Owner or type of owner
National storage capacity (thousand tonnes)
Share of total capacity
Source
EGTE 820 3% EGTE(2015) EFSRA 322 1% WFP (2013) Private traders 300 1% WFP (2013) Primary cooperative 1,705 6% Minot and Mekenon (2012) Cooperative unions 187 1% Minot and Mekenon (2012) Farmers 25,950 89% 2012 IFPRI-ATA Baseline Survey Total 29,284 100%
Table 10. Grain storage capacity on farms and in cooperatives
Average grain storage capacity
(quintals) Total grain storage capacity
(million tonnes)
Region On-farm storage
Primary cooperatives
Cooperative unions
On-farm storage
Primary cooperatives
Cooperative unions
Tigray 36 604 4,063 2,487 0.037 0.013
Amhara 20 3,142 18,075 7,161 0.572 0.047
Oromia 30 1,604 17,613 11,699 0.853 0.099
SNNP 25 2,088 13,857 4,632 0.243 0.029
Total 26 1,912 13,979 25,950 1.705 0.187
Source: 2012 IFPRI-ATA Baseline Survey and the 2012 Cooperative Phone Survey. Analysis in Minot and Mekenon, 2012. “Total” refers to the four main agricultural regions of Ethiopia.
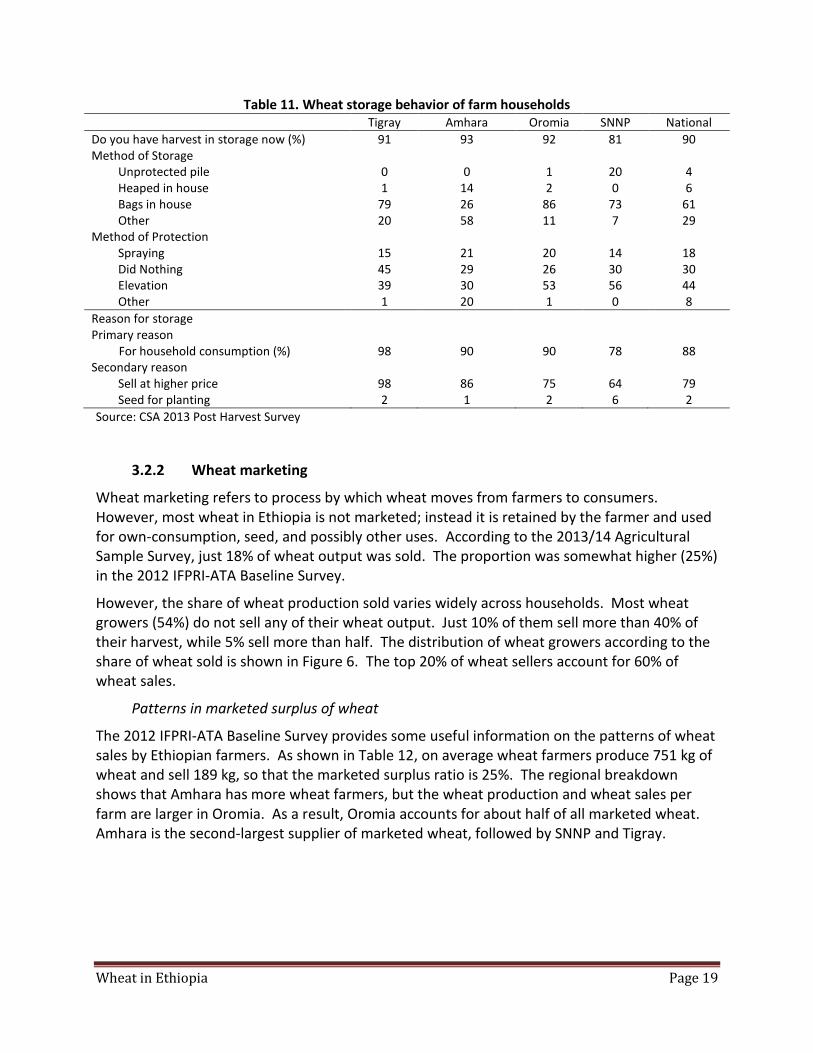
Table 11 provides some information on wheat storage behavior of Ethiopian farm households based on the 2013 Agricultural Sample Survey (CSA, 2014). As shown in the first row, the vast majority of wheat farmers had some wheat in storage at the time of the survey, the share varying between 81% in SNNP and 91-93% in the other three regions. The most common storage method was to pack the wheat in bags and store them inside the house. This method is used by 73-86% of wheat growers in Tigray, Oromia, and SNNP. In Amhara, a majority (58%) use “other” methods.
The methods used to protect the wheat from pests included elevation off the ground (44%), spraying with insecticide (18%), and other methods (8%), with another 30% not using any methods of protection. Elevation was used by a majority of wheat farmers in Oromia and SNNP, but in Tigray 45% of farmers did nothing. The drier climate in Tigray probably makes it less necessary to protect crops from pests.
When asked about the reasons for storing wheat, 90% or more of farmers in Tigray, Amhara, and Oromia reported storing wheat for later consumption; the percentage was 78% in SNNP. The secondary reason, reported by 64-98% of farmers, was to sell at a higher price. Thus, it seems that large majorities of wheat farmers in Ethiopia store wheat both for consumption needs and for sale later in the season.
Wheat in Ethiopia Page 19
Table 11. Wheat storage behavior of farm households Tigray Amhara Oromia SNNP National
Do you have harvest in storage now (%) 91 93 92 81 90 Method of Storage
Unprotected pile 0 0 1 20 4 Heaped in house 1 14 2 0 6 Bags in house 79 26 86 73 61 Other 20 58 11 7 29
Method of Protection Spraying 15 21 20 14 18 Did Nothing 45 29 26 30 30 Elevation 39 30 53 56 44 Other 1 20 1 0 8
Reason for storage Primary reason For household consumption (%) 98 90 90 78 88 Secondary reason
Sell at higher price 98 86 75 64 79 Seed for planting 2 1 2 6 2
Source: CSA 2013 Post Harvest Survey
3.2.2 Wheat marketing
Wheat marketing refers to process by which wheat moves from farmers to consumers. However, most wheat in Ethiopia is not marketed; instead it is retained by the farmer and used for own-consumption, seed, and possibly other uses. According to the 2013/14 Agricultural Sample Survey, just 18% of wheat output was sold. The proportion was somewhat higher (25%) in the 2012 IFPRI-ATA Baseline Survey.
However, the share of wheat production sold varies widely across households. Most wheat growers (54%) do not sell any of their wheat output. Just 10% of them sell more than 40% of their harvest, while 5% sell more than half. The distribution of wheat growers according to the share of wheat sold is shown in Figure 6. The top 20% of wheat sellers account for 60% of wheat sales.
Patterns in marketed surplus of wheat
The 2012 IFPRI-ATA Baseline Survey provides some useful information on the patterns of wheat sales by Ethiopian farmers. As shown in Table 12, on average wheat farmers produce 751 kg of wheat and sell 189 kg, so that the marketed surplus ratio is 25%. The regional breakdown shows that Amhara has more wheat farmers, but the wheat production and wheat sales per farm are larger in Oromia. As a result, Oromia accounts for about half of all marketed wheat. Amhara is the second-largest supplier of marketed wheat, followed by SNNP and Tigray.

Wheat in Ethiopia Page 20
Figure 6. Cumulative distribution of household by share of wheat marketed
Table 12. Patterns of marketed surplus of wheat
Household Category
% of household
in category
Wheat Sell as a % of
Production
Percentage share of
sales Production
(kg) Sales (kg)
Region
Tigray 8 417 54 13 2
Amhara 56 709 134 19 39
Oromia 30 931 310 33 50
SNNP 6 679 272 40 9
Sex of head
Male 89 777 191 25 90
Female 11 535 172 32 10
Expenditure Quintile
Poorest 18 398 42 9 5
2nd 17 663 99 17 11
3rd 19 770 180 20 19
4th 22 845 244 22 26
Richest 23 1074 373 37 40
Farm size (Ha)
Less than 0.5 8 266 32 12 1
0.5 to 1.0 22 345 51 15 6
1 to 2 33 671 147 22 26
2 to 5 34 1100 305 28 55
Over 5 3 2116 834 39 12
Total or average 100 751 189 25 100
Source: Analysis of the 2012 IFPRI-ATA Baseline Survey.

Wheat in Ethiopia Page 21
Male-headed households produce more wheat on average, but sell a somewhat smaller share of the total compared to female-headed households. This may be a result of the fact that female-headed households have fewer members, so their consumption needs are smaller.
Wheat production per farm is smallest among the poorest households and rises steadily across expenditure quintiles. Not surprisingly, the quantity of wheat sold per farm also rises with expenditure category. The marketed share is just 9% for the poorest quintile of farmers, but it rises to 37% among the richest farmers. As a result, 40% of the marketed surplus of wheat is produced by the richest 20% of farmers.
A similar pattern appears when we examine marketing patterns by farm size. The smallest farms (those with less than 0.5 hectares) sell just 9% of their harvest, on average, while those with more than 5 hectares sell an average of 39% of their wheat output. However, just 3% of farmers fall in this category, so they contribute just 12% of the total marketed surplus of wheat. On the other hand, farmers with 2-5 hectare of land sell a smaller share (28%) but account for more than half (55%) of wheat marketed in Ethiopia because they are more numerous.
As described earlier, large-scale commercial farmers produce 150-200 thousand tonnes of wheat per year. Given that almost all of this wheat is marketed, we estimate that 15-20% of marketed wheat in Ethiopia is generated by these large-scale commercial farmers.
Analysis of determinants of marketed surplus of wheat
Why do some wheat growers sell a large share of their output, while other (most) do not sell any wheat? We use econometric analysis to explore the household characteristics associated with the marketed surplus ratio of wheat. More specifically, we use a fractional logistical regression, which takes into account the fact that the dependent variable (marketed surplus ratio) must fall between 0 and 1. This model assumes that the actual relationship is an elongated “S”, which approaches zero at one extreme and one at the other extreme. The data include the 806 households in the IFPRI-ATA Baseline Survey that grew wheat in 2011-12.
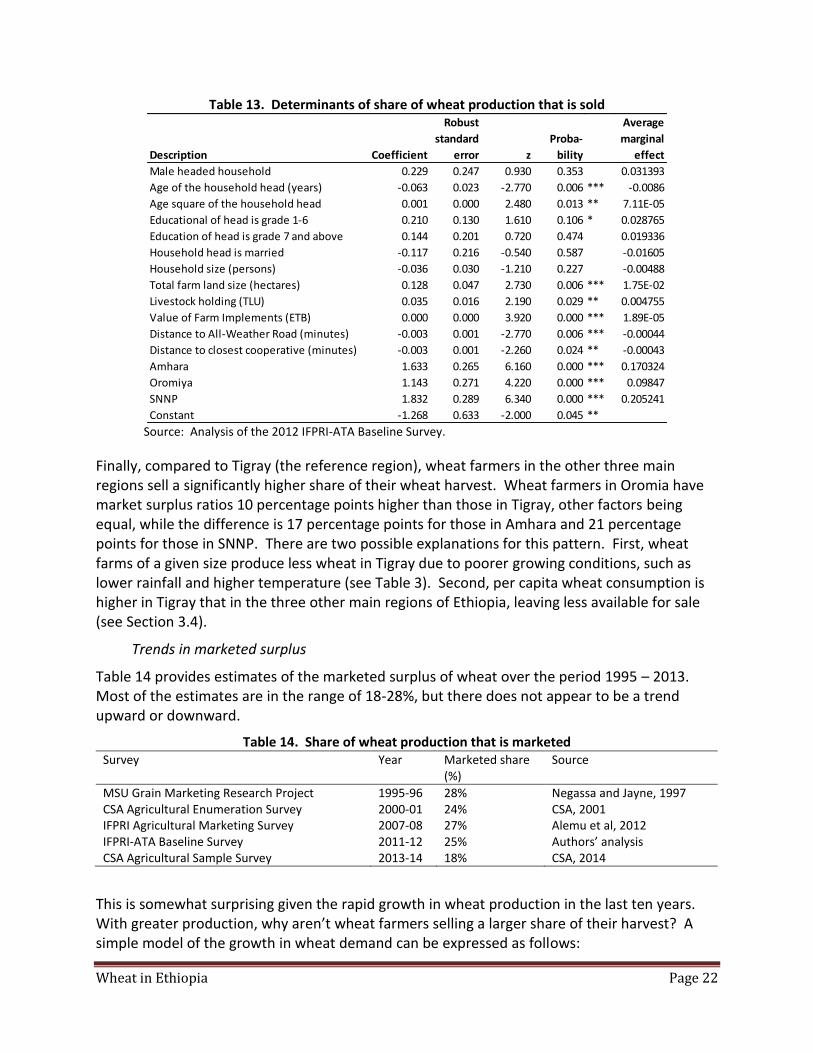
The results of this model are shown in Table 13. The age of the household head has a negative coefficient, while age squared has a positive coefficient, implying a U-shaped relationship between marketed share and age. Farm size is positively and significantly related to the marketed surplus ratio for wheat, though the effect is rather small: each additional hectare is associated with a 2 percentage-point increase in marketed share. Ownership of livestock and farm implements both contribute to a higher share of wheat sold. This may be because they contribute to a higher yield or because high-asset households are less vulnerable to market-related risks. Households that live far from a cooperative or an all-weather road tend to sell as smaller share of their wheat output, presumably because of the costs of obtaining inputs and getting crops to market is higher.
Wheat in Ethiopia Page 22
Table 13. Determinants of share of wheat production that is sold
Source: Analysis of the 2012 IFPRI-ATA Baseline Survey.
Finally, compared to Tigray (the reference region), wheat farmers in the other three main regions sell a significantly higher share of their wheat harvest. Wheat farmers in Oromia have market surplus ratios 10 percentage points higher than those in Tigray, other factors being equal, while the difference is 17 percentage points for those in Amhara and 21 percentage points for those in SNNP. There are two possible explanations for this pattern. First, wheat farms of a given size produce less wheat in Tigray due to poorer growing conditions, such as lower rainfall and higher temperature (see Table 3). Second, per capita wheat consumption is higher in Tigray that in the three other main regions of Ethiopia, leaving less available for sale (see Section 3.4).
Trends in marketed surplus
Table 14 provides estimates of the marketed surplus of wheat over the period 1995 – 2013. Most of the estimates are in the range of 18-28%, but there does not appear to be a trend upward or downward.
Table 14. Share of wheat production that is marketed Survey
Year
Marketed share (%)
Source
MSU Grain Marketing Research Project 1995-96 28% Negassa and Jayne, 1997 CSA Agricultural Enumeration Survey 2000-01 24% CSA, 2001 IFPRI Agricultural Marketing Survey 2007-08 27% Alemu et al, 2012 IFPRI-ATA Baseline Survey 2011-12 25% Authors’ analysis CSA Agricultural Sample Survey 2013-14 18% CSA, 2014
This is somewhat surprising given the rapid growth in wheat production in the last ten years. With greater production, why aren’t wheat farmers selling a larger share of their harvest? A simple model of the growth in wheat demand can be expressed as follows:
Description Coefficient
Robust
standard
error z
Proba-
bility
Average
marginal
effect
Male headed household 0.229 0.247 0.930 0.353 0.031393
Age of the household head (years) -0.063 0.023 -2.770 0.006 *** -0.0086
Age square of the household head 0.001 0.000 2.480 0.013 ** 7.11E-05
Educational of head is grade 1-6 0.210 0.130 1.610 0.106 * 0.028765
Education of head is grade 7 and above 0.144 0.201 0.720 0.474 0.019336
Household head is married -0.117 0.216 -0.540 0.587 -0.01605
Household size (persons) -0.036 0.030 -1.210 0.227 -0.00488
Total farm land size (hectares) 0.128 0.047 2.730 0.006 *** 1.75E-02
Livestock holding (TLU) 0.035 0.016 2.190 0.029 ** 0.004755
Value of Farm Implements (ETB) 0.000 0.000 3.920 0.000 *** 1.89E-05
Distance to All-Weather Road (minutes) -0.003 0.001 -2.770 0.006 *** -0.00044
Distance to closest cooperative (minutes) -0.003 0.001 -2.260 0.024 ** -0.00043
Amhara 1.633 0.265 6.160 0.000 *** 0.170324
Oromiya 1.143 0.271 4.220 0.000 *** 0.09847
SNNP 1.832 0.289 6.340 0.000 *** 0.205241
Constant -1.268 0.633 -2.000 0.045 **

Wheat in Ethiopia Page 23
1 + 𝑔 = (1 + 𝑝)(1 + 𝑦𝜂)
where g=the growth rate in wheat demand by wheat farmers p=the growth rate in population y=the growth rate in per capita income η=the income elasticity of demand for wheat
According to the World Bank, rural population growth is 2.0%. Per capita gross national income (GNI), measured using the Atlas method, has been 6.0% over the past ten years for which data are available (World Bank, 2015). And analysis of the HICE survey data suggests that the income elasticity of demand for wheat is 0.83 (see Section 3.4). Assuming that the income of wheat farmers has grown at the same rate as per capita GNI, then the growth in demand for wheat for own consumption should be (1.02)(1+(6.0)(0.83)) = 1.071 or 7.1% growth. According to CSA estimates, the growth in wheat production has been 9.3% over the past decade (2003-14 to 2013-14) or 7.5% since 1995-96.
Thus, rural population growth and income growth can account for most, but not all, of the apparent growth in demand for wheat by wheat farmers. One possible explanation is that wheat demand has increased faster than our projections due to changes in preferences and/or relative prices. For example, in recent years, the price of teff has risen faster than the price of other grains, which could have causes some consumers to shift from teff to wheat. Another possible explanation is that the growth in wheat production may be slightly over-estimated. According to our calculations, a growth rate of 7.1% in wheat production over the past decade (rather than 9.3%) would be consistent with the stable marketed surplus ratio for wheat.
Spatial distribution of wheat sales
Similar to the spatial patterns in production, high marketed surplus woredas are primarily located in the Bale, Arsi, and West Arsi (see Figure 7). The top ten marketed surplus woredas are in these three zones and a total 16 of the top 25 woredas are in these zones. The remaining top woredas can be found in other areas of Oromia, northern SNNP, and southern Amhara. Interestingly, the northern high producing woredas of Amhara and Tigray are not equivalently high marketing surplus woredas. Overall, this makes the relative grouping more centrally located south east of Addis Ababa.
Figure 7. Spatial distribution of wheat sales
Wheat in Ethiopia Page 24
Source: Authors’ analysis based on data from the 2013 Agricultural Sample Survey.
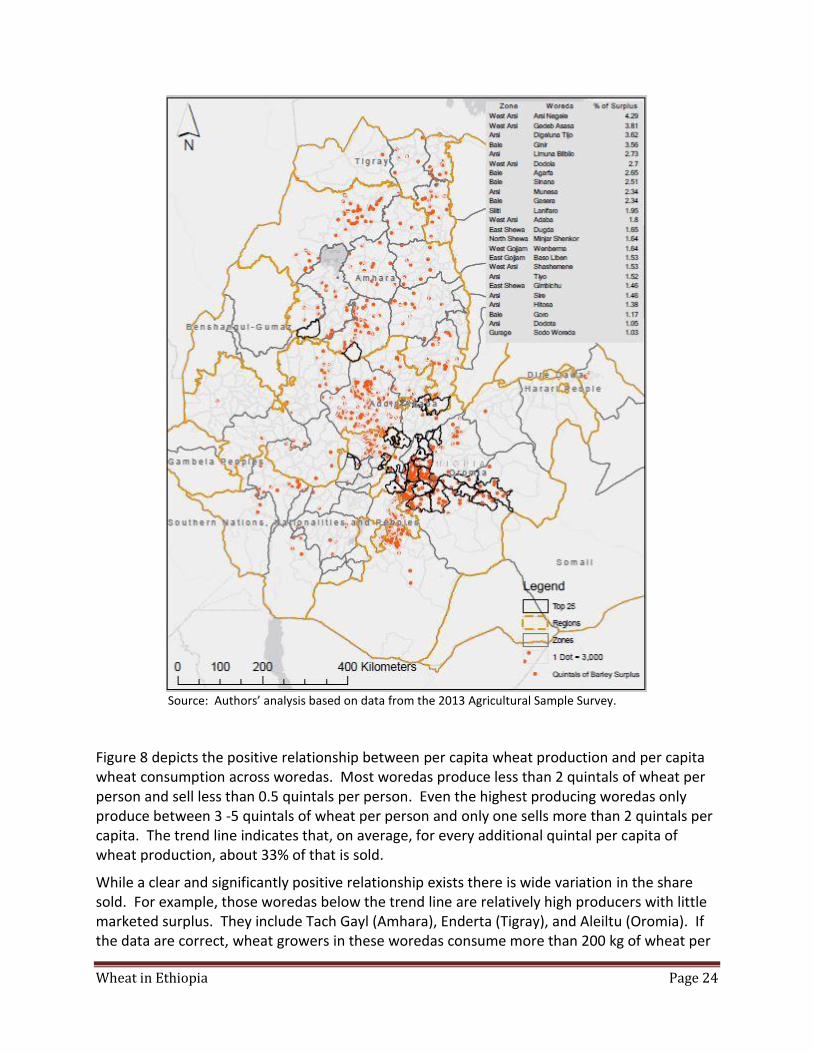
Figure 8 depicts the positive relationship between per capita wheat production and per capita wheat consumption across woredas. Most woredas produce less than 2 quintals of wheat per person and sell less than 0.5 quintals per person. Even the highest producing woredas only produce between 3 -5 quintals of wheat per person and only one sells more than 2 quintals per capita. The trend line indicates that, on average, for every additional quintal per capita of wheat production, about 33% of that is sold.
While a clear and significantly positive relationship exists there is wide variation in the share sold. For example, those woredas below the trend line are relatively high producers with little marketed surplus. They include Tach Gayl (Amhara), Enderta (Tigray), and Aleiltu (Oromia). If the data are correct, wheat growers in these woredas consume more than 200 kg of wheat per

Wheat in Ethiopia Page 25
capita, implying that their diets are heavily reliant on wheat. Those woredas above the line have high sales relative to production. These include Lanifara (SNNP) and Wenberma (Oromia). The data indicate that wheat growers in these two woredas consume about 75 kg per capita, which is still above the national average. They presumably have a more diversified diet and consume other staples such as maize and sorghum.
Figure 8. Per capita production and sales of wheat by woreda
Source: Authors’ analysis based on data from the 2013 Agricultural Sample Survey.
Surplus and deficit wheat zones
The analysis above focuses on patterns of wheat production and sales. In order to identify surplus and deficit zones, however, it is necessary to make use of consumption data. In this section, we combine information from the 2013 Agricultural Sample Survey and the 2011 Household Income, Consumption, and Expenditure (HICE) survey. There are two problems with using HICE data to represent overall wheat use in Ethiopia:
The HICE survey measures direct human consumption of wheat and wheat products, but does not include the use of wheat for seed, feed, and manufacturing uses.
As described in Section 2.2, even after taking into account FAO estimates of wheat used for seed, feed, and manufacturing uses, estimated total wheat availability (production plus net imports) is significantly greater than estimated total wheat utilization (consumption and other uses).
To address these issues, we scale up wheat consumption in each zone by a fixed percentage in order to make national wheat utilization equal to the FAO estimate of wheat utilization.
Wheat in Ethiopia Page 26
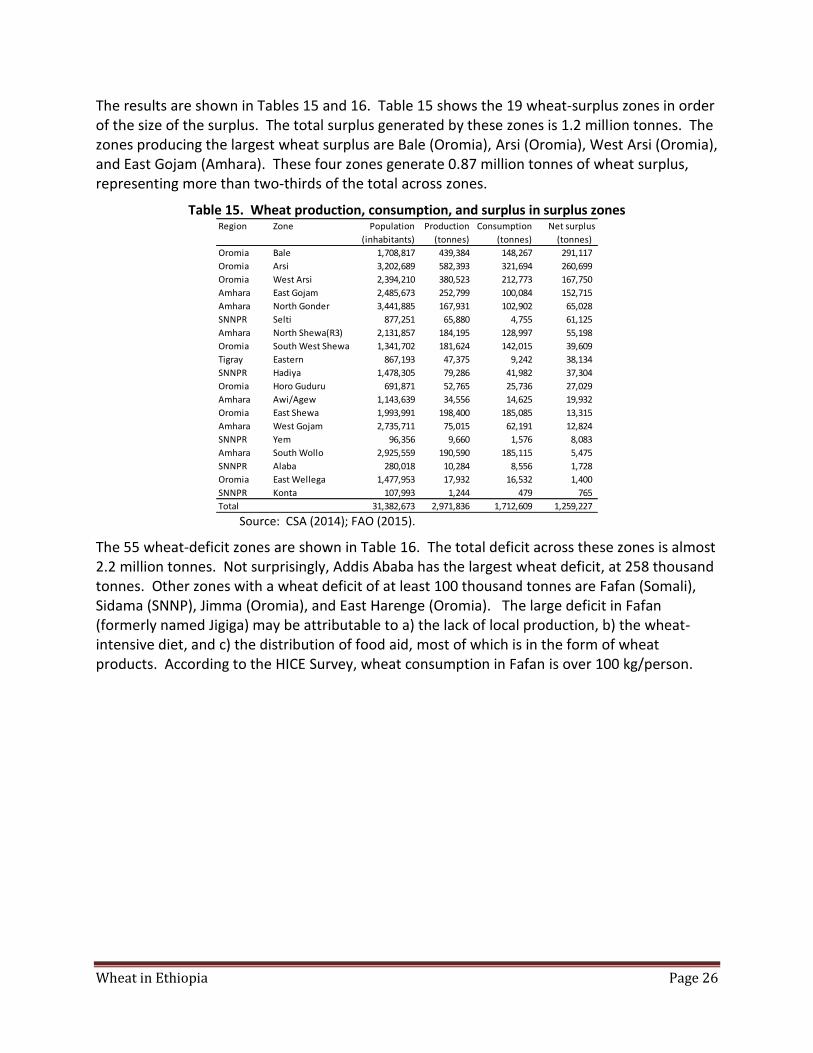
The results are shown in Tables 15 and 16. Table 15 shows the 19 wheat-surplus zones in order of the size of the surplus. The total surplus generated by these zones is 1.2 million tonnes. The zones producing the largest wheat surplus are Bale (Oromia), Arsi (Oromia), West Arsi (Oromia), and East Gojam (Amhara). These four zones generate 0.87 million tonnes of wheat surplus, representing more than two-thirds of the total across zones.
Table 15. Wheat production, consumption, and surplus in surplus zones
Source: CSA (2014); FAO (2015).
The 55 wheat-deficit zones are shown in Table 16. The total deficit across these zones is almost 2.2 million tonnes. Not surprisingly, Addis Ababa has the largest wheat deficit, at 258 thousand tonnes. Other zones with a wheat deficit of at least 100 thousand tonnes are Fafan (Somali), Sidama (SNNP), Jimma (Oromia), and East Harenge (Oromia). The large deficit in Fafan (formerly named Jigiga) may be attributable to a) the lack of local production, b) the wheat-intensive diet, and c) the distribution of food aid, most of which is in the form of wheat products. According to the HICE Survey, wheat consumption in Fafan is over 100 kg/person.
Region Zone Population Production Consumption Net surplus
(inhabitants) (tonnes) (tonnes) (tonnes)
Oromia Bale 1,708,817 439,384 148,267 291,117
Oromia Arsi 3,202,689 582,393 321,694 260,699
Oromia West Arsi 2,394,210 380,523 212,773 167,750
Amhara East Gojam 2,485,673 252,799 100,084 152,715
Amhara North Gonder 3,441,885 167,931 102,902 65,028
SNNPR Selti 877,251 65,880 4,755 61,125
Amhara North Shewa(R3) 2,131,857 184,195 128,997 55,198
Oromia South West Shewa 1,341,702 181,624 142,015 39,609
Tigray Eastern 867,193 47,375 9,242 38,134
SNNPR Hadiya 1,478,305 79,286 41,982 37,304
Oromia Horo Guduru 691,871 52,765 25,736 27,029
Amhara Awi/Agew 1,143,639 34,556 14,625 19,932
Oromia East Shewa 1,993,991 198,400 185,085 13,315
Amhara West Gojam 2,735,711 75,015 62,191 12,824
SNNPR Yem 96,356 9,660 1,576 8,083
Amhara South Wollo 2,925,559 190,590 185,115 5,475
SNNPR Alaba 280,018 10,284 8,556 1,728
Oromia East Wellega 1,477,953 17,932 16,532 1,400
SNNPR Konta 107,993 1,244 479 765
Total 31,382,673 2,971,836 1,712,609 1,259,227

Wheat in Ethiopia Page 27
Table 16. Wheat production, consumption, and surplus in deficit zones
Source: CSA (2014); FAO (2015).
Region Zone Population Production Consumption Net surplus
(inhabitants) (tonnes) (tonnes) (tonnes)
Addis Ababa Addis Ababa 3,281,342 - 263,231 -263,231
Somali Fafan 1,158,309 11,329 215,730 -204,401
SNNPR Sidama 3,837,513 2,898 159,590 -156,693
Oromia Jimma 3,156,403 66,651 183,268 -116,618
Oromia East Harerge 3,286,338 36,350 144,056 -107,707
Oromia West Shewa 2,500,482 138,110 240,633 -102,524
Tigray Western 410,662 2,775 86,385 -83,610
Tigray Central 1,408,453 53,846 132,714 -78,868
Oromia West Harerge 2,261,480 8,205 85,815 -77,610
Amhara South Gonder 2,364,603 139,503 207,390 -67,887
Oromia Guji 1,680,859 9,087 75,339 -66,252
Afar Zone 1 525,028 - 64,762 -64,762
Somali Siti 599,818 - 59,106 -59,106
Amhara North Wollo 1,733,616 65,207 115,536 -50,330
Dire Dawa Dire Dawa 427,000 56 49,696 -49,640
SNNPR Wolayita 1,808,548 2,707 52,066 -49,358
Somali Shabelle 555,114 - 46,977 -46,977
Tigray Southern 1,439,645 100,908 144,910 -44,002
SNNPR Gurage 1,523,129 37,006 78,283 -41,277
Somali Afder 679,553 - 34,926 -34,926
Hareri Hareri 226,000 159 34,798 -34,639
Somali Liben 643,673 - 33,082 -33,082
Somali Jarar 570,582 - 29,326 -29,326
Afar Zone 3 248,357 - 27,648 -27,648
SNNPR Gedio 1,028,063 677 25,691 -25,014
Afar Zone 2 407,826 - 24,418 -24,418
Somali Nogob 415,266 - 21,343 -21,343
Oromia Ilubabor 1,539,183 19,669 39,577 -19,908
Somali Korahe 373,236 - 19,183 -19,183
Somali Doolo 365,101 - 18,765 -18,765
SNNPR Bench Maji 786,421 763 19,196 -18,432
Amhara Wag Himra 487,324 9,569 27,824 -18,255
Tigray North Western 834,050 - 17,861 -17,861
SNNPR Segen Peoples' 681,979 8,308 25,854 -17,547
SNNPR Dawro 575,208 - 16,377 -16,377
Oromia West Wellega 1,637,663 5,462 20,476 -15,014
Afar Zone 4 283,456 - 14,569 -14,569
SNNPR Gamo Gofa 1,901,953 15,584 29,177 -13,594
SNNPR South Omo 675,333 4,257 17,773 -13,516
Oromia Borena 1,219,344 1,751 15,080 -13,330
Afar Zone 5 213,333 - 10,965 -10,965
SNNPR KT 833,832 28,946 39,648 -10,702
Beneshangul GumuAsosa 445,693 475 9,992 -9,517
Gambela Agnuak 184,156 - 6,780 -6,780
Amhara Oromia 529,995 598 5,493 -4,895
SNNPR Sheka 247,874 42 4,042 -4,000
Oromia North Shewa(R4) 1,733,919 149,954 153,773 -3,818
Gambela Nuer 138,640 - 2,416 -2,416
Oromia Kelem Wellega 965,099 14,592 16,616 -2,024
Gambela Majang 73,204 - 1,644 -1,644
SNNPR Basketo 67,422 - 1,548 -1,548
SNNPR Keffa 1,029,807 14,144 15,606 -1,462
Beneshangul GumuMetekel 403,216 3,593 5,022 -1,429
Beneshangul GumuKemashi 127,089 0 1,187 -1,187
Amhara Special Woreda 39,126 29 223 -194
56,570,318 953,211 3,193,391 -2,240,181

Wheat in Ethiopia Page 28
The estimates of wheat surpluses and deficits can be plotted on a map of Ethiopia to show their spatial distribution (see Figure 9). The solid green circles represent wheat surplus zones, while the hollow circles indicate wheat deficit zones, with the area of the circle being proportional to the volume of surplus or deficit.
The map confirms the patterns that can be seen in the tables: wheat deficits are much less concentrated than the wheat surpluses. The top four surplus zones in Ethiopia account for two-thirds of the total surplus, while the top four deficit zones represent just one-third of the total deficit. Furthermore, although Addis Ababa is the largest demand sink, it represents just 12% of the total deficit. This suggests that wheat flows do not represent a hub-and-spoke pattern in which wheat flows from different surplus zones into Addis Ababa and other cities. Instead, the flows follow a complex pattern in which most of the volume is shipped from rural surplus zones to rural deficit zones.
Figure 9. Map of wheat surplus and wheat deficit zones
Source: Analysis based on data from 2011 HICE and 2013 Agricultural Sample Survey.

Wheat in Ethiopia Page 29
Spatial patterns of wheat flows
What are the spatial patterns of wheat flows in Ethiopia? Although government statistics are available for production and consumption of the major crops, no estimates are available of the flow of agricultural commodities among zones. However, we can generate a rough estimate of the flows by identifying the least-cost way to redistribute wheat from the surplus zones to the deficit zones (see Box 1 for a description of the methods).
Box 1. Methods to estimate spatial flows of wheat among zones
Although there are 5,550 potential flows between pairs of zones, the solution involves just 91 flows. Figure 10 shows the main flows. According to the FAO Food Balance Sheet, wheat imports to Ethiopia were 865 thousand tonnes in 2013. Based on the results of the linear programming model, more than one quarter of this wheat (257 thousand tonnes) is shipped to Addis Ababa, satisfying almost all the requirements of the capital city. Large shipments of imported wheat are also shipped to Fafan and Siti in Somali; to Jimma, West Shewa, and West Hererge in Oromia; to the three southern zones of Afar; and to Dire Dawa.
Arsi (Oromia) generates 267 thousand tonnes of wheat surplus, the largest in the country. According to the linear programming model, these are shipped to three zones: Fafan (Somali), East Harerge (Oromia), and Guji (Oromia).
The second-largest wheat surplus is produced by Bale (Oromia), which generates over 200 thousand tonnes of wheat surplus. According to the model, most of this surplus is shipped to the seven southern and western zones of Somali.
Linear programming is a mathematical technique to minimize (or maximize) a linear objective function subject to a set of linear constraints, which can take the form of equalities or inequalities. In this case, we search for a set of flows (Fij) that minimize the cost of transportation:
∑ ∑ 𝐶𝑖𝑗𝐹𝑖𝑗
𝑛
𝑗=1
𝑛
𝑖=1
where Cij is the cost of transporting one tonne of wheat from zone i to zone j, Fij is the volume of wheat in tonnes shipped from zone i to zone j, and n is the number of zones. The constraints are that supply (Si) plus inflows must be equal to demand (Di) plus outflows for each zone:
𝑆𝑖 + ∑ 𝐹𝑗𝑖 =
𝑛
𝑗=1
𝐷𝑖 + ∑ 𝐹𝑖𝑗 𝑓𝑜𝑟 𝑎𝑙𝑙 𝑖
𝑛
𝑗=1
and all flows must be positive: 𝐹𝑖𝑗 ≥ 0 𝑓𝑜𝑟 𝑎𝑙𝑙 𝑖, 𝑗
Since we have data for 74 zones plus imports, there are 75*74/2=2,775 inter-zonal pairs. In order to simplify the analysis, we use the straight-line distance between the geometric centers of each pair of zones as a proxy for the cost of transportation between them. Imported wheat is assumed to flow from Djibouti to Adama and then to the deficit zones. The software Matlab is used to implement the linear programming model and solve for the 5,550 flow variables.

Wheat in Ethiopia Page 30
The third largest wheat surplus zone is West Arsi. The model predicts that this surplus is mainly shipped to Sidama (SNNP), with smaller volumes going to Gedio (SNNP) and Borena (Oromia). In other words, a cost-minimizing distribution of surpluses, none of the surpluses from the southern wheat basket of Ethiopia are shipped to Addis Ababa, Dire Dawa, or other deficit areas north of Addis.
The fourth and fifth largest wheat surplus zones are East Gojam and North Gonder, both in Amhara. According to the model, East Gojam supplies Eastern and Southern Tigray, as well as South Gondar and Wag Himra in Amhara. In contrast, North Gonder ships its surplus north into Central and Eastern Tigray.
The SNNP region has several wheat surplus zones. Most are of these are small, but Silte and Hadeya are ranked sixth and tenth nationally. Both of these mainly supply deficit zones elsewhere in SNNP, the most important ones being Wolayita, Bench Maji, and Dawro.
North Shewa (Amahara) is the seventh largest wheat surplus zone. According to the model, it supplies Southern Tigray and two zones in Afar. South West Shewa (Oromia) is the eight largest, and supplies several zones, with most of the flow destined for Jimma. Finally, Western Tigray completes the top ten wheat surplus zones. It supplies the deficit zones of North West and Central Tigray.
All zones in Gambela and Beneshangu have wheat deficits, mainly because there is very little wheat production in these two regions. At the same time, per capita wheat consumption is quite low, so the deficits are relatively small (less than 10 thousand tonnes). As a result, the wheat requirements for these zones can be met with modest flows from nearby surplus zones in Amhara and western Oromia.
These results should be interpreted with caution. The distance between zones is only an approximation of the cost of transporting wheat between them. The model does not take into account seasonality, in which imported wheat is more widely distributed during the off-season and domestic wheat becomes more important after the meher harvest. Furthermore, the model assumes wheat is perfectly homogeneous, but differences in the characteristics of imported and domestic wheat undoubtedly have some influence on the flows. As a result, actual flows may differ from the flows estimated by the model, and the model should not be considered a guide for how wheat “should” be marketed. Nonetheless, in the absence of direct measurements, it may be considered an approximation of the flows of wheat between markets.

Wheat in Ethiopia Page 31
Figure 10. Estimated flows of wheat among zones in Ethiopia
Source: Linear programming analysis based on production and consumption data from CSA (2014) and FAO (2015).
Marketing costs
This section describes the composition of wheat marketing costs, defined as the full cost of shipping wheat from one location to another. Table 17 shows the composition of costs in shipping imported wheat from Djibouti to Addis and then to Mekele. The CIF price of wheat was US$ 233, representing 61% of the Mekele wholesale price. It costs US$ 127/tonne to get it from Djibouti to Addis, so the wholesale price in Addis is US$ 360. The two most important components of costs for this segment are operating costs, inland transport, and customs duty. The cost to transport the wheat to Mekele is US$ 21/tonne.

Wheat in Ethiopia Page 32
Table 17. Marketing margins for imported wheat
Cost element Cost or price (US$/t)
Percent
CIF price Djibouti 233.0 61% Port fee and charges 9.6 3% Import Duty 23.3 6% Insurance (0.0061%) 0.7 0% Clearing and transit 2.7 1% Bank charge (1.25% on c. & f. for 4 months) 2.2 1% Quality control and bagging (0.2 % on c. & f.) 1.1 0% Interest cost for 1.5 month (6.25 % on c. & f.) 4.2 1% Operating cost (8.4% on c. & f.) 45.2 12% Overhead cost 0.7 0% Loss or spoilage (1.42%) 1.7 0% Inland transport (Djibouti to Addis 0.022 US$/km-t) 19.0 5% Other charges (Unloading, fumigation, etc.) 17.3 5% Transport cost (Addis to Mekele 0.025 US$/km-tonne) 21.3 6% Total cost 382.0 100%
Source: Costs based on expert informants interviews, duty from customs, Excise and preventive service, import price from custom authority, transport cost from Ministry of Roads authority. And 6% discount for quality adjustment.
Table 18 shows the cost of transporting wheat from the southeastern surplus zone to Addis Ababa and Shashemene. Transportation represents the main cost of marketing, as is often the case in studies of marketing costs. Although the cost of loading and the tax are fairly consistent, the transport fee varies and does not seem proportional to distance. In interviews, wholesalers report that the cost of renting trucks can vary depending on several factors: the size of the truck - larger trucks are less expensive on a per-bag basis, the specific route – the availability of backhaul from the destination reduces the rental rate, and the season – transport rates are 20-30% higher during the harvest season.
Table 18. Marketing margins for different channels for Ethiopian wheat
Origin Ginir Robe Robe Destination Addis Ababa Shashemene Addis Ababa Distance (km) 513 244 193
Cost item -----(birr/quintal)----- Producer price 680 680 680 Broker fee 5 0 0 Loading 6 6 6 Tax 1 3 3 Transport (truck rental) 100 50 75 Trader margin 11 15 15 Sale price at destination 806 754 779
Source: Interviews with traders in Shashemene.

Wheat in Ethiopia Page 33
The trader margin tends to be in the range of 10-15 birr/quintal or 12-20% of the sale price. This covers the trader’s profit and the risk premium associated with the business. For example, although wholesalers often line up a buyer in the destination market, the price is not fixed ahead of time, so it is possible to arrive and find the price has dropped, resulting in losses for the trip.
3.2.3 Wheat processing
Wheat processing refers to the transformation of wheat grain into wheat flour, as well as related activities such as cleaning, hulling, packaging, and labeling. In Ethiopia, wheat processing involves a wide range of scales and technologies, from small-scale hammer mills to large-scale flour factories.
Small-scale grain mills
Small-scale grain mills are scattered throughout the grain-producing regions of Ethiopia. Most of them are hammer mills with a capacity of 200 - 600 kg/hour or (assuming 6 hours/day of operation) 1.2 - 5.4 tonnes/day. Some of the mills are operated by cooperatives or projects, but the vast majority are run by small-scale entrepreneurs. Smaller mills can be operated by two people, but larger operations (which may have several mills under one roof) may employ 5-6 workers. They mill maize, wheat, and other grains as a service, taking a percentage (often 10%) of the milled grain as payment. Wheat growers retain all or a portion of their harvest for own-consumption. It is stored in the form of grain, but when needed for consumption, it is brought to a small-scale mill for milling. Given that roughly three-quarters of the wheat grown in Ethiopia is not marketed, this implies that small-scale mills probably mill a large majority of the wheat produced in Ethiopia.
The 2012 IFPRI-ATA Baseline Survey provides some information on the distribution of grain mills in rural areas. The community questionnaire collected information on the number of grain mills3 in each of the 200 kebeles in the sample. As shown in Table 19, 71% of kebeles have at least one grain mill, the percentage being highest in Amhara and lowest in SNNP. On average, there are 2.2 grain mills in each kebele, including the kebeles with none. This implies that the total number of grain mills in the four main agricultural regions of Ethiopia is 29 thousand, more than two-thirds of which are found in Amhara and Oromia.
Assuming that that the average capacity is 520 tonnes per year (2 tonnes per day and 260 days per year), the national capacity of small-scale grain mills would be about 15 million tonnes. Assuming that the 2.9 million tonnes of wheat that is kept for home consumption is milled at small-scale grain mills, this would represent about 20% of the estimated total capacity of these mills. However, the capacity utilization of these mills is undoubtedly larger than this. First, much of the wheat that is marketed and purchased by rural consumers is taken to small-scale mills for processing. Second, these small-scale grain mills are used for maize and other grains in addition to wheat.
3 In principal, some of the mills counted in the survey could be large-scale mills, but in practice the large-scale flour factories are located in urban areas, while small-scale grain mills serve rural kebeles.

Wheat in Ethiopia Page 34
Table 19. Distribution of small-scale grain mills by region
Region Share of kebeles with at least one grain mill
(%)
Average number of grain mills per kebele
(including zeroes)
Estimated total number of grain mills
(thousands)
Tigray 85% 3.8 2.3 Amhara 93% 3.5 11.7 Oromia 74% 2.0 12.2 SNNP 40% 1.0 3.1 All four regions 71% 2.2 29.3
Source: Analysis of data from the community questionnaire of the 2012 IFPRI-ATA Baseline Survey.
Large-scale flour factories
At the other end of the spectrum are large-scale flour factories. They tend to be located in urban areas and purchase imported wheat from the EGTE and domestically-produced wheat from traders. These factories sell wheat flour to bakeries, wholesalers, retailers, and institutional buyers such as hospitals and the army, particularly in urban areas.
According to data provided by the Bureau of Investment, there are 682 flour mills in Ethiopia. About 40% are located in Oromia, and another 27% in Addis Ababa, as shown in Table 20. Among the 81 flour factories reporting annual capacity, the average was 13 thousand tonnes per year. Based on this sample, the flour mills in Dire Dawa and SNNP seem to be larger than average, while those in Addis Ababa are somewhat smaller. If we assume that the mills reporting milling capacity are representative of the others, we can estimate the total milling capacity at 7.9 million tonnes/year. Oromia accounts for more than one-third of the national milling capacity, while Addis Ababa and SNNP each have about 20% of the total. Based on field interviews, this may reflect a relatively recent trend toward decentralization of milling capacity. Millers in Bale and Arsi report that in the past, large-scale flour mills were concentrated in Addis Ababa, but in the last 5-10 years, most of the new flour factories are being constructed outside the capital city.
It is interesting to note that the estimated total capacity of small-scale hammer mills (15 million tonnes) would represent almost double that of the large-scale flour mills (7.9 million tonnes). However, this is consistent with the fact that the fact that the small-scale mills process wheat that farmer produced for their own consumption, which represents 75% of domestic production and about 60% of total wheat consumption in the country.
Statistics on the capacity utilization by large-scale mills are not available. However, interviews with the managers of large-scale flour factories in Bale, Arsi, and North Gonder suggest that it is around 25-35%. Alternatively, we can calculate the capacity utilization by assuming that the large-scale factories process all the wheat imported by EGTE (around 1 million tonnes in recent years) and the marketed surplus of wheat (somewhat less than 1 million tonnes). In this case, the large-scale mills would process somewhat less than 2 million tons or one-quarter of their estimated capacity.
Because of the low capacity utilization, one of the most important challenges that millers face is to increase throughput. The amortization of the cost of the mill and associated infrastructure is

Wheat in Ethiopia Page 35
fixed, so the profitability of the business is sensitive to the capacity utilization, particularly during the off-season.
Table 20. Distribution of large-scale flour factories
Location
Number of large-scale flour mills
Share of large scale flour mills (%)
Average capacity among the 81
factories reporting capacity
(1000 tonnes/year)
Estimated total capacity of large-
scale flour factories (1000 tonnes/year)
Tigray 27 4% 11.7 316 Amhara 44 6% 10.4 458 Oromia 272 40% 10.7 2,910 SNNP 94 14% 17.1 1,607 Addis Ababa 183 27% 9.0 1,647 Dire Dawa 38 6% 17.3 657 Harari 10 1% - 133 Other 14 2% - 186 Total 682 100% 13.3 7,915
Source: Analysis of data provided by the Bureau of Investment. Another problem reported by large-scale mills is frequent interruptions in electrical power. Having to shut down operations for 3-4 hours at a time reduces their throughput and introduces uncertainty in their plans. In addition, the city water supply is sometimes cut, particularly during the dry season, forcing the factory to shut down.
A related strategic decision faced by millers is whether to purchase EGTE wheat or domestic wheat. EGTE wheat is available for a lower cost, but it comes with the requirement that the miller sell the flour to selected bakeries at an administratively-determined price. Interviews with millers indicate that they appreciate having buyers identified by the EGTE, which eliminates a source of uncertainty in flour marketing. Of course, a key deterrent is having to sell the flour at an administratively determined price that is below the market price.
Field interviews reveal that millers seem to have a preference for buying EGTE wheat, though not all are able to do so. In Shashemene, only five of the eight flour factories are able to purchase EGTE wheat, and even those mills that have access do not rely entirely on EGTE wheat. One large-scale flour mill reported that EGTE wheat used to account for 25% of their procurement, but the proportion has fallen to 10%. This complicates the task of the EGTE in enforcing the price controls, since flour made from EGTE wheat must be sold at the controlled price, while flour produced by the same mill from domestic wheat can be sold at market prices. The EGTE must monitor flour sales by participating mills because mills have a strong incentive to buy EGTE wheat at subsidized prices and sell the flour at the (higher) market price.
Interviews with local officials and large-scale millers suggest that there is substantial investment and growth occurring in the milling sector. Officials at the Department of Trade and Development in Shashemene report that the number of flour factories in the city has increased

Wheat in Ethiopia Page 36
from three in 2010 to eight in 2014. Over the same period, the number of grain mills has increased from five to 15.
3.3 International trade
Of the four main staple grains in Ethiopia, wheat is the only one for which international trade plays an important role. Although the country is essentially self-sufficient in maize, teff, and sorghum, it relies on imports for about one quarter of domestic wheat utilization. This section discusses the trends in wheat imports, types of imports, and the evolution of wheat policy.
3.3.1 Evolution of wheat import policy
From 1975 to 1990, the Derg regime tightly controlled agricultural markets and trade, setting annual production quotas, restricting private grain trade and interregional grain movement, setting administrative wholesale prices in each province, and rationing grain to urban consumers. The Agricultural Marketing Corporation (AMC), a state-owned enterprise, had a monopoly on wheat imports.
The change of government in 1991 ushered in a series of market reforms. In 1992, the AMC was reorganized as a public enterprise, the Ethiopian Grain Trading Enterprise (EGTE). The EGTE was given a mandate to: (a) stabilize prices with an objective to encourage production and protect consumers from price shocks, (b) earn foreign exchange through exporting grains to the world market, and (c) maintain a strategic food reserves for disaster response and emergency food security operations. Restrictions on private-sector trading were lifted, and traders were allowed to compete with the EGTE (Rashid, 2010).
However, the EGTE encountered at least three major problems in the subsequent years. First, there was a constant tension between fulfilling its mandate of price stabilization and that of competitiveness and profitability (Bekele, 2002). Second, EGTE was not effective in stabilizing grain prices due to its limited grain purchases and sales network and shortage of working capital.
In the late 1990s, the mandate of the EGTE was substantially revised, requiring the EGTE to gradually move away from price stabilization and focus on export promotion and facilitation of the administration of Strategic Food Security Reserves and national disaster prevention and preparedness program. During the period 1999-2007, most commercial wheat imports were organized by private traders (Rashid, 2010).
In 2008, the Ethiopian Commodity Exchange (ECX) was launched. Although original designed to handle staple grains, the exchange did not succeed in attracting large volumes of grain. In 2008, the traded only 200 tons. In late 2008, the focus of the exchange shifted to coffee. Currently, the ECX does not play a role in wheat marketing.
As a result of rising grain prices in 2006-08, the government imposed a ban on grain export, re-introduced urban food rationing, suspended the local procurement program of the World Food Programme, and began direct government imports of wheat for open market sales and price stabilization. Since 2008, the EGTE has carried out almost all commercial wheat imports, selling the wheat at subsidized prices to selected large-scale millers to provide subsidized bread to consumers. This program is examined in more detail in Section 3.4.

Wheat in Ethiopia Page 37
3.3.2 Trends in wheat imports
Although wheat production has grown steadily in Ethiopia, wheat consumption has expanded as well, as shown in Figure 11. Using 1995/96 as the base year, wheat consumption increased from 2.1 million tonnes to 4.2 million tonnes, representing an annual increase of about 4.2%. This is well above the estimated population growth of approximately 2.5%, implying that per capita wheat consumption has been rising. In addition, wheat production has increased from 1.1 million tonnes in 1995/96 to approximately 3.9 million tonnes in 2013-14. Since 1994-95, wheat imports have increased an average of 5.3% per year, but there has been a surge in the volume of wheat imports since 2008-09. Even though different methodologies and data sources make detailed comparisons between this data challenging, the percentage increase in production, in excess of both consumption and import growth, suggest a relative decline in the importance of imported wheat. However, absolute levels of wheat imports remain a concern and are a significant use of foreign exchange.
Figure 11. Wheat production, consumption and import, Ethiopia (1995/96 – 2012/13)
Source: Central Statistics Authority (2013); United State Department of Agriculture (2013).
3.3.3 Types of wheat imports
Ethiopian wheat imports can be categorized in various dimensions, by variety, by type of product, and into commercial and non-commercial (food-aid) imports. Each is discussed briefly below.
Wheat imports by variety
The two main types of wheat consumed in Ethiopia are bread wheat and durum wheat. Bread wheat is softer, has a lower protein content, and is suitable for making various types of bread products. Durum wheat is harder, with a higher protein content, and is used primarily in the production of pasta. The United National Commodity Trade Statistics Database (UN Comtrade)
0
200
400
600
800
1000
1200
1400
0
500
1000
1500
2000
2500
3000
3500
4000
4500
19
95
/96
19
96
/97
19
97
/98
19
98
/99
19
99
/00
20
00
/01
20
01
/02
20
02
/03
20
03
/04
20
04
/05
20
05
/06
20
06
/07
20
07
/08
20
08
/09
20
09
/10
20
10
/11
20
11
/12
20
12
/13
Import, FSI ('000 mt) Production ('000 mt)
Consumption ('000 mt)
Pro
du
ctio
n a
nd
co
nsu
mp
tio
n (
in m
t)Im
po
rt (Iin m
t)

Wheat in Ethiopia Page 38
provides bilateral trade statistics that distinguish between durum wheat imports and all other wheat imports, though the latter category is almost exclusively bread wheat. As shown in Table 19, durum wheat accounts for 50-80% of wheat imports in most years. One reason for this imbalance is most of the wheat grown in Ethiopia is bread wheat, yet the demand for pasta is growing more rapidly than the demand for other wheat products.
Table 21. Quantity and value of wheat imports
Source: UN (2015).
Wheat imports by product
Wheat can be imported in the form of grain or flour. The Food and Agriculture Organization (FAO) provides a breakdown of imports into wheat grain and wheat flour. The overwhelming majority of imports are in the form of wheat grain. While the imports of wheat grain have been over one million tonnes in recent years, wheat flour imports have been less than 10 thousand tonnes in most years over the last decade. Wheat flour imports are somewhat erratic, though, with the quantity spiking to 99 thousand tonnes in 2009 and 46 thousand tonnes in 2011.
Food aid
Wheat imports can also be divided into food aid and commercial imports. Food aid includes food donated by individual countries, particularly the United States, and international organizations, mainly the World Food Programme (WFP). In Ethiopia, food aid is used for emergency assistance for refugees from Somalia, Eritrea, and South Sudan who live in camps in Ethiopia. As described earlier, the Ethiopian Emergency Food Security Reserve Administration (EFSRA) maintains a stock of wheat and other grains. Government agencies and international relief agencies, such as the World Food Programme and CARE, can “borrow” from the reserve for rapid-response distribution with the understanding that they will replace the grain at a later time by importing grain or procuring it locally (Rashid and Lemma, 2011).
Quantity of imported wheat Value of imported wheat
(million tonnes) (million US$)
Durum Other Total Durum Other Total
1998 0.18 0.04 0.22 38.6 9.1 47.6
1999 0.28 0.04 0.33 63.7 9.7 73.4
2000 0.06 0.04 0.11 9.6 8.4 18.1
2001 0.31 0.45 0.76 47.6 88.8 136.4
2002 0.21 0.22 0.44 52.8 54.3 107.1
2003 0.88 0.73 1.60 188.7 174.0 362.8
2004 0.41 0.16 0.58 120.1 56.8 176.9
2005 0.73 0.13 0.86 187.5 37.3 224.8
2006 0.18 0.15 0.33 44.1 39.7 83.8
2007 0.20 0.19 0.38 58.3 75.7 134.0
2008 0.82 0.28 1.10 338.2 127.0 465.2
2009 0.80 0.31 1.11 220.3 101.3 321.6
2010 0.89 0.16 1.05 251.7 52.6 304.3
2011 0.60 0.48 1.08 224.0 178.6 402.6
2012 0.51 0.50 1.01 187.6 145.3 333.0
2013 0.51 0.88 1.39 211.5 316.1 527.6

Wheat in Ethiopia Page 39
In addition, food aid is used in the Ethiopian Productive Safety Nets Programme (PSNP), in which assistance is provided either in cash or in food to targeted households in selected woredas (see Box 2). Although food aid includes wheat, maize, sorghum, barley, cooking oil, sugar, and other food items, the bulk of the total is wheat and wheat flour.
Box 2. Productive Safety Nets Programme
Figure 12 shows the volume of wheat and wheat flour delivered to Ethiopia in the form of food aid over time. The volatility in food aid deliveries is largely a reflection of annual changes in rainfall and the size of the domestic harvest. In general, food aid represents 30-60% of total wheat imports in Ethiopia.
The Productive Safety Nets Programme (PSNP) was launched in 2005 to convert traditional food aid assistance into a tool for helping poor households escape poverty through the accumulation of human and physical capita. The PSNP provides assistance to 7 million poor households living in 290 food insecure woredas. Beneficiaries are assured a predictable supply of assistance over a number of years. The PSNP provides 50-65% of the assistance in the form of cash, distributing food only in woredas where food markets might not work well. In 2009, the PSNP transferred 2.1 billion birr and 457 thousand tonnes of food, equivalent to US$ 360 million or 1.2% of the gross domestic product of Ethiopia. Able-bodied beneficiaries are required to participate in labor-intensive public works to development local infrastructure. Some beneficiaries, primarily the elder and disabled, are exempted from this requirement (World Bank, 2011).
Evaluations of the PSNP suggest that the benefits are relatively well targeted to the poor, though the targeting effectiveness varies by region. Beneficiaries report shorter periods of food shortages and higher caloric intake, particularly those affected by drought. Furthermore, the wheat and maize production increased more in PSNP woredas than elsewhere, perhaps because the cash disbursements created demand for food grains. Finally, the administrative costs of the program are about 17% of the total, lower than in many public safety net programs in developing countries (World Bank, 2011; Coll-Black et al, 2011)

Wheat in Ethiopia Page 40
Figure 12. Wheat and wheat flour delivered to Ethiopia as food aid
Source: WFP (2015).
Commercial wheat imports
Commercial wheat imports refer to wheat that is purchased on international markets. As discussed above, in the late 1990s, private traders entered the market and organized almost all commercial imports of wheat. This changed in 2008 as a result of two related events. First, the domestic price of wheat and other grains rose significantly over 2006-08, prompting a debate about the causes of the price increases (see Alemu, et al, 2008) and pressure on the government to take action to stabilize prices. Second, the sharp increase in the international price of oil in 2007 resulted in a significant drain on foreign reserves. Rather than let the birr depreciate, the government decided to manage the disequilibrium by rationing foreign exchange. Private wheat importers found it increasing difficult to access the foreign currency needed to import wheat.
In response to these two events, the Ethiopian Grain Trading Enterprise (EGTE) began importing wheat in 2008. The wheat imported by EGTE is sold at a subsidized price to large-scale millers. These millers must agree to sell the wheat flour at an administratively-determined subsidized price to bakeries. The bakeries in turn are obligated to produce bread and sell it at administratively-determined subsidized prices to the public. In 2014-15, the EGTE sold imported wheat to selected millers at US$ 275 per tonne, and these millers are required to sell the flour at US$ 398 per tonne to selected bakeries. These bakeries are then obligated to sell bread from this flour at US$ 0.07 per 100 grammes (USDA, 2014).
According to the USDA (2014), the distribution of wheat imported by the EGTE is seasonal, with most of the wheat being delivered between May and October, the six months prior to the
0.00
0.20
0.40
0.60
0.80
1.00
1.20
1.40
1.60
19
88
19
89
19
90
19
91
19
92
19
93
19
94
19
95
19
96
19
97
19
98
19
99
20
00
20
01
20
02
20
03
20
04
20
05
20
06
20
07
20
08
20
09
20
10
20
11
20
12
20
13
Mill
ion
to
nn
es

Wheat in Ethiopia Page 41
beginning of the meher wheat harvest. This dampens the seasonality of wheat prices in Ethiopia and reduces the cost of the wheat import subsidies. On the other hand, EGTE sources report that the wheat shipments to the millers do not vary by month. Since these shipments include domestically-sourced wheat as well as imports, it is possible that the shipments contain mostly imported wheat in the off season and local wheat after the harvest.
There are an estimated 650 large-scale flour mills in Ethiopia, of which about one third purchase subsidized imported wheat from the EGTE. Table 22 shows the distribution of EGTE wheat by region. Addis Ababa and Oromia are the two largest recipients of EGTE wheat, together accounting for almost half of the total. The total number of millers receiving EGTE wheat is 205.
Table 22. Distribution of EGTE wheat to millers
Region Number
of millers EGTE sales
(quintals/month) Percent of sales
Addis Ababa 37 128,622 27.3
SNNP 54 69,802 14.8
Tigray 17 57,754 12.3
Amhara 26 63,000 13.4
Oromia 58 100,265 21.3
Somalia 3 5,837 1.2
Dire Dawa 3 13,514 2.9
Gambela 3 18,000 3.8
Benishangul 1 6,088 1.3
Afar 3 2,500 0.5
Harari 0 5,308 1.1
Total 205 470,690 100.0 Source: EGTE, 2015.
Private traders have been almost entirely squeezed out of the wheat import market. Although private sector imports are legal, it is difficult for traders to obtain foreign currency to purchase imports. Even if they were able to access foreign currency, they would not be able to compete with the subsidized price at which EGTE sells wheat.
3.4 Consumption of wheat and wheat products
Wheat is consumed in a variety of products in Ethiopia, including bread, porridge (genfo), roasted grain (kolo) boiled grain (nifro), pasta, local beer (tela), and different confectionary products. Rural households tend to consume wheat from their own production or to purchase wheat grain, both of which they have ground at small-scale mills throughout rural areas. Urban household also purchase large quantities of wheat grain, but wheat flour is also available. Higher income households purchase bread and pasta, which are more expensive but also save time in preparation. The demand for bread and pasta is small but growing quickly as a results of rising incomes and urbanization.

Wheat in Ethiopia Page 42
3.4.1 Patterns in Ethiopian wheat consumption
On average, Ethiopians consume about 32 kilogrammes of wheat per person per year, including the wheat equivalent of bread and other wheat products. According to the food balance sheets of the FAO (2014), wheat is third in the quantity of consumption among foods in Ethiopia, after enset (51 kg/person) and maize (43 kg/person) (see Table 23). Wheat accounts for 14% of the total caloric intake, placing it second after maize and slightly ahead of teff, sorghum, and enset (10-12% each).
Two caveats need to be mentioned regarding these estimates. First, the contribution of each food varies from year to year depending on the size of the harvest. Since wheat is imported and a major component of food aid, it can serve as a shock absorber, with an increased share due to imports in years when the harvest is below average. Second, as discussed in section 2.2, there seem to be a discrepancy between production, import, and consumption figures, in which production plus imports exceed apparent consumption by roughly 1 million tonnes. The FAO consumption estimates are quite similar to (and probably based on) estimates from the Ethiopian Household Income, Consumption, and Expenditure (HICE) Survey, carried out in 2011. The FAO food balance tables reconcile this discrepancy by allocating 1.1 million tonnes of wheat to “other uses” (other than food, feed, seed, manufacturing use, and losses). We proceed to interpret the consumption patterns in the HICE data, while recognizing that wheat production is over-estimated and/or wheat consumption is under-estimated.
Table 23. Staple foods and their contribution to the Ethiopian diet (2011)
Commodity Consumption (kg/person/year)
Caloric contribution (kcal/person/day)
Share of caloric contribution (%)
Wheat & products 32 288 14% Barley & products 14 117 6% Maize & products 43 405 19% Sorghum & products 25 213 10% Teff (1) 27 262 12% Enset (2) 51 211 10% Pulses 19 176 8% Other foods 433 21% Total 2,105 100% Source: FAO Food Balance Sheet (FAO, 2014) (1) Listed as “Other cereals” in FAO data. (2) Listed as “Other roots” in FAO data.
The HICE Survey data allow us to examine the patterns in wheat consumption among different types of households in Ethiopia. As shown in Table 24, wheat and wheat products are consumed by almost all urban households (90% in cities and 84% in towns), but only half of rural households. Not surprisingly, per capita wheat consumption is higher in cities (40 kg) and towns (39 kg) than in rural areas (30 kg). This is probably a reflection of the fact that wheat is a relatively expensive source of calories and that incomes are generally higher in urban than rural areas. It is worth noting that the share of the budget allocated to wheat and wheat products is lower in cities (4.2%) than in rural areas (6.5%), reflecting the higher incomes in urban areas.

Wheat in Ethiopia Page 43
Across the regions, Tigray has the highest level of per capita wheat consumption (58 kg). This is because a relatively large share of households consume wheat (69%) and because wheat consumption among those households is relatively high (84 kg per person). In addition, the share of household budgets spent on wheat in Tigray is 8.2%, the highest among the regions of Ethiopia. In contrast, SNNP has the lowest level of wheat consumption, 14 kg per capita. Again, this is a combination of the small percentage of households consuming wheat (43%) and the low level of consumption among them (33 kg per capita). The availability of enset and maize in SNNP probably explains the low level of wheat consumption. Amhara and Oromia lie in between these extremes, with consumption levels of 27 and 37 kg per capita, respectively.
Female-headed households consume somewhat more wheat than male-headed households (36 kg compared to 31 kg per capita), though this may be related to differences in geographic distribution or other factors, rather than gender per se.
Table 24. Consumption of wheat by type of household
Household category
% of household
in category
% of households consuming
wheat products
Quantity of wheat consumed
Value of wheat consumed
% share in the total value of
consumption
All households
Consuming households
All households
Consuming households
(Kg/Person/Year) (ETB/Person/Year)
Location Cities 8 90 40 44 332 367 4.2 Towns 14 84 39 47 264 315 4.0 Rural 78 52 30 57 149 287 6.5 Region Tigray 6 69 58 84 275 397 8.2 Amhara 26 55 27 49 143 262 5.5 Oromia 38 64 37 57 199 310 5.9 SNNP 20 43 14 33 90 208 4.2 Other 9 81 46 56 332 407 6.1 Sex of head Male 75 59 31 51 172 289 5.6 Female 25 60 36 60 204 341 6.1 Income quintile Poorest 20 41 15 36 70 168 7.7
2nd 20 51 24 46 116 229 6.9
3rd 20 58 34 58 167 287 6.6
4th 20 68 40 59 222 326 5.5
Richest 20 79 47 60 324 411 3.5 Ethiopia 100 59 32 54 180 302 5.7
Source: Authors’ analysis of the 2009-10 Household Income, Consumption and Expenditure Survey.
Finally, the table highlights differences in wheat consumption across income groups. Per capita wheat consumption rises steadily from 15 kg per capita in the first (poorest) quintile to 47 kg per capita in the fifth (richest) quintile. This is caused by a rising share of households consuming wheat, as well as an increasing quantities among wheat consumers. Although the quantity and value of wheat consumption rises with income, the share of the budget allocated
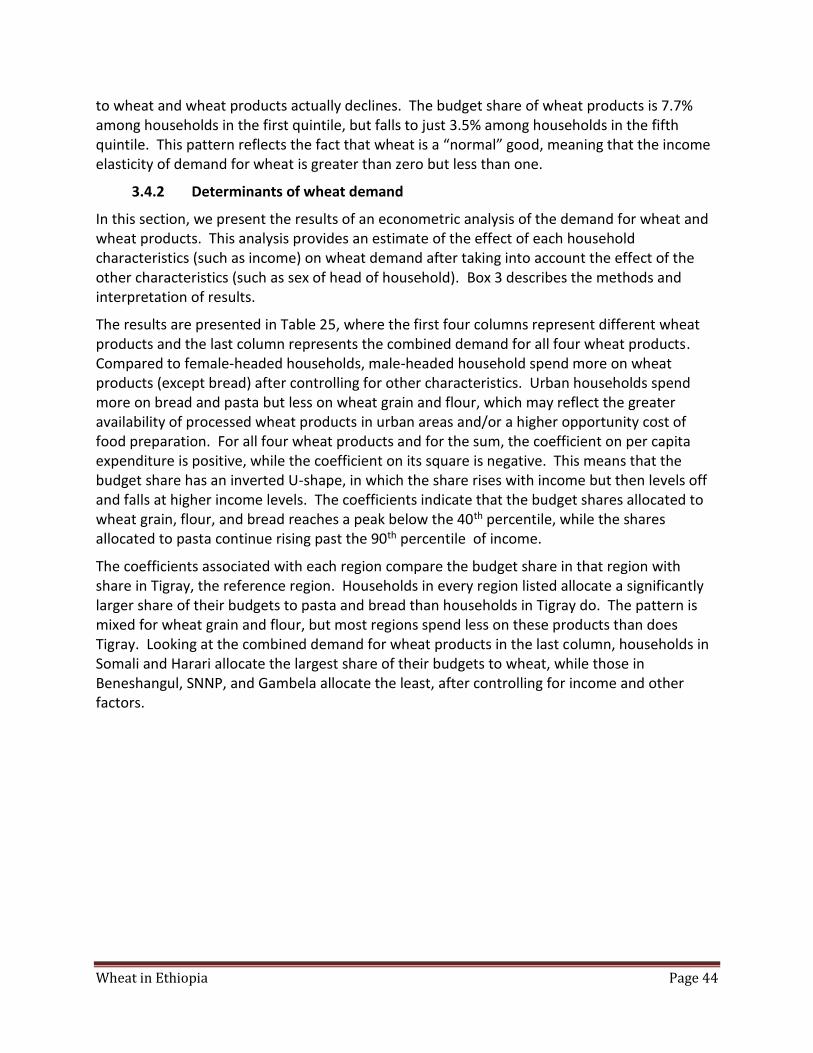
Wheat in Ethiopia Page 44
to wheat and wheat products actually declines. The budget share of wheat products is 7.7% among households in the first quintile, but falls to just 3.5% among households in the fifth quintile. This pattern reflects the fact that wheat is a “normal” good, meaning that the income elasticity of demand for wheat is greater than zero but less than one.
3.4.2 Determinants of wheat demand
In this section, we present the results of an econometric analysis of the demand for wheat and wheat products. This analysis provides an estimate of the effect of each household characteristics (such as income) on wheat demand after taking into account the effect of the other characteristics (such as sex of head of household). Box 3 describes the methods and interpretation of results.
The results are presented in Table 25, where the first four columns represent different wheat products and the last column represents the combined demand for all four wheat products. Compared to female-headed households, male-headed household spend more on wheat products (except bread) after controlling for other characteristics. Urban households spend more on bread and pasta but less on wheat grain and flour, which may reflect the greater availability of processed wheat products in urban areas and/or a higher opportunity cost of food preparation. For all four wheat products and for the sum, the coefficient on per capita expenditure is positive, while the coefficient on its square is negative. This means that the budget share has an inverted U-shape, in which the share rises with income but then levels off and falls at higher income levels. The coefficients indicate that the budget shares allocated to wheat grain, flour, and bread reaches a peak below the 40th percentile, while the shares allocated to pasta continue rising past the 90th percentile of income.
The coefficients associated with each region compare the budget share in that region with share in Tigray, the reference region. Households in every region listed allocate a significantly larger share of their budgets to pasta and bread than households in Tigray do. The pattern is mixed for wheat grain and flour, but most regions spend less on these products than does Tigray. Looking at the combined demand for wheat products in the last column, households in Somali and Harari allocate the largest share of their budgets to wheat, while those in Beneshangul, SNNP, and Gambela allocate the least, after controlling for income and other factors.
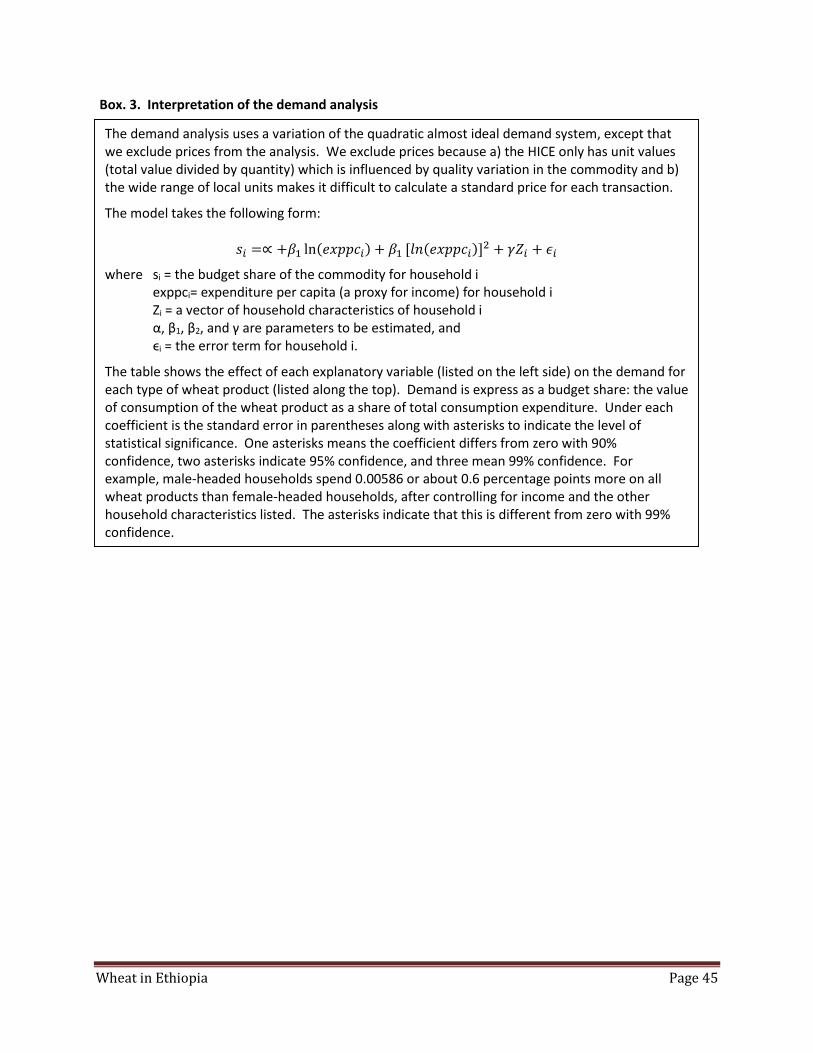
Wheat in Ethiopia Page 45
Box. 3. Interpretation of the demand analysis
The demand analysis uses a variation of the quadratic almost ideal demand system, except that we exclude prices from the analysis. We exclude prices because a) the HICE only has unit values (total value divided by quantity) which is influenced by quality variation in the commodity and b) the wide range of local units makes it difficult to calculate a standard price for each transaction.
The model takes the following form:
𝑠𝑖 =∝ +𝛽1 ln(𝑒𝑥𝑝𝑝𝑐𝑖) + 𝛽1 [𝑙𝑛(𝑒𝑥𝑝𝑝𝑐𝑖)]2 + 𝛾𝑍𝑖 + 𝜖𝑖
where si = the budget share of the commodity for household i exppci= expenditure per capita (a proxy for income) for household i Zi = a vector of household characteristics of household i α, β1, β2, and γ are parameters to be estimated, and ϵi = the error term for household i.
The table shows the effect of each explanatory variable (listed on the left side) on the demand for each type of wheat product (listed along the top). Demand is express as a budget share: the value of consumption of the wheat product as a share of total consumption expenditure. Under each coefficient is the standard error in parentheses along with asterisks to indicate the level of statistical significance. One asterisks means the coefficient differs from zero with 90% confidence, two asterisks indicate 95% confidence, and three mean 99% confidence. For example, male-headed households spend 0.00586 or about 0.6 percentage points more on all wheat products than female-headed households, after controlling for income and the other household characteristics listed. The asterisks indicate that this is different from zero with 99% confidence.
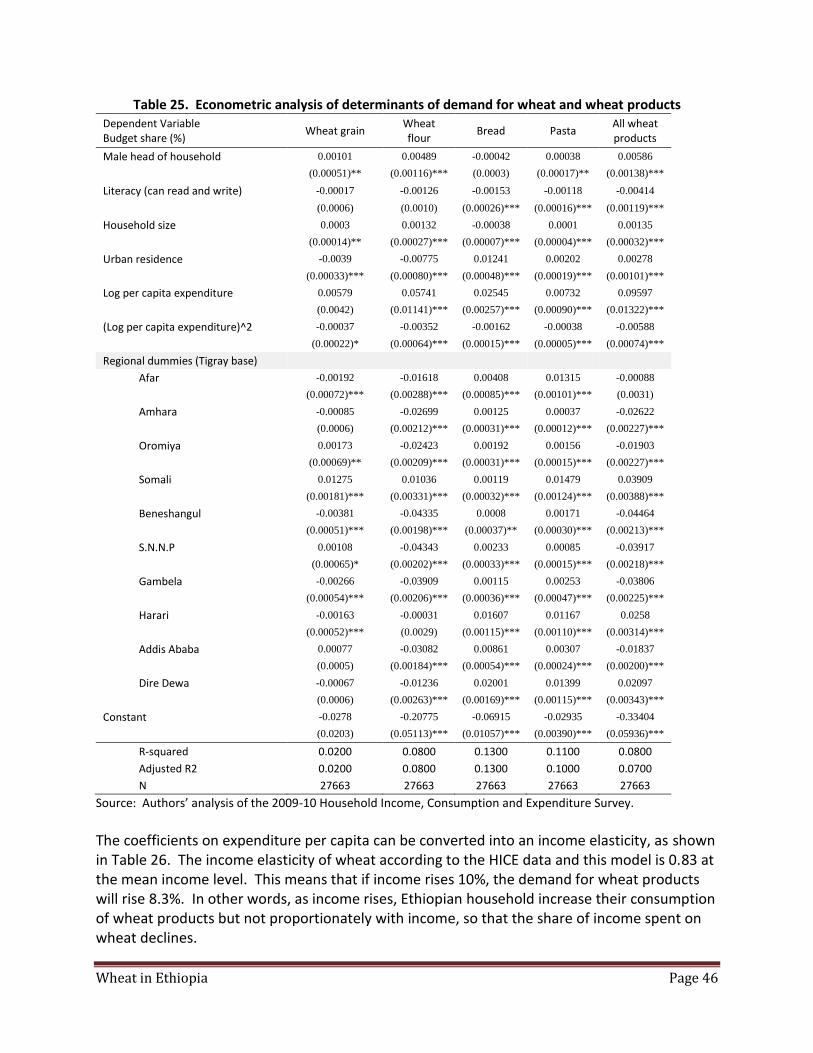
Wheat in Ethiopia Page 46
Table 25. Econometric analysis of determinants of demand for wheat and wheat products Dependent Variable Budget share (%)
Wheat grain Wheat flour
Bread Pasta All wheat products
Male head of household 0.00101 0.00489 -0.00042 0.00038 0.00586
(0.00051)** (0.00116)*** (0.0003) (0.00017)** (0.00138)***
Literacy (can read and write) -0.00017 -0.00126 -0.00153 -0.00118 -0.00414
(0.0006) (0.0010) (0.00026)*** (0.00016)*** (0.00119)***
Household size 0.0003 0.00132 -0.00038 0.0001 0.00135
(0.00014)** (0.00027)*** (0.00007)*** (0.00004)*** (0.00032)***
Urban residence -0.0039 -0.00775 0.01241 0.00202 0.00278
(0.00033)*** (0.00080)*** (0.00048)*** (0.00019)*** (0.00101)***
Log per capita expenditure 0.00579 0.05741 0.02545 0.00732 0.09597
(0.0042) (0.01141)*** (0.00257)*** (0.00090)*** (0.01322)***
(Log per capita expenditure)^2 -0.00037 -0.00352 -0.00162 -0.00038 -0.00588
(0.00022)* (0.00064)*** (0.00015)*** (0.00005)*** (0.00074)***
Regional dummies (Tigray base)
Afar -0.00192 -0.01618 0.00408 0.01315 -0.00088
(0.00072)*** (0.00288)*** (0.00085)*** (0.00101)*** (0.0031)
Amhara -0.00085 -0.02699 0.00125 0.00037 -0.02622
(0.0006) (0.00212)*** (0.00031)*** (0.00012)*** (0.00227)***
Oromiya 0.00173 -0.02423 0.00192 0.00156 -0.01903
(0.00069)** (0.00209)*** (0.00031)*** (0.00015)*** (0.00227)***
Somali 0.01275 0.01036 0.00119 0.01479 0.03909
(0.00181)*** (0.00331)*** (0.00032)*** (0.00124)*** (0.00388)***
Beneshangul -0.00381 -0.04335 0.0008 0.00171 -0.04464
(0.00051)*** (0.00198)*** (0.00037)** (0.00030)*** (0.00213)***
S.N.N.P 0.00108 -0.04343 0.00233 0.00085 -0.03917
(0.00065)* (0.00202)*** (0.00033)*** (0.00015)*** (0.00218)***
Gambela -0.00266 -0.03909 0.00115 0.00253 -0.03806
(0.00054)*** (0.00206)*** (0.00036)*** (0.00047)*** (0.00225)***
Harari -0.00163 -0.00031 0.01607 0.01167 0.0258
(0.00052)*** (0.0029) (0.00115)*** (0.00110)*** (0.00314)***
Addis Ababa 0.00077 -0.03082 0.00861 0.00307 -0.01837
(0.0005) (0.00184)*** (0.00054)*** (0.00024)*** (0.00200)***
Dire Dewa -0.00067 -0.01236 0.02001 0.01399 0.02097
(0.0006) (0.00263)*** (0.00169)*** (0.00115)*** (0.00343)***
Constant -0.0278 -0.20775 -0.06915 -0.02935 -0.33404
(0.0203) (0.05113)*** (0.01057)*** (0.00390)*** (0.05936)***
R-squared 0.0200 0.0800 0.1300 0.1100 0.0800
Adjusted R2 0.0200 0.0800 0.1300 0.1000 0.0700
N 27663 27663 27663 27663 27663
Source: Authors’ analysis of the 2009-10 Household Income, Consumption and Expenditure Survey. The coefficients on expenditure per capita can be converted into an income elasticity, as shown in Table 26. The income elasticity of wheat according to the HICE data and this model is 0.83 at the mean income level. This means that if income rises 10%, the demand for wheat products will rise 8.3%. In other words, as income rises, Ethiopian household increase their consumption of wheat products but not proportionately with income, so that the share of income spent on wheat declines.

Wheat in Ethiopia Page 47
Table 26. Income elasticity of different wheat products
Wheat grain
Wheat flour
Bread Pasta All wheat products
Average budget share (%) 0.480 2.21 0.52 0.21 3.5
Income elasticity of demand 0.87 0.83 0.49 1.34 0.83
Source: Authors’ analysis of the 2009-10 Household Income, Consumption and Expenditure Survey
This elasticity confirms the status of wheat as a preferred staple. The income elasticity of less preferred staples (such as maize and sorghum) is generally less than 0.5, while the elasticity of eggs, meat, and dairy products is often close to or greater than 1.0. Assuming 2.6% population growth and 6% growth in per capita income, the demand for wheat products can be expected to rise at 7.7% per year.
The income elasticity of pasta is 1.34, indicating that it is a “luxury” good for which the quantity purchased and the budget share rise with higher incomes. This is not surprising given that pasta is a more processed wheat product, so it is both more expensive as a source of calories and more convenient in terms of preparation time. Using the same assumptions as above, the demand for pasta can be expected to grow at 10.7% per year.
The income elasticity of wheat grain and wheat flour are similar to the elasticity of all wheat products, which is to be expected given the large share of wheat that is acquired in the form of wheat flour. The only surprising result is the income elasticity of bread, which is estimated at 0.49. Like pasta, bread is more expensive but more convenient than grain and flour, so we would expect the elasticity to be greater than that of grain or flour.
3.4.3 Ethiopian wheat consumption in international context
In the international context, Ethiopian wheat consumption is higher than that of many countries in sub-Saharan Africa, such as Nigeria, Ghana, and Uganda, but about half the world average of 65 kg per capita (see Figure 23). The Africa-wide average wheat consumption is about 50 kg per capita, boosted by the high levels of wheat consumption in South Africa and the North African countries.
Globally, wheat consumption is declining slowly over time, as middle-income countries diversify their diets away from staple grains and toward fruits, vegetables, meat, fish, and dairy products. However, within sub-Saharan Africa, several countries are experiencing rising wheat consumption as more consumers are able to afford bread and wheat flour, which is convenient but more costly than locally-produced maize, sorghum, and cassava. Uganda, Ghana, Kenya, and Nigeria have all seen rising wheat consumption over the last decade. Wheat consumption in Ethiopia has been higher but more stable than in these countries. Since 2000, Ethiopian wheat consumption has remained in the range of 31-36 kg per capita (see Figure 14).

Wheat in Ethiopia Page 48
Figure 13. Wheat consumption in selected countries over 1995-2011 (kg/capita/year)
Source: FAO Food Balance Sheets (FAO, 2014) (http://faostat3.fao.org/download/FB/FBS/E)
3.5 Impact of the wheat import subsidy policy
What is the impact of the wheat import subsidy policy on consumers, producers, and the Ethiopian government? This section provides a summary of the main impacts. Our estimates are based on the year 2014, but it is useful to keep in mind that the distributional impact of the policy changes from year to year, depending on international prices, domestic production, and the details of the subsidy policy that year.
Table 27 shows the cost of EGTE wheat imports in 2014. The CIF value of wheat in Djibouti was US$340/tonne. The cost of transporting the wheat to a warehouse in Addis Ababa is US$73/tonne, including clearing it through customs, transporting to Addis, and unloading it into a warehouse. Thus, the import parity price of wheat in Addis is US$ 413 per tonne without subsidy. However, in 2014, the EGTE sold wheat to millers at a price of 550 ETB/quintal or US$ 280/tonne. This implies that the value of the subsidy is US$ 133/tonne or 32% of the unsubsidized import parity price in Addis.
0.0
10.0
20.0
30.0
40.0
50.0
60.0
70.0
80.0
19
95
19
96
19
97
19
98
19
99
20
00
20
01
20
02
20
03
20
04
20
05
20
06
20
07
20
08
20
09
20
10
20
11
Ethiopia
Kenya
Uganda
South Africa
Ghana
Nigeria
Eastern Africa
Africa
World
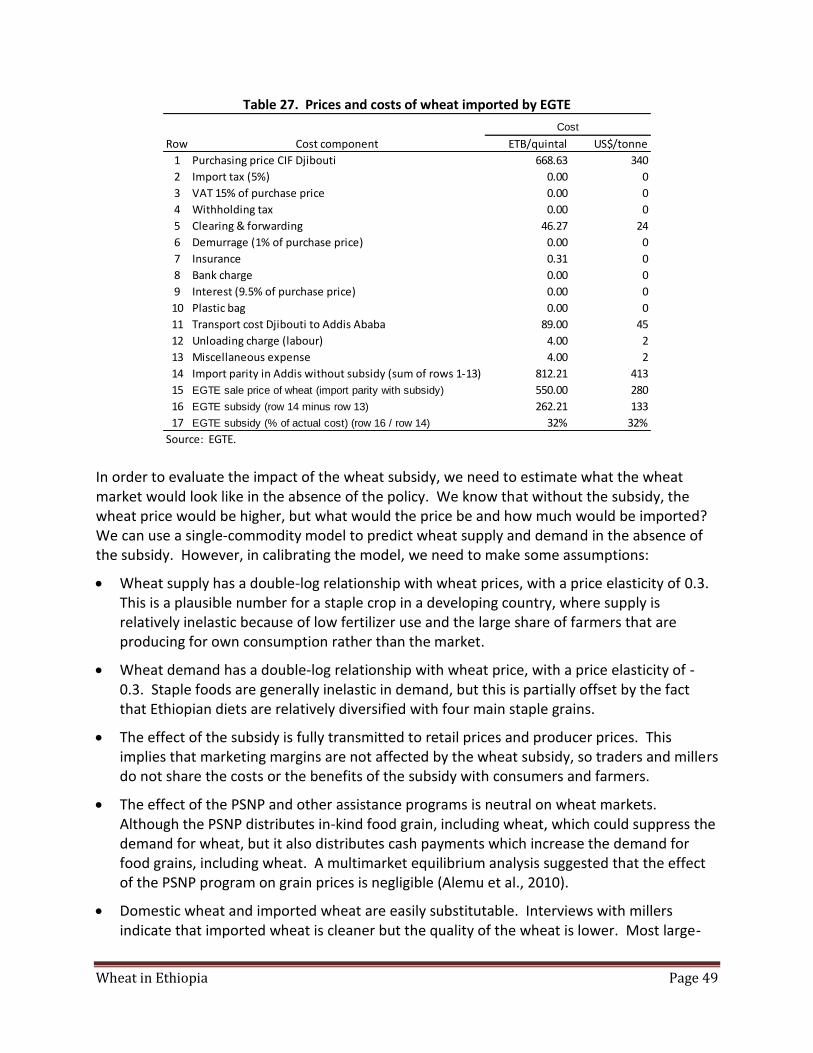
Wheat in Ethiopia Page 49
Table 27. Prices and costs of wheat imported by EGTE
In order to evaluate the impact of the wheat subsidy, we need to estimate what the wheat market would look like in the absence of the policy. We know that without the subsidy, the wheat price would be higher, but what would the price be and how much would be imported? We can use a single-commodity model to predict wheat supply and demand in the absence of the subsidy. However, in calibrating the model, we need to make some assumptions:
Wheat supply has a double-log relationship with wheat prices, with a price elasticity of 0.3. This is a plausible number for a staple crop in a developing country, where supply is relatively inelastic because of low fertilizer use and the large share of farmers that are producing for own consumption rather than the market.
Wheat demand has a double-log relationship with wheat price, with a price elasticity of -0.3. Staple foods are generally inelastic in demand, but this is partially offset by the fact that Ethiopian diets are relatively diversified with four main staple grains.
The effect of the subsidy is fully transmitted to retail prices and producer prices. This implies that marketing margins are not affected by the wheat subsidy, so traders and millers do not share the costs or the benefits of the subsidy with consumers and farmers.
The effect of the PSNP and other assistance programs is neutral on wheat markets. Although the PSNP distributes in-kind food grain, including wheat, which could suppress the demand for wheat, but it also distributes cash payments which increase the demand for food grains, including wheat. A multimarket equilibrium analysis suggested that the effect of the PSNP program on grain prices is negligible (Alemu et al., 2010).
Domestic wheat and imported wheat are easily substitutable. Interviews with millers indicate that imported wheat is cleaner but the quality of the wheat is lower. Most large-
Row Cost component ETB/quintal US$/tonne
1 Purchasing price CIF Djibouti 668.63 340
2 Import tax (5%) 0.00 0
3 VAT 15% of purchase price 0.00 0
4 Withholding tax 0.00 0
5 Clearing & forwarding 46.27 24
6 Demurrage (1% of purchase price) 0.00 0
7 Insurance 0.31 0
8 Bank charge 0.00 0
9 Interest (9.5% of purchase price) 0.00 0
10 Plastic bag 0.00 0
11 Transport cost Djibouti to Addis Ababa 89.00 45
12 Unloading charge (labour) 4.00 2
13 Miscellaneous expense 4.00 2
14 Import parity in Addis without subsidy (sum of rows 1-13) 812.21 413
15 EGTE sale price of wheat (import parity with subsidy) 550.00 280
16 EGTE subsidy (row 14 minus row 13) 262.21 133
17 EGTE subsidy (% of actual cost) (row 16 / row 14) 32% 32%
Source: EGTE.
Cost
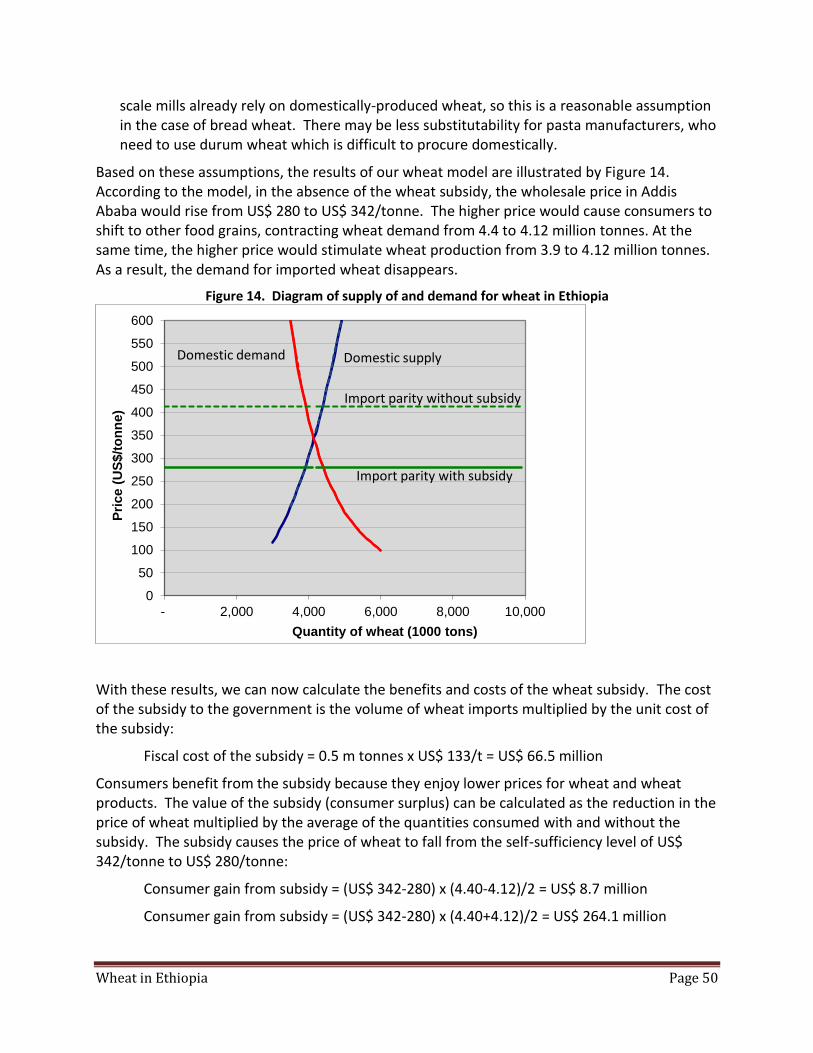
Wheat in Ethiopia Page 50
scale mills already rely on domestically-produced wheat, so this is a reasonable assumption in the case of bread wheat. There may be less substitutability for pasta manufacturers, who need to use durum wheat which is difficult to procure domestically.
Based on these assumptions, the results of our wheat model are illustrated by Figure 14. According to the model, in the absence of the wheat subsidy, the wholesale price in Addis Ababa would rise from US$ 280 to US$ 342/tonne. The higher price would cause consumers to shift to other food grains, contracting wheat demand from 4.4 to 4.12 million tonnes. At the same time, the higher price would stimulate wheat production from 3.9 to 4.12 million tonnes. As a result, the demand for imported wheat disappears.
Figure 14. Diagram of supply of and demand for wheat in Ethiopia
With these results, we can now calculate the benefits and costs of the wheat subsidy. The cost of the subsidy to the government is the volume of wheat imports multiplied by the unit cost of the subsidy:
Fiscal cost of the subsidy = 0.5 m tonnes x US$ 133/t = US$ 66.5 million
Consumers benefit from the subsidy because they enjoy lower prices for wheat and wheat products. The value of the subsidy (consumer surplus) can be calculated as the reduction in the price of wheat multiplied by the average of the quantities consumed with and without the subsidy. The subsidy causes the price of wheat to fall from the self-sufficiency level of US$ 342/tonne to US$ 280/tonne:
Consumer gain from subsidy = (US$ 342-280) x (4.40-4.12)/2 = US$ 8.7 million
Consumer gain from subsidy = (US$ 342-280) x (4.40+4.12)/2 = US$ 264.1 million
0
50
100
150
200
250
300
350
400
450
500
550
600
- 2,000 4,000 6,000 8,000 10,000
Pri
ce (
US
$/t
on
ne)
Quantity of wheat (1000 tons)
Domestic supply
Import parity with subsidy
Domestic demand
Import parity without subsidy

Wheat in Ethiopia Page 51
The subsidy has a negative effect on farmers because it lowers the price of wheat. The cost of this to farmers (producer surplus) can be calculated as the change in the price of wheat multiplied by the average of the quantities produced with and without the subsidy:
Farmer loss from the subsidy = (US$ 342-280) x (4.12-3.90)/2 = US$ 6.8 million
Farmer loss from the subsidy = (US$ 342-280) x (4.12+3.90)/2 = US$ 248.6 million
Thus, the wheat subsidy policy incurs costs of US$ 65.5+248.6 = 314.1 million to the government and to farmers in order to deliver US$ 264.1 million in benefits for wheat consumers. This means the benefit cost ratio is 0.84:1; for every 100 birr in costs to the government and farmers, consumers receive benefits of 84 birr.
Typically, taxes or subsidies have benefit-cost ratios that are less than 1.0 because they introduce a distortion into the market. However, in this case an additional factor is at work: it takes a US$ 133/tonne subsidy to reduce the price of wheat by US$ 62/tonne. The first US$ 71/tonne of the subsidy have no effect because they are not sufficient to make wheat imports competitive. Only with the 72nd dollar of subsidy do imports begin and the policy begins to reduce the domestic price.
What is the distribution of gains and losses among farmers and among consumers? With regard to wheat producers, survey data indicates that 60% of wheat farmers do not sell any wheat, so they would not be affected by the lower price associated with the wheat subsidy. Among the 40% of wheat farmers who do sell wheat, sales are concentrated among the larger farmers (those with more than 2 hectares) and farmers in the top expenditure quintile.
Regarding consumers, we do not have quantitative information on which households purchase bread made with EGTE-imported wheat, but we know that the wheat is distributed to large-scale mills located in the major cities of Ethiopia. Within each city, the subsidized bread is available at shops throughout the city, so it is reasonable to assume that the benefits are distributed among urban households roughly in proportion to their consumption of bread. Given that urban incomes are higher than the average income in Ethiopia, it does not seem that the benefits of the wheat subsidy are focused on low-income households.
A more detailed analysis of survey data and some additional assumptions would be necessary to estimate the detailed distributional impact, such as the effect of the wheat subsidy on the overall incidence of poverty. However, based on our preliminary analysis, it seems that the wheat subsidy policy redistributes income from taxpayers and larger wheat farmers to urban households. However, the value of benefits to consumers is just 84% of the cost to farmers and tax-payers.
In addition, it should be noted that this analysis is based on the prices and import quantities that prevailed in 2014. The cost of the subsidy and the benefit-cost ratio will vary depending on international prices, the subsidized wheat price, and the volume of EGTE imports, which vary from year to year.

Wheat in Ethiopia Page 52
4 Summary and recommendations
4.1 Summary
Wheat is one of the four most important food grains in Ethiopia. As a source of calories in the diet, wheat is second to maize. In terms of the area of production, wheat is fourth, after teff, maize, and sorghum. In terms of the value of production, it is 4th or 5th, after teff, enset, and maize, and approximately tied with sorghum.
Wheat production has expanded rapidly in the past decade. According to the CSA, wheat production has grown at 7.5% per year since 1995-96 and at 9.3% over the past decade.
The expansion of wheat area and higher yields have each contributed roughly equally to this growth. Since 1994-95, wheat yields have doubled, rising from 1.2 tonnes/hectare to 2.4 tonnes/hectare. This represents an average growth rate of 3.9%, slightly more than the rate of wheat area expansion over this period.
However, large discrepancies between wheat production and consumption estimates need to be resolved. One discrepancy is the estimated volume of wheat production and imports is 1.6 million tonnes larger than what can be accounted for by human consumption, seed, feed, industrial uses, and losses. Another issue is that official wheat yield estimates are 15-30% greater than yield estimates from other sources.
Wheat production occurs throughout the central highlands of Ethiopia, but is concentrated in a few zones. Just six zones account for more than half of Ethiopian wheat production: Arsi, Bale, West Arsi, East Gojjam, East Shewa, and South Wello.
Wheat farms are numerous, but most are quite small. The Agricultural Sample Survey (AgSS) estimates that there are 4.7 million wheat farms, but the average size is just 0.34 hectares.
Almost three-quarters of wheat area is fertilized. According to the AgSS, 73% of wheat area is fertilized, up from 54% ten years ago and more than other major cereals. The application rate has increased to 140 kg/fertilized hectare, though this is still less than recommended levels.
Less than 6% of the wheat area is planted with purchased, improved seed. Although it is not necessary to buy new wheat seed every year, this is a very low rate of replacement. Shortage of certified seed is a contributing factor.
One of the most common priorities identified by farmers is to increase the quantity and quality of improved wheat seed available. This is a particular source of concern given the threats posed by yellow rust and stem rust, to which many of the most widely used varieties are susceptible.
The use of mechanization and irrigation in wheat production is very rare. Less than 1% of wheat area in Ethiopia is irrigated, and less than 1% of the wheat plots are cultivated with tractors. Almost all wheat plots are ploughed using animal traction.
Total grain storage capacity in Ethiopia is estimated to be 29 million tonnes. The quality of storage ranges widely, from traditional 10-quintal goteras to large-scale warehouses operated by the EGTE.
Wheat in Ethiopia Page 53
The capacity of on-farm grain storage is almost 26 million tonnes, accounting for 89% of the total. Although on-farm storage facilities are small and very simple, there are more than 10 million on them. Surprisingly, farmers report very low (2-4%) storage losses.
A large majority of wheat farmers engage in on-farm storage. According to both the AgSS and the 2012 Baseline Survey, large majorities (80-90%) of wheat farmers had some wheat in storage at the time of the survey. Wheat is retained both for later consumption and for later sale. This contradicts the view that farmers are forced to sell their entire surplus at harvest to meet cash needs.
The role of cooperatives in wheat storage is negligible. According to the 2012 IFPRI-ATA Baseline Survey, just 0.5% of wheat sales went through a cooperative. Almost all wheat sales were directly to traders.
Grain wholesalers report very little long-term wheat storage. During the 2007-08 spike in grain prices, government officials accused traders of speculation and hoarding, and in a few cases stocks were confiscated. As a result, traders remain reluctant to engage in seasonal grain storage or reluctant to report it.
The share of wheat production that is marketed is in the range of 18-25%. The share varies from year to year, being higher after a good harvest.
Most of the marketed surplus is produced by a relatively small number of medium and large farmers. Household surveys suggest that 60% of wheat farmers do not sell any wheat. The top 20% of wheat sellers account for 60% of wheat sales. The marketed surplus ratio is higher for higher-income farmers, farmers with more land, and farmers in SNNP.
The share of wheat sold by growers varies significantly across different types of households. The marketed surplus ratio is positively related to farm size and ownership of equipment and livestock. It is negatively related to distance from roads and the nearest cooperative. And holding other factors constant, it tends to be greatest in SNNP and lowest in Tigray.
The lack of increase in the marketed surplus ratio is mostly (but not entirely) explained by rural population growth and growing demand for wheat by wheat growers. Based on these factors alone, wheat demand among wheat farmers should grow at 7.1% per year. Estimated annual growth in wheat production over the last 10 years is 9.3%.
Wheat surpluses are geographically concentrated. We estimate zone-level market surpluses using HICE consumption data and AgSS production data. Two-thirds of the zone-level surpluses come from just four zones: Bale, Arsi, West Arsi, and East Gojam.
Addis Ababa is represents a relatively small proportion of national wheat demand. Addis Ababa represents the largest deficit area, but accounts for just 12% of the zone-level deficits. Fafan (Somali) and Sidama (SNNP) are the second and third largest “demand sinks”, respectively.
Most of the wheat flows are rural-rural rather than rural-urban. A simplified least-cost analysis of how to distribute surpluses among deficit zones suggests that most of the inter-zonal flows are from one rural area to another rather than from rural areas to cities.
Wheat in Ethiopia Page 54
Small-scale mills account for an estimated 65% of the total milling capacity in Ethiopia. We estimate that there are roughly 29 thousand small-scale mills in Ethiopia with a total capacity of about 15 million tonnes. By contrast, there are 682 large-scale flour factories with a total capacity of 7.9 million tonnes.
Small-scale mills and large-scale flour factories cater to different markets. Small-scale mills serve wheat farmers who wish to mill their own wheat, rural households that buy wheat, and a good number of urban households. Large-scale flour mills purchase imported wheat from EGTE and domestic wheat from traders in order to sell to bakeries and urban wholesalers and retailers.
Ethiopian imports about one million tonnes of wheat each year. This includes food aid and commercial imports by the EGTE, the proportions of each vary widely from year to year.
Food aid, much of which is in the form of wheat, is used for emergency relief and the Productive Safety Net Programme (PSNP). Emergency relief stocks are maintained by the Emergency Food Security Reserve Administration, which can be used by national and international agencies for assistance programs provided they replace the grain later. The PSNP distributes both food and cash to targeted households in selected woredas on a sustained basis.
Commercial wheat imports consist almost entirely of EGTE imports to supply subsidized wheat to selected mills. The EGTE purchases wheat on the international market and distributes it to 205 mills in different cities at subsidized prices. The mills are required to sell the flour to designated bakeries at a controlled price, and the bakeries are required to sell bread at a fixed, below-market price.
Most large-scale mills do not receive subsidized wheat from the EGTE. Data from the Bureau of Investment indicate that there are 682 large-scale flour mills, of which 205 receive EGTE wheat. The other large-scale mills rely entirely on locally-produced wheat.
Wheat plays an important role in the Ethiopian diet. Wheat and wheat products account for 14% of the caloric intake in Ethiopia, making it the second-most important food item after maize.
Wheat consumption varies significantly across types of households. Per capita wheat consumption is greater in cities than rural areas, greater in Tigray than the other main regions, and greater among high-income households than low-income households. In fact, the richest quintile of Ethiopians consumes three times as much on a per capita basis than the poorest quintile.
The share of the budget allocated to wheat and wheat products rises with income among poor households, but begins to fall at middle and higher income levels. This inverted U-shape is also found in other countries. It implies that as Ethiopia gets richer, it will eventually diversify its diet away from wheat and other grains.
At the average income in Ethiopia, the income elasticity of demand for wheat is 0.83. Taking population growth and income growth into account, this suggests that total wheat demand will grow at 7-8% per year. The income elasticity of pasta is higher, suggesting demand growth of more than 10% per year.
Wheat in Ethiopia Page 55
In 2014, the EGTE subsidies of imported wheat are equivalent to 32% of the import parity price in Addis. According to EGTE data, the cost of imported wheat delivered to Addis was US$ 413/tonne, and the price at which EGTE sold the wheat to millers was US$ 280/tonne.
Without the subsidy, commercial wheat imports would not be viable in 2014 and wheat prices would have been 22% higher. Making plausible assumptions about the price elasticity of supply and demand, we estimate that domestic production and consumption would equilibrate at a price of US$ 340/tonne.
The costs of the wheat import subsidy to government and farmers is eight times greater than the benefits that accrue to consumers. The fiscal cost of the subsidy is about US$ 66 million/year, the costs to farmers in the form of lower prices is almost US$ 7 million/year, and the benefits to consumers is less than US$ 9 million/year. One reason for the low benefit-cost ratio is that the subsidy costs US$ 133/tonne (the difference between the import parity price and the subsidized price), but it only reduces the domestic price by US$ 62/tonne (the difference the no-subsidy market price and the current price).
4.2 Recommendations
More resources should be allocated to agronomic research on wheat, particularly the development of rust-resistant varieties. Yellow rust and stem rust threaten the viability of several of the most popular varieties of wheat in Ethiopia. In the short run, there is a need to accelerate the development and release of rust-resistant varieties. In the longer-run, Ethiopia needs to build up its agronomic research capacity to increase the rate of varietal development. International research confirms the high rates of return from investment in crop breeding and other agronomic research.
Priority needs to be given to increasing farmer access to greater quantities of high-quality wheat seed. Wheat farmers report that the quantity and quality of the available seed is a key constraint to increasing yields and reducing pest- and disease-related problems. The Direct Seed Marketing program is a step forward in streamlining the supply channels, but there is also a need to increase the capacity of the seed system to produce high-quality wheat seed.
The Ethiopian extension service will need to be strengthened in order to facilitate greater use of inputs and greater commercialization. More specifically, the development agents will need to be able to deliver a more complex message regarding fertilizer as Ethiopia transitions from uniform recommendations to location-specific recommendation. In addition, they will need to provide more information and assistance in agricultural marketing, including advice on prices, buyers, timing, and location of sale.
The government should explore possible explanations for the production-consumption discrepancy in wheat statistics. The estimated quantity of wheat production plus imports greatly exceeds the estimated consumption of wheat products, implying that production is over-estimated and/or consumption is under-estimated. Given that policy decisions depend on the quality of wheat data, it is important that statistical authorities explore and test possible explanations for this discrepancy.
Wheat in Ethiopia Page 56
The government should seek to encourage rather than discourage grain storage by private traders. Government policy supports on-farm and cooperative storage in recognition of the fact that more grain storage between the harvest period and the off-season would reduce seasonal fluctuations in prices. However, grain storage by private traders achieves the same objectives. Nonetheless, official criticism of “hoarding” and “speculation” during the 2007-08 food price spike discourage traders from engaging in grain storage. A statement from the government that grain storage activity by any part is legal and socially useful could stimulate greater storage and investment in storage facilities.
Clarifying government support for private storage should precede any further public investment in grain storage. It would be counter-productive to spend scarce public resources on storage facilities while traders who may be willing to carry out the same functions at no cost to the government are discouraged from doing so.
More information on the economics of wheat (and other grain) storage is needed. Ethiopia has a relatively rich set of data on the producer and retail prices in different markets. This information could be combined with data on the costs of grain storage to evaluate the benefits and costs of storage activity. Highly seasonal prices, in which the inter-seasonal price differences would clearly cover the cost of storage, would be clear evidence of under-investment in storage.
The most important factor for increasing marketed surplus is to expand wheat productivity. As wheat yields increase, the surplus beyond consumption needs will be greater.
Reducing transaction costs is another strategy for increasing the share of wheat production that is marketed. Wheat farmers that are far from an all-weather road sell a smaller share of their wheat harvest, reflecting the cost of getting the harvest to market. Improving rural feeder roads in wheat-producing zones would expand marketed surplus, as would improving the system of market information.
The wheat subsidy should be reformed in a way that improves cost-effectiveness. Efforts are needed to improve the cost-effectiveness of the subsidy, defined as the ratio of benefits delivered to poor and vulnerable households to the cost of the systems. This can be achieved by identifying ways to reduce the overall cost and to improve the targeting of assistance to poor households.
In the short-term, one way to reform the subsidy system would be to phase out imports and provide subsidized domestic wheat to millers. Based on prices in 2014, the cost of purchasing wheat domestically to supply millers at subsidized prices would be significantly less than the cost of importing wheat from the international market. In the short- to medium-term, the EGTE should procure wheat from the lowest-cost supplier, which will often be local suppliers. The system of providing the wheat at subsidized prices to millers and controlling the prices of flour sold to the bakeries and of bread sold to consumers would be retained, at least in initially.
In the medium term, there is a need to improve the targeting of the urban bread subsidy. Currently, subsidized bread is available in many stores throughout Addis Ababa and other cities. One option for targeting this assistance would be use geographic targeting, in which only bakeries in low-income neighborhoods would receive subsidized flour. Another alternative

Wheat in Ethiopia Page 57
would be to extend a PSNP-like safety net into urban areas, developing lists of poor and vulnerable households who are eligible for subsidized bread. This could be implemented in a voucher system, in which targeted households receive vouchers and use them to buy bread at subsidized prices. Although this would entail administrative costs, these costs are just 16% of the PSNP costs so they would be more than offset by the savings resulting from not subsidizing bread for middle- and higher-income urban households.
In the longer term, a voucher system could replace the complex system of subsidizing wheat to millers and controlling the flow of flour to bakeries and the prices of flour and bread. If the vouchers could be redeemed by bakeries for cash, then bread could be subsidized for selected households without any need to subsidize wheat or regulate supply chain from the millers to the bakeries. The main cost of the program would be paying bakeries for the vouchers rather than selling the wheat to millers at a loss.
Although there was a need for EGTE to import wheat during the 2007-08 crisis, the justification for EGTE involvement in wheat imports is less obvious now. Private traders were successful in importing wheat and keeping domestic prices relatively stable during the 2000-07 period, and the spike in prices in 2008 was due to the rationing of foreign exchange during the crisis. If foreign exchange can be made available to importers (perhaps at a premium to reflect its scarcity value), then they could resume this role.

Wheat in Ethiopia Page 58
References
Alemu, D., G. Ayele, B. Behute, Y. Beyone, R. Dewana, B. Fekadu, R. Vargas Hill, N. Minot, S. Rashid, A. Taffesse and N. Tefera. 2008. Cereals Availability Study in Ethiopia, 2008. Joint Research Centre of the European Commission. Publications Office of the European Union. Luxembourg. (http://bookshop.europa.eu/en/cereals-availability-study-in-ethiopia-2008-pbLBNA24801/)
Alston, J. M., C Chan-Kang, MC Marra, PG Pardey, TJ Wyatt. 2000. A meta-analysis of rates of return to agricultural R&D: Ex pede Herculem? Research Report No. 113. International Food Policy Research Institute. Washington, DC. (http://www.ifpri.org/sites/default/files/publications/rr113.pdf )
Alvares, F. and Henry Stanley. 1961. The Prester John of the Indies: A True Relation of the Lands of the Prester John, Being the Narrative of the Portuguese Embassy to Ethiopia in 1520. Published for the Hakluyt Society at the University Press. Ethiopia. (http://books.google.com/books?id=ImkTAAAAIAAJ&focus=searchwithinvolume&q=)
Beintema, Nienke, Mekonnen Hailu, Tesfaye Haregewoin, Michael Rahija, and Eyob Bezabeh. 2014. Ethiopia: Agricultural R&D Indicators Factsheet. Agricultural Science and Technology Indicators. International Food Policy Research Institute. Washington, DC. (http://www.asti.cgiar.org/pdf/factsheets/Ethiopia-Factsheet.pdf )
CGIAR (Consultative Group for International Agricultural Research). Agricultural Sciences Technology Indicators (ASTI) program, Diffusion and Impact of Improved Varieties in Africa (DIIVA) project. (http://www.asti.cgiar.org/diiva#0).
Coll-Black, S., D. Gilligan, J. Hoddinott, N. Kumar, A. Seyoum Taffesse, and W. Wiseman. 2011. Targeting Food Security Interventions When ‘Everyone is Poor’: The Case of Ethiopia’s Productive Safety Net Programme" Working Paper 24 Ethiopia Strategy Support Program, International Food Policy Research Institute, Addis Ababa. (http://essp.ifpri.info/2011/07/08/food-security-interventions-when-%E2%80%9Ceveryone-is-poor%E2%80%9D-the-case-of-ethiopia%E2%80%99s-productive-safety-net-programme/)
CSA (Central Statistical Agency). 2014. Agricultural Sample Survey 2013-14. Volume VII: Report on Crop and Livestock Product Utilization. Addis Ababa.
EGTE (Ethiopia Grain Trading Enterprise). 2015. EGTE Company Profile. (http://www.egte-ethiopia.com/en/2014-03-29-12-35-07/egte-structures.html)
Fermont, Anneke and Todd Benson. (2011) “Estimating Yield of Food Crops Grown by Smallholder Farmers: A Review in the Uganda Context”, International Food Policy Research Institute, IFPRI Discussion Paper 01097, June 2011. (http://www.ifpri.org/sites/default/files/publications/ifpridp01097.pdf)
FAO (Food and Agriculture Organization). 2015. Food Balance Sheets. FAOSTAT. Rome. (http://faostat3.fao.org/download/FB/FBS/E).
Wheat in Ethiopia Page 59
Minot, N. and D. A. Mekenon. 2012. “Role of agricultural cooperatives and storage in rural Ethiopia: Results of two surveys.” Research for Ethiopia’s Agricultural Policy. International Food Policy Research Institute. Washington, DC.
Minot, N. and B. Sawyer. 2013. “Agricultural production in Ethiopia: Results of the 2012 IFPRI-ATA Baseline Survey.” Research for Ethiopia’s Agricultural Policy. International Food Policy Research Institute. Washington, DC. (http://www.ifpri.org/publication/agricultural-production-ethiopia?print)
Negassa, A. and T.S. Jayne, 1997. “The Response of Ethiopian Grain Markets to Liberalization,” Working Paper #6, Grain Market Research Project, Ministry of Economic Development and Cooperation, Addis Ababa.
Ofcansky, T. and L. Berry. (ed.) 1991. Ethiopia: Historical Setting. Library of Congress Country Study, Washington, DC. (http://historymedren.about.com/library/text/ntxtethiopia2.htm)
Rashid, S. 2010. Staple Food Prices in Ethiopia. Prepared for the COMESA policy seminar on “Variation in staple food prices: Causes, consequence, and policy options”, Maputo, Mozambique, 25‐26 January 2010 under the African Agricultural Marketing Project (AAMP). (http://fsg.afre.msu.edu/aamp/seminar_3/AAMP_Maputo_27_Ethiopia_ppr.pdf)
Rashid, S. and S. Lemma. 2011. “Strategic grain reserves in Ethiopia: Institutional design and operational performance.” Discussion Paper No 1054. International Food Policy Research Institute. Washington, DC. http://www.ifpri.org/publication/strategic-grain-reserves-ethiopia
Sud, U. C., Hukum Chandra, and A. K. Srivastava. 2011. "Crop Yield Estimation at District Level by Combining Improvement of Crop Statistics Scheme Data and Census Data." Wye City Group on Statistics on Rural Development and Agricultural Household Income, 4th Meeting, Rio de Janeiro, Brazil, November, 2011.
USDA (United States Department of Agriculture), 2015. Ethiopia Grain and Feed Annual Report. Global Agricultural Information Network (GAIN) Report ET-1503. Foreign Agricultural Service, USDA, Washington, DC. (http://www.fas.usda.gov/data/ethiopia-grain-and-feed-annual )
WFP (World Food Programme). 2013. Logistical Capacity Assessment – Ethiopia. (http://dlca.logcluster.org/display/public/DLCA/Ethiopia).
World Bank. 2011. Designing and implementing a rural safety net in a low income setting: Lessons learned from Ethiopia’s productive safety net program 2005–2009. The World Bank. Washington, DC. (http://siteresources.worldbank.org/SAFETYNETSANDTRANSFERS/Resources/EthiopiaPSNPLessonsLearnedLite.pdf).

Wheat in Ethiopia Page 60