what the egg can tell about its hen: embryonic development ... · j. math. biol. (2009)...
TRANSCRIPT

J. Math. Biol. (2009) 58:377–394DOI 10.1007/s00285-008-0195-x Mathematical Biology
What the egg can tell about its hen: Embryonicdevelopment on the basis of dynamic energy budgets
S. A. L. M. Kooijman
Received: 14 January 2008 / Revised: 17 April 2008 / Published online: 7 June 2008© Springer-Verlag 2008
Abstract The energy cost of offspring is important in the conversion of resourcesallocated to reproduction to numbers of offspring, and in obtaining energy budgetparameters from quantities that are easy to measure. An efficient numerical procedureis presented to obtain this cost for eggs and foetusses in the context of the dynamicenergy budget theory, which specifies that birth occurs when maturity exceeds a thre-shold value and maternal effects determine the reserve density at birth. This paperextends previous work to arbitrary values of the ratio of the maturity and somaticmaintenance costs. I discuss the body size scaling implications for the relative sizeand age at birth and conclude that the size at birth, contrary to the age at birth, cova-ries with the maintenance ratio. Apart from evolutionary adaptation of the maturity atbirth, this covariation might explain some of the observed scatter in the relative lengthat birth. The theory can be used to evaluate the effects of the separation of cells ine.g. the two-cell stage of embryonic development, and of the removal of initial eggmass. If cell separation hardly affects energy parameters, body size scaling relation-ships imply that cell separation can only occur successfully in species with sufficientlylarge maximum body length (as adult); i.e. some two times that of Daphnia magna.Toxic compounds that increase the cost of synthesis of structure, decrease the allo-cation to reproduction indirectly via the life cycle, because food uptake is linked tosize. They can also decrease the egg size, however, such that the reproduction rate isstimulated at low concentrations. The present theory offers a possible explanation forthis well-known phenomenon.
S. A. L. M. Kooijman (B)Department of Theoretical Biology, Vrije Universiteit, de Boelelaan 1087,1081 HV Amsterdam, The Netherlandse-mail: [email protected]
123

378 S. A. L. M. Kooijman
Keywords Dynamic energy budget theory · Embryonic development · Cost of anegg · Foetus · Incubation time · Length at birth · Body size scaling relationships ·Removal of reserve · Hormesis
Mathematics Subject Classification (2000) 34B16 · 37N25
1 Introduction
The embryonic stage is rarely a topic of ecological texts, but nonetheless very importantfor the estimation of energy budget parameters [23]. Knowledge of energy costs of anembryo is required in the specification of the reproduction rates in models that dealwith resource allocation. Knowledge of reproduction rates is basic for e.g. populationdynamics and ecotoxicology, where effects of chemical compounds on reproductionrates are studied. The dynamics of the state variables of an embryo can also yieldvaluable information about the physiology of post-embryonic stages.
Twenty years ago I wrote a paper with the title “What the hen can tell about heregg” [18] demonstrating that the standard dynamic energy budget (DEB) model [19]captures egg development data very well for a number of species [19, Fig. 3.15–16],on the assumption that embryos behave as juveniles that do not eat and start theirdevelopment with a negligibly small amount of structure. The model is meant to applyto all embryonic stages, such as eggs in animals, seeds in plants, spores in fungi andbacteria, as well as the pupation stage of holometabolic insects [19, Fig. 7.24].
The reserve density, i.e. the ratio of the amounts of reserve and structure, at birthtends to covary with that of the mother at egg production; well-fed mothers give birthto well-fed offspring. Such maternal effects are typical and have been found in e.g.birds [29], reptiles, amphibians [25], fishes [12], insects [26,31,32], crustaceans [9],rotifers [36], echinoderms and bivalves [3]. However, some species seem to producelarge eggs under poor feeding conditions, e.g. some poeciliid fishes [30], daphnids[10] and Sancassania mites [2]. Moreover, egg size can vary within a clutch [6,28,35],according to geographical distribution [33], with age [26] and race.
DEB theory specifies the costs for structure, the somatic and maturity maintenancecosts and the processes of growth and maturation. The additional specification ofthe reserve density at birth to accomodate maternal effects also specifies the initialamount of reserve (so the cost of an egg) indirectly, but its evaluation is not very simple.Maternal effects make that the cost per egg varies in time, with the consequence thatthis cost has to be evaluated for each time increment if reproduction rates are requiredas functions of time. This motives searching for an efficient algorithm.
Since [18] a lot of work has been done on many aspects of DEB theory, includingwork on the embryonic stage. (The next section summarizes the relevant aspects ofthe model.) The spectacular matches of model predictions with a much wider setof empirical data on embryonic growth and respiration on a wide variety of species[19,37,38] confirmed the existence of generally applicable rules for egg developmentas provided by DEB theory and motivated further work. It became clear that if thematurity and somatic maintenance rate coefficients are equal, stage transitions notonly occur at exceeding threshold values for maturity, but also for structural mass(independent of the trajectory of food levels). If so, this simplifies matters considerably,
123
What the egg can tell about its hen: Embryonic development 379
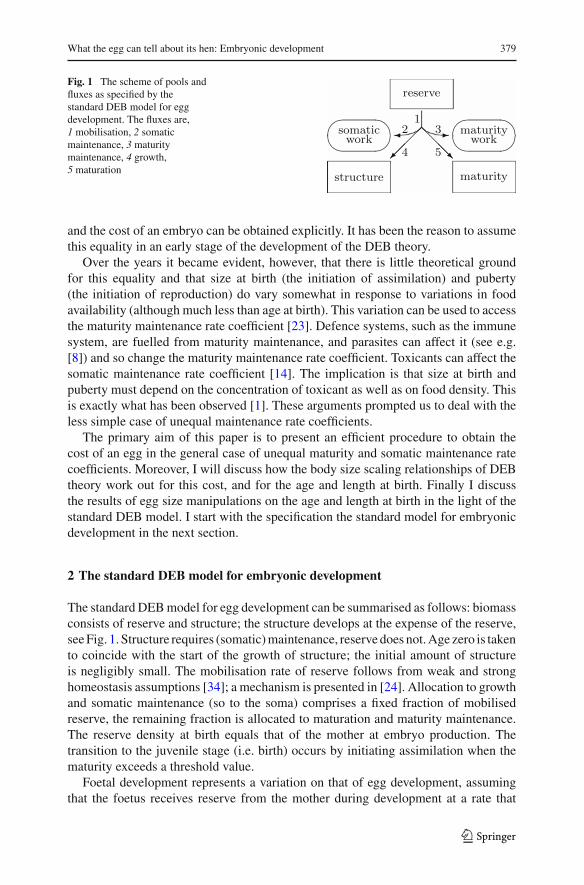
Fig. 1 The scheme of pools andfluxes as specified by thestandard DEB model for eggdevelopment. The fluxes are,1 mobilisation, 2 somaticmaintenance, 3 maturitymaintenance, 4 growth,5 maturation
and the cost of an embryo can be obtained explicitly. It has been the reason to assumethis equality in an early stage of the development of the DEB theory.
Over the years it became evident, however, that there is little theoretical groundfor this equality and that size at birth (the initiation of assimilation) and puberty(the initiation of reproduction) do vary somewhat in response to variations in foodavailability (although much less than age at birth). This variation can be used to accessthe maturity maintenance rate coefficient [23]. Defence systems, such as the immunesystem, are fuelled from maturity maintenance, and parasites can affect it (see e.g.[8]) and so change the maturity maintenance rate coefficient. Toxicants can affect thesomatic maintenance rate coefficient [14]. The implication is that size at birth andpuberty must depend on the concentration of toxicant as well as on food density. Thisis exactly what has been observed [1]. These arguments prompted us to deal with theless simple case of unequal maintenance rate coefficients.
The primary aim of this paper is to present an efficient procedure to obtain thecost of an egg in the general case of unequal maturity and somatic maintenance ratecoefficients. Moreover, I will discuss how the body size scaling relationships of DEBtheory work out for this cost, and for the age and length at birth. Finally I discussthe results of egg size manipulations on the age and length at birth in the light of thestandard DEB model. I start with the specification the standard model for embryonicdevelopment in the next section.
2 The standard DEB model for embryonic development
The standard DEB model for egg development can be summarised as follows: biomassconsists of reserve and structure; the structure develops at the expense of the reserve,see Fig. 1. Structure requires (somatic) maintenance, reserve does not. Age zero is takento coincide with the start of the growth of structure; the initial amount of structureis negligibly small. The mobilisation rate of reserve follows from weak and stronghomeostasis assumptions [34]; a mechanism is presented in [24]. Allocation to growthand somatic maintenance (so to the soma) comprises a fixed fraction of mobilisedreserve, the remaining fraction is allocated to maturation and maturity maintenance.The reserve density at birth equals that of the mother at embryo production. Thetransition to the juvenile stage (i.e. birth) occurs by initiating assimilation when thematurity exceeds a threshold value.
Foetal development represents a variation on that of egg development, assumingthat the foetus receives reserve from the mother during development at a rate that
123

380 S. A. L. M. Kooijman
Table 1 The 5 budget parameters (upper panel) and 4 variables (lower panel) of the standard deb modelfor embryonic development in the length-mass frame
Symbol Unit Description
v m day−1 Energy conductance
g – Energy investment ratio
k J day−1 Maturity maintenance rate coefficient
kM day−1 Somatic maintenance rate coefficient
κ – Allocation fraction to soma
a, ab day Age, at birth
L , Lb m Structural length, at birth
UH , UbH day m2 Scaled maturity, at birth
UE , U0E , Ub
E day m2 Scaled reserve, at the start, at birth
The values of the variables at birth are also indicated; UbH and Ub
E L−3b serve as parameters. The value of
UE at the start is indicated, while that of a and UH are zero at the start. The values U0E , Ub
E , ab and Lbare functions of the 5 + 2 parameters; this paper aims to identify these functions from the model structure.Dots above symbols mean “per time”
no longer restricts development. In DEB theory, this has the consequence that foetalweight becomes proportional to cubed age, a well-known empirical finding [13] thathas astonishing accuracy [19, Fig. 3.18]. In other words, most of the complexity of eggdevelopment in DEB theoretic context results from the deceleration of developmentdue to depletion of reserve towards the end of incubation.
Table 1 presents the variables and parameters of the standard DEB model for theembryonic stage. Two parameters deserve extra discussion in the context of this paper:the somatic and maturity maintenance rate coefficients. The somatic maintenance ratecoefficient kM has the interpretation of the ratio of the structure-specific somatic main-tenance cost and the cost for the synthesis of a unit of structure; the somatic main-tenance cost is assumed to be proportional to the amount of structure (in all stages).Likewise the maturity maintenance rate coefficient k J is the ratio of the maturity-specific maturity maintenance cost and the cost for a unit of maturity; the maturitymaintenance cost is assumed to be proportional to the level of maturity. Maturityrepresents information, and not mass or energy; physiologically it stands for a set ofregulation systems that structures the various metabolic activities in an individual. Ifthe individual dies, no mass or energy is released from the maturity of the corpse;it simply becomes lost. We avoid quantification of information, however. Maturityis quantified as the cumulative investment of reserve into maturity, but after havingincreased maturity, the invested reserve is excreted into the environment in decompo-sed form. I treat k J as a primary parameter. If the maintenance ratio k = k J/kM equalsone, maturity is proportional to the amount of structure in the embryonic and juvenilestages and the structure-specific maturity maintenance cost is constant; [19] workedwith this parameter to avoid discussing the concept “information”. For k �= 1 theuse of the structure-specific maturity maintenance cost is no longer handy, however,because is not constant.
123
What the egg can tell about its hen: Embryonic development 381
The weight of an egg typically changes during development due to loss of water interrestrial environments (some 10% in birds), or uptake of water in aquatic environ-ments (some factor 8 in daphnids). Reptile eggs manage to take up water in terrestrialenvironments [4]. I avoid dealing with these changes, using mass of reserve and struc-ture, excluding contributions by water. Apart from these changes in the amount ofwater, eggs loose mass because of the use of reserve for maintenance, growth andmaturation.
The parameter values are individual-specific, but the differences between indivi-duals of the same species are usually small compared to the differences in nutritionalcondition, especially if eggs are compared of different clutches, environments and/oryears. The most likely value to differ among eggs of the same species in the contextof DEB theory is the reserve density at birth. The significance of the theory presentedin this paper is the implied prediction for how age at birth, weight at birth and initialweight covary as a result of the variation in the reserve density at birth. This covariationcan be used to yield information about parameter values.
Although the model is still identical to the original one (and the notation changedlittle only during 30 years of research on DEB theory), this presentation differs by thevariables scaled reserve UE = ME/{ JE Am} and scaled maturity UH = MH /{ JE Am},where ME and MH stand for the mass of reserve and maturity, and { JE Am} for thesurface area-specific maximum reserve assimilation rate. Although the variables mightnot have a straightforward intuitive interpretation, this scaling is done to avoid theintroduction of mass or energy, so that the whole discussion can be confined to thedimensions length and time. This not only simplifies the theoretical discussion, butalso the procedure to extract parameter values from experimental data (see the Sect. 7).
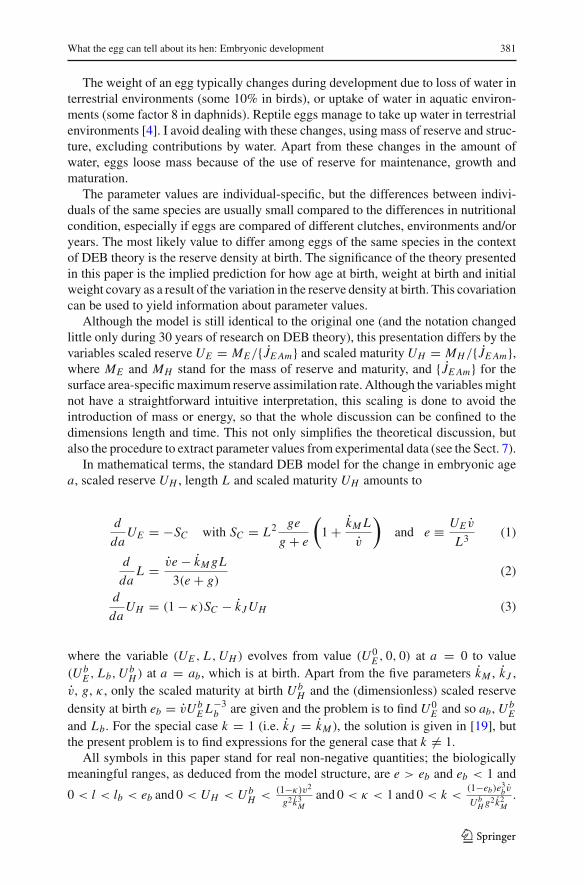
In mathematical terms, the standard DEB model for the change in embryonic agea, scaled reserve UH , length L and scaled maturity UH amounts to
d
daUE = −SC with SC = L2 ge
g + e
(1 + kM L
v
)and e ≡ UE v
L3 (1)
d
daL = ve − kM gL
3(e + g)(2)
d
daUH = (1 − κ)SC − k J UH (3)
where the variable (UE , L , UH ) evolves from value (U 0E , 0, 0) at a = 0 to value
(U bE , Lb, U b
H ) at a = ab, which is at birth. Apart from the five parameters kM , k J ,v, g, κ , only the scaled maturity at birth U b
H and the (dimensionless) scaled reservedensity at birth eb = vU b
E L−3b are given and the problem is to find U 0
E and so ab, U bE
and Lb. For the special case k = 1 (i.e. k J = kM ), the solution is given in [19], butthe present problem is to find expressions for the general case that k �= 1.
All symbols in this paper stand for real non-negative quantities; the biologicallymeaningful ranges, as deduced from the model structure, are e > eb and eb < 1 and
0 < l < lb < eb and 0 < UH < U bH <
(1−κ)v2
g2 k3M
and 0 < κ < 1 and 0 < k <(1−eb)e3
b v
U bH g2 k2
M.
123

382 S. A. L. M. Kooijman
Table 2 The definitions for the dimensionless scaled variables and parameters that are used to find theinitial amount of scaled reserve u0
E = U0E g2 k3
M/v2
τ = akM τb = abkM l = LgkM /v lb = LbgkM/v
uE = UE g2 k3M/v2 ub
E = UbE g2 k3
M/v2 u H = UH g2 k3M/v2 ub
H = UbH g2 k3
M/v2
e = guE / l3 eb = gubE / l3
b eH = gu H / l3 ebH = gub
H / l3b
x = ge+g xb = g
eb+g α = 3gx1/3/ l αb = 3gx1/3b / lb
y = xeH1−κ
yb = xbebH
1−κ= gxbvb
H l−3b k = k J /kM vb
H = ubH
1−κ
3 Initial amount of reserve and age, length at birth
The key to finding the cost of an egg is finding an appropriate scaling of variablesfor solving the boundary value problem. Table 2 shows the scaled variables. I firstremove 2 parameters by scaling the variable (a, UE , L , UH ) to the dimensionlessvariable (τ, uE , l, u H ) or, alternatively, to the dimensionless variable (τ, e, l, eH ).This is possible because the original problem has dimensions length and time, whichcan be eliminated.
The reformulated problem is now: find τb, lb, u0E given ub
H , k, g, κ and ubE = ebl3
b/g.We also have 0 < k < (1 − κ)e3
b/ubH and ub
H < 1 − κ .For the variable (τ, uE , l, u H ) evolving from the value (0, u0
E , 0, 0) to the value(τb, ub
E , lb, ubH ), the scaled model amounts to
d
dτuE = −uEl2 g + l
uE + l3 (4)
d
dτl = 1
3
guE − l4
uE + l3 (5)
d
dτu H = (1 − κ)uEl2 g + l
uE + l3 − ku H (6)
or alternatively for variable (τ, e, l, eH ) evolving from the value (0,∞, 0, e0H ) to the
value (τb, eb, lb, ebH )
d
dτe = −g
e
l(7)
d
dτl = g
3
e − l
e + g(8)
d
dτeH = (1 − κ)
ge
l
l + g
e + g− eH
(k + g
l
e − l
e + g
)(9)
where e0H = (1 − κ)g is such that d
dτeH (0) = 0, else d
dτeH (0) = ±∞. If k = 1 we
have eH (τ ) = e0H for all τ and u H (τ ) = (1 − κ)l3
b . For k > 1, eH is decreasing in(scaled) age, and for k < 1 increasing.
123

What the egg can tell about its hen: Embryonic development 383
Before I derive expressions for τb, u0E and lb, I first make an observation on α (see
Table 2) that is used later.From Table 2 and ode’s Eqs. (7–8), we have
d
dτx = gx
1 − x
l(10)
d
dτl = g − xg − lx
3(11)
d
dτα = x1/3
1 − x
d
dτx (12)
so
α = 3g(u0E )−1/3 + Bx
(4
3, 0
)(13)
where Bx (a, b) ≡ ∫ x0 ya−1(1 − y)b−1 dy is the incomplete Beta function, which
reduces for this particular case to
Bx
(4
3, 0
)= √
3
(arctan
1 + 2x1/3
√3
− arctan1√3
)
+1
2log(1 + x1/3 + x2/3) − log(1 − x1/3) − 3x1/3.
Consequently we have
αb − α = Bxb
(4
3, 0
)− Bx
(4
3, 0
)(14)
1
l= 1
lb
( xb
x
)1/3 − Bxb(43 , 0) − Bx (
43 , 0)
3gx1/3 (15)
We need this expression for l(x) later in the derivation of lb.I now first derive expressions for τb and u0
E assuming that lb is known, and then Iderive an expression for lb.
3.1 Scaled age at birth τb
The scaled age at birth τb follows from Eqs. (10) and (15) by separation of variablesand integration
τb = 3
xb∫0
dx
(1 − x)x2/3(αb − Bxb(43 , 0) + Bx (
43 , 0))
(16)
Equation (16) is consistent with the one for k = 1 [19, Eq. (3.33)], but lb in αb isnot a parameter and given below.
123

384 S. A. L. M. Kooijman
3.2 Scaled initial amount of reserve u0E
The scaled initial amount of reserve u0E directly follows from Eq. (13) for x = xb and
α = αb
u0E =
(3g
αb − Bxb
( 43 , 0
))3
(17)
Equation (17) is consistent with the one for k = 1 [19, Eq. (3.31)], but lb in αb isnot a parameter and given below.
3.3 Scaled length at birth lb
The pièce de resistance for solving our boundary value problem is finding lb, whichturns out to be rather straightforward once the appropriate transformation of variablesis found (namely y(x), see Table 2). For the variable (τ, x) evolving from the value(0, 0) to the value (τb, xb) and the variable (τ, eH ) evolving from the value (0, e0
H ) tothe value (τb, eb
H ) we have the ode for x , Eq. (10), and
d
dτeH = (1 − κ)g(1 − x)
(g
l(x)+ 1
)− eH
(k − x + g
1 − x
l(x)
)
Now consider the variable (x, eH ) evolving from the value (0, e0H ) to the value (xb, eb
H )
or the variable (x, y) evolving from the value (0, 0) to the value (xb, yb):
d
dxeH = e0
H
x
(l(x)
g+ 1
)− eH
x
(k − x
1 − x
l(x)
g+ 1
)for e0
H = eH (0) = (1 − κ)g
d
dxy = r(x) − ys(x) for r(x) = g + l(x); s(x) = k − x
1 − x
l(x)
gx(18)
where l(x) is given in Eq. (15). The ode for y can be solved to
y(x) = v(x)
x∫0
r(x1)
v(x1)dx1 with v(x) = exp
⎛⎝−
x∫0
s(x1) dx1
⎞⎠
The quantity lb must be solved from yb = y(xb) = gxbvbH l−3
b , see Table 2. So weneed to find the root of t as function of lb with
t (lb) = xbgvbH
v(xb)l3b
−xb∫
0
r(x)
v(x)dx = 0 (19)
123

What the egg can tell about its hen: Embryonic development 385
From this equation it becomes clear that the parameters κ and ubH affect lb only via
vbH = ub
H1−κ
; a conclusion that is more difficult to obtain using the ode for the scaledmaturity density eH rather than that for abstract variable y. Notice that the solution oflb (and that of u0
E and τb) for the boundary value problem for the ode for (uE , l, eH ) asgiven in Eqs. (4–6) depends on the four parameters g, k, vb
H and eb only. The solutionfor lb must be substituted into Eq. (17) to obtain u0
E and in Eq. (16) to obtain τb; thescaled reserve at birth is ub
E = ebl3b/g.
3.4 Numerical solution for scaled length at birth lb
This subsection discusses numerical methods to obtain the root of function t as givenin Eq. (19). The shooting method (in one dimension) on the ode for y, Eq. (18),turns out to be rather stable, where y(xb) = yb is evaluated by integrating d
dx y using
lb = (vb
H
)1/3as starting value, which is the exact solution for k = 1. Since lb is
a scaled length, vbH has the interpretation of a scaled volume, which has been the
motivation for the choice of the symbol.Alternatively the Newton–Raphson procedure li+1
b = lib − t (li
b)/t ′(lib) can be used
to solve Eq. (19) with
l(x) =(
1
lb
( xb
x
)1/3 − Bx (43 , 0) − Bxb (
43 , 0)
3gx1/3
)−1
; l ′(x) = l2(x)
l2b
( xb
x
)1/3
v(x) = exp
⎛⎝−
x∫0
k−x1
1−x1
l(x1)
g
dx1
x1
⎞⎠ ; v′(x)=v(x) exp
⎛⎝−
x∫0
k−x1
1−x1
l ′(x1)
g
dx1
x1
⎞⎠
r(x) = g + l(x); r ′(x) = l ′(x)
t (lb) = xbgubH
(1 − κ)v(xb)l3b
−xb∫
0
r(x)
v(x)dx
t ′(lb) = − xbgubH
(1 − κ)v(xb)l3b
(3
lb+ v′(xb)
v(xb)
)−
xb∫0
(r ′(x)
r(x)− v′(x)
v(x)
)r(x)
v(x)dx
The problem here is in the accurate evaluation of the integrals. Euler integrationrequires a fine grid if k � 1, but the combination of the Newton–Raphson method andthe Euler integration is nonetheless much faster than the shooting method, especiallyif started for the lb of the foetus. Moreover, data indicates that k < 1 is more typicalin practice.
3.5 Special case e → ∞: foetal development
The special case e → ∞, which is approximative for foetal development, makes thatd
dτl = g/3, or l(τ ) = gτ/3. We further have
123

386 S. A. L. M. Kooijman
d
dτu H = (1 − κ)l2(g + l) − ku H
u H (τ ) = g3(1 − κ)
33k4
(k2τ 2(3k + kτ − 3) + 6(k − 1)(1 − τ − exp(−kτ))
)
The equation u H (τb) = ubH has to be solved numerically for τb, but for k = 1 we have
ubH = (1−κ)3−3g3τ 3
b = (1−κ)l3b , from which τb can be solved easily and be used as
a starting value for the case k �= 1. The solution of this equation is stable and fast; theresulting scaled length at birth lb = gτb/3 can be used to start the Newton–Raphsonprocedure to find lb for an egg. This start is preferable if k is substantially differentfrom 1. From lb < 1, so τb < 3/g, we can derive the constraint
k2ubH
1 − κ< k + g(k − 1) + g3 k − 1
k2
1 − 3/g − exp(−3k/g)
9/2
It can be shown that 1 <gτb3lb
< 1 + geb
generally holds, see [23]; the range in thefoetus case being restricted to zero (eb → ∞).
For ubE = uE (τb), the cost for a foetus amounts to
u0E = ub
E + κl3b + ub
H +τb∫
0
(κl3(τ ) + ku H (τ )) dτ = ubE + l3
b + 3
4
l4b
g(20)
where the five terms correspond with the costs of reserve, structure, maturity, somaticand maturity maintenance, respectively. The second equality follows from the structureof DEB theory; the investment in maturity plus maturity maintenance equals 1−κ
κtimes
the investment in structure plus somatic maintenance and l(τ ) = gτ/3. The cost of afoetus as given in Eq. (20) is somewhat smaller than that of an egg as given in Eq. (17),because development decelerates towards the end of incubation; the structure has tobe maintained over a longer period.
4 Body size scaling relationships
DEB theory implies rules for how the primary parameters of the standard model covaryamong species [17,20,34], generally known as body-size scaling relationships wherethe variation of parameter values are studied as function of the maximum structurallength of a species, Lm = v
gkM[19, p. 94], which is defined as the cubic root of the
maximum structural volume. In the DEB theory this length is a compound parameter,so a consequence of underlying processes (assimilation, allocation and maintenance),rather than a basic quantity. This section discusses some of the (compound) parametersof the standard DEB model as function of the (dimensionless) zoom factor z, which isthe maximum structural length of a species, relative to a reference value. The mainte-nance rate coefficients k J and kM , the energy conductance v and the allocation fractionκ are independent of the zoom factor. This implies that the energy investment ratio g
123

What the egg can tell about its hen: Embryonic development 387
tends to covary inversely to the zoom factor. The scaled maturity at birth U bH cova-
ries with the squared zoom factor. This is because the (unscaled) maturity at birthMb
H = U bH { JE Am} covaries with the cubed zoom factor, and the surface area specific
reserve assimilation rate { JE Am} covaries with the zoom factor. The energy investmentratio g is a compound parameter, which has { JE Am} is its denumerator and so covarieswith the inverse zoom factor [19, p. 270].
These variations of parameter values among species determine how functions ofthese parameters, such as length and age at birth, and initial amount of reserve covarywith maximum length. Parameter values that quantify metabolic traits are rather pre-dictable, while life history parameters, such as the maturity at birth, are highly adap-table (from an evolutionary point of view). Within particular taxa the variation is less,however. The primary parameter that is in control of length at birth is the maturity atbirth. Previously [18, p. 283] I discussed the logic behind the relatively small egg sizeof the (European) cuckoo, as an adaptation to match the incubation time of the eggs ofits much smaller host, and the relatively large eggs of the tube-noses (Procellariformesto which albatrosses belong) as an adaptation to shorten the time that they are bound toa particular nesting site. Like the more general classification of birds (and other taxa)in altricial and precocial ones, variation in the maturity at birth is the key to understandthese patterns in the context of DEB theory, and I am still behind this point of view.I will now discuss another source of variation of relative egg size, cq length at birth,that is new and deserves noticing.
Figure 2 shows the scaled initial amount of reserve, and the scaled length and scaledage at birth as a function of the zoom factor for a large range of 104. If k = 1 andαb >> Bxb(
43 , 0), the initial reserve scales approximately with the zoom factor to the
power 4. The scaled initial reserve u0E scales, therefore, scales with the zoom factor,
which is confirmed in the figure. If k = 1, the structural volume at birth is proportionalto the maturity at birth, so length at birth scales with the zoom factor, which means thatscaled length is independent of the zoom factor. If k = 1 age at birth, and thereforealso scaled age at birth, scales with the zoom factor [18]. These results are knownfor two decades now [18], but now shown for scaled variables to study the effect fork �= 1.
The scaling is more complex if k �= 1, especially for the length at birth and the initialreserve; I presented the approximate scaling exponents to comply with the traditionalway to present these types of relationships. It is remarkable that taxa show a widescatter in scaling relationships for specially these quantities (as well as the length atpuberty, which is not discussed in this paper). This suggests that taxa might differ inthe maintenance ratio. The increase in the maintenance ratio k goes with an increasein the relative size at birth for any given value of the zoom factor, but the effect isbigger for the large-bodied species. Since protein turnover is an important componentof somatic maintenance costs, and activity is typically a minor component, it is notlikely that species differ a lot in the somatic maintenance costs. I expect that the costfor defence (e.g. the immune system) varies more among species. It is tempting tospeculate about the relatively small egg size of dinosaurs (indicating small maturitymaintenance costs) versus the relatively large size at birth of mammals (indicatinghigh maturity maintenance costs).
123

388 S. A. L. M. Kooijman
Fig. 2 The scaled initial reserve (left), length at birth (middle), and age at birth (right) as function of thezoom factor, log–log plotted (base 10). Each plot has three curves, corresponding to maintenance ratiok = 0.1 (lower), 0.5 (middle), 1 (upper). Parameters: g = 80/z, ub
H = 0.005, eb = 1. The curves areapproximately allometric with slopes for large zoom factors
Maintenance ratio k 0.1 0.5 1.0
Scaled initial reserve u0E 0.55 0.83 1.00
Scaled length at birth lb −0.14 −0.04 0.00
Scaled age at birth τb 0.85 0.89 0.93
5 Separation of cells in the two or four-cell stage
Suppose that the cells in the two-cell stage of an embryo are identical in terms ofamounts of maturity, reserve and structure. If the cells are separated, the three amountsare halved. It is not obvious from the definition of maturity that maturity of the daugh-ter cells is half of that of the mother, but since the two-cell stage is very early in thedevelopment, so the maturity level is very small, this problem is numerically not impor-tant. Figure 3 shows the expected results of such an event, which sometimes occursspontaneously. The plots for maturity and structural volume are almost identical inthis case because k J /kM is very close to 1; the maturity density then remains constant.
The parameter values for Daphnia magna at 20◦C are U bH = 0.012 d mm2, g =
0.422, k J = 1.70 d−1, kM = 1.71 d−1, v = 3.24 mm d−1, which gives a scaledmaturity maintenance rate of k 1 and a scaled maturity at birth of ub
H = 0.001 [23].
123

What the egg can tell about its hen: Embryonic development 389
Fig. 3 The scaled maturity (left), reserve (middle), and structural volume (right) during embryonic deve-lopment. Each plot has three curves, corresponding with a reduction of the reserve, structure and maturityby factor 1, 0.8 and 0.5. Multiplication by 1 represents the “blank” situation. Multiplication by 0.8 at τ = 0represents a (small) reduction of the initial amount of reserve, and by a factor 0.5 at τ = τb/3 a separa-tion of cells in the two-cell stage. The age of this stage is here chosen arbitrarily. Parameters: κ = 0.8,g = 0.422/1.87, k = 0.99415; ub
H = 0.001, eb = 1. The parameter values are chosen such that the twinscease maturation at birth. (The 0.5-curve in the first graph has tangent zero at τ = τb .) Given the values forκ , k and ub
H only species with a smaller value for g can successfully separate cells in the two-cell stage
If one would try to separate cells in this species, the theory predicts that the initialreserve is not enough the cover embryonic development. This result is remarkablebecause these parameters imply that a fraction of 0.63 of the initial amount of reserveis still left at birth at abundant food, see [23]. The explanation is that the mobilisationof reserve decreases with the reserve density. It might be, of course, that maturity atbirth is affected by cell separation, which can still allow this to occur successfully insmall-bodied species. However, I am unaware of any empirical evidence for this.
The reserve density capacity [Em] = { JE Am}/v scales with the zoom factor. Sospecies with a larger ultimate body size tend to have a relatively larger reserve capacity.It turned out that for the combination of parameter values as found for D. magna wehave to reduce g be a factor of at least z = 1.87 to arrive at a minimum maximumbody size for which cell separation might be successful. Figure 3 illustrates embryodevelopment with this reduced value for g, where maturation ceases at birth. Since kis close to 1, this almost coincides with the condition that growth ceases at birth. Thisis a worst case situation because abundant food conditions are used (eb = 1) for the
123

390 S. A. L. M. Kooijman
maternal effect. Successful cell separation at lower food densities for the mother canonly occur in even larger species (so smaller values for g).
For k > 1, the structural volume at birth increases after halving, and decreases fork < 1. Since reserve contributes to weight, the weight at birth is close to half of theoriginal weight at birth, irrespective of the value of k. The age of the two-cell stage isprobably smaller than τb/3, but the results are not sensitive to this choice.
Hart [11] studied the effect of separation of the embryonic cells of the sea urchinStrongylocentrotus droebachiensis in the two-cell stage on the energetics of larvaldevelopment. Both the size and the feeding capacity of the resulting larva were reducedby about one-half, but the time to metamorphosis is about the same (7 days at 8–13◦C).The maximum clearance rate of dwarf and normal larvae was found to be the samefunction of the ciliated band length. Larvae fed at smaller ration had longer larvalperiods, but food ration hardly affected size at metamorphosis. Egg size affectedjuvenile test diameter only slightly. These qualitative observations are consistent withthe standard DEB model for k < 1, which results in a reduced size at birth, whilefeeding rate is proportional to surface area.
A full treatment of the effect of cell separation on size at birth for foetal developmentis beyond the scope of this paper. Ignoring effects of endothermy, a simple applicationcan illustrate how the theory works in practice. Armadillo’s typically separate cellsin the four-cell stage of the embryo, giving birth to four identical offspring. Humansrarely do this successfully, then giving birth to four babies of about 1 kg each, ratherthan the typical 3 kg. In terms of an effect on length this reduction amounts to a factor(1/3)1/3 = 0.69. The human growth curve fits the von Bertallanffy curve very well,
with a von Bertalanffy growth rate of rB = kM g3(e+g)
= 0.123 a−1 [19, p. 262]. We cansafely assume that the scaled reserve density was close to its maximum e = 1 for thepost-embryonic stages. Moreover, the age at birth is ab = 3lb
gkM= 0.75 a for humans. If
we take a typical maximum adult weight of 70 kg, then the scaled length at birth equalslb = (3/70)1/3 = 0.35. So the energy investment ratio equals g = lb
abrB− 1 = 2.79,
the somatic maintenance rate coefficient kM = 3lbgab
= 0.5 a−1 and the scaled age at
birth τb = abkM = 0.375. With these values for g, eb and lb, the scaled cost amountsto u0
E = 0.062 from Eq. 20. In the case of 4 babies with a reduced length by a factor0.69, the scaled cost per baby equals u0
E = 0.02, so summed over the 4 babies this is1.3 times the amount of a single baby; not a surprising result, in view of the 4 kg ofbabies relative to the 3 kg for a single baby.
6 Removal of some initial reserve
To simulate effects of caloric restriction of the mother on embryo development, resear-chers sometimes remove an amount of reserve at the start of the development, e.g.[7,15,16,27,33]. Figure 3 shows the expected results, namely an elongation of theincubation time, and a reduction of the reserve at birth. The pattern is rather similarto that of the separation of cells at an early stage, because reductions of structure andmaturity at an early stage have little effect. Although not very obvious in these plots,the initial amount of reserve is a U-shaped function of the reserve at birth. The right
123

What the egg can tell about its hen: Embryonic development 391
Fig. 4 The scaled length at birth (left), age at birth (middle), and initial reserve (right) as function of thescaled reserve at birth for various values of k. The length, age and reserve at lb = eb is also indicated; thestructure is shrinking at birth for smaller values of eb , so smaller values [i.e. left of the (lb = eb)-curve]hardly have biological meaning. Parameters: κ = 0.8, g = 0.5, ub
H = 0.001
branch is explained by the larger amount of reserve at birth, the left branch by the largerage at birth, which comes with larger cumulative somatic maintenance requirements.
A reduction of the initial amount of reserve comes with an increase of the age at birth,see Fig. 4. This has been observed in e.g. the gypsy moth [32]. Crested penguins sportegg size dimorphy [35]. The standard DEB model correctly predicts that, althoughthe 1.5 times larger egg is produced some days later, it hatches first, if fertile. Figure4 shows little variation of (scaled) length at birth for k < 1. The variation is larger,however, for larger values of ub
H . The size of neonates of trout and salmon, was foundto increase with the initial egg size [6,12], suggesting that k < 1 for samonids. Thisalso applies to the emu [5], and probably represents a general pattern.
7 Discussion
The standard DEB model implies von Bertalanffy growth curves for post-embryonicstages at constant food levels. Its three parameters at several (>1) food levels, incombination with the length at puberty and the maximum reproduction rate (so fora fully grown adult) at abundant food, determine the values of seven parameters:allocation fraction κ , energy investment ratio g, maturity maintenance rate coefficient
123

392 S. A. L. M. Kooijman
k J , somatic maintenance rate coefficient kM , energy conductance v, scaled maturity atbirth U b
H , scaled maturity at puberty U pH [23]. I here provided an efficient algorithm to
obtain the scaled initial reserve U 0E and age at birth ab from six of the seven parameters.
This is remarkable, because no measurements of food intake are required, for instance,to access the scaled cost of eggs. No advanced data is required for practical applicationof the theory.
The significance of this for energetics is that, in combination with the measuredinitial mass ME , the scaled initial amount of reserve U 0
E gives access to the surfacearea specific maximum assimilation flux { JE Am} = M0
E/U 0E [23]. Knowledge about
this key parameter is essential to make the step from compound to primary DEB para-meters. In combination with the measured maximum surface area-specific food uptakerate { JX Am}, the digestion efficiency yields, for instance, via yEV = { JE Am}/{ JX Am}.This procedure circumvents the problem of accessing the digestion efficiency via thedifference of ingested food and excreted faeces: the gut micro-flora takes its share,so part of the difference never entered the animal. In combination with the measuredmass at birth, knowledge of U 0
E gives access to the yield of structure on reserve yV E ,see [23]. These applications of the theory show that the embryo can reveal valuableinformation about the juvenile and adult stages, as the title suggests.
The relationship between the initial amount of reserve and budget parameters hasmany consequences, and some of them are quite unexpected (at least for me). Sometoxic compounds, for instance, have the effect of increasing the cost of synthesisof structure, which is a component of the energy investment ratio g. This has theindirect effect of decreasing the allocation to reproduction, since food uptake increaseswith size over the life cycle. However, it also reduces the initial amount of reserve(by decreasing the amount of structure at birth). This has the overall effect that thereproduction rate, i.e. the ratio of the reserve allocated to reproduction and the initialamount of reserve, can increase for increasing concentrations of toxic compound, aslong as these concentrations are low. This seemingly stimulating effect on reproductionthat some toxic compounds can have at low concentrations is well know in practice,especially in the Daphnia reproduction test, as standardised by the OECD and the ISO[21,22]. The phenomenon is known as hormesis, but the mechanisms are typicallyenigmatic. The present analysis reveals a potential mechanism that needs experimentalverification.
All computations that are discussed in this paper have been included in the freelydown-loadable package DEBtool (Octave and Matlab): http://www.bio.vu.nl/thb/deb/deblab/debtool. Toolbox animal has functions get_lb, get_ue0 and get_tbto obtain lb, u0
E and τb from κ , k, ubH g and eb. Earlier versions of DEBtool used a
shooting method for (UE , L , UH ) (so in three dimensions) to find the scaled cost ofan egg U 0
E . The substantial computational effort of this method slowed down (para-meter estimation) routines that frequently require the evaluation of reproduction rates.On the basis of the results mentioned in this paper these DEBtool routines are nowreplaced and are both more accurate and orders of magnitude faster, at least for somecombinations of parameter values.
Acknowledgments I like to thank the AQUAdeb Group, Odo Diekmann, Roger Nisbet and Tjalling Jagerfor helpful suggestions and discussions.
123

What the egg can tell about its hen: Embryonic development 393
References
1. Alda Alvarez, O., Jager, T., Marco Redondo, E., Kammenga, J.E.: Assessing physiological modes ofaction of toxic stressors with the nematode Acrobeloides nanus. Environ. Toxicol. Chem. 25, 3230–3237 (2006)
2. Benton, T.G., Plaistow, S.J., Beckerman, A.P., Lapsley, C.T., Littlejohns, S.: Changes in maternalinvestment in eggs can affect population dynamics. Proc. R. Soc. 272, 1351–1356 (2005)
3. Bertram, D.F., Strathmann, R.R.: Effects of maternal and larval nutrition on growth and form ofplanktotrophic larvae. Ecology 79, 315–327 (1998)
4. Deeming, D.C., Birchard, G.F.: Allometry of egg and hatcling mass in birds and reptiles: roles ofdevelopmental maturity, eggshell structure and phylogeny. J. Zool. 271, 78–87 (2007)
5. Dzialowski, E.M., Sotherland, P.R.: Maternal effects of egg size on emu Dromaius novaehollandiaeegg composition and hatchling phenotype. J. Exp. Biol. 207, 597–606 (2004)
6. Einum, S., Fleming, I.A.: Maternal effects of egg size in brown trout (Salmo trutta): norms of reactionto environmental quality. Proc. Biol. Sci. 266(1433), 2095–2095 (1999)
7. Finkler, M.S., Orman, J.B.v., Sotherland, P.R.: Experimental manipulation of egg quality in chickens:influence of albumen and yolk on the size and body composition of near-term embryos in a precocialbird. J. Comp. Physiol. B 168, 17–24 (1998)
8. Flye Sainte Marie, J.: Ecophysiology of brown ring disease in the manila clam Ruditapes philippinarum,experimental and modelling approaches. Ph.D. thesis, Brest University and Vrije Universiteit, Brestand Amsterdam (2008)
9. Glazier, D.S.: Effects of food, genotype, and maternal size and age on offspring investment in DaphniaMagna. Ecology 73(3), 910–926 (1992)
10. Gliwicz, Z.M., Guisande, C.: Family planning in Daphnia: resistance to stravation in offspring bornto mothers grown at different food levels. Oecologia 91, 463–467 (1992)
11. Hart, M.W.: What are the costs of small egg size for a marine invertebrate with feeding planktoniclarvae? Am. Nat. 146, 415–426 (1995)
12. Heath, D.D., Fox, C.W., Heath, J.W.: Maternal effects on offspring size: variation through early deve-lopment of chinook salmon. Evolution 53(5), 1605–1611 (1999)
13. Huggett, A.S.G., Widdas, W.F.: The relationship between mammalian foetal weight and conceptionage. J. Physiol. (Lond.) 114, 306–317 (1951)
14. Jager, T., Heugens, E.H.W., Kooijman, S.A.L.M.: Making sense of ecotoxicological test results:towards process-based models. Ecotoxicology 15, 305–314 (2006)
15. Jardine, D., Litvak, M.K.: Direct yolk sac volume manipulation of zebrafish embryos and the relation-ship between offspring size and yolk sac volume. J. Fish Biol. 63, 388–397 (2003)
16. Ji, X., Du, W.G., Xu, W.Q.: Experimental manipulation of eggs size and hatling size in the cobra, Najanaja atra (Elapidae). Neth. J. Zool. 49, 167–175 (1999)
17. Kooijman, S.A.L.M.: Energy budgets can explain body size relations. J. Theor. Biol. 121, 269–282 (1986)
18. Kooijman, S.A.L.M.: What the hen can tell about her egg; egg development on the basis of budgets.J. Math. Biol. 23, 163–185 (1986)
19. Kooijman, S.A.L.M.: Dynamic Energy and Mass Budgets in Biological Systems. Cambridge Univer-sity Press, Cambridge (2000)
20. Kooijman, S.A.L.M., Baas, J., Bontje, D., Broerse, M., Jager, T., Gestel, C.v., Hattum, B.v.: Scalingrelationships based on partition coefficients and body sizes have similarities and interactions. SAR andQSAR in Environ. Res. (2007)
21. Kooijman, S.A.L.M., Bedaux, J.J.M.: Analysis of toxicity tests on Daphnia survival and reproduc-tion. Water Res. 30, 1711–1723 (1996)
22. Kooijman, S.A.L.M., Bedaux, J.J.M., Péry, A.R.R., Jager, T.: Biology-based methods. In: Magaud, H.(ed.) Current Approaches in the Statistical Analysis of Ecotoxicity Data: A Guidance to Application.Series on Testing Assessment, vol. 54, TC 147/ SC 5/ WG 10/ N0390, Chap. 7. ISO and OECD, Paris(2006)
23. Kooijman, S.A.L.M., Sousa, T., Pecquerie, l., Meer, J.v.d., Jager, T.: From food-dependent statisticsto metabolic parameters, a practical guide to the use of dynamic energy budget theory. Phil. Trans. R.Soc. B (submitted) (2008)
24. Kooijman, S.A.L.M., Troost, T.A.: Quantitative steps in the evolution of metabolic organisation asspecified by the dynamic energy budget theory. Biol. Rev. 82, 1–30 (2007)
123

394 S. A. L. M. Kooijman
25. Loman, J.: Microevolution and maternal effects on tadpole Rana temporaria growth and developmentrate. J. Zool. 257(01), 93–99 (2002)
26. McIntyre, G., Gooding, R.: Egg size, contents, and quality: maternal-age and-size effects on house flyeggs. Can. J. Zool./Rev. Can. Zool 78(9), 1544–1551 (2000)
27. Morley, S.A., Batty, R.S., Geffen, A.J., anf Tytler, P.: Egg size manipulation: a technique for inves-tigating maternal effects on the hatching characteristics of herring. J. Fish Biol. 55(suppl A), 233–238 (1999)
28. Nager, R.G., Monaghan, P., Houston, D.C.: Within-clutch trade-offs between the number and qualityof eggs: experimental manipulations in gulls. Ecology 81, 1339–1350 (2000)
29. Nager, R.G., Monaghan, P., Houston, D.C., Arnold, K.E., Blount, J.D., Berboven, N.: Maternal effectsthrough the avian egg. Acta Zool. Sin. 52(suppl), 658–661 (2006)
30. Reznick, D., Callahan, H., Llauredo, R.: Maternal effects on offspring quality in poeciliid fishes. Integr.Comp. Biol. 36(2), 147 (1996)
31. Rossiter, M.C.: Environmentally-based maternal effects: a hidden force in insect population dyna-mics? Oecologia 87(2), 288–294 (1991)
32. Rossiter, M.C.: Maternal effects generate variation in life history: consequences of egg weight plasticityin the gypsy moth. Funct. Ecol. 5(3), 386–393 (1991)
33. Sinervo, B.: The evolution of maternal investments in lizards: an experimental and comparative analysisof egg size and its effects on offspring performance. Evolution 44, 279–294 (1990)
34. Sousa, T., Domingos, T., Kooijman, S.A.L.M.: From empirical patterns to theory: a formal metabolictheory of life. Phil. Trans. R. Soc. B (2007) (to appear)
35. Warham, J.: The crested penguins. In: Stonehouse, B. (ed.) The Biology of Penguins, pp. 189–269.MacMillan, London (1975)
36. Yoshinaga, T., Hagiwara, A., Tsukamoto, K.: Effect of periodical starvation on the survival of offspringin the rotifer Brachionus plicatilis. Fish. Sci. 67, 373–374 (2001)
37. Zonneveld, C.: Animal energy budgets: a dynamic approach. Ph.D. thesis, Vrije Universiteit (1992)38. Zonneveld, C., Kooijman, S.A.L.M.: Comparative kinetics of embryo development. Bull. Math.
Biol. 3, 609–635 (1993)
123