what promotes the use of ict in pursuing equitable and
TRANSCRIPT

What promotes the use of ICT in pursuing equitable and quality education?
NIER International Symposium on Education Reform, FY2020 (Online)February 16th, 2021, 13:10-14:30 Part 1(Research findings)“Evidence and implications for the realization of equitable and quality education through the help of ICT”
Professor TSUYUGUCHI KenjiGraduate School of Education, Ehime University Visiting Researcher, NIER

Introduction
●School closure in response to COVID-19: The state of emergency was issued in the evening of April 16th. From then onwards, 25,223 schools in 1,213 local authorities nationwide were temporarily closed.
●The impact of COVID-19 on children (Tsuyuguchi 2000)Damages on career capitals: human capital(competencies), psychological capital(self-
efficacy, optimism, hope, and so forth), health capital (physical and mental health) and social capital (human relationships) ⇒ People in lower socio-economic status tend to suffer more severely and face
challenges in recovery (MUFG 2020; OECD 2020).
2

Introduction●The use of ICT as a means to reduce the negative impacts of temporary school closure (online home learning between April and June 2020)
Among the boards of education that implemented temporary closures, 5% of them had a policy to introduce simultaneous, interactive online teaching as of April 16th
(implemented at 8% of elementary schools and 10% of lower secondary schools as of June 23rd), and 29% of them had a polity to use digital textbooks and teaching materials (used at 34% of elementary schools and 36% of lower secondary schools as of June 23rd).
●Improved ICT use driven by the GIGA school project (the use of ICT in education in November through December 2020)
The GIGA school project, a Japanese version of the OLPC (One Laptop per Child) project, was introduced in 2019 and the development of hardware and network environment is underway nationwide. The aims of the project are to deepen and transform learning and to develop competencies of children by deploying ICT in classroom teaching, personalized learning, and collaborative learning.
Online home learning and educational ICT use vary among municipalities and schools.
3

Previous research●The educational effects of ICT use ■Positive effects have been reported more often for low achievers, students with special needs, boys, elementary school students, and the use in other forms of teaching than traditional classroom teaching and the use in inquiry learning. Educational effects are observed under certain conditions (Falck et al. 2018; Li & Ma 2010).
■A hybrid model of online and face-to-face learning yields a greater learning effect than either method alone. The educational effects of online and face-to-face models are about the same but lower than that of a hybrid model (U.S. Department of Education 2010).
■In order to increase the effectiveness of ICT in education, it is essential to assign trained teachers and to have it reflected in the curriculum (Banerjee et al. 2007; Rouse & Kruger 2004).
4
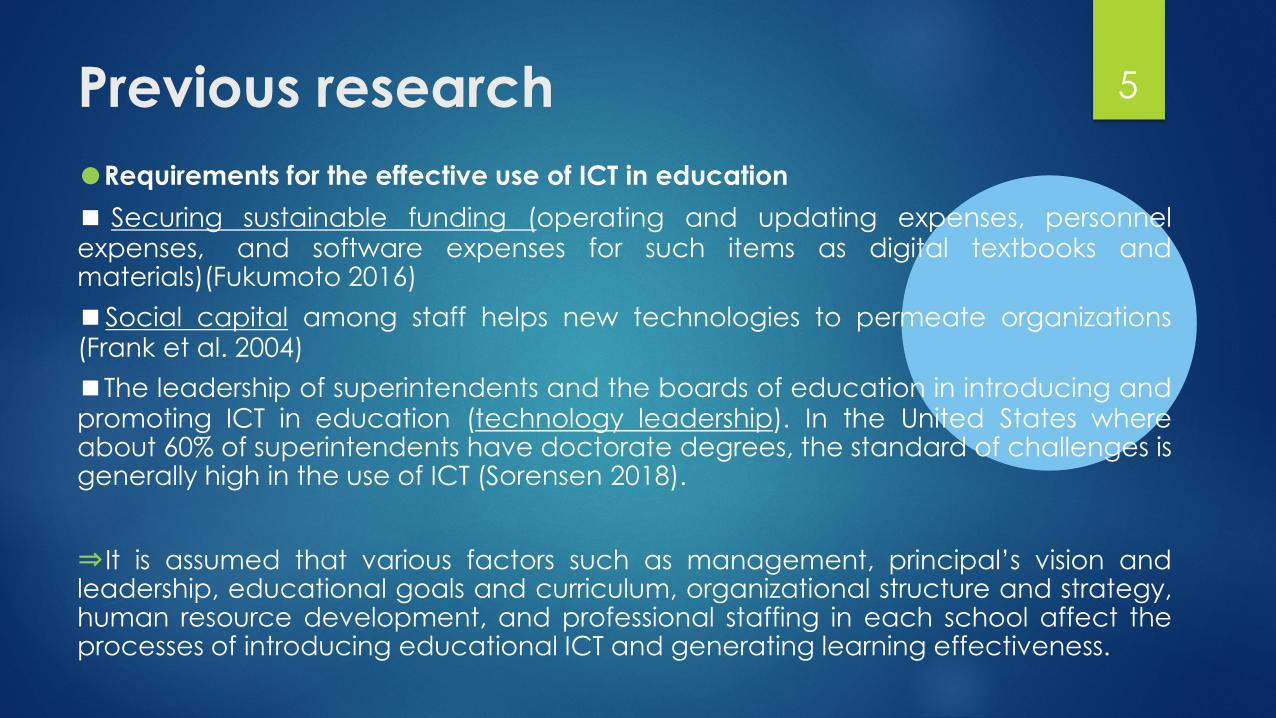
Previous research●Requirements for the effective use of ICT in education ■ Securing sustainable funding (operating and updating expenses, personnelexpenses, and software expenses for such items as digital textbooks andmaterials)(Fukumoto 2016)■Social capital among staff helps new technologies to permeate organizations(Frank et al. 2004)■The leadership of superintendents and the boards of education in introducing andpromoting ICT in education (technology leadership). In the United States whereabout 60% of superintendents have doctorate degrees, the standard of challenges isgenerally high in the use of ICT (Sorensen 2018).
⇒It is assumed that various factors such as management, principal’s vision andleadership, educational goals and curriculum, organizational structure and strategy,human resource development, and professional staffing in each school affect theprocesses of introducing educational ICT and generating learning effectiveness.
5

Objectives and research questions of this study●This study aims to discover driving factors for online home learning and for the use of ICT in education (learning, assessment, in-service training, and school affairs and administration) by conducting exploratory analyses.
RQ1: What are the driving factors that enabled schools to provide online home learning during school closure and immediately after the reopening of schools in response to COVID-19? [April to June 2020]RQ2: What are the factors that enabled proactive use of ICT in schools? [November to December 2020]
6

Analytical model perspectives●Socio-economic environment: Population size and financial strength of municipalities
●Educational environment: Academic standards and student behavior issues
●Leadership: Visions and leadership of superintendents (principals)
● Social capital: Relationships among stakeholders in policy-making and management processes
●Human resources: Key figures and support staffing
7
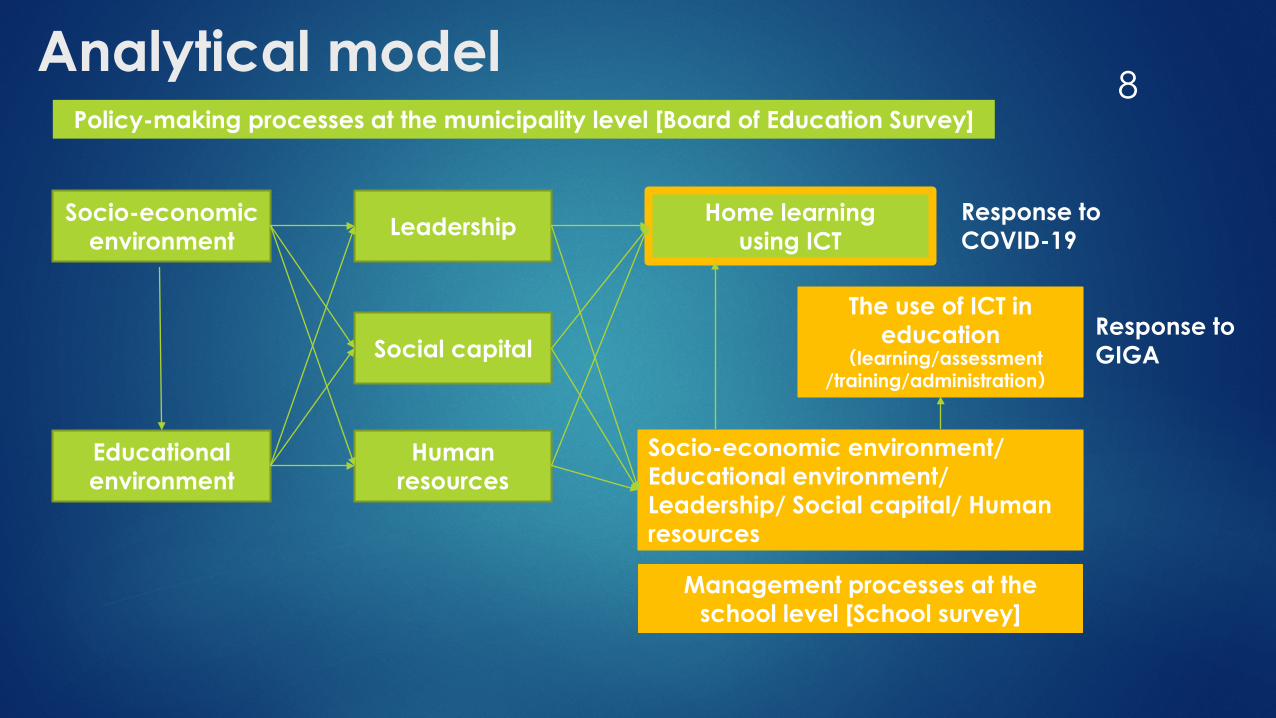
Analytical model
Home learning using ICT
Socio-economic environment
Educational environment
Leadership
Social capital
Human resources
Policy-making processes at the municipality level [Board of Education Survey]
Socio-economic environment/ Educational environment/ Leadership/ Social capital/ Human resources
Management processes at the school level [School survey]
The use of ICT in education
(learning/assessment /training/administration)
Response to COVID-19
Response to GIGA
8

Data●“Web Survey on ICT Use in Education”, NIER (November-December 2020)
800 municipal boards of education selected from 1,741 municipal boards nationwide by stratified random sampling.
2,503 elementary and lower secondary schools randomly selected from the schools in the jurisdiction of the sampled boards of education (the sampling number varies depending on the total number of schools in each municipality).
The response rates are 49.4%(395/800) for the superintendents of education, 51.9%(415/800) for the supervisors of school education, 45.2% (692/1531) for the principals of elementary schools, and 45.2% %(374/972) for the principals of lower secondary schools.● “ Survey on the modes of teaching and learning in public schools during temporary school closure in response to COVID-19(as of April16th, 2020)”, MEXT, municipality-level data.
● “ Survey on the modes of teaching and learning in public schools in response to the impact of COVID-19 (as of June 23rd, 2020)”, MEXT, municipality-level data. ● “ Survey on educational digitalization at schools (FY2019)”, MEXT, municipality-level data.
● “National Assessment of Academic Ability (FY2013-1019)”, MEXT, municipality-level data.
● “ The School Basic Survey (FY2020)”, MEXT, municipality-level and school-level data.
● Socio-economic statistics, municipality-level data.
9
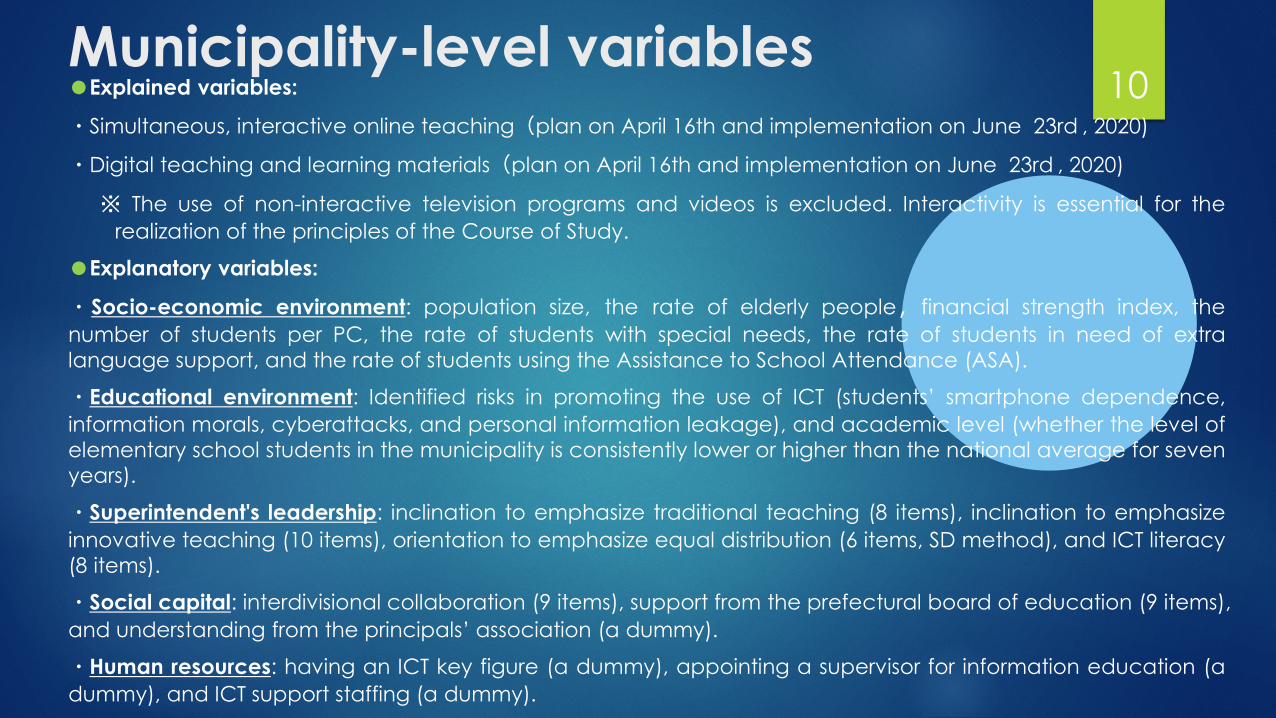
Municipality-level variables●Explained variables:
・Simultaneous, interactive online teaching(plan on April 16th and implementation on June 23rd , 2020)
・Digital teaching and learning materials(plan on April 16th and implementation on June 23rd , 2020)
※ The use of non-interactive television programs and videos is excluded. Interactivity is essential for therealization of the principles of the Course of Study.
●Explanatory variables:
・Socio-economic environment: population size, the rate of elderly people,financial strength index, thenumber of students per PC, the rate of students with special needs, the rate of students in need of extralanguage support, and the rate of students using the Assistance to School Attendance (ASA).
・Educational environment: Identified risks in promoting the use of ICT (students’ smartphone dependence,information morals, cyberattacks, and personal information leakage), and academic level (whether the level ofelementary school students in the municipality is consistently lower or higher than the national average for sevenyears).
・Superintendent's leadership: inclination to emphasize traditional teaching (8 items), inclination to emphasizeinnovative teaching (10 items), orientation to emphasize equal distribution (6 items, SD method), and ICT literacy(8 items).
・Social capital: interdivisional collaboration (9 items), support from the prefectural board of education (9 items),and understanding from the principals’ association (a dummy).
・Human resources: having an ICT key figure (a dummy), appointing a supervisor for information education (adummy), and ICT support staffing (a dummy).
10
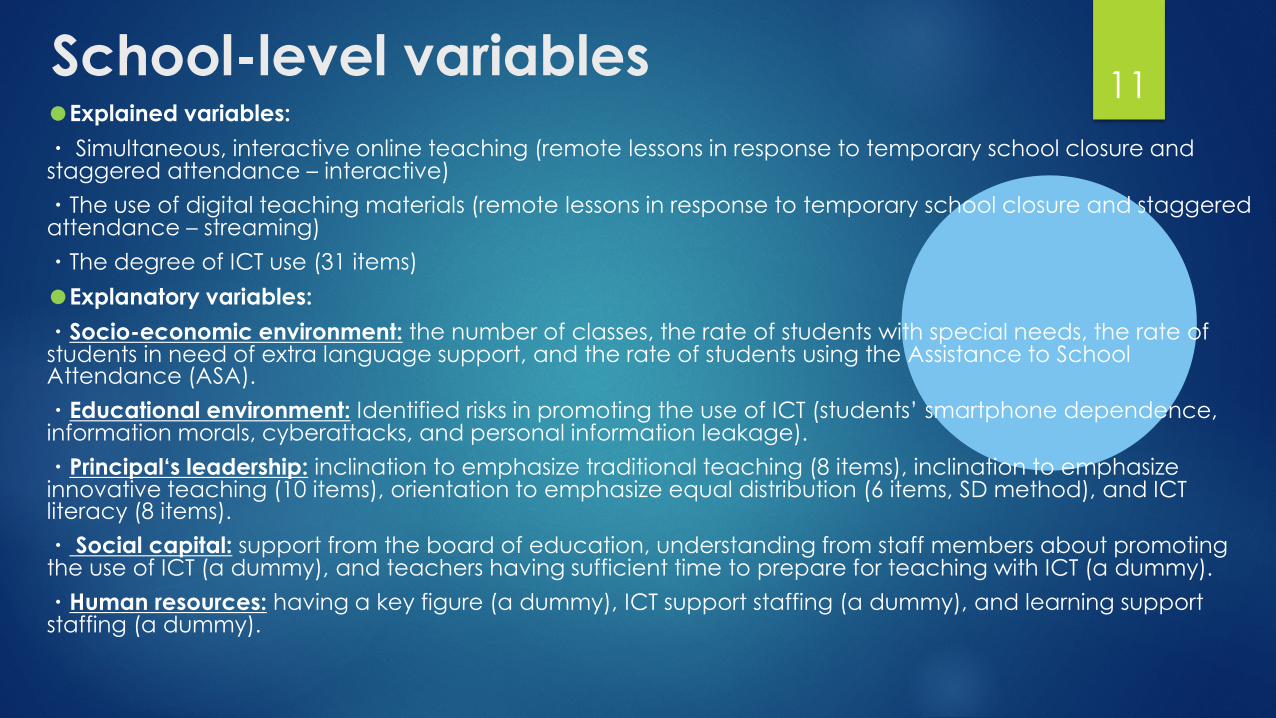
School-level variables●Explained variables: ・ Simultaneous, interactive online teaching (remote lessons in response to temporary school closure and staggered attendance – interactive)・The use of digital teaching materials (remote lessons in response to temporary school closure and staggered attendance – streaming)・The degree of ICT use (31 items)●Explanatory variables:・Socio-economic environment: the number of classes, the rate of students with special needs, the rate of students in need of extra language support, and the rate of students using the Assistance to School Attendance (ASA).・Educational environment: Identified risks in promoting the use of ICT (students’ smartphone dependence, information morals, cyberattacks, and personal information leakage).・Principal‘s leadership: inclination to emphasize traditional teaching (8 items), inclination to emphasize innovative teaching (10 items), orientation to emphasize equal distribution (6 items, SD method), and ICT literacy (8 items). ・ Social capital: support from the board of education, understanding from staff members about promoting the use of ICT (a dummy), and teachers having sufficient time to prepare for teaching with ICT (a dummy). ・Human resources: having a key figure (a dummy), ICT support staffing (a dummy), and learning support staffing (a dummy).
11

Analytical strategy[Municipality-level data]The sample used for analysis: both superintendent and supervisor responded to the survey of the municipal boards of education and the superintendent had at least 0.5 years of experience.N=326.Analysis method: logistic regression analysis
[School-level data]The sample used for for analysis: N=1066. Analysis method: logistic regression analysis,ordinary least squares (OLS),two-stage least squares (2SLS), and quantile regression analysis.
IMB SPSS Statistics ver.27(Statistics Base, Regression,Categories)
12

Descriptive statistics [municipality-level data]Variable groups Variables M SD Min. Max.
Explained variables
Simultaneous, interactive online teaching 4/16 .05 .22 .00 1.00Simultaneous, interactive online teaching 6/ 23 .11 .32 .00 1.00The use of digital teaching materials 4/16 .23 .42 .00 1.00The use of digital teaching materials 6/23 .44 .50 .00 1.00
Socio-economicenvironment
Population size .00 1.00 -.48 9.44The rate of elderly people 30.88 6.58 15.75 53.66Financial strength index .56 .28 .12 1.52The number of students per PC 6.09 3.04 .49 14.76The rate of SEN below 5% .39 .49 .00 1.00The rate of language support 0% .36 .48 .00 1.00The rate of ASA below 5% .15 .36 .00 1.00
Educational environment
Smartphone dependence .34 .48 .00 1.00Information morals .24 .43 .00 1.00Cyberattacks .06 .23 .00 1.00Personal information leakage .18 .39 .00 1.00Academic level consistently lower .14 .34 .00 1.00Academic level consistently higher .16 .36 .00 1.00
Superintendent's leadership
Inclination to emphasize traditional teaching .01 1.04 -4.42 1.96Inclination to emphasize innovative teaching .03 .98 -1.60 3.74Orientation to emphasize equal distribution -.04 1.00 -2.59 1.39ICT literacy -.01 1.01 -3.75 3.81
Social capitalInterdivisional collaboration .01 1.00 -1.46 1.66Support from the prefectural board of education .01 1.01 -.79 2.52Understanding from the principals’ association .86 .35 .00 1.00
Human resourcesHaving a key figure .67 .47 .00 1.00Appointing a supervisor for information education .64 .48 .00 1.00ICT support staffing .53 .50 .00 1.00
Note. N=326.
13
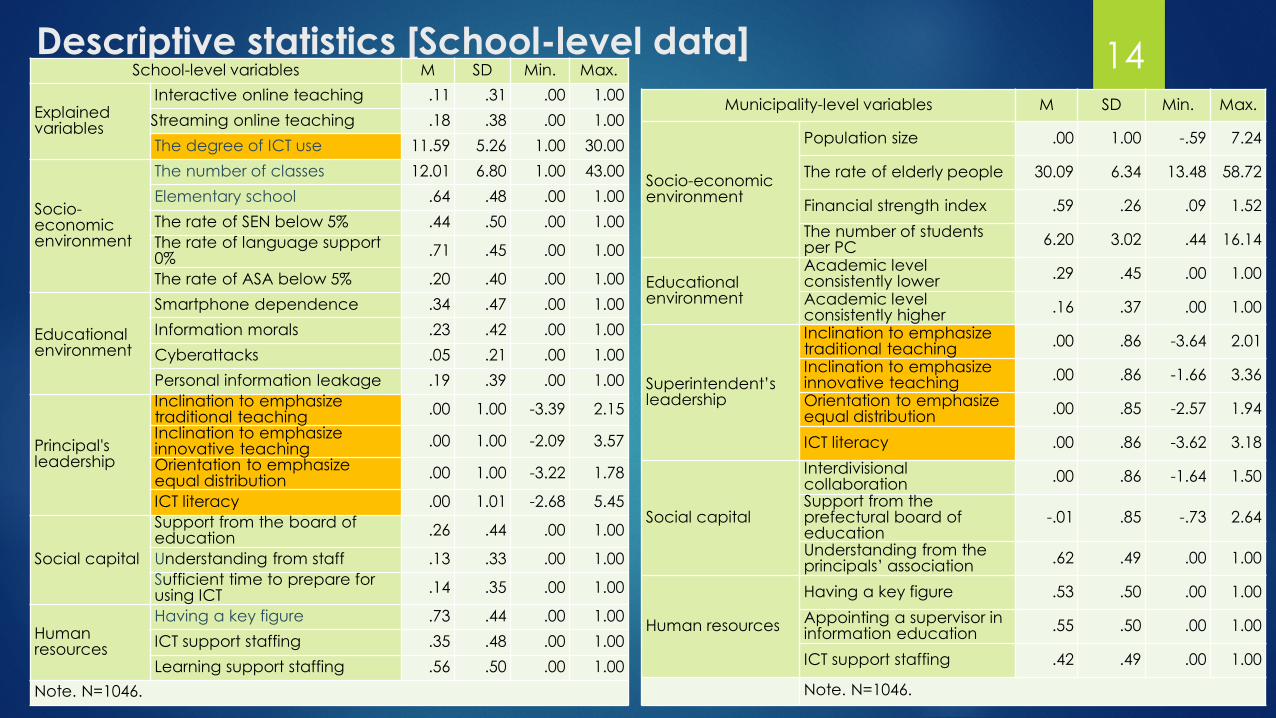
Descriptive statistics [School-level data]School-level variables M SD Min. Max.
Explainedvariables
Interactive online teaching .11 .31 .00 1.00Streaming online teaching .18 .38 .00 1.00The degree of ICT use 11.59 5.26 1.00 30.00
Socio-economic environment
The number of classes 12.01 6.80 1.00 43.00Elementary school .64 .48 .00 1.00The rate of SEN below 5% .44 .50 .00 1.00The rate of language support 0% .71 .45 .00 1.00
The rate of ASA below 5% .20 .40 .00 1.00
Educationalenvironment
Smartphone dependence .34 .47 .00 1.00Information morals .23 .42 .00 1.00Cyberattacks .05 .21 .00 1.00Personal information leakage .19 .39 .00 1.00
Principal's leadership
Inclination to emphasize traditional teaching .00 1.00 -3.39 2.15Inclination to emphasize innovative teaching .00 1.00 -2.09 3.57Orientation to emphasize equal distribution .00 1.00 -3.22 1.78
ICT literacy .00 1.01 -2.68 5.45
Social capital
Support from the board of education .26 .44 .00 1.00
Understanding from staff .13 .33 .00 1.00Sufficient time to prepare for using ICT .14 .35 .00 1.00
Human resources
Having a key figure .73 .44 .00 1.00ICT support staffing .35 .48 .00 1.00Learning support staffing .56 .50 .00 1.00
Note. N=1046.
Municipality-level variables M SD Min. Max.
Socio-economic environment
Population size .00 1.00 -.59 7.24
The rate of elderly people 30.09 6.34 13.48 58.72
Financial strength index .59 .26 .09 1.52The number of students per PC 6.20 3.02 .44 16.14
Educationalenvironment
Academic level consistently lower .29 .45 .00 1.00Academic level consistently higher .16 .37 .00 1.00
Superintendent’s leadership
Inclination to emphasize traditional teaching .00 .86 -3.64 2.01Inclination to emphasize innovative teaching .00 .86 -1.66 3.36Orientation to emphasize equal distribution .00 .85 -2.57 1.94
ICT literacy .00 .86 -3.62 3.18
Social capital
Interdivisional collaboration .00 .86 -1.64 1.50Support from the prefectural board ofeducation
-.01 .85 -.73 2.64
Understanding from the principals’ association .62 .49 .00 1.00
Human resources
Having a key figure .53 .50 .00 1.00Appointing a supervisor in information education .55 .50 .00 1.00
ICT support staffing .42 .49 .00 1.00
Note. N=1046.
14

Items used to measure the degree of ICT use [School-level data]Items regarding teaching and learning The rate of
using (%)Presenting information (digital textbooks and videos) in each subject lesson 85.1Developing information literacy through acquiring basic computer skills such as keyboard input* 84.7Promoting students’ survey and research activities 83.0Developing information literacy regarding information morals and information security* 66.2Developing information literacy through programming way of thinking* 60.3Enriching cross-curricular and comprehensive lessons and learning activities that facilitate exploratory
"views and ideas" 54.6
Establishing the basics for students 51.2Promoting collaborative learning such as presentations and discussions, collaborative opinion sorting, and
collaborative production 48.7
Developing abilities for problem finding and solving* 46.2Enriching lessons and learning activities that facilitate "views and ideas“ of each subject 44.6Developing language abilities* 41.7Learning support tailored to each student’s depth of learning 28.0Remote lessons in response to temporarily school closure and staggered attendance – streaming 17.6Remote communications with people in distant places such as other schools, districts, and overseas 13.5Remote lessons in response to temporarily school closure and staggered attendance – interactive 10.7Remote lessons for remote or small schools – interactive 4.2Remote lessons in response to school non-attendance and “hospital classrooms” - streaming 3.8Remote lessons in response to school non-attendance and “hospital classrooms” - interactive 3.3Remote learning support or advisory activities by learnings support staff 2.0Remote lessons for remote or small schools – streaming 1.0
15

Items used to measure the degree of ICT use [School-level data]Items regarding school affairs and administration The rate of
using (%)
Improving efficiency in the preparations for lessons 59.8Lessons given by teachers in demonstration lessons and in-school training for teachers 59.4Promoting and improving efficiency in learning data management and sharing (including the
cases of data input by students) 56.4
Promoting and improving efficiency in health data management and sharing (including the cases of data input by students) 44.4
Students’ learning activities in demonstration lessons and in-school training for teachers 41.7Enriching assessment 40.4Prior training and posterior training (including referring to worksheets and reviewing records) 33.2Promoting and improving efficiency in information sharing about students in need of special
considerations 32.2
Improving efficiency in marking 23.9Promoting and improving efficiency in everyday communications between school staff and
students/parents 14.5
Encouraging students and anonymous users to send SOS messages and promoting the sharing of such information with school staff 2.3
The histogram for the degree of ICT use based on the 31 items
16
Frequency
The degree of ICT use

Superintendents’(Principals’) inclination to emphasize traditional/innovative teaching
Superintendents Principals
Items M SD M SD
Trad
itional
Telling students to follow classroom rules 4.11 .93 4.40 .75Calming students who are disruptive 4.11 .92 4.35 .77Telling students to listen to what teachers say 3.62 1.14 4.01 .96Telling students to quieten down quickly when the lesson begins 3.34 1.14 3.62 1.13Setting goals at the beginning of lesson 4.52 .74 4.69 .60Transferring knowledge written in the textbooks 3.45 .95 3.53 .90Explaining what teachers expect the students to learn 4.02 .92 4.09 .90Presenting a summary of content recently learned 3.59 .93 3.53 .95
Innovative
Presenting tasks for which there is no obvious solution 3.17 1.08 3.08 1.03Giving tasks that require students to think critically 3.28 1.04 3.25 .97Letting students experience learning that combines science and art to help find and solveproblems in the society 3.82 .91 3.63 .88
Giving students projects that require at least one week to complete 2.36 .91 2.30 .87Having students work in small groups to come up with a joint solution to a problem or task 4.13 .85 4.13 .79Asking students to decide on their own procedures for solving complex tasks 3.56 .87 3.61 .85Letting students use ICT for projects or class work 3.82 .81 3.74 .85Letting students practice similar tasks until it is confirmed that every student has understood thesubject matter 3.09 1.03 3.02 .98
Explaining how new and old topics are related 3.56 .99 3.61 .97Referring to a problem from everyday life or work to demonstrate why new knowledge is useful 3.96 .84 3.94 .85
17

AClose to A Somewhat
close to ASomewhat close to B
Close to BB
A:It is important to treat all students the same way regardless of their characteristics.
0.3( 1.1)
3.7( 3.4)
40.5(42.3)
55.5(53.2)
B:It is important to treat students differently depending on each student’s characteristics.
A:It is important to provide all students with the equal amounts of resources.
11.7( 9.3)
22.4(29.3)
42.6(44.1)
23.3(17.3)
B:It is important to provide students from socio-economically disadvantaged backgrounds with extra resources even if additional public spending is required.
A:It is important for teachers to teach students by spending their lesson time equally on each of them.
8.9(10.6)
46.3(43.0)
31.0(40.2)
13.8( 6.2)
B:It is important for teachers to give extra teaching to students from socio-economically disadvantaged backgrounds even if they need to spend disproportionally more of their lesson time on those students.
A:It is important for teachers to respond to students by spending their out-of-lesson time equally on each of them.
5.8( 1.0)
27.0( 5.2)
48.2(54.6)
19.0(39.3)
B:It is important for teachers to provide extra support to students from socio-economically disadvantaged backgrounds even if they need to spend disproportionally more of their out-of-lesson time on those students.
A:It is important for all students to learn at the same rate.
1.2( 1.0)
4.6( 5.2)
48.2(54.6)
46.0(39.3)
B:It is important for every student to learn at their own rate depending on their motivation and proficiency levels.
A:When it becomes necessary to introduce new ICT in education, it is important to do so after setting up the overall environment so as not to create disparities between schools.
22.7(19.1)
24.8(25.6)
30.7(30.5)
21.8(24.8)
B:When it becomes necessary to introduce new ICT in education, it is important for well-prepared schools to do so promptly, even if it leads to disparities between schools for the time being.
Superintendents’(Principals’) orientation to emphasize equal distribution
※ In order to create a variable for orientation to emphasize equal distribution, we adopted a categorical principal component score by assigning 4 to “close to A”, 3 to “somewhat close to A”, 2 to “somewhat close to B”, and 1 to “close to B”.
18
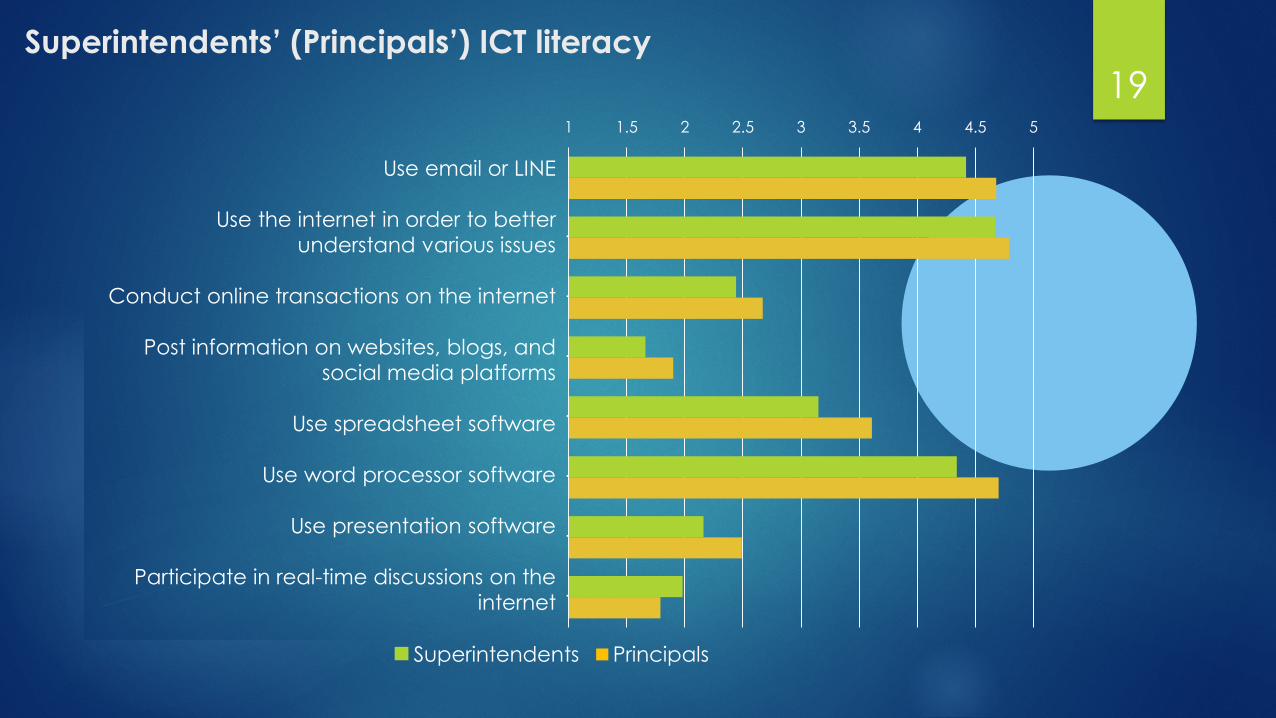
Superintendents’ (Principals’) ICT literacy
1 1.5 2 2.5 3 3.5 4 4.5 5
・電子メールやLINEを使って連絡を取ること
・様々な事柄についての理解を深めるためにインターネット…
・商品やサービスの売買、銀行取引などをインターネットで…
・SNS(Facebook,Twitter等のソーシャル・ネットワーキ…
・例えばエクセルのような表計算ソフトを使って計算したり…
・例えばワードのようなワープロソフトを使って文書を作成…
・例えばパワーポイントのようなプレゼンテーションソフト…
・例えばオンライン会議やチャットなど,インターネットで…
教育長 校長
19
Use email or LINE
Use the internet in order to better understand various issues
Conduct online transactions on the internet
Post information on websites, blogs, and social media platforms
Use spreadsheet software
Use word processor software
Use presentation software
Participate in real-time discussions on the internet
■Superintendents ■Principals

Result1:Municipality-level data(logistic regression analysis N=326, extract)
Simultaneous, interactive online teaching
The use of digital teaching materials
April 16th June 23rd April 16th June 23rd
Variables B Exp(B) B Exp(B) B Exp(B) B Exp(B)Population size .586* 1.797Financial strength index 3.017* 20.430 1.983* 7.262 2.842** 17.148The number of students per PC -.406** .666 -.176** .839Smartphone dependence (d) -.871* .419Private information leakage(d) 1.456* 4.291 1.100* 3.004Academic level consistently high(d) 1.647* 5.191
Superintendent's inclination to emphasize traditional teaching
.178* 1.194 .514** 1.673
Understanding from the principals’ association (d)
1.136* 3.115
Having a key figure(d) 3.335* 28.065Appointing a supervisor for information education
1.194* 3.301
The proportion of variance accounted for(Nagelkerke R2)
.356 .366 .345 .309
①①② ②
③
④
⑤
20

Financial strength index × PC deployment × Online home learning
21
Simultaneous, interactive online
teaching 6/23
● No● Yes
The use of digital teaching materials
6/23
● No● Yes
Financial strength indexFinancial strength indexThe num
ber of students per PC
The number of students per PC

Result 2:School-level data (logistic regression analysis, N=1046, extract)
Online home learning in November
logistic regression analysis
Interactive streaming
変数 B Exp(B) B Exp(B)
The number of classes -.061** .940
Smartphone dependence -.763* .466
Principal's inclination to emphasize traditional teaching
-.238** .788
Support from the board of education .487* 1.628
Having a key figure 1.448** 4.253 .716** 2.047
Learning support staffing .527* 1.694 .526** 1.692
Control variables at municipality level Yes Yes
The proportion of variance accounted for (Nagelkerke R2)
.296 .165
0
2
4
6
8
10
12
14
キーパーソン 学習指導員・支援員配置
The implementation rate (%): interactive
無 有
0
5
10
15
20
25
キーパーソン 学習指導員・支援員配置
The implementation rate (%):streaming
無 有
①②③
④
①
⑤
22
Key figure Learning support staffing
■No ■Yes
Key figure Learning support staffing
■No ■Yes

Result 3:School-level data(OLS, 2SLS & quantile regression, N=1046, extract)The degree of ICT use
OLS 2SLS Quantile regression
Quantiles
Variables B B 0.10 0.25 0.50 0.75 0.90
Cyberattack (d) -2.474** -2.459** -2.572** -3.540** -4.120**
Personal information leakage (d) 1.227* 2.208**
Principal's inclination to emphasize innovative teaching
.496*
Principal's orientation to emphasize equal distribution
-.333* -.315* -.686** -.786**
Principal's ICT literacy .406* .399* .508** .514** .430* .515*
Support from the board of education
1.723** 1.714** 1.340** 1.977** 1.823** 1.429** 1.105*
Understanding from staff members 1.393** 1.381** 1.232** 1.361* 1.901** 2.331**
Teachers having sufficient time to prepare for teaching with ICT
1.314** 1.253** 1.037* 1.851** 1.251* 2.373**
Having a key figure (d) 1.087** 1.064** 1.124** .955* 1.416** 1.230**
ICT support staffing (d) .848* .825* .942* 1.533** 1.416**
Learning support staffing .695* .702* .773**
Control variables at municipal level Yes Yes Yes
The proportion of variance accounted for (total)
.182 .178 .097 .082 .107 .124 .143
OLSa group ofvariables
ΔR2 ΔF
Socio-economicenvironment
.003 .554
Educationalenvironment
.007 1.734
Principal'sleadership
.042 11.297**
Social capital .080 31.447**
Human resources .020 7.877**
Municipality-levelvariables
.032 2.435**
Total .182 -
23

Parameter estimates graphs● Driving factors for the group with low degree of ICT use
● Driving factors for the group with high degree of ICT use
● Restraining factors for the group with high degree of ICT use
24
Learning support staffingIdentified risk of personal
information leakage
Principal’s inclination to emphasize innovative teaching ICT support staffing
Identified risk of cyberattacksPrincipal’s inclination to emphasize
innovative teaching

Parameter estimates graphs●Driving factors for a wide range of groups
25
Principal’s ICT literacy Support from the board of education Understanding from staff members
about promoting the use of ICT
Teachers having sufficient time to prepare for teaching with ICT Having a key figure
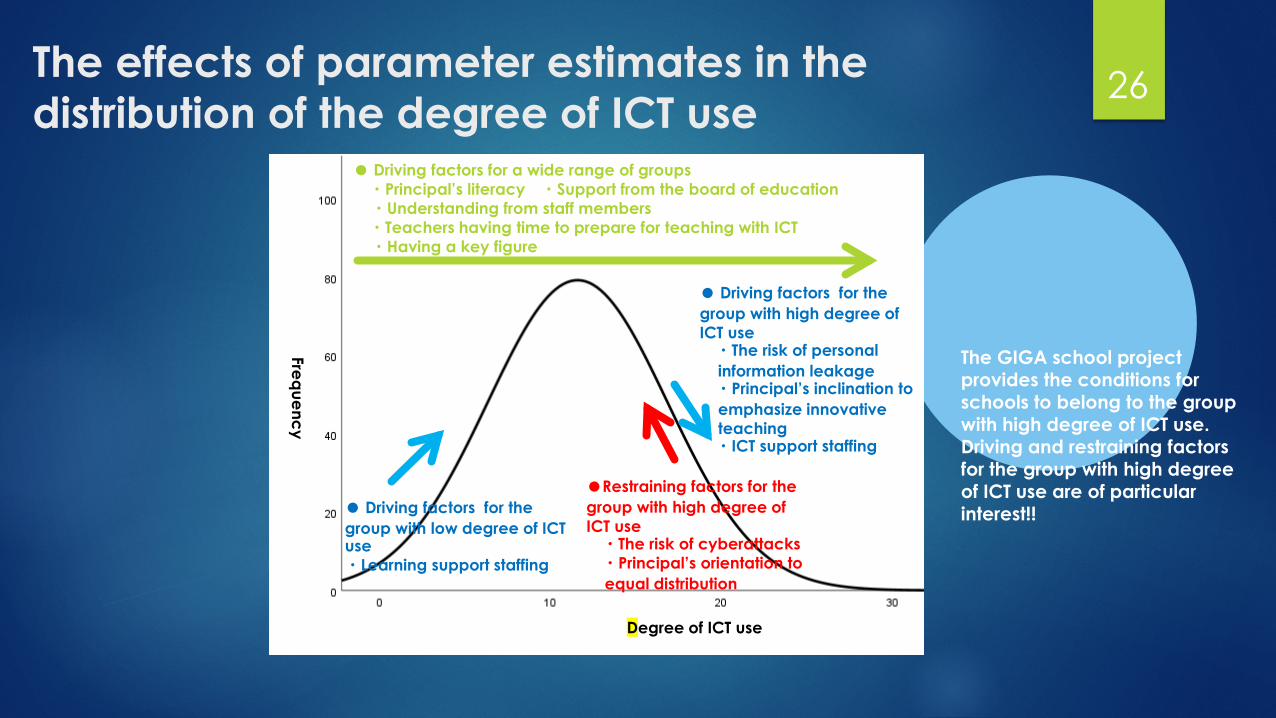
The effects of parameter estimates in the distribution of the degree of ICT use
● Driving factors for the group with low degree of ICT use ・Learning support staffing
● Driving factors for the group with high degree of ICT use・The risk of personalinformation leakage ・Principal’s inclination to emphasize innovative teaching・ICT support staffing
●Restraining factors for the group with high degree of ICT use・The risk of cyberattacks・Principal’s orientation to equal distribution
● Driving factors for a wide range of groups・Principal’s literacy ・Support from the board of education・Understanding from staff members ・Teachers having time to prepare for teaching with ICT・Having a key figure
The GIGA school project provides the conditions for schools to belong to the group with high degree of ICT use. Driving and restraining factors for the group with high degree of ICT use are of particular interest!!
26
Frequency
Degree of ICT use

Summary considerations: online home learning
●RQ1: What are the enabling factors for schools to introduce online home learning during school closure and immediately after the reopening of schools in response to COVID-19?
[from the perspective of the boards of education]①Economic capital of municipalities (population size and financial strength index).②Deployment of PCs. ③Substantial discussions on the protection of personal information.④Superintendents’ inclination to emphasize innovative teaching (problem finding and
solving, critical thinking, creativity, and active learning)⑤Appointing supervisors in information education.
The GIGA school project has the potential to reduce the education disparities derived from the economic capital of municipalities!!
Superintendents’ views on teaching, assignment of supervisors with expertise in information education, and consideration of personal information protection
27

Summary considerations: online home learning●RQ1:What are the enabling factors for schools to introduce online home learning during school closure and immediately after the reopening of schools in response to COVID-19?[from the perspective of schools]
①Human resource allocation is crucial (key figures and support staff).②Support from the board of education is also crucial.③ICT use is less likely to be promoted in schools where principals tend to emphasize the
importance of traditional teaching. ④ICT use is less likely to be promoted in schools where there are concerns about student
guidance problem (smartphone dependence).⑤ICT use is less likely to be promoted in large schools.
ICT leaders and support staff are the key.
ICT use is less likely to be promoted in schools with student behavior issues, large schools, and schools where principals tend to emphasize the importance of traditional teaching.
Further research is needed on how these factors affect the restraint of ICT use.
28

Summary considerations: the degree of ICT use●RQ2: What are the enabling factors for schools to use ICT proactively? [November to December 2020]
・Principals’ leadership(ΔR2=.042) and social capital (ΔR2=.080) play a major role. Less affect from municipality-level variables.
・Driving factors differ depending on the distribution position of the degree of ICT use in schools!! Driving factors for a wide range of schoolsPrincipal’s ICT literacy, support from the board of education, understanding from staff on promoting ICT, teachers having sufficient time to prepare for teaching with ICT, and having a key figure
Driving or restraining factors for schools at a specific distribution positionDriving factors for the group with low degree of use: Appointment of learning advisor and learning support
staffDriving factors for the group with high degree of use: Principal’s inclination to emphasize innovative
teaching, consideration of personal information protection, and ICT support staffingRestraining factors for the group with high degree of use: Principal’s orientation to equal distribution and
cyberattack risks
Realize distributed technology leadership mainly led by the superintendents of education, principals, ICT leaders, teachers, and support staff.
For the effective implementation of the GIGA school project, focus on the driving and restraining factors for the group with high degree of ICT use.
Pay attention to intra-school disparities, inter-school disparities, and inter-municipality disparities.
29
※The aim of this study was to explore key explanatory variables.
●Limitations in causal inference using single-level cross-sectional data⇒ We will conduct a follow-up survey in 2021 to obtain panel data.
●Outcome indicators are limited to the implementation levels of online home learning and ICT use. The transformation of teachers, staff, and students brought about by such implementation is yet to be examined.⇒ We will conduct surveys for school staff and students in 2021
●Some of the explanatory variables found to be effective are rather abstract. ⇒ We are planning to conduct more comprehensive analyses (qualitative and
quantitative) on the effects of the explanatory variables confirmed to be important.
Limitations and future prospects 30
References Banerjee, A.V., Cole, S., Duflo, E., & Linden, L. (2007). Remedying education: Evidence from two randomized experiments in India. The Quarterly Journal of Economics, 122(3), 1235-1264.
Benesse Educational Research and Development Institute (2020). A survey of the impacts of COVID-19 on the life of pre-school children and elementary school students. https://berd.benesse.jp/up_images/research/COVID19_research_digest_1217_2.pdf(in Japanese)
Falck, O., Constantin, M., Ludger, W. (2018). Virtually no effect? Different uses of classroom computers and their effect on student achievement. Oxford Bulletin of Economics and Statistics, 80(1), 1-38.Li, Q., & Ma, X.(2010) A meta-analysis of the effects of computer technology on school students’ mathematics learning. Educational Psychological Review, 22, 215-243.
MURC (Mitsubishi UFJ Research and Consulting)(2020). Educational disparities widening due to COVID-19: An analysis of the impacts of employment, income and temporary school closure based on an original survey.
https://www.murc.jp/wp-content/uploads/2020/08/seiken_200821.pdf (in Japanese)
Cabinet Office (2020). The fourth report on “a survey of satisfaction and the quality of life”. https://www5.cao.go.jp/keizai2/manzoku/pdf/report04.pdf (in Japanese)
OECD (Organisation for Economic Co-operation and Development) (2020). Combatting COVID-19's effect on children.
http://www.oecd.org/coronavirus/policy-responses/combatting-covid-19-s-effect-on-children-8df48f29/
Rouse, C.E., & Krueger, A.B. (2004). Putting computerized instruction to the test: A randomized evaluation of a scientifically-based reading program. Economics of Education Review, 23, 323-338.
Tsuyuguchi, K. (2020). New school management theory n the era of “with Corona”. K. Shinohara and Y. Ohno eds. A new form of school management in the era of “with Corona”: Prospects for a new normal education system. Jidai. 41-63. (in Japanese)
U.S. Department of Education, Office of Planning, Evaluation, and Policy Development (2010). Evaluation of Evidence-Based Practices in Online Learning: A Meta-Analysis and Review of Online Learning Studies, Washington, D.C.
31
Acknowledgements
This study is part of an ongoing research project investigating educational innovation taking advantage of the progress of advanced information technology(FY2019-FY2022) at the National Institute for Educational Policy Research (NIER) in Japan. The results presented are preliminary and subject to revision.We are extremely grateful to the superintendents and principals who participated in the Web Survey on ICT Use in Education. The survey was developed by referring to OECD’s TALIS for questions on superintendents’ and principals’ views on teaching, and PIAAC for questions on the use of ICT, respectively. Individual data from the survey conducted by the Ministry of Education, Culture, Sports, Science and Technology were made available following the prescribed procedures for secondary use, to which we are also grateful.
32

Thank you very much.
33