what people want: accenture public service global citizen survey (wave 3 - british english)
TRANSCRIPT

ACCENTURE PUBLIC SERVICE GLOBAL CITIZEN SURVEY
WAVE 3 (BRITISH ENGLISH)
JULY 2017
WHAT
PEOPLEWANT

WHAT DO PEOPLE WANT FROM DIGITAL GOVERNMENT?
We asked thousands of citizensacross six countries: Australia, France, Germany, Singapore, UK and USA.

3
We suggest a three part agenda for decision makers in governments, public service agencies and digital government program offices:
THREEPARTAGENDA
4
Easy, comprehensive, personalised and safe. Look for the best digital experiences from any sector. This is what your citizens expect.
CREATE DELIGHTFULEXPERIENCES 01

5
These are incredibly important to your citizens in what they perceive to be very uncertain times.
FOCUS ON CYBER SECURITY AND TECHNOLOGY TO SUPPORT PUBLIC SAFETY 02

6
There is an overwhelming expectation for more say by people.
DEVELOP STRATEGIES TO LEVERAGE DIGITAL PLATFORMS TO INVOLVE CITIZENS03

7
ABOUT THE STUDY
The purpose of this study is to assess citizen opinions about a variety of digitalgovernment service issues and topics.
Study results are based on a sample of more than 5,400 citizens aged 18 or older who completed an online survey in January-February 2017, with the sample by country as follows:
Results for the full global sample in this report are statistically significant with a confidence level of 95% and a margin of error of +/-1.3%.
Results for each country are statistically significant with a confidence level of 95% and a margin of error of +/-3.1% except for Singapore where the margin of error is +/-3.2%.
UNITED STATES1,014
UNITED KINGDOM1,019
AUSTRALIA1,014
SINGAPORE997
FRANCE1,005
GERMANY1,004

%
KEY FINDINGS
8
ALL VALUES EXPRESSED
AS A PERCENTAGE

DATA SECURITY AND PRIVACY MUST BE A GOVERNMENT PRIORITY.
9

5 8 5 5 3 3 5
17 1520 17 14 17 16
78 77 75 7882 80 79
Global US Australia UK Singapore Germany France
Disagree/Strongly Disagree Neutral Agree/Strongly Agree
SECURITY78% want government to do more to keep personal data more private and secure.
Government agencies must do
more to keep the personal data I
share with them private and
secure.
Percentages are based on a 5-point scale where 1=Strongly Disagree, 2=Disagree, 3=Neutral, 4=Agree, and 5=Strongly Agree
10

POSTAL SERVICES76% want their national postal operator to get involved in protecting against identity theft and making online purchases more secure.
Do you think your national
postal operator should get
involved in protecting you from
identity theft and making all
your online purchases more
secure?
2432
24 25
14
24 24
7668
76 75
86
76 76
Global US Australia UK Singapore Germany France
No Yes
11

EDUCATION About half (45%-53%) think it is acceptable for higher education institutions to use personal data gathered from students if it supports student success and an improved student experience.
It is acceptable for higher education
institutions to use personal data
gathered from students if it supports
student success and an improved
student experience.
Percentages are based on a 5-point scale where 1=Strongly Disagree, 2=Disagree, 3=Neutral, 4=Agree, and 5=Strongly Agree
17 18 16 16 16 14
21
3530
36 3632
42
34
4852
47 4953
45 45
Global US Australia UK Singapore Germany France
Disagree/Strongly Disagree Neutral Agree/Strongly Agree
12

HEALTH AND HUMAN SERVICES7 in 10 US citizens think their data may be more vulnerable to identity theft or hackers when health and human services agencies share it across agencies, and 6 in 10 think those agencies may misuse their data when sharing it.
I am concerned that my data
may be more vulnerable to
identity theft or hackers when
health and human services
agencies share it across
agencies.
Percentages are based on a 5-point scale where 1=Strongly Disagree, 2=Disagree, 3=Neutral, 4=Agree, and 5=Strongly Agree
8
20
70
2
US
Disagree/Strongly Disagree Neutral Agree/Strongly Agree N/A
13*Only asked in the US

PENSIONSJust over half of US citizens (52%) feel that their financial and health data used by Social Security or their public retirement agency are secure.
Do you feel that your financial
and health data used by Social
Security or your public
retirement agency are secure?
48
52
US
No Yes
14*Only asked in the US

BORDERSAmong all citizens surveyed, about 4 in 10 support border agencies sharing their information with other government agencies, even if the data can be properly encrypted for security.
I would be supportive of border
agencies sharing my information
with other government agencies
in my country or other countries
if the data can be properly
encrypted for security.
Percentages are based on a 5-point scale where 1=Strongly Disagree, 2=Disagree, 3=Neutral, 4=Agree, and 5=Strongly Agree
1823
1916 16
24
11
39 38 3942
39 374142
3942 42
45
38
48
Global US Australia UK Singapore Germany France
Disagree/Strongly Disagree Neutral Agree/Strongly Agree
15

TRUST IN LOCAL POLICE IS STRONG, BUT TRUST IN GOVERNMENT BUDGETING IS WEAK.
16

1217
11 13
7
14 12
29 28 28 3027
30 30
5956
6257
66
5659
Global US Australia UK Singapore Germany France
Disagree/Strongly Disagree Neutral Agree/Strongly Agree
PUBLIC SAFETYAmong all citizens surveyed, about 6 in 10 (59%) trust their local police force.
I trust my local police force.
Percentages are based on a 5-point scale where 1=Strongly Disagree, 2=Disagree, 3=Neutral, 4=Agree, and 5=Strongly Agree
17

PUBLIC ADMIN/REGULATORYFor strong majorities of citizens (54%-66%), easier access to government budgeting and spending would increase their trust in government.
Easier access to public
information on government
budgeting and spending
would increase my trust in
government.
Percentages are based on a 5-point scale where 1=Not at all Willing, 2=Unwilling, 3=Neutral, 4=Willing, and 5=Very Willing
912 10 9
611 9
32 3034
37
28
35
27
59 58 56 54
66
54
65
Global US Australia UK Singapore Germany France
Unwilling/Not at all Willing Neutral Willing/Very Willing
18

29 2731
36
12
3530
3834
40 4137
44
343338
29
23
51
22
37
Global US Australia UK Singapore Germany France
Unconfident/Not at all Confident Neutral Confident/Very Confident
CONSULTINGOnly 1 in 3 trust that local government is budgeting to address top local priorities.
How confident are you that
your local government is
properly budgeting to address
the city's most important
priorities?
Percentages are based on a 5-point scale where 1=Not at all Confident, 2=Unconfident, 3=Neutral, 4=Confident, and 5=Very Confident.
19

GOVERNMENT TECHNOLOGY INNOVATION CAN INCREASE CITIZEN ENGAGEMENT.
20

My interest in working for
government agencies
would increase if they were
more innovative in using
emerging technologies like
artificial intelligence,
biometrics, and advanced
analytics.
PUBLIC ADMIN/REGULATORYMore innovative use of emerging technologies would make about half of all citizens surveyed (47%) more interested in working for government.
21
Percentages are based on a 5-point scale where 1=Strongly Disagree, 2=Disagree, 3=Neutral, 4=Agree, and 5=Strongly Agree
1519
16 18
9
1613
3833
43 42
33
42
36
47 49
41 39
58
42
51
Global US Australia UK Singapore Germany France
Disagree/Strongly Disagree Neutral Agree/Strongly Agree

Would you join or participate in
online webinars proposed by your
tax authority to explain and help
you complete your tax forms?
REVENUEA majority (54%) would join or participate in online webinars proposed by their tax authority.
22
46 45
53 53
3841
44
54 54
47 47
6259
56
Global US Australia UK Singapore Germany France
No Yes

1613
18 17
6
24
17
2926
31 3125
3329
5561
50 52
69
42
54
Global US Australia UK Singapore Germany France
Disagree/Strongly Disagree Neutral Agree/Strongly Agree
PUBLIC ADMIN/REGULATORYA majority (55%) are likely to use an app that makes it easier to access public information on government performance.
How likely would you be to use an app
that made it easier for you to access
public information on government
performance (such as emergency and
non-emergency response rates,
ratings of public parks and other
public facilities, employment rates,
etc.) as well as government
budgeting/spending?
Percentages are based on a 5-point scale where 1=Strongly Disagree, 2=Disagree, 3=Neutral, 4=Agree, and 5=Strongly Agree.
23

BORDERSModerate percentages (38%-54%) would use mobile apps and social media to interact and share data (including biometrics) with government to speed up international travel.
To speed up travel across
international borders, how willing
would you be to use mobile apps
and social media to interact and
share data – including biometrics
(e.g., scan of fingerprint, palms,
face, eyes) – with the
government?
23 23 2421
14
33
25
31 2934 32 32
29 28
4649
43
54 54
38
47
Global US Australia UK Singapore Germany France
Unwilling/Not Willing at all Neutral Willing/Very Willing
24
Percentages are based on a 5-point scale where 1=Not at all Willing, 2=Unwilling, 3=Neutral, 4=Willing, and 5=Very Willing

CONSULTINGAmong all citizens surveyed, more than 6 in 10 (62%) expect public service organisations to use innovative technologies and solutions to improve service delivery while driving down cost.
I expect public service organisations
to use innovative technologies and
solutions to improve the services
they deliver to me while driving
down cost.
Percentages are based on a 5-point scale where 1=Strongly Disagree, 2=Disagree, 3=Neutral, 4=Agree, and 5=Strongly Agree.
5 6 5 6 4 6 4
3336
3137
28
3530
6259
6458
68
5965
Global US Australia UK Singapore Germany France
Disagree/Strongly Disagree Neutral Agree/Strongly Agree
25

SUPPORT FOR AI REMAINS MODERATE, WITH GROWING INTEREST.
26

REVENUEA majority (52%) would like to see their tax authority create a virtual ID for public service and online shopping transactions
Would you like to see your
tax authority create a virtual
ID that you could use for all
your transactions with public
services and online
shopping?
48 47
5449
39
54
43
52 53
4651
61
46
57
Global US Australia UK Singapore Germany France
No Yes
27

Using a virtual assistant to help
students manage course
schedules and stay on track to
graduate would be an appropriate
use of artificial intelligence (AI) in
higher education.
EDUCATIONAbout half (49%) think using a virtual assistant to help students manage course schedules and stay on track to graduate is an appropriate use of AI in higher education.
28
16 1518 16
10
19 18
35
29
39 38
32
40
33
49
56
4346
58
41
49
Global US Australia UK Singapore Germany France
Disagree/Strongly Disagree Neutral Agree/Strongly Agree
Percentages are based on a 5-point scale where 1=Strongly Disagree, 2=Disagree, 3=Neutral, 4=Agree, and 5=Strongly Agree.

2118 20 21
10
32
23
36 3439 37 35
3834
43
49
42 41
54
31
43
Global US Australia UK Singapore Germany France
Unwilling/Not Willing at all Neutral Willing/Very Willing
BORDERSAbout 4 in 10 (43%) support using AI-delivered services when crossing borders for a more secure, simplified experience.
When crossing international
borders, how willing would you be
to use services delivered by
emerging technologies such as
artificial intelligence (e.g., chat
bots, robots, virtual assistants,
intelligent machines) in return for
a more secure, simplified
experience?
29
Percentages are based on a 5-point scale where 1=Not at all Willing, 2=Unwilling, 3=Neutral, 4=Willing, and 5=Very Willing

2729 30
16
33
27
38 39 3840
3733
3532 32
43
29
39
Global Australia UK Singapore Germany France
Disagree/Strongly Disagree Neutral Agree/Strongly Agree
SOCIAL SERVICESOnly about 4 in 10 (42%) agree that using a virtual agent to help citizens get quicker responses to queries would be an appropriate use of AI in social services.
I am comfortable having artificial
intelligence (e.g., chat bots,
robots, virtual assistants,
intelligent machines, etc.) used
in other areas of my life and
believe it could improve
interactions with social service
agencies.
30
Percentages are based on a 5-point scale where 1=Strongly Disagree, 2=Disagree, 3=Neutral, 4=Agree, and 5=Strongly Agree.
*Excluding US

PERSONALISATION HAS VALUE BUT IS UNDER-DELIVERED.
31

Informing me about the real outcomes
of my charitable donations or volunteer
work would create a more personalised
experience for me with non-profit
organisations to which I contribute.
NONPROFITA strong majority (59%) think information about the real outcomes of charitable donations or volunteer work would create a more personalised non-profit experience 59%.
32
Percentages are based on a 5-point scale where 1=Strongly Disagree, 2=Disagree, 3=Neutral, 4=Agree, and 5=Strongly Agree
6 4 5 74
9 9
2621
2926 24 24
29
59
66
5653
67
5653
10 9 1014
511 10
Global US Australia UK Singapore Germany France
Disagree/Strongly Disagree Neutral Agree/Strongly Agree N/A

BORDERSOnly 4 in 10 are satisfied with the customer experience they have when dealing with border agencies – considering it personalised, easy to use and simple to understand.
I am satisfied with the customer
experience I have when dealing
with border agencies – either
online or in person. It is
personalised, easy to use, and
simple to understand.
Percentages are based on a 5-point scale where 1=Strongly Oppose, 2=Oppose, 3=Neutral, 4=Support, and 5=Strongly Support
10 12 10 96
10 11
5053
49
57
43
55
46
4035
41
34
51
35
43
Global US Australia UK Singapore Germany France
Disagree/Strongly Disagree Neutral Agree/Strongly Agree
33
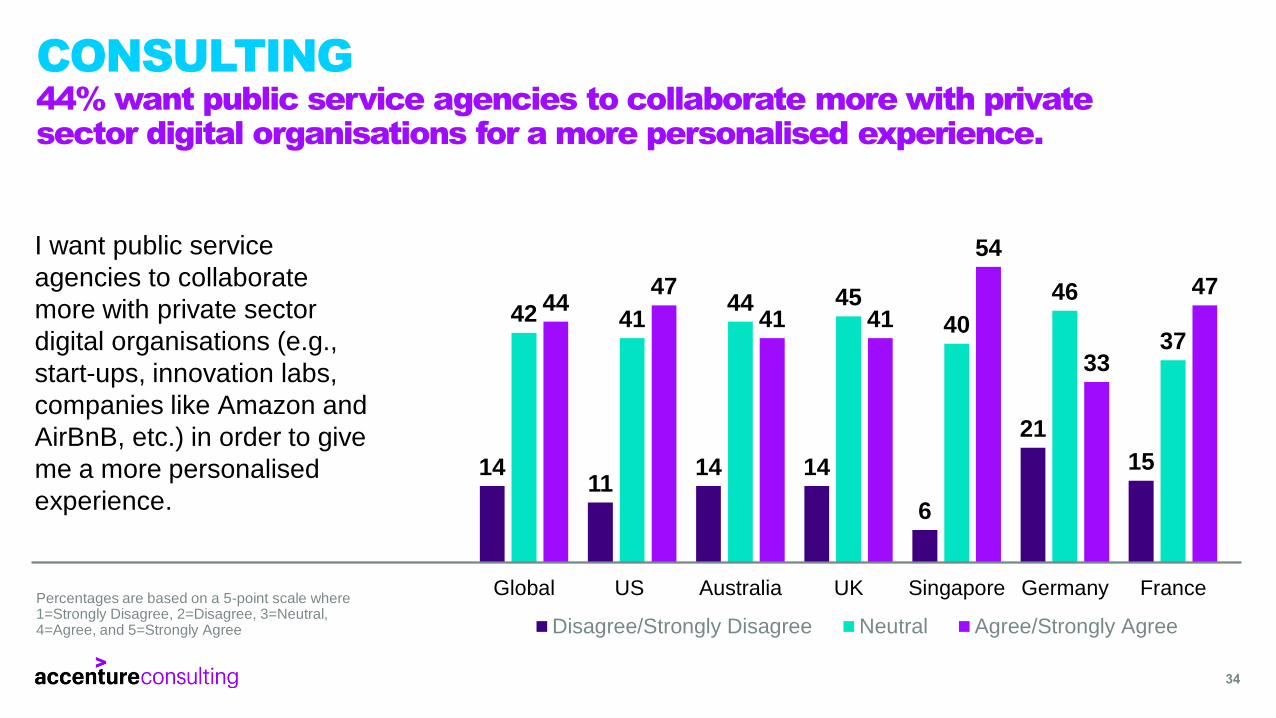
CONSULTING44% want public service agencies to collaborate more with private sector digital organisations for a more personalised experience.
I want public service
agencies to collaborate
more with private sector
digital organisations (e.g.,
start-ups, innovation labs,
companies like Amazon and
AirBnB, etc.) in order to give
me a more personalised
experience.
34
1411
14 14
6
21
15
42 4144 45
40
46
37
4447
41 41
54
33
47
Global US Australia UK Singapore Germany France
Disagree/Strongly Disagree Neutral Agree/Strongly Agree
Percentages are based on a 5-point scale where 1=Strongly Disagree, 2=Disagree, 3=Neutral, 4=Agree, and 5=Strongly Agree

NONPROFIT43% are satisfied with the personalised experience provided by nonprofit organisations to which they contribute to.
How satisfied are you with the
personalised experience provided
by the non-profit organisations to
which you contribute?
Percentages are based on a 5-point scale where 1=Strongly Disagree, 2=Disagree, 3=Neutral, 4=Agree, and 5=Strongly Agree
35
7 6 7 5 510 8
36
2933 35
38
45
36
44
53
4540
49
31
43
13 1215
20
8
14 12
Global US Australia UK Singapore Germany France
Disagree/Strongly Disagree Neutral Agree/Strongly Agree N/A

CITIZENS WANT GREATER CONTROL, ENGAGEMENT, AND IMPACT.
36

I will have greater confidence in the
privacy and security of my data if the
health and human services agencies
who share it give me the ability to
specify how it can be shared.
HEALTH AND HUMAN SERVICESTwo-thirds of US citizens will have greater confidence in the privacy and security of their data if the agencies who share it provide citizens with the ability to specify how it can be shared.
6%
25%
67%
2%
US
Disagree/Strongly Disagree Neutral Agree/Strongly Agree N/A
37*Only asked in the US
Percentages are based on a 5-point scale where 1=Strongly Disagree, 2=Disagree, 3=Neutral, 4=Agree, and 5=Strongly Agree.

NONPROFITOnly 4 in 10 of all citizens surveyed think non-profit organisations to which they contribute are effectively using social media to engage/motivate them.
The non-profit organisations to
which I contribute are effective
at using social media in a way
that engages and motivates me
to share, promote, and spread
the word about issues
important to me.
Percentages are based on a 5-point scale where 1=Strongly Disagree, 2=Disagree, 3=Neutral, 4=Agree, and 5=Strongly Agree.
118
11 10 8
14 14
3530
36 35 35 37 35
41
50
39 38
50
32
40
13 12 1417
7
1712
Global US Australia UK Singapore Germany France
Disagree/Strongly Disagree Neutral Agree/Strongly Agree N/A
38

4 4 5 5 3 4 6
2218
23 21 19
2823
5964
54 56
74
5055
15 1418 18
4
17 16
Global US Australia UK Singapore Germany France
Disagree/Strongly Disagree Neutral Agree/Strongly Agree N/A
CONSULTINGA strong majority (59%) are more likely to stay with their current employer if they know they will be making a positive impact inside or outside the organisation.
I am more likely to stay with my
current employer if I know I will
be making a positive impact
inside or outside the
organisation.
39
Percentages are based on a 5-point scale where 1=Strongly Disagree, 2=Disagree, 3=Neutral, 4=Agree, and 5=Strongly Agree.

APPENDIX
40

41
APPENDIX:SAMPLE DETAIL BY COUNTRY
GLOBAL US AUSTRALIA UK SINGAPORE GERMANY FRANCE
Count % Count % Count % Count % Count % Count % Count %
TOTAL
POPULATION6053 100% 1014 100% 1014 100% 1019 100% 997 100% 1004 100% 1017 100%
GE
ND
ER MALE 2941 49% 476 47% 476 47% 502 49% 491 49% 507 50% 469 47%
FEMALE 3112 51% 538 53% 538 53% 517 51% 506 41% 497 50% 536 53%
AG
E
18-34 YEARS 2047 34% 389 38% 389 38% 390 38% 360 36% 239 24% 280 28%
35-44 YEARS 1528 25% 231 23% 231 23% 256 25% 339 34% 187 19% 217 22%
45-64 YEARS 1259 21% 330 21% 230 21% 192 19% 229 23% 226 23% 194 19%
65 YEARS
OR OLDER1219 20% 164 20% 164 20% 181 18% 69 7% 352 35% 314 23%

@David_M_Regan
https://ie.linkedin.com/in/davidreganaccenture
DAVID REGANSIMON GILES
@Peakflow
https://uk.linkedin.com/in/simongilescities
42
MEET OUR SUBJECT MATTER EXPERTS
@BernardleMasson
https://fr.linkedin.com/in/bernardlemasson/en
BERNARD LE MASSON
GOVERNMENT AS A PLATFORM
MARK HOWARD
@markhoward_CO
https://www.linkedin.com/in/markhowardco
PUBLIC ADMINISTRATION
CITIES REVENUE

@OwenBDavies
https://www.linkedin.com/in/owenbdavies
OWEN DAVIES
@rjfriess
https://www.linkedin.com/in/robert-friess-02037216
ROB FRIESSRAINER BINDER
@Binderra
https://de.linkedin.com/in/rainer-binder/en
43
MEET OUR SUBJECT MATTER EXPERTS
PENSIONS HEALTH & HUMAN SERVICES
SOCIAL SERVICES & EMPLOYMENT EDUCATION
RYAN OAKES
@ryanmoakes
https://www.linkedin.com/in/ryan-oakes-3b5a916

44
MEET OUR SUBJECT MATTER EXPERTS
@ElaineKTurville
https://www.linkedin.com/in/elainekturville
ELAINE TURVILLE
NON-PROFIT POSTAL SERVICES
PUBLIC SAFETY BORDERS
@brodybuhler
https://www.linkedin.com/in/brodybuhler
BRODY BUHLER
@slessor_james
https://uk.linkedin.com/in/jslessor
JAMES SLESSOR
@JimCanham
https://uk.linkedin.com/in/jamescanham
JAMES CANHAM
45
MEET OUR SUBJECT MATTER EXPERTS
@AnttiKol
https://fi.linkedin.com/in/antti-kolehmainen-14a3042
ANTTI KOLEHMAINEN
DEFENCE

46
ABOUT ACCENTURE
Accenture is a leading global professional services company, providing a broad range
of services and solutions in strategy, consulting, digital, technology and operations.
Combining unmatched experience and specialised skills across more than 40 industries
and all business functions – underpinned by the world’s largest delivery network –
Accenture works at the intersection of business and technology to help clients improve
their performance and create sustainable value for their stakeholders.
With approximately 425,000 people serving clients in more than 120 countries,
Accenture drives innovation to improve the way the world works and lives.
Visit us at www.accenture.com.

Copyright © 2017 Accenture All rights reserved.