what is particle pollution?
TRANSCRIPT

Created by University of Rochester, University of North Carolina at Chapel Hill, University of Texas Medical Branch, Columbia University, and WE ACT for Environmental Justice. (2018)
SENSOR STORIESHow sensors can help individuals and communities understand
and reduce exposure to air pollution

Created by University of Rochester, University of North Carolina at Chapel Hill, University of Texas Medical Branch, Columbia University, and WE ACT for Environmental Justice. (2018)
What we will do today
1) Learn about particle pollution
2) Explore how sensors are used by individuals & community groups
3) Develop an Action Plan for using an air sensor in your community
2

Created by University of Rochester, University of North Carolina at Chapel Hill, University of Texas Medical Branch, Columbia University, and WE ACT for Environmental Justice. (2018)
What is particle pollution?• Mixture of solid particles and liquid droplets in air
• Also called particulate matter or PM
3

Created by University of Rochester, University of North Carolina at Chapel Hill, University of Texas Medical Branch, Columbia University, and WE ACT for Environmental Justice. (2018)
Why are we talking about particle pollution?
Particle pollution…
• can be invisible
• is all around us
• is linked to negative health effects
• can be measured and reduced
4

Created by University of Rochester, University of North Carolina at Chapel Hill, University of Texas Medical Branch, Columbia University, and WE ACT for Environmental Justice. (2018)
Sources of particle pollution
Natural Outdoor Activities Indoor Activities
Sea spray Pollens and plant debris
Pollen
Wildfires
Leaf litter
Dust storm
Forests
5
Cooking

Created by University of Rochester, University of North Carolina at Chapel Hill, University of Texas Medical Branch, Columbia University, and WE ACT for Environmental Justice. (2018)
Particulate matter (PM) comes in different sizes
6
FINEPARTICULATE MATTER
www.epa.gov

Created by University of Rochester, University of North Carolina at Chapel Hill, University of Texas Medical Branch, Columbia University, and WE ACT for Environmental Justice. (2018)
Why does particle size matter?
• Smaller particles are more easily inhaled
• PM2.5 can be inhaled deeply into the lungs
• Particle concentration, length of exposure, and breathing rate also influence how much PM gets into your body
7

Created by University of Rochester, University of North Carolina at Chapel Hill, University of Texas Medical Branch, Columbia University, and WE ACT for Environmental Justice. (2018)
How does PM exposure affect health?
PM exposure causes:
• Eye, nose and throat irritation
• Worsening of heart and lung disease
• Premature death in people with heart or lung disease
Some people have no symptoms even when PM is at unhealthy levels.
8
Created by University of Rochester, University of North Carolina at Chapel Hill, University of Texas Medical Branch, Columbia University, and WE ACT for Environmental Justice. (2018)
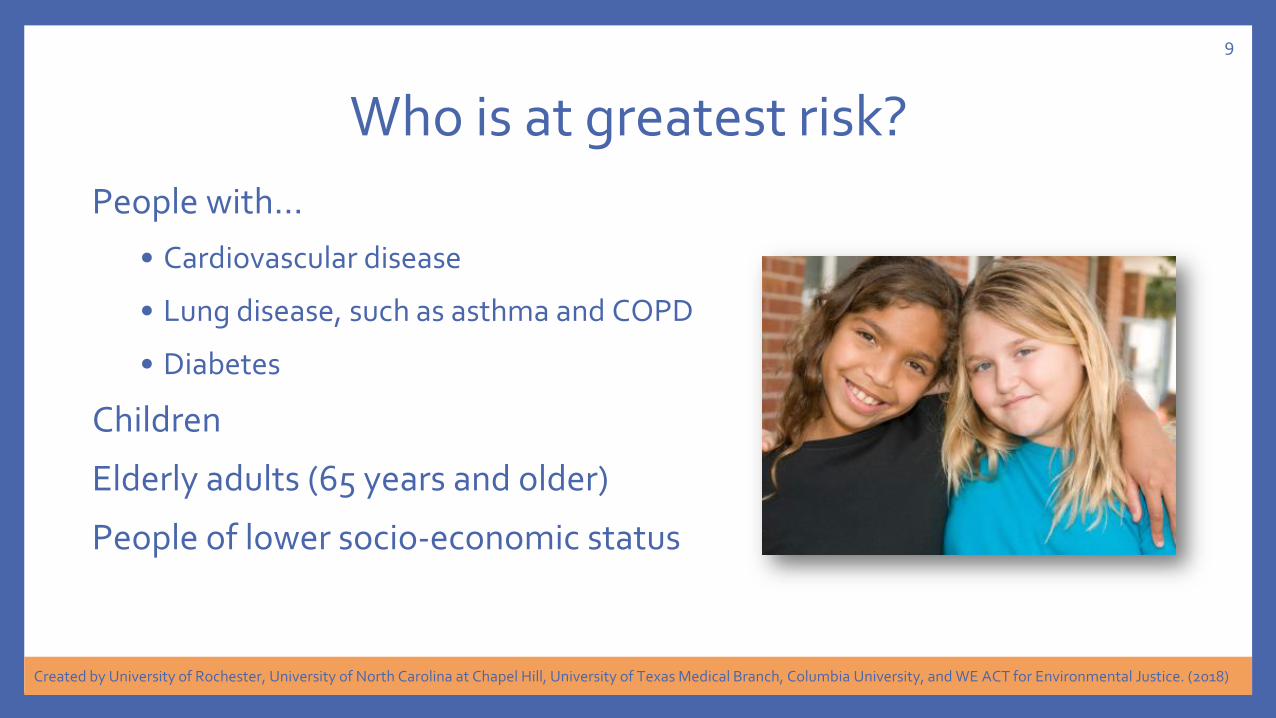
Who is at greatest risk?
People with…
• Cardiovascular disease
• Lung disease, such as asthma and COPD
• Diabetes
Children
Elderly adults (65 years and older)
People of lower socio-economic status
9

Created by University of Rochester, University of North Carolina at Chapel Hill, University of Texas Medical Branch, Columbia University, and WE ACT for Environmental Justice. (2018)
What amount of PM2.5 is safe?
Annual average concentration 12 µg/m3
Daily (24 hour) average concentration 35 µg/m3
National Ambient Air Quality Standards (NAAQS): PM2.5
10
The Environmental Protection Agency set these standards to protect public health, including sensitive populations.
The standards are for outdoor air; there are no PM standards for indoor air.

Created by University of Rochester, University of North Carolina at Chapel Hill, University of Texas Medical Branch, Columbia University, and WE ACT for Environmental Justice. (2018)
PM2.5 pollution is monitored by the EPA
Active PM2.5 Monitors (US EPA Air Data Air Quality Monitors)
11

Created by University of Rochester, University of North Carolina at Chapel Hill, University of Texas Medical Branch, Columbia University, and WE ACT for Environmental Justice. (2018)
Where are PM2.5 monitors in my state?
12
Created by University of Rochester, University of North Carolina at Chapel Hill, University of Texas Medical Branch, Columbia University, and WE ACT for Environmental Justice. (2018)
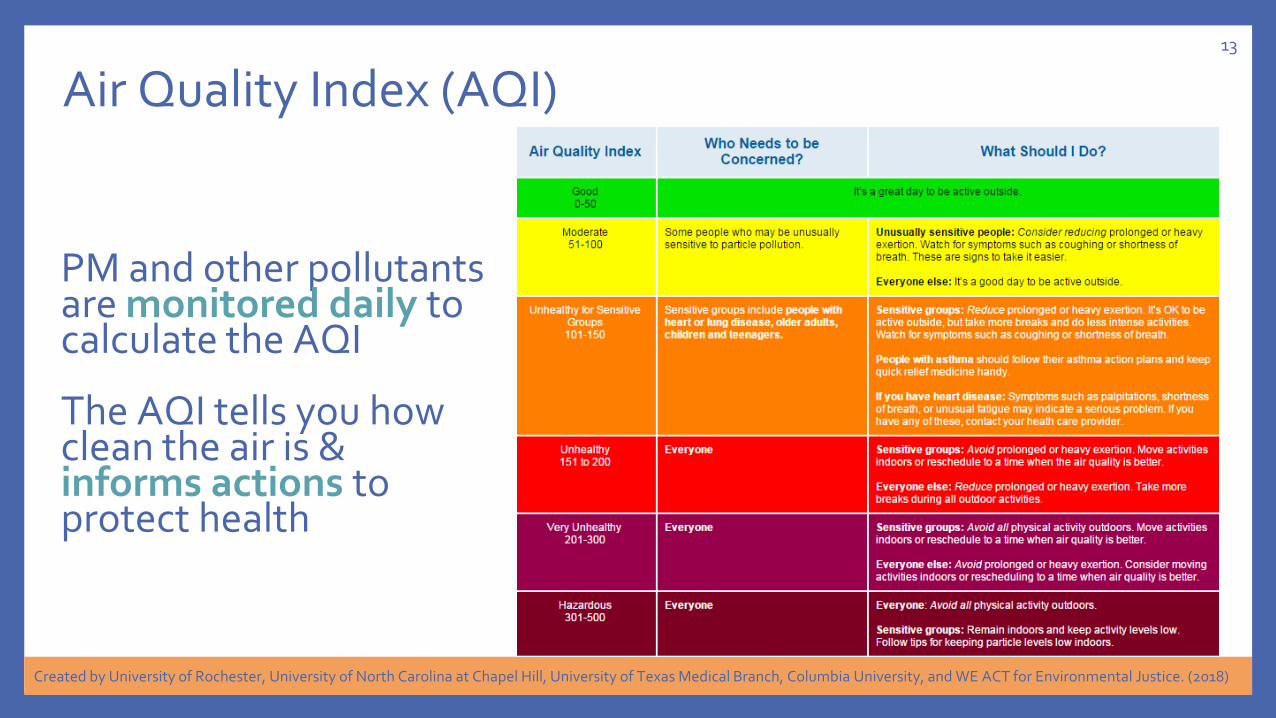
Air Quality Index (AQI)
PM and other pollutants are monitored daily to calculate the AQI
The AQI tells you how clean the air is & informs actions to protect health
13

Created by University of Rochester, University of North Carolina at Chapel Hill, University of Texas Medical Branch, Columbia University, and WE ACT for Environmental Justice. (2018)
How can I find out about PM2.5 in my area? • EPA’s AirNow website enables users to see the AQI for their area
Search for local air quality conditions
https://airnow.gov/
14

Created by University of Rochester, University of North Carolina at Chapel Hill, University of Texas Medical Branch, Columbia University, and WE ACT for Environmental Justice. (2018)
How can I find out about PM2.5 in my area? Today’s AQI
Details for PM2.5
https://www.airnow.gov/
15

Created by University of Rochester, University of North Carolina at Chapel Hill, University of Texas Medical Branch, Columbia University, and WE ACT for Environmental Justice. (2018)
If we can access AQI, why use a PM sensor?
AQI may not reflect local conditions and does not address indoor air quality
Sensors can help:• Educate others about air quality
• Monitor personal exposure indoors and outdoors
• Identify local sources of air pollution
• Facilitate community action to reduce exposure
https://www.specksensor.com/
16

Created by University of Rochester, University of North Carolina at Chapel Hill, University of Texas Medical Branch, Columbia University, and WE ACT for Environmental Justice. (2018)
Sensors can reveal patterns of exposure
17
Lisa MartaDonnaKennedy

Created by University of Rochester, University of North Carolina at Chapel Hill, University of Texas Medical Branch, Columbia University, and WE ACT for Environmental Justice. (2018)
Sensors help educate others18
• Needed reliable, easy to use, low-maintenance sensor
• Wanted to monitor air quality in varied locations
• Used Dylos sensors to measure small and large particles
Kennedyteaches middle and high school students about air quality

Created by University of Rochester, University of North Carolina at Chapel Hill, University of Texas Medical Branch, Columbia University, and WE ACT for Environmental Justice. (2018)
Data helped students “see” air pollution
Kennedy’s students discovered variedPM2.5 concentrations
• Saw peaks at intersections and close to sources of PM
• Recorded highest readings inside subway stations, where thousands of people wait for trains every day
19
“When trains entered the subway station, the sensor
readings got all spikey.”

Created by University of Rochester, University of North Carolina at Chapel Hill, University of Texas Medical Branch, Columbia University, and WE ACT for Environmental Justice. (2018)
Sensors inform personal choices
20
• Husband and daughter had health problems potentially affected by PM exposure
• Wanted to monitor air quality in varied locations, outdoors and indoors
Lisa wondered whether PM exposure worsened her family’s health
Created by University of Rochester, University of North Carolina at Chapel Hill, University of Texas Medical Branch, Columbia University, and WE ACT for Environmental Justice. (2018)
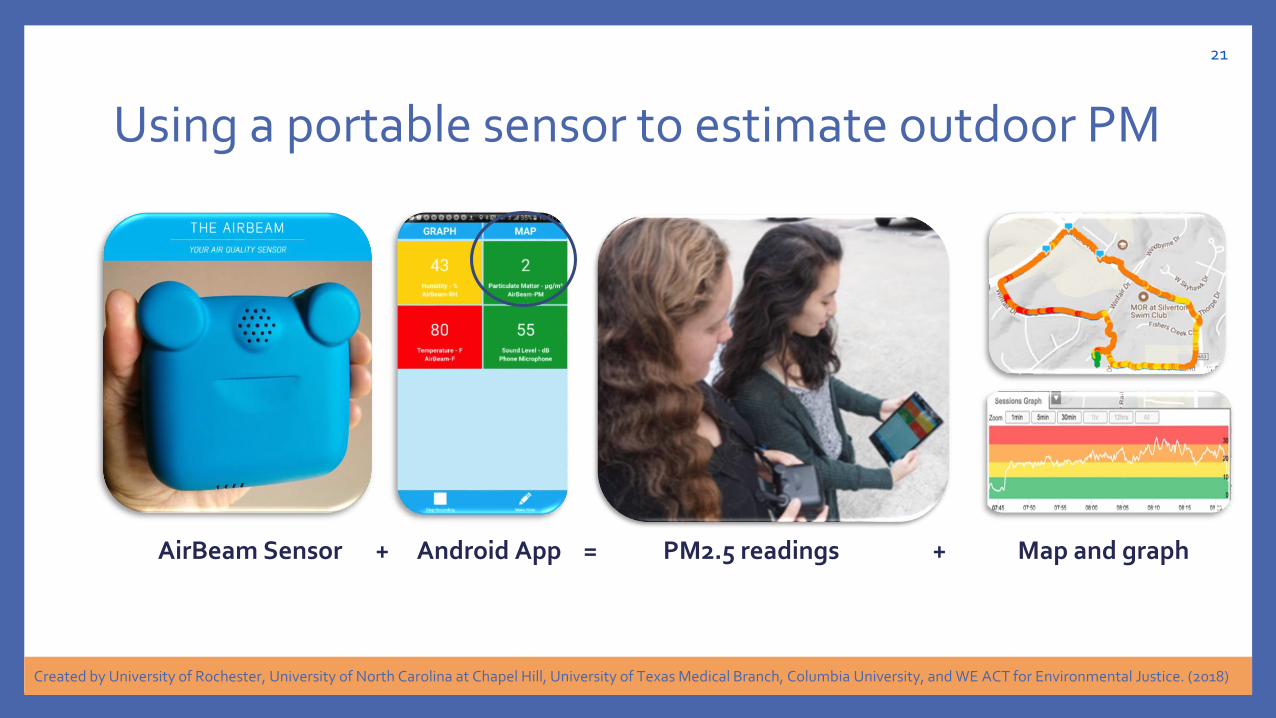
Using a portable sensor to estimate outdoor PM
AirBeam Sensor + Android App = PM2.5 readings + Map and graph
21

Created by University of Rochester, University of North Carolina at Chapel Hill, University of Texas Medical Branch, Columbia University, and WE ACT for Environmental Justice. (2018)
What are some potential sources of particle pollution Lisa might encounter on her walks?
School bus Yard waste Backyard fire pit Traffic
22

Created by University of Rochester, University of North Carolina at Chapel Hill, University of Texas Medical Branch, Columbia University, and WE ACT for Environmental Justice. (2018)
What might explain this area of high PM2.5?
Air Beam DataPeak PM: 112 µg/m3
Friday, Jan 26, 2018AQI: Good
Evening: 25 minute walkTemp: 53°FRelative humidity: 35%Sky: after dark, not windy
23

Created by University of Rochester, University of North Carolina at Chapel Hill, University of Texas Medical Branch, Columbia University, and WE ACT for Environmental Justice. (2018)
Wood smoke can impact PM2.5 levels
Strong smell of wood smoke during Friday evening walk
24

Created by University of Rochester, University of North Carolina at Chapel Hill, University of Texas Medical Branch, Columbia University, and WE ACT for Environmental Justice. (2018)
Data informed choices to reduce PM exposure
PM2.5 varied:
• By time of day and weather conditions
• Higher near roads with heavy traffic and sources of wood smoke
Lisa and family spend less time near these sources at times with high readings
25

Created by University of Rochester, University of North Carolina at Chapel Hill, University of Texas Medical Branch, Columbia University, and WE ACT for Environmental Justice. (2018)
Sensors help investigate local sources
26
• Neighborhood got smoky when BBQ was cooking
• Wanted fast measurements that could be shared with others, including media
Donna wondered whether BBQ restaurant was harming neighbors’ health

Created by University of Rochester, University of North Carolina at Chapel Hill, University of Texas Medical Branch, Columbia University, and WE ACT for Environmental Justice. (2018)
Data identified restaurant as local PM source
27
Chronic exposure to these levels may pose a health risk, especially for sensitive populations
“The sensor helped us draw attention
to this local source of air pollution.”

Created by University of Rochester, University of North Carolina at Chapel Hill, University of Texas Medical Branch, Columbia University, and WE ACT for Environmental Justice. (2018)
Interpreting sensor readings28
334 µg/m3
https://www.epa.gov/air-sensor-toolbox/what-do-my-sensor-readings-mean-sensor-scale-pilot-project
These readings prompted the Health Departmentto collect its own data

Created by University of Rochester, University of North Carolina at Chapel Hill, University of Texas Medical Branch, Columbia University, and WE ACT for Environmental Justice. (2018)
Sensors enable community action to reduce exposure
29
• Neighborhood is near a major port that hosts a large container terminal
• High volume of daily truck traffic
Marta and other parents were concerned about PM exposure in the schoolyard

Created by University of Rochester, University of North Carolina at Chapel Hill, University of Texas Medical Branch, Columbia University, and WE ACT for Environmental Justice. (2018)
30
School
Trucks Waiting to Enter Port
Marta’s House
“I worry that exhaust from idling trucks is increasing PM around my daughter’s school, possibly affecting some
children’s breathing.”

Created by University of Rochester, University of North Carolina at Chapel Hill, University of Texas Medical Branch, Columbia University, and WE ACT for Environmental Justice. (2018)
Using a stationary indoor sensor to estimate PM
Speck sensor with data display Online display dashboard (map and graph)
31

Created by University of Rochester, University of North Carolina at Chapel Hill, University of Texas Medical Branch, Columbia University, and WE ACT for Environmental Justice. (2018)
Data demonstrated daily PM patterns
There were increases in PM2.5 in homes around the school during times of heavier truck traffic at the port
32
150
480529
550
621
502
796 801850
715680
403360
163
529
601 620
700
603
702
760801
750
613
348
289
127 130
256290
312286
340
421
483
429457
380
291
0
100
200
300
400
500
600
700
800
900
0700080009001000110012001300140015001600170018001900
NU
MB
ER
OF
PM
2.5
PA
RT
ICL
ES
/LIT
ER
TIME OF DAY
Tuesday Thursday Sunday
7am 8am 9am 10am 11am Noon 1pm 2pm 3pm 4pm 5pm 6pm 7pm https://www.specksensor.com/support/tech-specs

Created by University of Rochester, University of North Carolina at Chapel Hill, University of Texas Medical Branch, Columbia University, and WE ACT for Environmental Justice. (2018)
Understand personal exposure
33
Identify local sources & advocate for cleaner air
Educate about particle pollution
Sensors reveal patterns & inform action

Created by University of Rochester, University of North Carolina at Chapel Hill, University of Texas Medical Branch, Columbia University, and WE ACT for Environmental Justice. (2018)
Limits of sensor results
• Differ from AQI values • 1-minute sensor readings ≠ 24 hr averages (as reported on the AQI)
• Can be inaccurate due to• Environmental factors, such as temperature & high humidity• Low PM2.5 concentrations• Calibration (or “tuning”) error
34
Despite limitations, sensors can show patterns and help identify questions for further exploration.

Created by University of Rochester, University of North Carolina at Chapel Hill, University of Texas Medical Branch, Columbia University, and WE ACT for Environmental Justice. (2018)
Take action to reduce exposure to particle pollution
• Be aware of PM sources• Eliminate sources when possible or
minimize exposure
• Use AQI forecast to plan outdoor activities• Remember: when PM is high outdoors, it
may be high indoors – unless building has a good filtration system
• Create partnerships to address community-wide exposures
35

Created by University of Rochester, University of North Carolina at Chapel Hill, University of Texas Medical Branch, Columbia University, and WE ACT for Environmental Justice. (2018)
AcknowledgementsFunding for this project was provided by the National Institute of Environmental Health Sciences.
Project team
• University of Rochester Environmental Health Sciences Center (P30-ES01247)
• University of North Carolina-Chapel Hill Center for Environmental Health and Susceptibility (P30-ES010126)
• University of Texas Medical Branch Center for Environmental Toxicology (P30-ES006676)
• Columbia University Center for Environmental Health in Northern Manhattan and West Harlem Environmental Action, Inc. (WE ACT for Environmental Justice) (P30-ES009089)
36

Created by University of Rochester, University of North Carolina at Chapel Hill, University of Texas Medical Branch, Columbia University, and WE ACT for Environmental Justice. (2018)
What’s YOUR sensor story?Let’s complete an action plan to find out
37

Created by University of Rochester, University of North Carolina at Chapel Hill, University of Texas Medical Branch, Columbia University, and WE ACT for Environmental Justice. (2018)
Each of us encounters different mixtures of particle pollution
Exposure to car and truck exhaust Exposure to cigarette smoke Exposure to pollen and dust
38

Created by University of Rochester, University of North Carolina at Chapel Hill, University of Texas Medical Branch, Columbia University, and WE ACT for Environmental Justice. (2018)
Making an Action Plan | Questions to Ask
39

Created by University of Rochester, University of North Carolina at Chapel Hill, University of Texas Medical Branch, Columbia University, and WE ACT for Environmental Justice. (2018)
ReferencesUS EPA: Criteria Air Pollutantshttps://www.epa.gov/criteria-air-pollutants#self
US EPA: Indoor Particulate Matterhttps://www.epa.gov/indoor-air-quality-iaq/indoor-particulate-matter
US EPA: Particle Pollution and Your Patients' Healthhttps://www.epa.gov/pmcourse
National Academies of Sciences, Engineering, and Medicine: Health Risks of Indoor Exposure to Particulate Matter: Workshop Summaryhttps://www.nap.edu/catalog/23531/health-risks-of-indoor-exposure-to-particulate-matter-workshop-summary
Air Sensor Toolboxhttps://www.epa.gov/air-sensor-toolbox
40