what drives target2 balances? evidence from a … drives target2 balances? evidence from a panel...
TRANSCRIPT

2012
-15
Swis
s Na
tion
al B
ank
Wor
king
Pap
ers
What Drives Target2 Balances?Evidence From a Panel Analysis
Raphael A. Auer

The views expressed in this paper are those of the author(s) and do not necessarily represent those of the Swiss National Bank. Working Papers describe research in progress. Their aim is to elicit comments and to further debate.
Copyright ©The Swiss National Bank (SNB) respects all third-party rights, in particular rights relating to works protectedby copyright (information or data, wordings and depictions, to the extent that these are of an individualcharacter).SNB publications containing a reference to a copyright (© Swiss National Bank/SNB, Zurich/year, or similar) may, under copyright law, only be used (reproduced, used via the internet, etc.) for non-commercial purposes and provided that the source is mentioned. Their use for commercial purposes is only permitted with the prior express consent of the SNB.General information and data published without reference to a copyright may be used without mentioning the source.To the extent that the information and data clearly derive from outside sources, the users of such information and data are obliged to respect any existing copyrights and to obtain the right of use from the relevant outside source themselves.
Limitation of liabilityThe SNB accepts no responsibility for any information it provides. Under no circumstances will it accept any liability for losses or damage which may result from the use of such information. This limitation of liability applies, in particular, to the topicality, accuracy, validity and availability of the information.
ISSN 1660-7716 (printed version)ISSN 1660-7724 (online version)
© 2012 by Swiss National Bank, Börsenstrasse 15, P.O. Box, CH-8022 Zurich

1
What Drives Target2 Balances? Evidence From a Panel Analysis
Raphael A. Auer1
Swiss National Bank
Abstract
What are the drivers of the large Target2 (T2) balances that have emerged in the European Monetary Union since the start of the financial crisis in 2007? This paper examines the extent to which the evolution of national T2 balances can be statistically associated with cross-border financial flows and current account (CA) balances. In a quarterly panel spanning the years 1999 to 2012 and twelve countries, it is shown that while the CA and the evolution of T2 balances were unrelated until the start of the 2007 financial crisis, since then, the relation between these two variables has become statistically significant and economically sizeable. This reflects the partial “sudden stop” to private sector capital that funded CA imbalances beforehand. I next examine how different types of financial flows have evolved over the last years and how this can be related to the evolution of T2 balances. While changes in cross-border positions in the interbank market are associated with increasing T2 imbalances, cross-border inter-office flows between banks belonging to the same financial institution have reduced T2 imbalances. Flows to the banking sector that originate from private investors and non-financial firms are large in magnitude, but are only weakly correlated with the evolution of T2 balances; changes in banks’ holdings of foreign government debt and deposit flows are strongly correlated with the post-2007 evolution of T2 balances. Overall, these findings point to a sizeable transfer of risk from the private to the public sector within T2 creditor nations the via the use of central bank liquidity.
1 This working paper is a preliminary version of a paper prepared for the 57th Panel Meeting of Economic Policy, April 2013. The author thanks Andreas Fischer, Adriel Jost, Sébastien Kraenzlin, Philip Sauré, and especially Daniel Heller, Philip Lane, and an anonymous referee of the working paper series at the Swiss National Bank for comments and suggestions, and Laurence Wicht for excellent research assistance. The views presented are solely those of the author and do not necessarily reflect those of the Swiss National Bank.

2
1. Introduction Cross-border money flows within the European Monetary Union (EMU) are to a large
extent processed via the Target2 (T2) payment system.2 With this system, the European Central Bank (ECB) keeps track of these cross-border flows in its accounting system. The net amounts of these flows are called T2 balances.
Until the start of the financial crisis in 2007, these balances were small in magnitude (when compared to the GDP of the euro area) and reflected mostly cross-country differences in payment habits.
Since mid-2007, however, this has changed as the magnitude of T2 balances has risen dramatically. For instance, the T2 balance of the Bundesbank had reached a surplus of EUR 751 billion at the end of August 2012, roughly equal to 30% of Germany’s annual GDP. The Banca d’Italia, which had only a negligible T2 balance until June 2011, had a T2 deficit of EUR 289 billion by August 2012. Within the same time span, the Banco de España’s T2 deficit rose from EUR 47 billion to EUR 434 billion.
These developments have sparked a heated discussion regarding the underlying reasons for the emergence of the sizeable T2 imbalances and the appropriate policy reactions. The majority of central bankers, policymakers, and academics sees the large T2 balances as reflecting the substantial differences in the stability of the financial system across euro area member countries and the resulting funding problems for the banking systems in T2 deficit countries. Some observers – most notably Sinn (2011), Sinn and Wollmershaeuser (2011), and to some extent also Weidman (2012) – however argue that the T2 balances are also a consequence of current account (CA) imbalances. Moreover, the Bundesbank, in its Monthly Report in March 2012, asserts that the large increase in its T2 balance “reflects both the continued tension in the EMU financial markets and the balance of payments disequilibria within the euro area” (see Bundesbank (2012, p. 15)).
After providing some institutional background about the T2 system, this paper examines empirically whether and to what extent cross-border financial flows and CA balances are correlated with the evolution of T2 Balances. The starting point of this paper is a panel estimation, which is the first regression-type analysis in this literature.
A first result of this estimation is that while the evolution of CA balances was entirely unrelated to the evolution of T2 balances before the onset of the financial crisis in August 2007, thereafter, the correlation between these two time series became both statistically and economically significant.
As this result reflects correlations but not causal relationships, it has to be interpreted with care; however, this change in the correlation is hard to reconcile with the view that CA imbalances in the euro area are generally financed via the T2 system; rather, the change in the correlation is consistent with the fact that the financing of CA deficits changed with the onset of the financial crisis: whereas CA deficits were financed by private capital flows before 2007, private capital flows partly stopped. Since banks in CA deficit countries consequently began drawing more liquidity from their national central banks, large T2
2 According to the ECB’s Target Annual Report 2011, 91% of the total value of payments in large-value euro payment systems was done via the Target 2 system (see European Central Bank (2011)).

3
imbalances arose (the possibility of such events has been pointed out by Garber (1999 and 2010)).
Given this possible interpretation of the change in the correlation between T2 and CA balances reflecting a “sudden stop” that followed the extraordinary boom in capital flows during the pre-crisis period (see Lane (2012)), I next examine how different types of financial flows have evolved with the onset of the crisis and how this can be related to the evolution of T2 balances.
I first break down the evolution of private capital flows using the IMF’s balance of payments statistics, finding that neither portfolio or direct investments, nor reserve accounts or financial derivatives can explain the stop in private capital flows. Rather, the vast majority of this stop can be attributed to the “other” category in the balance of payments statistics.3 Among other things, this category includes changes in positions on both secured and unsecured interbank markets, as well as deposit flows, i.e. it mainly comprises financial flows between commercial banks.
To arrive at a better understanding of how banking sector capital flows have evolved, I next rely on the Bank for International Settlement’s (BIS) locational and consolidated banking statistics, which also include the positions of the banking sector vis-à-vis foreign governments and nonfinancial firms. I discuss, in turn, the role of cross-border positions between banks, of cross-border credit positions between the nonfinancial private sector and banks, and of positions of banks vis-à-vis foreign governments.
The biggest driver of financial flows are deposit flows of private investors and non-financial firms, but these are only weakly correlated with the evolution of T2 balances. By contrast, changes in the cross-border positions of the national banking systems (i.e. interbank markets), as well as changes in banks’ holdings of foreign government debt have markedly contributed to the evolution of T2 balances. I also document that T2 imbalances were somewhat reduced by the presence of banks with establishments in several countries that transferred funds to bank establishments in troubled markets.
I conclude with the implications of these findings as regards appropriate policy recommendations.
2. The Target2 System: Institutional Background Before examining the reasons that led to large T2 imbalances over the last few years, it is crucial to keep in mind two features of the institutional setup of the T2 system. The first is that the T2 system is exclusively a payment system. The second is that some kind of balances must be allowed for in order to make the euro area a federal monetary union and that T2 balances are merely the bookkeeping manifestation of this prerequisite.
The T2 system is a payment system. It links the central bank accounts of the commercial banks of the European Union with each other. Domestic payments are booked in T2 through
3 The “other” category also includes changes in T2 balances. The sentence refers to the “other” component minus the change in the T2 balances.

4
the respective national central bank (NCB). Cross-border payments are booked through the NCB of the sender, the ECB, and the NCB of the recipient.4
More concretely, assume that a private customer transfers euros from her Greek to her German bank account. This transfer is debited from her bank’s account with the Bank of Greece and then credited to her bank’s account with the Bundesbank. As each euro in the national banking system is a liability for the respective central bank, the liabilities side of the Bank of Greece’s (BoG) balance sheet is then “too small” and that of the Bundesbank’s balance sheet “too large”. T2 balances adjust for these discrepancies: the Bundesbank holds a claim against the ECB as an asset; the BoG has a liability of the same amount vis-à-vis the ECB.
European Union member that are not part of the Euro area have to repay net outflows at the end of each business day, i.e. they can never accumulate negative T2 balances. For example, following a large scale outflow of capital from Denmark to the Euro area, the Danmarks Nationalbank would either use Euros from its reserves or issue Kronas to buy Euro on the foreign exchange market in order to net these outflows.
Within a federal monetary union, balances of some form in the payment system must be allowed as otherwise it is not possible to guarantee the free movement of capital. The reason for this is that, in a monetary union, no single NCB can print money to net its payment system balance. If balances had to be netted periodically and an NCB had run out of foreign exchange reserves, no international transfers could be made from that country, i.e. the monetary union would in effect cease to exist. Within the euro area, the individual NCBs are thus not required to net their T2 balances.
It is important to note that T2 balances only arise owing to the federal structure of the ECB and the European System of Central Banks. Rather than money being issued centrally to commercial banks, this is done via the NCBs. If the ECB were to directly issue money to commercial banks in exchange for eligible collateral, “balances” of NCBs would never arise. The economic reality that commercial banks in peripheral Europe rely heavily on central bank financing would of course be completely unaltered by this change of how liquidity is distributed.
T2 balances are thus the bookkeeping manifestation of the intrinsic need to allow for unlimited balances in a federal monetary union.5
When these balances become large in magnitude as is currently the case, this signals underlying differences in the use of central bank liquidity by commercial banks across the euro area member countries.
A country’s cumulative T2 balance is equal to the cumulative net outflows of central bank liquidity to other euro area members. Net outflows, in turn, can be the result of either real transactions (imports which also affect the current account) or financial transactions (an investor transferring funds, which does not affect the current account). In practice, T2 balances will be small and temporary relative to outstanding liquidity-providing refinancing
4 In theory, banks that have establishments in multiple countries can choose to go through any of the NCBs their establishments are located in, but in practice, each establishment typically goes through the domestic NCB. 5 Other forms of balances would be possible; for example, the ECB could daily net each NCB’s T2 balance and credit/debit the netted amount from/to a different system. Carrying over the T2 balances is merely the most practical solution.

5
operations, as long as the private sector rebalancing of flows through the money market and alike functions: banks that receive net inflows, i.e. that would hold non-remunerated excess reserves, will place them with outflow banks and receive a market interest rate. However, if banks with outflows do not have access to the excess reserves of the other banks, they will then have to rely increasingly on funding from their NCB.6
The current full allotment policy of the ECB allows the banking system of euro zone member countries to draw extremely large credit volumes during episodes of financial crisis; via the T2 system, banks can use the borrowed liquidity throughout the euro area without any restrictions (this possibility was first pointed out in Garber (1999 and 2010)). Indeed, as brought to public attention by Sinn (2011), T2 imbalances have become pronounced over recent years. Figure 1 presents the evolution of T2 balances up to March 2012. Germany and the Netherlands are currently the two largest creditors. Their balances are almost completely offset by Greece, Ireland, Italy, Portugal, and Spain (GIIPS).
Figure 1: Target2 data are from the “Euro Crisis Monitor” of the Institute for Empirical Economic Research at the University of Osnabrueck. Accessed on 12 June 2012. “GIIPS” refers to the sum of the T2 balances of Greece, Ireland, Italy, Portugal, and Spain.
6 In normal times, the ECB provides liquidity equal to the aggregate minimum reserve requirements of the banks in the Eurosystem. It remunerates these balances up to the required minimum reserve, but not beyond. Thus, each bank has an incentive to hold exactly the minimum (which was actually the case up to the crisis). If a bank has more cash inflows than outflows at the end of the day, it will lend the amount above the required minimum in the money market. Conversely, if a bank has more outflows than inflows it will borrow the difference in the money market. Owing to this arrangement, no money can leave the banking system and overall, the difference between net outflows and net inflows must be zero.
-100
0-5
000
500
T2 b
alan
ce, i
n bi
llions
EU
R
2006q1 2007q3 2009q1 2010q3 2012q1
Germany Netherlands* ItalyFrance Spain GreeceIreland GIIPS
* Netherlands plus Luxembourg

6
3. Proximate and Ultimate Causes of T2 Imbalances: the Current Debate While, in principle, T2 balances can arise from either real transactions or financial transactions,7 most researchers and policymakers agree that T2 imbalances are caused by differential liquidity and funding conditions across the banking system in the euro area, and only a few hold the view originally purported by Sinn (2011), that T2 balances are directly driven by the financing of CA imbalances via ECB refinancing.
Before digging into this debate, it is worth highlighting the common starting observation of both schools of thought: T2 balances are unambiguously related to central bank refinancing operations. For example, Figure 2 presents the Greek case. The blue line plots the total refinancing volume of Greek private banks with the Bank of Greece, while the red line plots the T2 balance of the BoG (this figure is inspired by Neumann (2011)).
Most of the ECB’s overall central bank liquidity provision currently goes to banks located in peripheral Europe. Figure 3 shows the share of liquidity provision in the euro area to the national central banks of Greece, Italy, Ireland, Spain, Portugal, Germany, and the other member states combined. At the end of 2011, the T2 deficit countries accounted for around 80% of the demand for ECB liquidity.
Figure 3: From Bindseil et al (2012)
7 Note that T2 balances can also arise for other reasons. For example, Austria – due to its large tourism industry – is a major net recipient of banknotes, so that the Austrian National Bank (OeNB) has to issue fewer banknotes than it would be entitled to under the ECB capital key. The Austrian T2 balance tends to be negative, but this is nearly exactly offset by the OeNB’s claims against the ECB from non-allocated banknotes (see Jobst et al. (2012)).
Figure 2: Compiled by Author
7
While there is agreement on the link between a country’s T2 balance and the extent to which the banking system draws on central bank liquidity provision, the underlying ultimate reason why banks require this liquidity is heavily debated.
Sinn (2011), Sinn and Wollmershaeuser (2011), and Bundesbank (2012) argue that at least some of the increasing T2 imbalances mirror the persistent intra-European CA imbalances, i.e. the fact that the European periphery is currently financing both consumption and investment partly via the ECB. According to this argument, the banking flows are the results of underlying real transactions. Going back to the example of a private customer transferring euros from her Greek to her German bank account, the underlying assertion of Sinn (2011) and Sinn and Wollmershaeuser (2011) is that in many cases this transaction reflects the payment for a previous import from Germany to Greece, for example an imported car.
The empirical evidence for and against such arguments is only of anecdotal and graphical nature (see, among many others, Sinn and Wollmershaeuser (2011), Buiter et al. (2011 a, b and c), Bornhorst and Mody (2012), Jobst et al. (2012), and Bindseil and Koenig (2012)). The latter studies graphically interpret the evolution of T2 and CA time series as either evidence for or against the importance of CA imbalances for T2 imbalances.
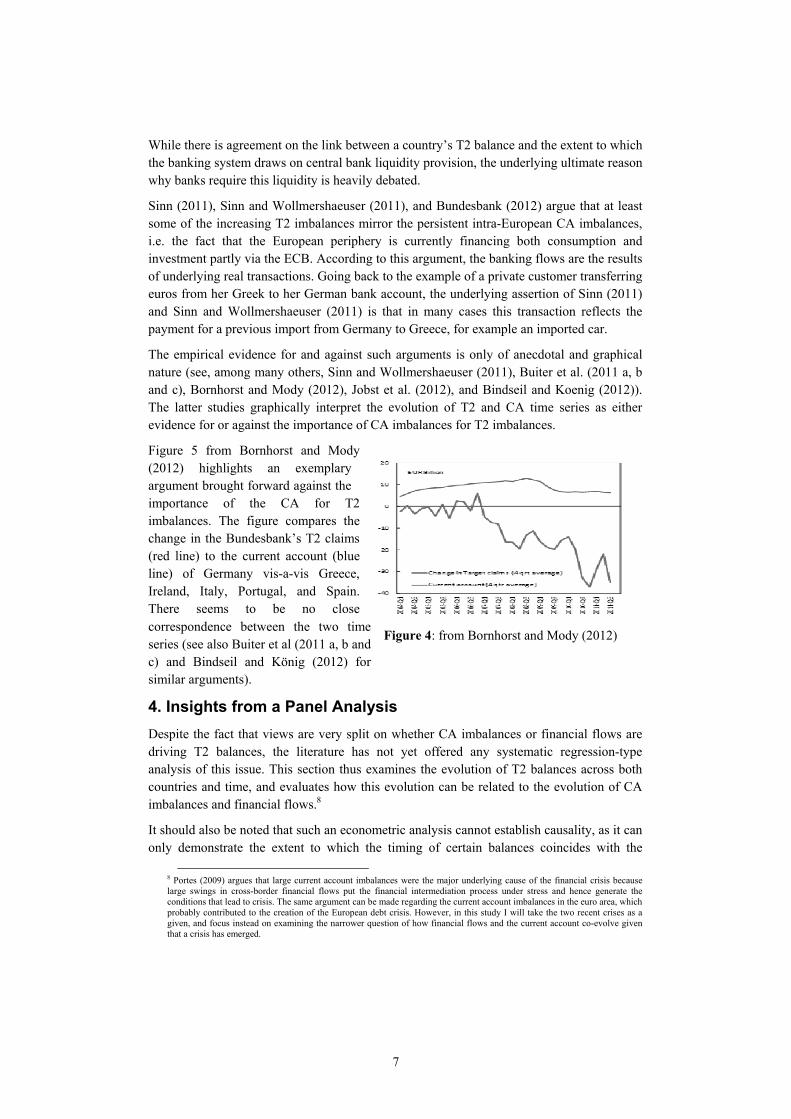
Figure 5 from Bornhorst and Mody (2012) highlights an exemplary argument brought forward against the importance of the CA for T2 imbalances. The figure compares the change in the Bundesbank’s T2 claims (red line) to the current account (blue line) of Germany vis-a-vis Greece, Ireland, Italy, Portugal, and Spain. There seems to be no close correspondence between the two time series (see also Buiter et al (2011 a, b and c) and Bindseil and König (2012) for similar arguments).
4. Insights from a Panel Analysis Despite the fact that views are very split on whether CA imbalances or financial flows are driving T2 balances, the literature has not yet offered any systematic regression-type analysis of this issue. This section thus examines the evolution of T2 balances across both countries and time, and evaluates how this evolution can be related to the evolution of CA imbalances and financial flows.8
It should also be noted that such an econometric analysis cannot establish causality, as it can only demonstrate the extent to which the timing of certain balances coincides with the
8 Portes (2009) argues that large current account imbalances were the major underlying cause of the financial crisis because large swings in cross-border financial flows put the financial intermediation process under stress and hence generate the conditions that lead to crisis. The same argument can be made regarding the current account imbalances in the euro area, which probably contributed to the creation of the European debt crisis. However, in this study I will take the two recent crises as a given, and focus instead on examining the narrower question of how financial flows and the current account co-evolve given that a crisis has emerged.
Figure 4: from Bornhorst and Mody (2012)

8
evolution of T2 imbalances. The analysis of this section thus has only a modest primary goal: it aims at establishing whether the respective time series are statistically significantly correlated, whether the magnitudes of the correlations are economically important, and whether the correlation structure changed with the onset of the financial turmoil in 2007.9
To fix ideas regarding the interpretation of the uncovered coefficients, it is useful to start with the balance of payments identity relating the current account CA and the financial account FA (sometimes also referred to as the capital account).10 For every country c and every period of time t, it is true that
(1),
where the balancing item captures errors and omissions in the current and financial accounts.
The FA is equal to the change in total foreign ownership of domestic assets minus the change in domestic ownership of foreign assets. For the analysis at hand, it is useful to split the FA into the private sector FA (PFA) and the government sector FA (GFA). Changes in T2 balances are included in the GFA; for example, an increase in the T2 claims of de Nederlandsche Bank is recorded as a capital export in the Dutch balance of payments.
Further splitting the government account into changes in the T2 balance ( ) and other changes in the government’s net foreign asset positions ( , which includes the official reserve account and intra-Eurosystem claims other than T2 balances), it holds that
(2).
In theory, if the errors and omissions were negligible and all the variables on the right-hand side (RHS) of equation (2) were known precisely, any change in a country’s T2 balance could be fully accounted for by the country’s current account, net private capital exports, and government capital exports from other sources (see also Bundesbank (2012) for a related discussion).
However, even aside from the existence of sizeable errors and omissions, especially during times of financial crisis,11 this pure accounting exercise is not a useful one as it does not add to our understanding of the underlying causes of the development of the individual elements on the right-hand side of equation (2).
Rather, what is of interest are the relationships between these elements and the likely reasons for such relationships. Consider, for example, a regression of the type
9 It is important to keep this modest goal of the analysis in mind when interpreting the analysis below. Words such as “explains” or “drives” refer to the statistical correlation between variables, but do not imply an economic interpretation that argues in a specific direction of causality. There exist multiple economic interpretations of the relationships uncovered below. 10 Note that I refer to a broad concept of the FA. The IMF has adopted a different definition, in which the "financial account" is a separate entry into the balance of payments than the “capital account”. More specifically, the IMF uses the term “capital account” to designate a small subset of particular financial transactions that are included in the definition of the FA in the present paper. 11 Regarding errors and omissions, substantial efforts have been devoted to accurately capturing valuation effects in the current account following the pioneering work of Lane and Milesi-Ferretti (2001, 2002, and 2004)). Still, owing to the difficulty of valuing ever more complex structured products, considerable fluctuations in the value of international asset positions are not accurately captured in international current account data. This problem may have been especially pronounced during the two recent crises, which strongly affected the value of structured products. Gourinchas and Rey (2007) document that the riskiness of international investments differs strongly across countries, so that also the errors and omissions may systematically differ across countries during financial turmoil (Lane and Milesi-Ferretti (2011) further document the cross-country incidence of the global crisis).

9
(3)
If the estimated coefficient is equal to 1, this means that none of the other variables on the right-hand side of equation (2) adjusts when a country’s CA is smaller or larger than zero and, consequently, capital is exported or imported via the use of central bank liquidity (and thus visible in the T2 system) in response to a CA surplus or deficit. If the estimated coefficient is smaller than one, this means that other variables – most likely private capital exports – adjust whenever CA imbalances arise. If private capital flows fully offset the CA, the estimated coefficient is equal to 0.
This study thus first investigates the degree to which CA deficits have been financed by the private sector, and also whether the relationship changed with the onset of the financial and European debt crises. Since I do find that, with the European debt crisis, the relationship between the current account and T2 balances changed substantially, in the second step of the analysis I dissect the kind of private investment flows that are correlated to the evolution of T2 balances.
4.1. Data Description
For this paper, a dataset covering the quarterly evolution of T2 balances, CA balances, financial account statistics, various financial flows, and refinancing operations since the advent of the euro in 1999 is assembled. The quarterly panel dataset spans Q1 1999 to Q1 2012 and 12 countries (all euro zone members publishing T2 balances on a quarterly basis).
I collect quarterly information on the CA and the FA, as well as various subcomponents, from the balance of payments statistics (BOPS) of the IMF. Information on the evolution of the national T2 balances is taken from the “Euro Crisis Monitor” of the Institute for Empirical Economic Research at the University of Osnabrueck (see Steinkamp and Westermann (2012)); these data are in turn collected from the NCBs, where T2 balances are recorded under “claims/liabilities on the Eurosystem“ of individual central banks of the euro area countries.
I also collect data on bilateral financial flows from the consolidated banking statistics of the BIS. From this dataset, I use the consolidated international claims of BIS reporting banks, foreign and international claims on an immediate borrower basis, and the sectoral breakdown (banks, public sector, and non-bank private sector). Additionally, since the consolidated banking statistics do not include inter-office positions (positions between affiliated bank establishments located in different countries), those are obtained from the BIS locational banking statistics. I include international bank positions by nationality, and claims and liabilities on related foreign offices from the latter data series. Last, monthly total deposit liabilities in the euro area by non-monetary financial institutions (excluding central government) are collected as a measure of private sector deposit flows.12
4.2. Central Bank Refinancing and T2 Balances
Before discussing whether financial flows or the CA are driving T2 balances, it is worth examining whether T2 balances are indeed closely related to central bank refinancing operations, defined as the monthly claims of central banks on monetary institutions.
12 See http://sdw.ecb.europa.eu/browse.do?node=2019191.

10
Table 1 documents that the link between central bank refinancing operations and T2 balances is statistically highly significant and economically important. All estimations in Table 1 present random effect panel estimations that relate the quarterly change in a country’s T2 balance to the quarterly change in the volume of refinancing operations carried out at the respective NCB.
In column (1), the sample covers all quarters from the beginning of 1999 to the first quarter of 2012. The dependent variable is the quarterly (q/q) change in a country’s T2 balance and the independent variable is the q/q change in the refinancing volume at the NCB. The coefficient is estimated at –0.445, implying that if the refinancing volume at one NCB increases by EUR 1 billion, this is on average associated with the country’s T2 balance decreasing by EUR 445 million. Column (2) documents that this relationship has not changed since the start of the financial crisis. In this estimation, the sample period is restricted to Q3 2007 to Q1 2012, resulting in a coefficient of –0.413.
The data used in columns (1) and (2) are measured in billions of euros, and the regression coefficients are thus heavily influenced by the bigger countries, most notably Germany. In columns (3) and (4), therefore, I repeat these specifications but normalize both the change in the T2 balance and the refinancing volume by GDP. To make sure that this normalization does not itself drive changes in dependent and independent variables, the normalization is done using pre-crisis (2007) GDP rather than current GDP.
The relationship between T2 balances and refinancing operations is even stronger when evaluated as a fraction of GDP. When estimated over the entire sample in column (3), the coefficient of –0.519 implies that if refinancing operations at the NCB increase by 1% of GDP, the country’s T2 balance decreases by 0.519% of GDP. Nearly the same relationship between T2 balances and refinancing operations is found when restricting the sample to the post-crisis period.13
13 When evaluating T2 balances and refinancing operations in terms of GDP, Luxembourg is excluded from the analysis as the country’s T2/GDP ratio is a clear outlier.
(1) (2) (3) (4)Model Name: Nominal, Nominal, Normalized by Normalized,
Full Sample from Q3 07 2007 GPD from Q3 07
Sample Period: Q1 99 -Q1 12 Q3 07 - Q1 12 Q1 99 -Q1 12 Q3 07 - Q1 12
Dependent Variable:
Q/Q ch. Refinancing Volume -0.445*** -0.413***reported by NCB [0.032] [0.048]
Q/Q ch. (Ref. Volume/ 07 GDP) -0.519*** -0.512***[0.042] [0.064]
Observations 595 227 555 208Number of Countries 12 12 11 11R-Square (within) 0.241 0.244 0.222 0.237R-Square (between) 0.243 0.606 0.0882 0.175R-Square (overall) 0.238 0.259 0.219 0.232Standard errors in brackets; *** p<0.01, ** p<0.05, * p<0.10
(1)&(2) q/q ch. T2 Balance in EUR (3)&(4) q/q ch. (T2 Balance/2007 GDP)
Table 1 - Refinancing Operations and T2 Balances (RE Panel Estimations)

11
4.3. CA Balances and T2 Balances
I next investigate the degree to which CA deficits have been financed by the private sector, and also whether the relationship changed with the onset of the financial and the European debt crises.
Figure 5 documents the relationship between the CA balance and the evolution of the T2 balance. The figure presents a scatter plot relating the quarterly change in a country’s T2 balance to its quarterly CA balance. If euro area periphery countries are currently financing their CA deficit via the ECB, a negative CA should be associated with a negative change in the country’s T2 balance. Indeed, the correlation between the CA and the change in the T2 balance is highly significant in both economic and statistical terms. The coefficient of the displayed regression line is estimated at +0.335. If one were to interpret this coefficient as reflecting a causal relationship, for Greece, which ran an average quarterly CA deficit of EUR 5.4 billion during 2010 and 2011, this would imply that the country’s CA deficit during that time increased its T2 balance by EUR 1.8 billion (=0.335 x 5.4) each quarter. The CA deficit would thus “account” for around one-quarter of the total increase in the country’s T2 deficit (on average EUR 7 billion per quarter during 2010 and 2011).
Table 2 documents that the relationship between the CA balance and the evolution of the T2 balance is both statistically and economically significant for a range of robustness tests. In columns (1) to (5) of Table 2, the dependent variable is the quarterly change in the country’s T2 balance and the independent variable includes the quarterly CA balance.
Column (1) presents a random effects panel estimation reproducing the fitted line in Figure 5. The regression coefficient is estimated at 0.335 and is highly significant.
Figure 5: Sample of 573 quarterly observations from Q1 1999 to Q4 2011 in the 12 original euro area members; data from IMF IFS.
-125
-75
-25
2575
125
q/q
Ch.
of T
2 Ba
lanc
e (B
il EU
R)
-40 -20 0 20 40 60CA Balance (quarterly, Bil EUR)
The Current Account and T2 Balances (99-11)

12
An important concern with Figure 6 and column (1) is that these correlations are driven only by time-invariant cross-country differences. For example, Germany had a positive CA balance throughout nearly the entire sample, and its T2 balance grew most of the time. On the contrary, Greece had a negative CA balance while its T2 balance continued to decrease.
Thus, the correlation presented in column (1) could be entirely driven by the fact that countries are different; it is much stronger evidence for the argument that CA imbalances “cause” T2 claims if the precise timing of the two series also correlates within each country.14
Column (2) thus documents that the evolution of a country’s T2 balance can actually be tracked well by the precise timing of changes in the CA balance for that country. For this, country fixed effects are added to the estimation, which absorb country-specific averages.
14 The importance of this concern is also documented by the high between-R^2 compared to the low within-R^2, i.e. most of the model’s explanatory power is driven by the variation across countries rather than the variation over time within each country.
(1) (2) (3) (4) (5) (6) (7) (8) (9) (10) (11) (12)
Model Name Baseline Country (1) from Q3 (1) before Q3 same as (5) same as (2) Normalized (7) from Q3 (7) before Q3 same as (8) same as (8) (11) incl.
Characterst ics 2007 onwards 2007 & 3 Lags & 7 Lags by GDP 2007 onwards 2007 & 2 Lags & 7 Lags Lux
Estimation Type RE Panel FE Panel RE Panel RE Panel RE Panel RE Panel RE Panel RE Panel RE Panel RE Panel RE Panel RE PanelSample Period: Q3 07-Q1 12 Q1 99-Q3 07 Q3 07-Q1 12 Q3 07-Q1 12 Q1 99-Q1 12 Q1 99-Q3 07
Dependent Variable
Quarterly CA in Euro 0.335*** 0.256*** 0.575*** 0.006 -0.416 0.102[0.061] [0.097] [0.110] [0.061] [0.317] [0.481]
1 Quarter Lag -0.199 -0.320[0.353] [0.597]
2 Quarter Lag 0.151 0.261[0.350] [0.602]
3 Quarter Lag 1.088*** 1.499***[0.323] [0.510]
4 Quarter Lag -0.801[0.529]
5 Quarter Lag 0.113[0.628]
6 Quarter Lag -0.037[0.635]
7 Quarter Lag -0.201[0.493]
Quarterly CA/ 2007 GDP 0.374*** 0.756*** -0.041 0.775* 1.009 0.182[0.105] [0.228] [0.058] [0.457] [0.707] [1.099]
1 Quarter Lag -0.526 -1.268 -3.694***[0.466] [0.779] [1.132]
2 Quarter Lag 0.180 0.585 2.903**[0.473] [0.809] [1.187]
3 Quarter Lag 0.310 0.096 0.003[0.469] [0.763] [1.176]
4 Quarter Lag -0.299 -1.068[0.749] [1.155]
5 Quarter Lag 0.975 5.245***[0.818] [1.198]
6 Quarter Lag -0.561 -3.520***[0.825] [1.209]
7 Quarter Lag 0.215 1.514[0.744] [1.165]
Sum of Coefficients 0.624*** 0.615*** 0.739*** 0.752*** 1.564***[0.108] [0.111] [0.242] [0.246] [0.459]
Observations 573 573 216 345 216 216 534 198 325 198 198 216Number of Groups 12 12 12 12 12 12 11 11 11 11 11 12R-Square (within) 0.0123 0.0123 0.0113 1.74e-05 0.0495 0.0675 0.00630 0.00698 0.00231 0.0134 0.0202 0.126R-Square (between) 0.867 0.867 0.901 0.0121 0.894 0.904 0.552 0.543 0.0325 0.558 0.577 0.420R-Square (overall) 0.0505 0.0505 0.113 2.39e-05 0.190 0.206 0.0234 0.0530 0.00152 0.0605 0.0686 0.173Standard errors in brackets; *** p<0.01, ** p<0.05, * p<0.10
Table 2 - Are T2 Balances Driven By Current Account Imbalances?
Statistics For Cummulative Dynamic Impact of CA
(1) to (5): Quarterly Ch. T2 Balance in Euro (6) to (9): Q. Ch. of (T2 Balance/GDP)(1)&(2): Q1 99-Q1 12 (10)-(12) Q3 07-Q1 12

13
The remaining variation is that, over time, both the CA and changes in the T2 balance fluctuate around the country-specific mean. Also when accounting for country characteristics, the estimated coefficient of the CA is highly significant and economically large, at 0.256. A Hausman test does not reject the null hypothesis that the random effects in column (1) are correlated with the errors. Thus, the remainder of Table 2 continues with random effects estimations.
It is likely that the correlation between the current account and T2 balances intensified during the crisis. Indeed, column (3) reproduces the specification of column (1), but the sample only starts in Q3 2007. The coefficient of CA balances increases markedly compared to the estimation spanning the entire sample (from 0.335 to 0.575).
The estimation in the pre-crisis subsample column (4) even documents that the entire correlation displayed in column 1 can be attributed to the post-crisis period. In column (4), the sample is restricted to the pre-crisis period, resulting in an insignificant and economically small coefficient.
Columns (3) and (4) present two important findings regarding the financing of CA imbalances via the use of central bank liquidity. First, there is no evidence that central bank liquidity had financed CA imbalances before the financial crisis (see (4)). Second, the coefficient of 0.575 in (3) is consistent with the interpretation that at the current juncture over half of CA imbalances are being financed by central bank liquidity.
The structural break in the correlation between CA and T2 balances implies that the way CA deficits are financed changed with the financial crisis, and that private financing was substituted by public funding via the T2 system. This raises the immediate question of what kind of changes in private sector capital flows took place with the onset of the financial crisis, a question that will be answered in the next section.
Before that, however, it is worth establishing the robustness of the correlation between CA and T2 balances in the post-crisis sample. Columns (5) and (6) document that the impact of CA imbalances on the rate of T2 accumulation is somewhat larger when the estimation allows for a lagged impact of the CA on the T2 balance. In both specifications, the sample is restricted to the post-crisis sample. Column (5) extends the analysis to the one-year horizon and adds the first, second, and third lags of the CA to the estimation of column (3). Column (6) adds a further four lags to the estimation of column (3). The total dynamic impact of a CA balance is reported at the bottom of Table 2 and is equal to 0.624 for the case of 3 lags and 0.615 for the case of 7 lags.
The coefficient of the CA balance increases slightly when all variables are normalized by GDP. Both when evaluating the full sample (column (7)) or the post-Q3 2007 sample (column (8)), the coefficient is larger than when evaluating the non-normalized relationship (compare to columns (1) and (5) respectively). Again, it is found that the relationship between the CA and T2 balances was insignificant before the crisis (see column (9)).
Similarly, when allowing for the CA balance to affect the T2 balance with a lag (from (10) onwards; all use post-crisis sample), the coefficients are larger when evaluating normalized versus non-normalized variables (compare (5) and (6) to (10) and (11)). Column (12) documents the effect of including Luxembourg in the estimation. The latter inclusion greatly
14
050
010
0015
0020
00cu
m c
h. in
bil
Eur s
ince
01
2002
2002q1 2004q3 2007q1 2009q3 2012q1
FGLN Cum Ch. Private Claims FGLN Cum Ch. T2FGLN Cum CA
FGLN - cum. CA and how it was Invested
-150
0-1
000
-500
0cu
m c
h. in
bil
Eur
sin
ce 0
1 20
02
2002q1 2004q3 2007q1 2009q3 2012q1
GIIPS Cum Ch. Private Claims GIIPS Cum Ch. T2GIIPS Cum CA
GIIPS - cum. CA and how it was Financed
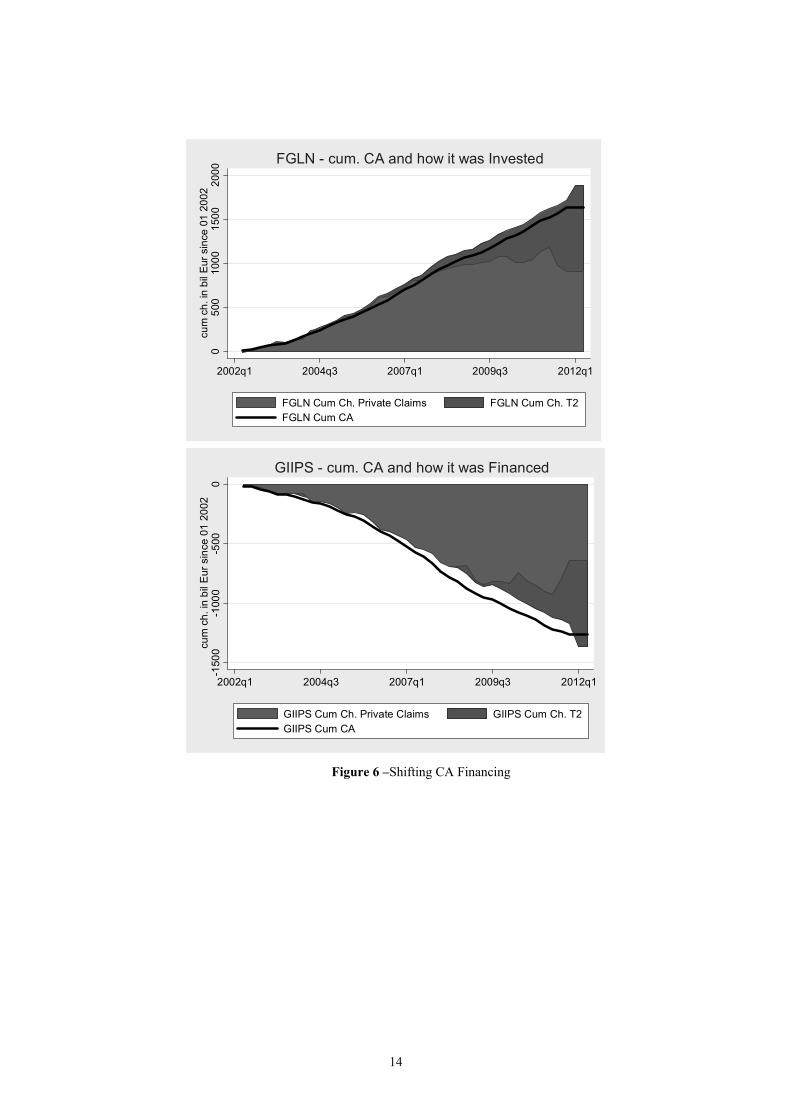
Figure 6 –Shifting CA Financing

15
increases the estimated coefficient (compare (11) and (12)), but graphical inspection indicates that Luxembourg is an outlier and should not be included in this analysis.
5. The Shift in Financing of CA Balances
5.1. Overall Importance of the Shift to Central Bank Liquidity Financing
The change in the coefficient of Table 3 implies that the onset of the financial crisis caused CA balances to be financed differently. The overall importance of this shift is documented in the upper and lower panels of Figure 6, which displays the cumulative evolution of the financial and current account for the last decade. 15
For Figure 6, I create two subgroups of countries. The first is the group of large T2 creditors and is termed “FGLN” as it comprises Finland, Germany, Luxembourg, and the Netherlands. The second includes the group of large T2 debtors and is termed “GIIPS” as it comprises Greece, Ireland, Italy, Portugal, and Spain. This sample split thus excludes Austria, Belgium, and France, whose T2 balances have not changed drastically over the last few years. For both groups, I construct the cumulative CA, the cumulative change in the T2 balance, and the cumulative FA minus the T2 balance starting from the beginning of 2002.
The bold line in the upper plot of Figure 6 displays the cumulative CA since the start of 2002 for the FGLN group. The total colored area represents the cumulative FA since the start of 2002 for the same group of countries.16 This area is split into the blue area, representing the cumulative change in the T2 balance, and the red area, representing other financing of the FA. The lower plot of Figure 6 presents the same time series for the GIIPS group of T2 debtors.
As is evident from these two plots, the onset of the financial crisis brought about a change in the way the CA imbalances in the euro area were financed. Whereas in the years leading up to August 2007, T2 balances did not accumulate, because private capital inflows to the GIIPS group more or less exactly offset the CA deficit of this group, while capital outflows from the FGLN group more or less offset the CA surplus of this group.
With the onset of the financial crisis, private capital flows suddenly stopped and even reversed somewhat. Since the CA reacted much less to the financial crisis, this resulted in a net financing need in the GIIPS group of countries, which led to the banking system drawing liquidity from national central banks, and thus to negative T2 balances. Mirroring this development, T2 balances in the FGLN group turned positive.17
5.2. A Closer Look at the Financial Account
Which kinds of changes in financial flows are behind the shift from private to public financing of CA deficits? I first present an overview of the large investment patterns in the data that are behind the switch, documented above, from private to public financing using
15 Lane et al (2011A) document the global drying-up of private capital flows during the financial crisis, while Brutti and Sauré (2012) document the renationalization of the European banking industry during the financial and European debt crisis. 16 Because of errors and omissions and lags in reporting, the sum of the constructed FA balances does not align exactly with the cumulative CA balance. 17 See Merler and Pisani Ferry (2012). For a related observation for Germany, see Bundesbank (2012) and Whelan (2012). Note that in Figure 6, EU/IMF assistance programmes are included in the red area measuring the cumulative change in GIIPS Private Claims; at the end of 2011, the latter amounted to around 30% of GDP in Greece, around 15% of GDP in Portugal, and around 10% in Ireland (0 in Spain and Italy; see Merler and Pisani Ferry (2012).
16
the IMF’s Balance of Payments Statistics (BOPS). The BOPS database includes information on a country’s CA and FA, and it also splits the FA data into the main categories.
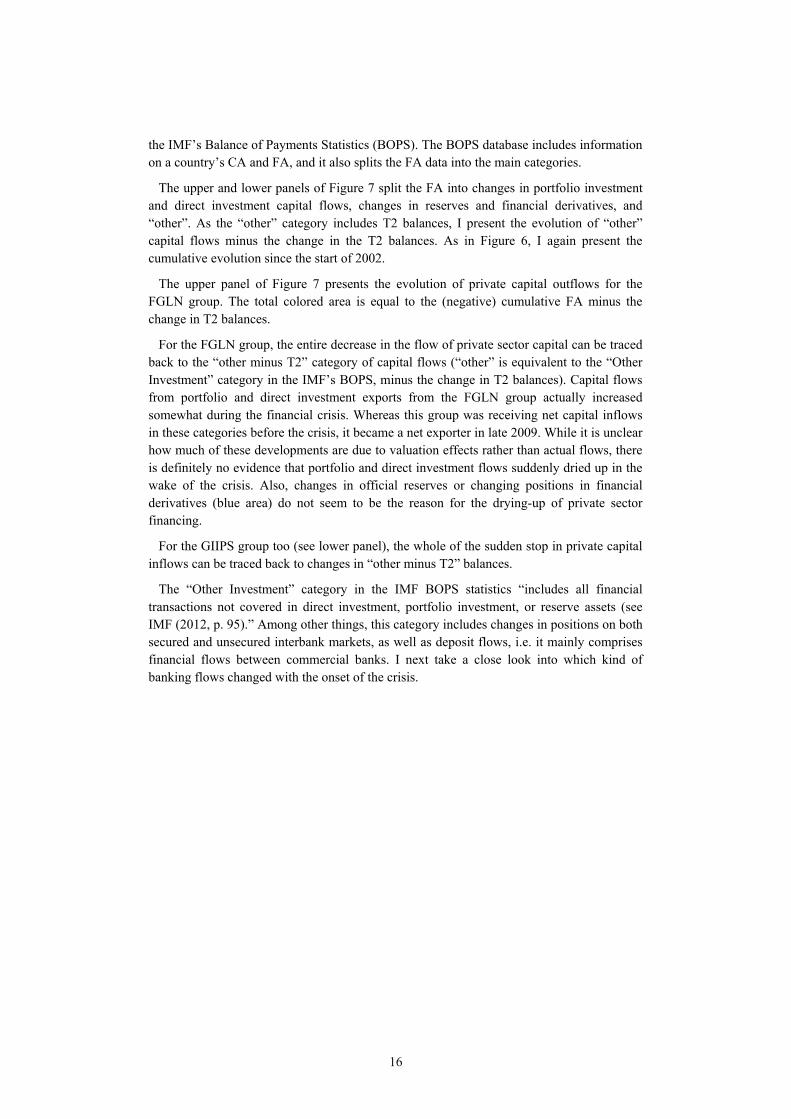
The upper and lower panels of Figure 7 split the FA into changes in portfolio investment and direct investment capital flows, changes in reserves and financial derivatives, and “other”. As the “other” category includes T2 balances, I present the evolution of “other” capital flows minus the change in the T2 balances. As in Figure 6, I again present the cumulative evolution since the start of 2002.
The upper panel of Figure 7 presents the evolution of private capital outflows for the FGLN group. The total colored area is equal to the (negative) cumulative FA minus the change in T2 balances.
For the FGLN group, the entire decrease in the flow of private sector capital can be traced back to the “other minus T2” category of capital flows (“other” is equivalent to the “Other Investment” category in the IMF’s BOPS, minus the change in T2 balances). Capital flows from portfolio and direct investment exports from the FGLN group actually increased somewhat during the financial crisis. Whereas this group was receiving net capital inflows in these categories before the crisis, it became a net exporter in late 2009. While it is unclear how much of these developments are due to valuation effects rather than actual flows, there is definitely no evidence that portfolio and direct investment flows suddenly dried up in the wake of the crisis. Also, changes in official reserves or changing positions in financial derivatives (blue area) do not seem to be the reason for the drying-up of private sector financing.
For the GIIPS group too (see lower panel), the whole of the sudden stop in private capital inflows can be traced back to changes in “other minus T2” balances.
The “Other Investment” category in the IMF BOPS statistics “includes all financial transactions not covered in direct investment, portfolio investment, or reserve assets (see IMF (2012, p. 95).” Among other things, this category includes changes in positions on both secured and unsecured interbank markets, as well as deposit flows, i.e. it mainly comprises financial flows between commercial banks. I next take a close look into which kind of banking flows changed with the onset of the crisis.

17
-100
0-5
000
cum
ch.
sin
ce 0
1/02
(+ is
equ
al to
out
flow
)
2002q1 2004q3 2007q1 2009q3 2012q1
Cum Portfolio & Direct Inv. Cum 'other-T2'Cum Reserve & Derivatives
GIIPS - Evolution of Net Private Capital Outflows
-500
050
010
0015
00cu
m c
h. s
ince
01/
02 (+
is e
qual
to o
utflo
w)
2002q1 2004q3 2007q1 2009q3 2012q1
Cum Portfolio & Direct Inv. Cum 'other-T2'Cum Reserve & Derivatives
FGLN - Evolution of Net Private Capital Outflows
Figure 7: Evolution of Private Capital Flows

18
5.3. The Role of Banking Sector Positions for Cross-Country Financial Flows and T2 Balances
Against the backdrop of the above findings, it is of particular interest to evaluate how and which bank financial flows changed with the onset of the financial crisis and how this change correlates with T2 balances.
In this section, I thus use additional data from the consolidated and locational banking statistics of the BIS. The advantage of these data is that they include positions of the national banking system against sectors (banks, non-bank private sector, public sector), thus enabling me to better trace the exact source of the sudden stop.18
I discuss, in turn, the role of cross-border positions between banks, cross-border credit positions between the nonfinancial private sector and banks, and positions of banks vis-à-vis foreign governments.
Again, the results of the regression estimated in this section have to be interpreted with care. The coefficients do not reflect causal relationships; as is clear from the accounting identity laid out above, in an accounting sense any type of financial flow has a 1-to-1 impact on T2 balances. Rather, the estimation results reflect the endogenous response of both changes in T2 balances and the specific financial flows to economic shocks. Understanding this endogeneity, how it is different for different types of financial flows, and how it has evolved over time can enhance our understanding of the sudden stop that led to the swelling of T2 balances.
5.3.1. The Role of Cross-Border Bank Flows
Regarding cross-border positions between banks, columns (1) to (3) of Table 3 examine the role of the cross-border interbank market, that is, the changes in positions between banks that are not affiliated and that are also located in different countries. I use the change in a country’s cross-country interbank claims and liabilities from the BIS consolidated banking statistics.
A positive change in a country’s net interbank claims is expected to be associated with a T2 deficit as it is equivalent to a capital outflow. Such a change either reflects that domestic banks have higher claims against the foreign counterparties or that foreign banks have lower claims against domestic counterparties. Both can only be achieved by funds being transferred abroad, i.e. by capital outflows.
Column (1) investigates the relationship between quarterly changes in T2 balances as the dependent variable and quarterly changes in net cross-country interbank claims as the independent variable. The latter are defined as the difference between the change in claims (e.g. a change in the amount that Dutch banks are owed by banks located in any other country of the world) and liabilities (e.g. a change in the amount that Dutch banks themselves owe banks located in any other country of the world).
18 The BIS consolidated banking statistics do include information on foreign claims of banks headquartered in country A on the three sectors in country B for every given point in time. However, when it comes to changes in these positions, the banking statistics cannot discern valuation effects from portfolio flows. For a discussion of these limitations, see pp. 16-17 in BIS (2011).

19
The estimation in the full sample yields a coefficient of –0.122, i.e. on average an increase in net cross-border interbank claims of EUR 1 billion is associated with a decrease in the T2 balance by EUR 122 million. Columns (2) and (3) document that the correlation between T2 balances and such positions has intensified since Q3 2007. While the coefficient between the two series is estimated at –0.064 in the period before this date (see column (2)), it is more than double in magnitude (0.157, see (3)) thereafter.
Columns (4) and (5) allow for the magnitude of the coefficient of changes in external interbank liabilities and changes in interbank claims to differ, and include both these variables as independent variables. As expected, changes in claims have a negative coefficient, while changes in liabilities have a positive coefficient.
While the interbank market has thus contributed to the drying-up of private capital flows in the euro area, the latter has been stabilized by the presence of banks with establishments in several countries.
In addition to using the cross-border interbank market, European banks also transfer funds between the various offices located in different countries. The resulting positions are collected in the BIS locational banking statistics under the heading “inter-office claims and liabilities”.
Columns (6) to (10) examine the correlation between T2 balances and such inter-office flows, documenting their stabilizing role for the European financial system. Columns (6) to (8) include changes in the net inter-office position (defined as the change in claims minus liabilities) as the only regressor. The estimation in column (6) covers the entire sample, that in (7) the crisis period and that in (8) the pre-crisis period.
The correlation between inter-office claims and T2 balances is positive on average, and this is entirely driven by the post-crisis sample (see (7)); in fact, the coefficient is even negative in the pre-crisis sample (see (8)).
(1) (2) (3) (4) (5) (6) (7) (8) (9) (10)
Type of Flow
Sample Period Q1 99-Q1 12 after Q3 07 until Q3 07 after Q3 07 until Q3 07 Q1 99-Q1 12 after Q3 07 until Q3 07 after Q3 07 until Q3 07
Quarterly Ch. in Net -0.122*** -0.157*** -0.064***Interbank Position [0.026] [0.053] [0.020]
Quarterly Ch. in -0.123** -0.075***Interbank Claims [0.058] [0.021]
Quarterly Ch. in 0.209*** 0.018Interbank Liabilities [0.065] [0.030]
Quarterly Ch. in 0.075** 0.163** -0.034Inter-Office Position [0.038] [0.071] [0.034]
Quarterly Ch. in 0.227*** -0.051Inter-Office Claims [0.083] [0.035]
Quarterly Ch. In -0.144* 0.005Inter-Office Liabilities [0.074] [0.037]
Observations 551 216 335 216 335 584 216 368 216 368Number of Groups 12 12 12 12 12 12 12 12 12 12R-Square (within) 0.0378 0.0356 0.0275 0.0461 0.0422 0.00655 0.0237 0.00292 0.0393 0.0144R-Square (between) 0.00246 0.347 0.326 0.346 0.0130 0.146 0.171 0.0507 0.169 0.0830R-Square (overall) 0.0358 0.0469 0.0290 0.0518 0.0405 0.00677 0.0244 0.00274 0.0276 0.0112Standard errors in brackets; *** p<0.01, ** p<0.05, * p<0.10
Dependent Variable: Quarterly Ch. T2 Balance in Euro
All estimations present random effect panel estimations
Table 3 - Flows Between Banks and the Evolution of Target2 Balances
(1)-(5) Interbank Market Flows (6)-(10) Interoffice Flows

20
Figure 8 - Interbank and Interoffice Flows
-100
0-5
000
500
1000
cum
ch.
in b
il Eu
r sin
ce 0
1 20
02
2002q1 2004q3 2007q1 2009q3 2012q1
GIIPS Cum Ch. Bank Claims GIIPS Cum Ch. T2FGLN Cum Ch. Bank Claims FGLN Cum Ch. T2
Interbank Net Positions and T2 Balances-1
000
-500
050
010
00cu
m c
h. in
bil
Eur s
ince
01
2002
2002q1 2004q3 2007q1 2009q3 2012q1
GIIPS Cum Ch. Intoffice Claims GIIPS Cum Ch. T2FGLN Cum Ch. Intoffice Claims FGLN Cum Ch. T2
Interoffice Flows and T2 Balances

21
The positive coefficients in the crisis sample are consistent with large banks with establishments in multiple countries transferring funds to the European periphery. Whenever tensions in the periphery arose and banks in these countries had to rely on central bank liquidity, establishments that were part of an international bank could, in addition, draw on inter-office flows from establishments in other countries.
Figure 8 documents the evolution of interbank market flows and inter-office flows, and contrasts that with the evolution of T2 balances. For this, I first split the sample into the group of large T2 creditors (Finland, Germany, Luxembourg, and the Netherlands; termed “FGLN”) and the group of large T2 debtors (Greece, Ireland, Italy, Portugal, and Spain; termed “GIIPS”).
In terms of magnitude, changes in the interbank market net claims position can account for a non-negligible proportion of T2 balances since the start of the crisis. The upper panel of Figure 8 documents the cumulative change in the T2 balance (dotted lines) and in the net interbank market position (solid lines) of these two groups of countries since the beginning of 2000. The cumulative change for the GIIPS group is plotted in red, while that for the FGLN group is plotted in black.
The lower panel of Figure 8 documents that the stabilizing effect of inter-office flows was comparatively small in magnitude. This panel presents the cumulative change in T2 balances (dotted lines) and in the net inter-office position (solid lines) since the start of 2000. The cumulative change for the GIIPS group is plotted in red, while that for the FGLN group is plotted in black. Although inter-office flows have moved such that T2 imbalances are reduced, the overall magnitude is small compared to interbank market positions.
5.3.2. Cross-Border Flows Initiated by the Non-bank Private Sector
The above two figures have demonstrated the evolution of the interbank market and examined whether it was a possible source of T2 imbalances. In addition, transactions between the non-bank sector and the banking sector can potentially affect T2 balances; for example, if a Spanish resident decides to open an account in Germany and transfers funds from her old Spanish account to the new German account, this is reflected in an equivalent increase in the non-bank private sector claims of Spain on Germany. This transaction is also likely to affect the Spanish and German T2 balances, as the German bank will eventually move the liquidity it has received and deposit part of it at the Bundesbank, while the Spanish bank will draw liquidity from the Banco de España.
Columns (1) to (5) of Table 4 document the evolution of T2 balances and cross-country positions in claims and liabilities of the non-bank private sector against banks. The dependent variable is the quarterly change in the T2 balance. In (1) to (3), the independent variable is the quarterly change in net cross-country claims of the non-bank private sector against banks, i.e. the change in what domestic residents and non-bank enterprises are owed by foreign banks minus what domestic banks owe to foreign residents and non-bank enterprises.
There is only a weak correlation between changes in net claims of the non-bank private sector and the evolution of T2 balances. This is true for both the full sample (column (1))

22
and the crisis sample (2). The coefficient is negative and significant in the pre-crisis sample of column (3), although the coefficient of –0.042 is small in magnitude.
The absence of a strong correlation is also found when allowing for claims and liabilities to have coefficients of different magnitudes. Columns (4) and (5) include changes in external liabilities of the domestic private non-bank sector against foreign banks, as well as changes in domestic liabilities of the domestic banking sector against the foreign private non-bank sector, as regressors. The estimation in column (4) is restricted to the crisis sample, while that in (5) is restricted to the pre-crisis sample. Only the coefficient for claims on foreign banks in the pre-crisis sample is significant at the 5% level and all coefficients are small in magnitude.
A potential explanation for the absence of a strong instantaneous correlation is that it takes time until such transactions are reflected in T2 balances. For example, German banks might react to the inflow of funds only after these have persisted for some time and are no longer viewed as transitory.
Indeed, the correlation between such financial flows and T2 balances is much stronger over longer horizons. Columns (6) and (7) include seven lags of the quarterly change in net claims of the non-bank private sector against banks, yielding a coefficient of –0.377 for the crisis sample (significant at the 1% level, see (6)). No significant correlation is found in the pre-crisis sample (see (7)).
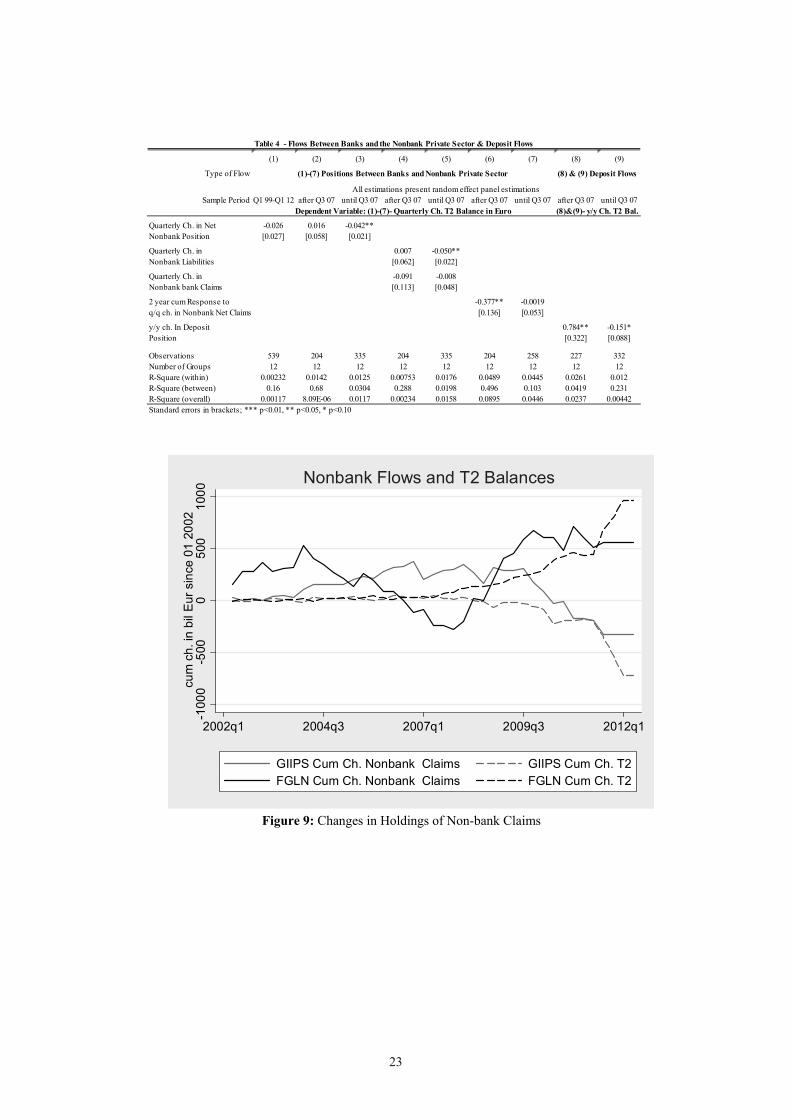
Figure 9 presents the overall evolution of non-bank net positions since the beginning of 2000 and contrasts that with the evolution of T2 balances. The cumulative change for the GIIPS group is plotted in red, while that for the FGLN group is plotted in black.
Columns (8) and (9) of Table 4 present further evidence for the importance of private deposit flows. For these specifications, I use the total deposit liabilities in the euro area by non-monetary financial institutions (excluding central government) as a measure of private sector deposit flows between countries. This is a more direct measure of deposit flows than the data from the BIS, which also include other items such as bank bond holdings by the non-bank private sector. In columns (8) and (9), the independent variable is the 12-month change in net deposit liabilities, i.e. the inflow/outflow of deposits to/from a country over the last year. The dependent variable is the change in the country’s T2 balance during the same 12-month period.
The relationship between deposit flows and changes in T2 balances is very strong in the crisis sample but there is no significant relationship in the pre-crisis sample. The coefficient in column 8) is estimated at 0.784, which is significant at the 5% level and not significantly different from 1. By contrast, in the pre-crisis sample of column (9), the coefficient is negative and nearly significantly so. While this change in the relationship between deposit flows again emphasizes the importance of direct deposit flight for T2 balances, it should be noted that these deposit flows are not very large. The standard deviation of the 12-month change in net deposit liabilities in the crisis sample is EUR 9 billion, and the largest outflows and inflows are equal to EUR 36.7 billion (Spain in Q4 2011) and EUR 25.4 billion (Germany in Q3 2007)) respectively. Given that T2 balances changed by up to EUR 150 billion per quarter (Germany Q1 2012), deposit flight is just one of the factors explaining the growth of T2 balances.
23
Figure 9: Changes in Holdings of Non-bank Claims
(1) (2) (3) (4) (5) (6) (7) (8) (9)
Type of Flow
Sample Period Q1 99-Q1 12 after Q3 07 until Q3 07 after Q3 07 until Q3 07 after Q3 07 until Q3 07 after Q3 07 until Q3 07
Quarterly Ch. in Net -0.026 0.016 -0.042**Nonbank Position [0.027] [0.058] [0.021]
Quarterly Ch. in 0.007 -0.050**Nonbank Liabilities [0.062] [0.022]
Quarterly Ch. in -0.091 -0.008Nonbank bank Claims [0.113] [0.048]
2 year cum Response to -0.377** -0.0019q/q ch. in Nonbank Net Claims [0.136] [0.053]
y/y ch. In Deposit 0.784** -0.151*Position [0.322] [0.088]
Observations 539 204 335 204 335 204 258 227 332Number of Groups 12 12 12 12 12 12 12 12 12R-Square (within) 0.00232 0.0142 0.0125 0.00753 0.0176 0.0489 0.0445 0.0261 0.012R-Square (between) 0.16 0.68 0.0304 0.288 0.0198 0.496 0.103 0.0419 0.231R-Square (overall) 0.00117 8.09E-06 0.0117 0.00234 0.0158 0.0895 0.0446 0.0237 0.00442Standard errors in brackets; *** p<0.01, ** p<0.05, * p<0.10
Table 4 - Flows Between Banks and the Nonbank Private Sector & Deposit Flows
All estimations present random effect panel estimations
(8) & (9) Deposit Flows(1)-(7) Positions Between Banks and Nonbank Private Sector
Dependent Variable: (1)-(7)- Quarterly Ch. T2 Balance in Euro (8)&(9)- y/y Ch. T2 Bal.-1
000
-500
050
010
00cu
m c
h. in
bil
Eur s
ince
01
2002
2002q1 2004q3 2007q1 2009q3 2012q1
GIIPS Cum Ch. Nonbank Claims GIIPS Cum Ch. T2FGLN Cum Ch. Nonbank Claims FGLN Cum Ch. T2
Nonbank Flows and T2 Balances
24
5.3.3. Banks’ Evolving Positions vis-à-vis Foreign Governments
A third position of interest are banks’ holdings of foreign government debt. The changes in these positions were potentially large as banks in T2 creditor countries reduced their holdings of European periphery debt.
Table 5 examines the importance of the quarterly change in net banking sector claims against foreign governments, defined as the change in the claims of domestic banks against foreign governments minus the change in the claims of foreign banks against the domestic government. In all estimations, the dependent variable is the quarterly change in the T2 balance.
There is a strong correlation between changes in such net claims, and this correlation increased with the financial crisis. In columns (1) to (3), the dependent variable is the quarterly change in net banking sector claims against foreign governments. In (1) the full sample is included, while in (2) and (3) the sample is restricted to the crisis and post-crisis periods respectively. In the crisis period, the coefficient is estimated at –0.328 and is significant at the 1% level.
When it comes to changes in banking sector claims against foreign governments, there is an asymmetry between how changes in claims and changes in liabilities affect T2 balances. If claims of domestic banks against foreign governments decrease, this reflects direct decisions by domestic banks. However, if claims of foreign banks against the domestic government change, this primarily affects the domestic government rather than domestic banks directly. For example, if foreign banks do not roll over maturing debt, foreign liabilities decrease, but the domestic banking sector is only affected if the domestic government then turns to local banks to fund its cash needs.
Columns (4) to (6) document that it is primarily changes in liabilities which are correlated with the evolution of T2 balances. In both estimations, changes in claims and liabilities in the cross-border claims of banks against the public sector are included as independent variables. Column (4) covers the entire sample, while (5) and (6) are restricted to the crisis and pre-crisis period respectively. For the crisis period, the coefficient of changes in liabilities to foreign banks is estimated at 0.627.
The large size of the coefficient for changes in liabilities could be explained by the fact that governments of peripheral countries which no longer received funds from foreign banks turned increasingly to domestic banks, who bought domestic sovereign bonds to use as collateral at the NCB in exchange for central bank liquidity.
Figure 10 documents the overall evolution of net banking sector claims against foreign governments, and of gross liabilities. It also contrasts these time series to the evolution of T2 balances. Again, the sample is split into the group of large T2 creditors and the group of large T2 debtors.
In terms of magnitude, changes in banking sector claims against foreign governments are again non-negligible compared to the evolution of T2 balances. Figure 10 documents the cumulative change in the T2 balance (dotted lines) and net banking sector claims against foreign governments (solid lines) of these two groups of countries since the third quarter of

25
2007. The cumulative change for the GIIPS group is plotted in red, while that for the FGLN group is plotted in black.
Figure 10: Cumulative Change in Banks’ Net Claims Against Foreign Governments
(1) (2) (3) (4) (5) (6)
Type of Flow
Sample Period Q1 99-Q1 12 after Q3 07 until Q3 07 Q1 99-Q1 12 after Q3 07 until Q3 07
Quarterly Ch. in Net -0.251*** -0.328*** -0.140***External Public Position [0.057] [0.115] [0.044]
Quarterly Ch. In -0.113* -0.147 -0.09External Public Claims [0.066] [0.127] [0.055]
Quarterly Ch. In 0.490*** 0.627*** 0.230***External Public Liabilities [0.081] [0.149] [0.074]
Observations 525 204 321 525 204 321Number of Groups 12 12 12 12 12 12R-Square (within) 0.0302 0.0336 0.0295 0.0578 0.0761 0.0375R-Square (between) 0.871 0.349 0.0561 0.593 0.385 0.0118R-Square (overall) 0.0356 0.0464 0.0301 0.0653 0.0894 0.0372Standard errors in brackets; *** p<0.01, ** p<0.05, * p<0.10
Table 5 - Banks Positions Against the Public Sector
(1)-(6) Changing Positions Against the Public Sector
All estimations present random effect panel estimations
Dependent Variable: Quarterly Ch. T2 Balance in Euro
-100
0-5
000
500
1000
cum
ch.
in b
il Eu
r sin
ce 0
1 20
02
2002q1 2004q3 2007q1 2009q3 2012q1
GIIPS Cum Ch. Ext Gov NClaims GIIPS Cum Ch. T2FGLN Cum Ch. Ext Gov NClaims FGLN Cum Ch. T2
Government Debt Positions and T2 Balances

26
6. Conclusion T2 balances arise owing to the federal structure of the ECB. If cross-border private monetary flows are unbalanced within the euro area, the usage of central bank liquidity is uneven and these balances can become large in magnitude. This signals underlying differences in the health of the financial system and/or macroeconomic imbalances within the euro area.
To shed light on what has caused the large T2 imbalances in the euro area in recent years, I examine how the evolution of T2 balances across both countries and time correlates with the evolution of CA imbalances and financial flows in a panel analysis.
A first result is that the evolution of CA balances was entirely unrelated to the evolution of T2 balances before the onset of the financial crisis in 2007, but that the correlation in the period thereafter is pronounced both statistically and in terms of magnitudes.
This change in the correlation is consistent with the explanation that the financing of CA deficits changed with the onset of the financial crisis. Whereas CA deficits were financed by private capital flows before 2007, private capital flows from T2 creditor countries partly stopped thereafter. Since banks in CA deficit countries had to respond to this funding gap by drawing more liquidity from their national central banks, T2 imbalances increased.
Given this interpretation of the change in the correlation between T2 and CA balances reflecting a partial “sudden stop,” I next examine how different types of financial flows evolved with the onset of the crisis and how this can be related to the evolution of T2 balances. Among other things, I find that the stop in capital flows can be traced back to the interbank market, to banks’ holdings of foreign public debt, and to some extent to deposit flows of the non-bank private sector. I also find that banks with establishments in multiple countries transferred funds from T2 creditor nations to T2 debtor nations, i.e. they actually reduced T2 imbalances.
A first implication of these findings is that the current system of allowing for unlimited T2 balances is not fundamentally flawed. Most fundamentally, this study finds no evidence that T2 balances financed CA imbalances while the European financial sector was still healthy. As such, it is reasonable to assume that once the current crisis ends, T2 balances will stop growing.
The current system has dampened the effect of the European debt crisis on real activity in T2 debtor countries. Given the extent to which the sudden stop of private capital flows was offset via central bank liquidity, it is likely that the economic crisis in Greece or Spain would have been even more pronounced had T2 balances been limited in some way.
This being said, it is nevertheless true that reducing the large T2 balances accumulated during the crisis will not be a trivial endeavor. Such a reduction could in theory be easily achieved by higher interest rates on central bank liquidity, more stringent collateral requirements, and bigger haircuts on collateral. In practice, since such policies will be quite costly to the economies of the T2 debtor countries, it might prove politically hard to decide upon and implement them.

27
This issue ultimately relates to the transfer of risk from T2 debtor nations to T2 creditor nations that has been emphasized in Sinn (2011, 2012a and b). There are three types of scenario under which losses for T2 creditor countries would arise.
The first risk is that T2 debtor NCBs could suffer losses if the commercial banks drawing liquidity from them cannot repay their loans and these loans are under-collateralized. Any such losses would be shared among the euro area members according to their relative contributions to the ECB’s capital and hence affect the T2 creditor nations.
A second risk could arise if a T2 debtor country were to exit the Euro area. Losses could then arise for the remaining Euro area members if the exiting country would not honour its liabilities vis-à-vis the ECB. Also these losses would be shared among the remaining euro area members according to their relative contributions to the ECB’s capital.
The third risk is of a different type and arises if a T2 surplus country were to exit the Euro area. Losses could then arise for the NCB of the exiting country. For example, if Germany were to exit and reintroduce the Deutschmark at an exchange rate of initially 1-to-1 to the Euro, the Deutschmark was likely to successively appreciate against the Euro. The Bundesbank would then be owed its T2 balances of currently EUR 751 billion by the ECB, but it would in turn owe 751 billion Deutschmarks to German Banks. Due to this mismatch of the denomination of assets and liabilities, losses could arise for the Bundesbank if the Deutschmark were to appreciate against the Euro.
Although the probability that large scale losses will result for T2 creditor countries is small, the current system in effect has transferred risk from T2 debtor to T2 creditor nations. Given that such a transfer of risk is generally associated with a distortion of the incentives to engage in structural reforms, it is worthwhile to consider how aspects of the current system could be reformed to reduce T2 imbalances and avoid a re-emergence of such imbalances in the future.
Limiting T2 balances or periodically netting them, as has among others been proposed by Sinn (2012 a and b), is not a viable option if the Euro area is to remain a true monetary union. For example, under such a policy a NCB could hit its limit or run out of foreign exchange reserves to net its T2 balance. Then, no private citizen could transfer money from the country in question to another part of the Euro area.
More promising policy recipes could aim at improving the alignment between who decides upon the distribution of central bank liquidity and who bears potential losses arising from such decisions. One option would be to strengthen the federal aspects of the system and augment them by transferring the financial risk back to national governments. This could, for example, be achieved by making each national government being responsible for losses arising from the liquidity operations of its NCB. A different option that achieves the same goal would be a move towards a more centralized system in which the ECB has more direct control over how liquidity is distributed. A first step towards achieving the latter would be a strict homogenization of collateral policy across the NCBs in the euro zone, as was the case before the financial crisis.
A further problem with the current economic realities concerns the transfer of risk from the private to the public sector via the increased provision of central bank liquidity. The above

28
analysis documents that the drying-up of private capital flows to T2 debtor countries mainly resulted from banks in T2 creditor countries reducing their cross-country interbank loans and cross-country holdings of foreign debt. Ultimately, this constitutes a transfer of risk from the banking sector to the government within the T2 creditor nations.
This risk transfer from the private to the public sector cannot be limited by changing the design of the Eurosystem. Rather, it requires that the health of the European banking system be restored in all countries, and that the banking system be designed such that banks’ incentives to repatriate funds during financial crises are minimized.
In this context, the recent decision to have a common bank supervision that ensures the homogeneity of bank regulation across the euro area seems promising, particularly as regards minimizing the likelihood of a re-emergence of T2 imbalances in the future.
Along with common supervision, the intra-European diversification of the banking sector should also be encouraged. The above analysis shows that, while the interbank market has strongly re-nationalized in the wake of the crisis and thus contributed to T2 imbalances (see also Brutti and Sauré (2012), Milesi Ferretti and Tille (2011), and Lane (2012) for evidence on this re-nationalization of the financial system during recent crises), inter-office flows between affiliated bank establishments have actually stabilized the financial system. The creation of truly European commercial banks would thus contribute to the overall stability of the European financial system.
REFERENCES
Bank for International Settlements (2011), “What the BIS banking statistics say (and what they do not) about banking systems’ exposures to particular countries and sectors”, pp. 16-17 in BIS Quarterly Review, March 2011.
Ulrich Bindseil, Philippine Cour-Thimann, and Philipp König (2012), “Target2 and Cross-border Interbank Payments during the Financial Crisis”, CESifo Forum 13 (Special Issue January 2012), 83-92
Ulrich Bindseil and Philipp König (2012), “TARGET2 and the European Sovereign Debt Crisis”, Mimeo, FU Berlin, February 15, 2012
Fabian Bornhorst and Ashoka Mody (2012), “TARGET imbalances: Financing the capital-account reversal in Europe”, VoxEU.org, 7 March.
Filippo Brutti and Philip Sauré (2012), “Secondary Bond Markets in Times of Debt Crisis: An Empirical Assessment”, mimeo, University of Zurich
Willem H. Buiter, E Rahbari, and J Michels (2011a), “The implications of intra-Eurozone imbalances in credit flows”, CEPR Policy Insight No. 57
___ (2011b), “TARGETing the wrong villain: TARGET2 and intra-Eurosystem imbalances in credit flows”, Citi Global Economics View, 9 June.
___ (2011c), “TARGETing the wrong villain: a reply”, Citi Global Economics View, 5 July.

29
Bundesbank (2012), “Monthly Report March 2012”, Bundesbank Monthly Reports,
Vol 64, No 3
CESifo Forum (2012), "The European balance of Payments Crisis", CESifo Forum Special Issue 1/2012.
European Central Bank (2011), “TARGET Annual Report 2011”, http://www.ecb.europa.eu/pub/pdf/other/targetar2011en.pdf
European Economic Advisory Group (2012), The EEAG Report on the European Economy, "The European Balance-of-Payments Problem", CESifo, Munich 2012, Chapter 2, pp. 57–81.
Peter M. Garber (1999), "The target mechanism: Will it propagate or stifle a stage III crisis?", Carnegie-Rochester Conference Series on Public Policy, 51(1), 1999.
___ (2010), "The Mechanics of Intra Euro Capital Flight", Deutsche Bank Global Markets Research, Economics Special Report, 2010.
Pierre-Olivier Gourinchas and Hélène Rey (2007), ”International Financial Adjustment”, Journal of Political Economy, Vol. 115 n.4, 2007
Stefan Homburg (2011), "Anmerkungen zum Target2-Streit", Wirtschaftsdienst, 91(8), 2011.
International Monetary Fund (2012), “Balance of Payment Statistics Manual 2012”, http://www.imf.org/external/pubs/ft/bopman/bopman.pdf
Clemens Jobst, Martin Handig, and Robert Holzfeind (2012), “Reference to Understanding TAR GET 2: The Eurosystem’s Euro Payment System from an Economic and Balance Sheet Perspective”, Austrian National Bank, Monetary Policy & the Economy Q1/12, 2012
Philip R. Lane (2012), “Capital Flows in the Euro Area”, Report under Preparation for the European Commission.
Philip R. Lane and Gian Maria Milesi-Ferretti (2001), "The external wealth of nations: measures of foreign assets and liabilities for industrial and developing countries", Journal of International Economics, Elsevier, vol. 55(2), pages 263-294, December.
___ (2002), "External wealth, the trade balance, and the real exchange rate", European Economic Review, Elsevier, vol. 46(6), pages 1049-1071, June.
___ (2004), "The Transfer Problem Revisited: Net Foreign Assets and Real Exchange Rates," The Review of Economics and Statistics, MIT Press, vol. 86(4), pages 841-857, November.
___ (2011), “The Cross-Country Incidence of the Global Crisis”, IMF Economic Review 59(1), 77-110.
Silvia Merler and Jean Pisani-Ferry (2012). “Sudden Stops in the Euro Area” Brugel Policy Contribution, Issue 2012/06, March 2012.

30
Gian Maria Milesi Ferretti and Cédric Tille (2011), "The great retrenchment:
international capital flows during the global financial crisis," Economic Policy, vol. 26(66), pages 285-342, 04.
Manfred J.M. Neumann (2011), “Refinanzierung der Banken treibt Target-Verschuldung”, ifo Schnelldienst 16/2011.
Richard Portes (2009), “Global imbalances”, in M Dewatripont, X Freixas, and R Portes (eds.), Macroeconomic stability and financial regulation: Key issues for the G20, Centre for Economic Policy Research.
Hans-Werner Sinn (2011), “The ECB’s stealth bailout”, VoxEU.org, 1 June.
____ (2012a), “Fed versus ECB: How TARGET debts can be repaid”, VoxEU.org, 10 March 2012.
____ (2012b), "Die Target-Kredite der Deutschen Bundesbank", ifo Schnelldienst 03/2012 (Sonderheft).
Hans-Werner Sinn und Timo Wollmershaeuser (2011), "Target Loans, Current Account Balances and Capital Flows: The ECB's Rescue Facility", NBER Working Paper No. 17626, 2011.
Sven Steinkamp and Frank Westermann (2012), “On Creditor Seniority and Sovereign Bond Prices in Europe”, University of Osnabrück, Institute for Empirical Economic Research, Working Paper 92, August 2012
Karl Whelan (2012), “Target2 and the Euro Crisis”, Presentation at Bank of England’s Centre for Central Banking Studies, June 26, 2012
Jens Weidman (2012), “Rebalancing Europe”, Speech at Chatham House, 28.03.2012: http://www.bundesbank.de/download/presse/reden/2012/20120328.weidmann.en.php; (accessed on 23.05.2012)

Swiss National Bank Working Papers published since 2004: 2004-1 Samuel Reynard: Financial Market Participation and the Apparent Instability of
Money Demand 2004-2 Urs W. Birchler and Diana Hancock: What Does the Yield on Subordinated Bank Debt Measure? 2005-1 Hasan Bakhshi, Hashmat Khan and Barbara Rudolf: The Phillips curve under state-dependent pricing 2005-2 Andreas M. Fischer: On the Inadequacy of Newswire Reports for Empirical Research on Foreign Exchange Interventions 2006-1 Andreas M. Fischer: Measuring Income Elasticity for Swiss Money Demand: What do the Cantons say about Financial Innovation? 2006-2 Charlotte Christiansen and Angelo Ranaldo: Realized Bond-Stock Correlation:
Macroeconomic Announcement Effects 2006-3 Martin Brown and Christian Zehnder: Credit Reporting, Relationship Banking, and Loan Repayment 2006-4 Hansjörg Lehmann and Michael Manz: The Exposure of Swiss Banks to
Macroeconomic Shocks – an Empirical Investigation 2006-5 Katrin Assenmacher-Wesche and Stefan Gerlach: Money Growth, Output Gaps and
Inflation at Low and High Frequency: Spectral Estimates for Switzerland 2006-6 Marlene Amstad and Andreas M. Fischer: Time-Varying Pass-Through from Import
Prices to Consumer Prices: Evidence from an Event Study with Real-Time Data 2006-7 Samuel Reynard: Money and the Great Disinflation 2006-8 Urs W. Birchler and Matteo Facchinetti: Can bank supervisors rely on market data?
A critical assessment from a Swiss perspective 2006-9 Petra Gerlach-Kristen: A Two-Pillar Phillips Curve for Switzerland 2006-10 Kevin J. Fox and Mathias Zurlinden: On Understanding Sources of Growth and
Output Gaps for Switzerland 2006-11 Angelo Ranaldo: Intraday Market Dynamics Around Public Information Arrivals 2007-1 Andreas M. Fischer, Gulzina Isakova and Ulan Termechikov: Do FX traders in
Bishkek have similar perceptions to their London colleagues? Survey evidence of market practitioners’ views

2007-2 Ibrahim Chowdhury and Andreas Schabert: Federal Reserve Policy viewed through a Money Supply Lens
2007-3 Angelo Ranaldo: Segmentation and Time-of-Day Patterns in Foreign Exchange
Markets 2007-4 Jürg M. Blum: Why ‘Basel II’ May Need a Leverage Ratio Restriction 2007-5 Samuel Reynard: Maintaining Low Inflation: Money, Interest Rates, and Policy
Stance 2007-6 Rina Rosenblatt-Wisch: Loss Aversion in Aggregate Macroeconomic Time Series 2007-7 Martin Brown, Maria Rueda Maurer, Tamara Pak and Nurlanbek Tynaev: Banking
Sector Reform and Interest Rates in Transition Economies: Bank-Level Evidence from Kyrgyzstan
2007-8 Hans-Jürg Büttler: An Orthogonal Polynomial Approach to Estimate the Term
Structure of Interest Rates 2007-9 Raphael Auer: The Colonial Origins Of Comparative Development: Comment.
A Solution to the Settler Mortality Debate
2007-10 Franziska Bignasca and Enzo Rossi: Applying the Hirose-Kamada filter to Swiss data: Output gap and exchange rate pass-through estimates
2007-11 Angelo Ranaldo and Enzo Rossi: The reaction of asset markets to Swiss National Bank communication
2007-12 Lukas Burkhard and Andreas M. Fischer: Communicating Policy Options at the Zero
Bound 2007-13 Katrin Assenmacher-Wesche, Stefan Gerlach, and Toshitaka Sekine: Monetary
Factors and Inflation in Japan 2007-14 Jean-Marc Natal and Nicolas Stoffels: Globalization, markups and the natural rate
of interest 2007-15 Martin Brown, Tullio Jappelli and Marco Pagano: Information Sharing and Credit:
Firm-Level Evidence from Transition Countries 2007-16 Andreas M. Fischer, Matthias Lutz and Manuel Wälti: Who Prices Locally? Survey
Evidence of Swiss Exporters 2007-17 Angelo Ranaldo and Paul Söderlind: Safe Haven Currencies

2008-1 Martin Brown and Christian Zehnder: The Emergence of Information Sharing in Credit Markets
2008-2 Yvan Lengwiler and Carlos Lenz: Intelligible Factors for the Yield Curve 2008-3 Katrin Assenmacher-Wesche and M. Hashem Pesaran: Forecasting the Swiss
Economy Using VECX* Models: An Exercise in Forecast Combination Across Models and Observation Windows
2008-4 Maria Clara Rueda Maurer: Foreign bank entry, institutional development and
credit access: firm-level evidence from 22 transition countries 2008-5 Marlene Amstad and Andreas M. Fischer: Are Weekly Inflation Forecasts
Informative? 2008-6 Raphael Auer and Thomas Chaney: Cost Pass Through in a Competitive Model of
Pricing-to-Market 2008-7 Martin Brown, Armin Falk and Ernst Fehr: Competition and Relational Contracts:
The Role of Unemployment as a Disciplinary Device 2008-8 Raphael Auer: The Colonial and Geographic Origins of Comparative Development 2008-9 Andreas M. Fischer and Angelo Ranaldo: Does FOMC News Increase Global FX
Trading? 2008-10 Charlotte Christiansen and Angelo Ranaldo: Extreme Coexceedances in New EU
Member States’ Stock Markets
2008-11 Barbara Rudolf and Mathias Zurlinden: Measuring capital stocks and capital services in Switzerland
2008-12 Philip Sauré: How to Use Industrial Policy to Sustain Trade Agreements 2008-13 Thomas Bolli and Mathias Zurlinden: Measuring growth of labour quality and the
quality-adjusted unemployment rate in Switzerland 2008-14 Samuel Reynard: What Drives the Swiss Franc? 2008-15 Daniel Kaufmann: Price-Setting Behaviour in Switzerland – Evidence from CPI
Micro Data
2008-16 Katrin Assenmacher-Wesche and Stefan Gerlach: Financial Structure and the Impact of Monetary Policy on Asset Prices
2008-17 Ernst Fehr, Martin Brown and Christian Zehnder: On Reputation: A
Microfoundation of Contract Enforcement and Price Rigidity
2008-18 Raphael Auer and Andreas M. Fischer: The Effect of Low-Wage Import Competition on U.S. Inflationary Pressure
2008-19 Christian Beer, Steven Ongena and Marcel Peter: Borrowing in Foreign Currency:
Austrian Households as Carry Traders
2009-1 Thomas Bolli and Mathias Zurlinden: Measurement of labor quality growth caused by unobservable characteristics
2009-2 Martin Brown, Steven Ongena and Pinar Ye,sin: Foreign Currency Borrowing by
Small Firms 2009-3 Matteo Bonato, Massimiliano Caporin and Angelo Ranaldo: Forecasting realized
(co)variances with a block structure Wishart autoregressive model 2009-4 Paul Söderlind: Inflation Risk Premia and Survey Evidence on Macroeconomic
Uncertainty 2009-5 Christian Hott: Explaining House Price Fluctuations 2009-6 Sarah M. Lein and Eva Köberl: Capacity Utilisation, Constraints and Price
Adjustments under the Microscope 2009-7 Philipp Haene and Andy Sturm: Optimal Central Counterparty Risk Management 2009-8 Christian Hott: Banks and Real Estate Prices 2009-9 Terhi Jokipii and Alistair Milne: Bank Capital Buffer and Risk
Adjustment Decisions
2009-10 Philip Sauré: Bounded Love of Variety and Patterns of Trade 2009-11 Nicole Allenspach: Banking and Transparency: Is More Information
Always Better?
2009-12 Philip Sauré and Hosny Zoabi: Effects of Trade on Female Labor Force Participation 2009-13 Barbara Rudolf and Mathias Zurlinden: Productivity and economic growth in
Switzerland 1991-2005 2009-14 Sébastien Kraenzlin and Martin Schlegel: Bidding Behavior in the SNB's Repo
Auctions 2009-15 Martin Schlegel and Sébastien Kraenzlin: Demand for Reserves and the Central
Bank's Management of Interest Rates 2009-16 Carlos Lenz and Marcel Savioz: Monetary determinants of the Swiss franc

2010-1 Charlotte Christiansen, Angelo Ranaldo and Paul Söderlind: The Time-Varying Systematic Risk of Carry Trade Strategies
2010-2 Daniel Kaufmann: The Timing of Price Changes and the Role of Heterogeneity 2010-3 Loriano Mancini, Angelo Ranaldo and Jan Wrampelmeyer: Liquidity in the Foreign
Exchange Market: Measurement, Commonality, and Risk Premiums 2010-4 Samuel Reynard and Andreas Schabert: Modeling Monetary Policy 2010-5 Pierre Monnin and Terhi Jokipii: The Impact of Banking Sector Stability on the
Real Economy 2010-6 Sébastien Kraenzlin and Thomas Nellen: Daytime is money 2010-7 Philip Sauré: Overreporting Oil Reserves 2010-8 Elizabeth Steiner: Estimating a stock-flow model for the Swiss housing market 2010-9 Martin Brown, Steven Ongena, Alexander Popov, and Pinar Ye,sin: Who Needs
Credit and Who Gets Credit in Eastern Europe? 2010-10 Jean-Pierre Danthine and André Kurmann: The Business Cycle Implications of
Reciprocity in Labor Relations 2010-11 Thomas Nitschka: Momentum in stock market returns: Implications for risk premia
on foreign currencies 2010-12 Petra Gerlach-Kristen and Barbara Rudolf: Macroeconomic and interest rate
volatility under alternative monetary operating procedures 2010-13 Raphael Auer: Consumer Heterogeneity and the Impact of Trade Liberalization:
How Representative is the Representative Agent Framework? 2010-14 Tommaso Mancini Griffoli and Angelo Ranaldo: Limits to arbitrage during the
crisis: funding liquidity constraints and covered interest parity 2010-15 Jean-Marc Natal: Monetary Policy Response to Oil Price Shocks 2010-16 Kathrin Degen and Andreas M. Fischer: Immigration and Swiss House Prices 2010-17 Andreas M. Fischer: Immigration and large banknotes 2010-18 Raphael Auer: Are Imports from Rich Nations Deskilling Emerging Economies?
Human Capital and the Dynamic Effects of Trade

2010-19 Jean-Pierre Danthine and John B. Donaldson: Executive Compensation: A General Equilibrium Perspective
2011-1 Thorsten Beck and Martin Brown: Which Households Use Banks? Evidence from the
Transition Economies 2011-2 Martin Brown, Karolin Kirschenmann and Steven Ongena: Foreign Currency Loans –
Demand or Supply Driven? 2011-3 Victoria Galsband and Thomas Nitschka: Foreign currency returns and systematic
risks 2011-4 Francis Breedon and Angelo Ranaldo: Intraday patterns in FX returns and order
flow 2011-5 Basil Guggenheim, Sébastien Kraenzlin and Silvio Schumacher: Exploring an
uncharted market: Evidence on the unsecured Swiss franc money market 2011-6 Pamela Hall: Is there any evidence of a Greenspan put? 2011-7 Daniel Kaufmann and Sarah Lein: Sectoral Inflation Dynamics, Idiosyncratic
Shocks and Monetary Policy 2011-8 Iva Cecchin: Mortgage Rate Pass-Through in Switzerland 2011-9 Raphael A. Auer, Kathrin Degen and Andreas M. Fischer: Low-Wage Import
Competition, Inflationary Pressure, and Industry Dynamics in Europe 2011-10 Raphael A. Auer and Philip Sauré: Spatial Competition in Quality, Demand-Induced
Innovation, and Schumpeterian Growth 2011-11 Massimiliano Caporin , Angelo Ranaldo and Paolo Santucci de Magistris: On the
Predictability of Stock Prices: a Case for High and Low Prices 2011-12 Jürg Mägerle and Thomas Nellen: Interoperability between central counterparties 2011-13 Sylvia Kaufmann: K-state switching models with endogenous transition
distributions 2011-14 Sébastien Kraenzlin and Benedikt von Scarpatetti: Bargaining Power in the Repo
Market 2012-01 Raphael A. Auer: Exchange Rate Pass-Through, Domestic Competition, and
Inflation: Evidence from the 2005/08 Revaluation of the Renminbi 2012-02 Signe Krogstrup, Samuel Reynard and Barbara Sutter: Liquidity Effects of
Quantitative Easing on Long-Term Interest Rates
2012-03 Matteo Bonato, Massimiliano Caporin and Angelo Ranaldo: Risk spillovers in international equity portfolios
2012-04 Thomas Nitschka: Banking sectors’ international interconnectedness: Implications
for consumption risk sharing in Europe 2012-05 Martin Brown, Steven Ongena and Pinar Ye,sin: Information Asymmetry and
Foreign Currency Borrowing by Small Firms 2012-06 Philip Sauré and Hosny Zoabi: Retirement Age across Countries: The Role of
Occupations 2012-07 Christian Hott and Terhi Jokipii: Housing Bubbles and Interest Rates 2012-08 Romain Baeriswyl and Camille Cornand: Reducing overreaction to central bank’s
disclosures: theory and experiment 2012-09 Bo E. Honoré, Daniel Kaufmann and Sarah Lein: Asymmetries in Price-Setting
Behavior: New Microeconometric Evidence from Switzerland 2012-10 Thomas Nitschka: Global and country-specific business cycle risk in time-varying
excess returns on asset markets 2012-11 Raphael A. Auer, Thomas Chaney and Philip Sauré: Quality Pricing-to-Market 2012-12 Sébastien Kraenzlin and Thomas Nellen: Access policy and money market
segmentation 2012-13 Andreas Kropf and Philip Sauré: Fixed Costs per Shipment 2012-14 Raphael A. Auer and Raphael S. Schoenle: Market Structure and Exchange Rate
Pass-Through 2012-15 Raphael A. Auer: What Drives Target2 Balances? Evidence From a Panel Analysis

Swiss National Bank Working Papers are also available at www.snb.ch, section Publications/ResearchSubscriptions or individual issues can be ordered at Swiss National Bank, Fraumünsterstrasse 8, CH-8022 Zurich, fax +41 44 631 81 14, E-mail [email protected]