what does remi say? sm medicaid expansion; are you in or are you out? presented by chris brown...
TRANSCRIPT

what does REMI say? sm
Medicaid Expansion; Are You In or Are You Out?
Presented by Chris Brown
Senior Economic Associate

what does REMI say? sm
Today’s Outline
Background-Law-Option to expand coverage
Modeling Overview
Sample Scenarios

what does REMI say? sm
The Law
• Patient Protection and Affordable Care Act– Signed into law in March 23rd, 2010– Individual mandate to buy health insurance, the
establishment of healthcare exchanges, and an expansion of Medicaid.
– June 28th 2012, Supreme Court upheld most, but not all provisions.

what does REMI say? sm
Background
• Initially states required to expand coverage up to 133% of the federal poverty level or less or lose all current federal Medicare funding……Late June SCOTUS rules states no longer face a penalty for not expanding Medicaid coverage, essentially, making it optional.

what does REMI say? sm
CBO Analysis of Medicaid Expansion
• Congressional Budget Office has assessed the estimated cost of the program with each new budget since its enactment.
• Most recent analysis before the Supreme Court ruling put net costs at $1,252 billion.
• After SCOTUS ruling, revised down to $1168, or $84 billion less.
• So far, no CBO analysis on the impact to individual states.

what does REMI say? sm
Leave it to the States
• Specific components that will impact states– State run vs federally run insurance exchange– “Woodwork Effect” means strains on state
budget.– With the Medicaid expansion optional, concerns
about a “donut hole” of people with an income too high to qualify for their State’s existing Medicaid program but too low to receive Exchange subsidies.

what does REMI say? sm
Weighing on state’s decision
-Budget Pressure-Uncertainty
-Ideology
-Huge amount of federal dollars
-Individual Health
Six states already declared
they are out

what does REMI say? sm
What We Can Provide
REMI has worked extensively to answer difficult “what if?” questions concerning economic policy, including questions concerning healthcare and fiscal policy.
What are the potential net fiscal and job impacts on my state?
what does REMI say? sm
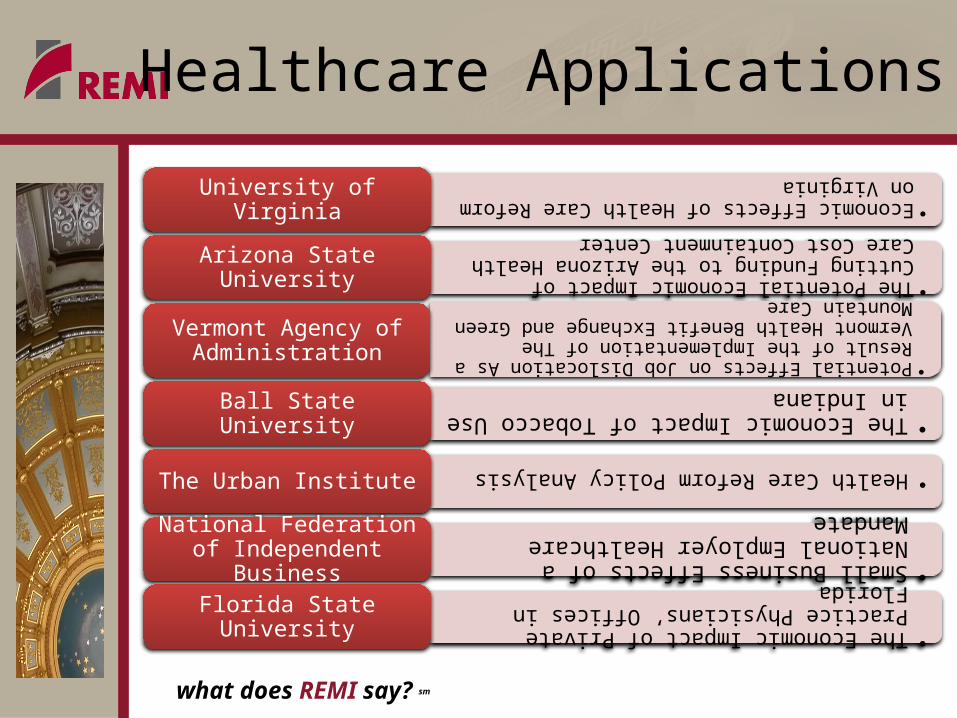
Healthcare Applications
•Economic Effects of Health Care Reform on Virginia
University of Virginia
•The Potential Economic Impact of Cutting Funding to the Arizona Health Care Cost Containment Center
Arizona State University
•Potential Effects on Job Dislocation As a Result of the Implementation of The Vermont Health Benefit Exchange and Green Mountain Care
Vermont Agency of Administration
•The Economic Impact of Tobacco Use in Indiana
Ball State University
•Health Care Reform Policy Analysis
The Urban Institute
•Small Business Effects of a National Employer Healthcare Mandate
National Federation of Independent Business
•The Economic Impact of Private Practice Physicians’ Offices in Florida
Florida State University

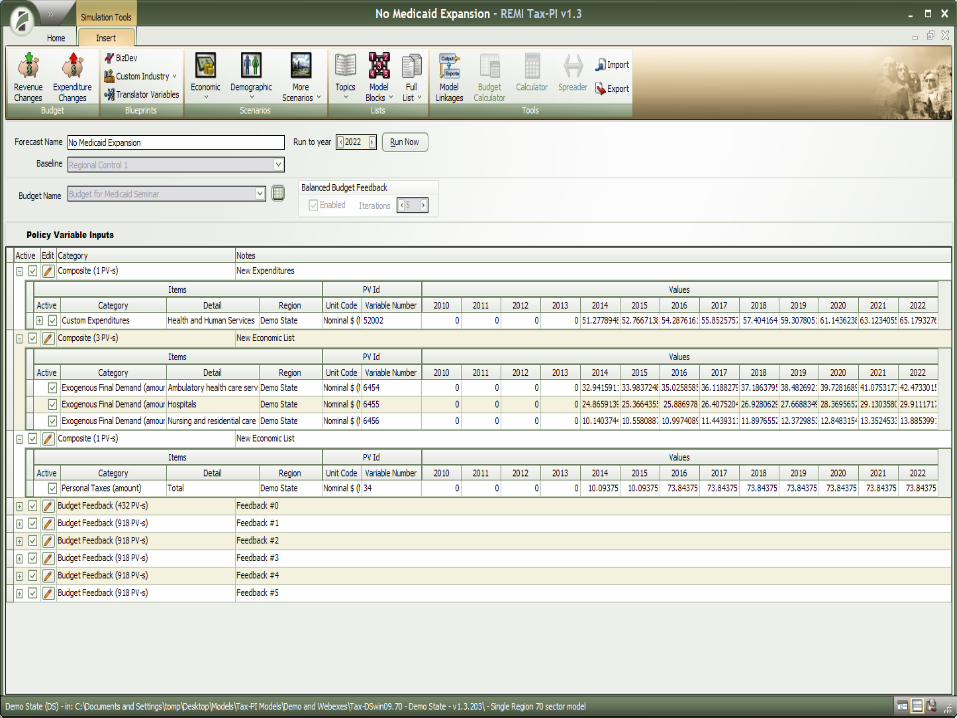
Modeling PPACA
• Medicaid Expenditures from micro simulation
• State Budget Changes• Potential Cost Changes
Input Components
• Exogenous Final Demand in Healthcare Sectors
• Budget cuts or tax increases
• Consumer Price Changes for Healthcare
Policy Variables • Net Impact on State• Jobs• GDP• Income
Results
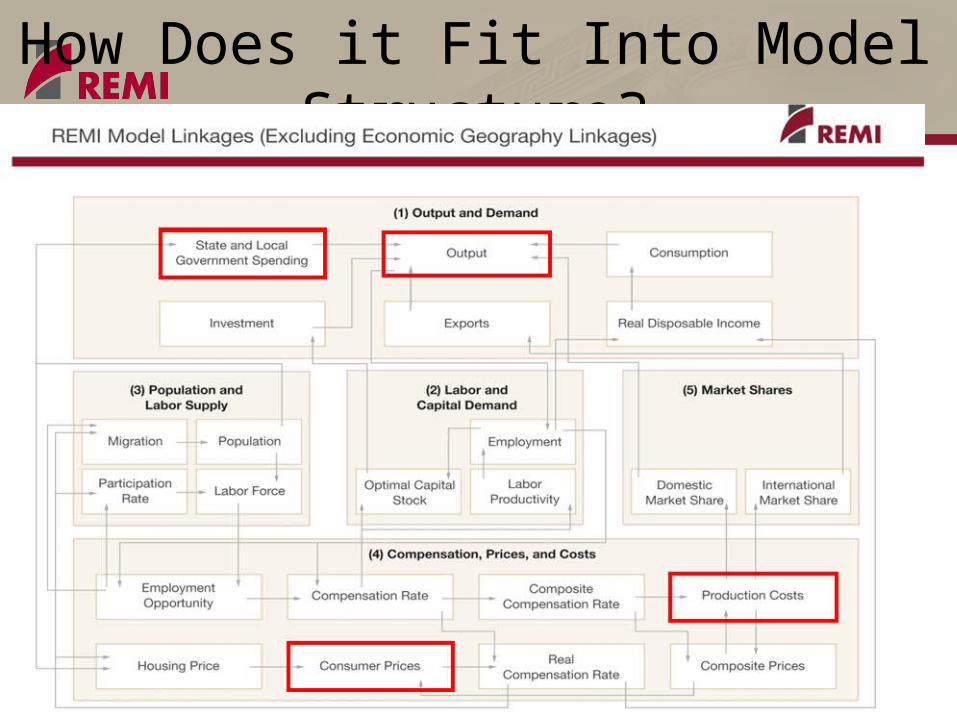
How Does it Fit Into Model Structure?

what does REMI say? sm
Accounting for Uncertainty
Need to have ability to test alternatives-High and low - Range of number of insured- Varying levels of coverage within exchange- Potential for cost containment or decreases-Budgeting assumptions?

what does REMI say? sm
Health Care IndustriesIndustries NAICS
Ambulatory health care services 621
• Offices of health practitioners 6211-6213
• Outpatient, laboratory, and other ambulatory care services; Home health care services
6214-6216, 6219
Hospitals 622
• Hospitals 622
Nursing and residential care facilities 623
• Nursing care facilities 6231
• Residential care facilities 6232, 6233, 6239
Social assistance 624
• Individual, family, community, and vocational rehabilitation services 6241-6243
• Child day care services 6244

what does REMI say? sm
DEMO Scenarios
What is impact if state opts-in?What is impact if state opts-out?
-Example data however states have begun to compile this information already
- Simulation still can allow for Variability

what does REMI say? sm
Example Data Sheet
Column1 2012 2013 2014 2015 2016 2017 2018 2019 2020 2021 2022
Additional Enrollees 0 0 125000 125000 125000 125000 125000 125000 125000 125000 125000
Cost Per Enrollee (CBO Projection) $6,000
Annual Spending (M) 0 0 750 750 750 750 750 750 750 750 750
Estimated Proportion already eligible 15% 15% 15% 15% 15% 15% 15% 15% 15% 15% 15%
Estimated Proportion newly eligible 85% 85% 85% 85% 85% 85% 85% 85% 85% 85% 85%
Cost for Already Eligible 0 0 112.5 112.5 112.5 112.5 112.5 112.5 112.5 112.5 112.5
State Cost Share for already eligible 43% 43% 43% 43% 43% 43% 43% 43% 43% 43% 43%
State Cost Share for newly eligible 0% 0% 0% 0% 0% 10% 10% 10% 10% 10% 10%
State Share 0 0 48.375 48.375 48.375 48.375 48.375 48.375 48.375 48.375 48.375
Federal Share 0 0 64.125 64.125 64.125 64.125 64.125 64.125 64.125 64.125 64.125
Cost for Newly Eligible 0 0 637.5 637.5 637.5 637.5 637.5 637.5 637.5 637.5 637.5
State Share 0 0 0 0 0 63.75 63.75 63.75 63.75 63.75 63.75
Federal Share 0 0 637.5 637.5 637.5 573.75 573.75 573.75 573.75 573.75 573.75
Cost of Penalty 0 0 0.000095 0.000095 0.000695 0.000695 0.000695 0.000695 0.000695 0.000695 0.000695
"Donut Hole" Cost 0 0 10.09375 10.09375 73.84375 73.84375 73.84375 73.84375 73.84375 73.84375 73.84375
Input data can come from micro simulation model or some other means.
Each component will be varied based on state and existing health care structure

what does REMI say? sm
Impact of Mandate
• Example Components– Estimated number of additional enrollees
currently eligible • 18,750
– Estimated Annual Cost = $6000Total increase in expenditure = $112 Million
annuallySpread across health care sectors based on
Medicaid expenditures
what does REMI say? sm
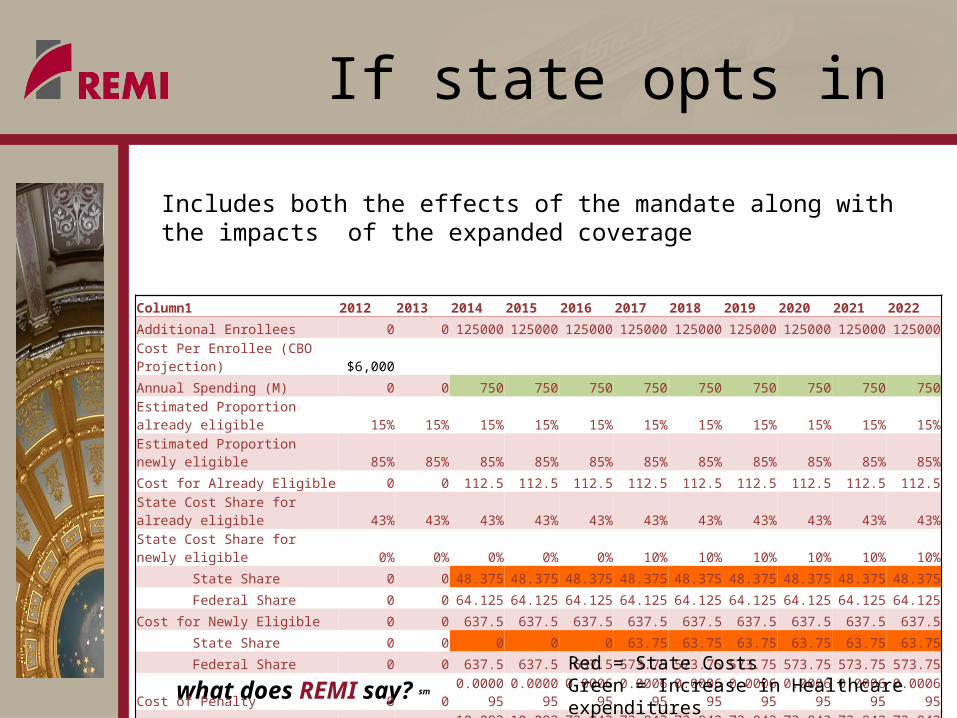
If state opts in
Column1 2012 2013 2014 2015 2016 2017 2018 2019 2020 2021 2022
Additional Enrollees 0 0 125000 125000 125000 125000 125000 125000 125000 125000 125000
Cost Per Enrollee (CBO Projection) $6,000
Annual Spending (M) 0 0 750 750 750 750 750 750 750 750 750
Estimated Proportion already eligible 15% 15% 15% 15% 15% 15% 15% 15% 15% 15% 15%
Estimated Proportion newly eligible 85% 85% 85% 85% 85% 85% 85% 85% 85% 85% 85%
Cost for Already Eligible 0 0 112.5 112.5 112.5 112.5 112.5 112.5 112.5 112.5 112.5
State Cost Share for already eligible 43% 43% 43% 43% 43% 43% 43% 43% 43% 43% 43%
State Cost Share for newly eligible 0% 0% 0% 0% 0% 10% 10% 10% 10% 10% 10%
State Share 0 0 48.375 48.375 48.375 48.375 48.375 48.375 48.375 48.375 48.375
Federal Share 0 0 64.125 64.125 64.125 64.125 64.125 64.125 64.125 64.125 64.125
Cost for Newly Eligible 0 0 637.5 637.5 637.5 637.5 637.5 637.5 637.5 637.5 637.5
State Share 0 0 0 0 0 63.75 63.75 63.75 63.75 63.75 63.75
Federal Share 0 0 637.5 637.5 637.5 573.75 573.75 573.75 573.75 573.75 573.75
Cost of Penalty 0 0 0.000095 0.000095 0.000695 0.000695 0.000695 0.000695 0.000695 0.000695 0.000695
"Donut Hole" Cost 0 0 10.09375 10.09375 73.84375 73.84375 73.84375 73.84375 73.84375 73.84375 73.84375
Red = State Costs Green = Increase in Healthcare expenditures
Includes both the effects of the mandate along with the impacts of the expanded coverage

what does REMI say? sm
If state opts in

what does REMI say? sm
If state opts in

what does REMI say? sm
If state opts in

what does REMI say? sm
If state opts in
what does REMI say? sm
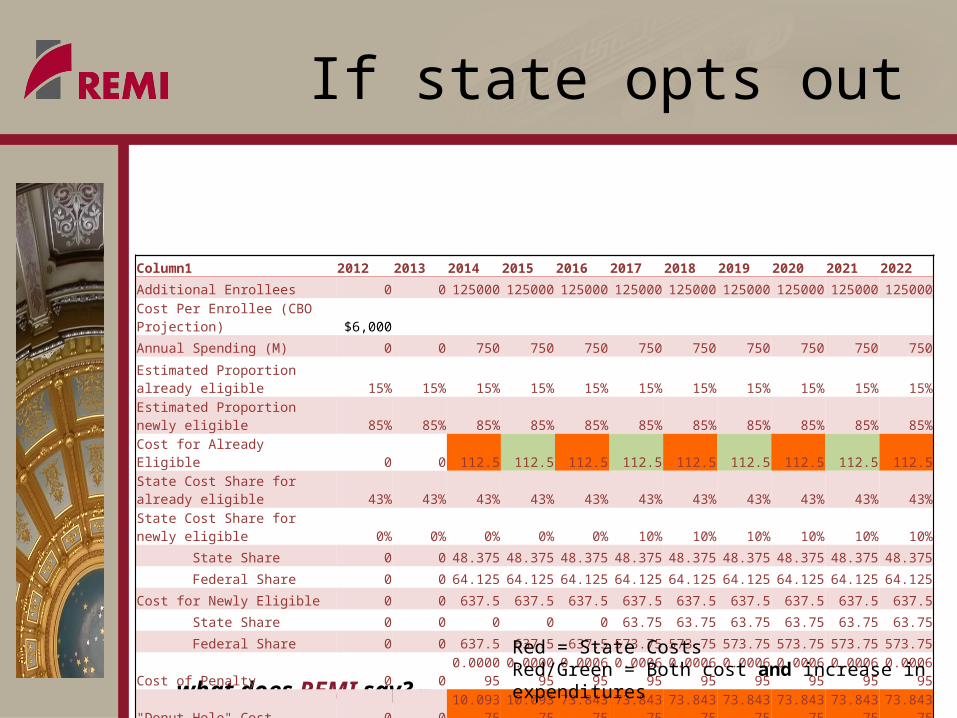
If state opts out
Column1 2012 2013 2014 2015 2016 2017 2018 2019 2020 2021 2022
Additional Enrollees 0 0 125000 125000 125000 125000 125000 125000 125000 125000 125000
Cost Per Enrollee (CBO Projection) $6,000
Annual Spending (M) 0 0 750 750 750 750 750 750 750 750 750
Estimated Proportion already eligible 15% 15% 15% 15% 15% 15% 15% 15% 15% 15% 15%
Estimated Proportion newly eligible 85% 85% 85% 85% 85% 85% 85% 85% 85% 85% 85%
Cost for Already Eligible 0 0 112.5 112.5 112.5 112.5 112.5 112.5 112.5 112.5 112.5
State Cost Share for already eligible 43% 43% 43% 43% 43% 43% 43% 43% 43% 43% 43%
State Cost Share for newly eligible 0% 0% 0% 0% 0% 10% 10% 10% 10% 10% 10%
State Share 0 0 48.375 48.375 48.375 48.375 48.375 48.375 48.375 48.375 48.375
Federal Share 0 0 64.125 64.125 64.125 64.125 64.125 64.125 64.125 64.125 64.125
Cost for Newly Eligible 0 0 637.5 637.5 637.5 637.5 637.5 637.5 637.5 637.5 637.5
State Share 0 0 0 0 0 63.75 63.75 63.75 63.75 63.75 63.75
Federal Share 0 0 637.5 637.5 637.5 573.75 573.75 573.75 573.75 573.75 573.75
Cost of Penalty 0 0 0.000095 0.000095 0.000695 0.000695 0.000695 0.000695 0.000695 0.000695 0.000695
"Donut Hole" Cost 0 0 10.09375 10.09375 73.84375 73.84375 73.84375 73.84375 73.84375 73.84375 73.84375
Red = State Costs Red/Green = Both cost and increase in expenditures
what does REMI say? sm
If state opts out

what does REMI say? sm
If state opts out

what does REMI say? sm
If state opts out

what does REMI say? sm
If state opts out

what does REMI say? sm
Concluding Remarks
• We know there is great uncertainty• Developing clear scenarios can allow you to
test alternatives• Key to decision to expand or not to expand
rests on economic and fiscal impact

what does REMI say? sm
If state opts-in
• Example components– Estimated number of new enrollees up to 133%
FPL• 106,250
– Cost of new enrollees = $637,500• State share = 0% for first 3 years• Federal share = 100% then to 90% after year three

what does REMI say? sm
If state opts-out
• Example components– Cost of penalty for not having insurance
• 95$ for first two years going to 695$ after year two
– Estimated number of individuals state must now cover = same as under mandate
• 18,750 new enrollees for a total cost of $112.5 Million