what does eurostat’s labour force survey say about … does eurostat’s labour force survey say...
TRANSCRIPT

What does Eurostat’s Labour Force Survey say about health and health inequalities in the European Union?
Stefano Mazzuco, Department of Statistics, Padua University, ItalyMarc Suhrcke,School of Medicine, Health Policy and Practice,University of East Anglia, United Kingdom

What does Eurostat’s Labour Force Surveysay about health and health inequalities
in the European Union?
Stefano Mazzuco, Department of Statistics, Padua University, ItalyMarc Suhrcke,School of Medicine, Health Policy and Practice,University of East Anglia, United Kingdom

Keywords
HEALTH STATUS DISPARITIESHEALTH STATUS INDICATORSDATA COLLECTIONEMPLOYMENT - statistics and numerical dataSOCIOECONOMIC FACTORSEUROPEAN UNION
ISBN 978 92 890 0218 9
Suggested citation
Mazzuco S, Suhrcke M (2010). What does Eurostat’s Labour Force Survey say about health and health inequalities in the European Union? Copenhagen, WHO Regional Offi ce for Europe.
Address requests about publications of the WHO Regional Offi ce for Europe to: Publications WHO Regional Offi ce for Europe Scherfi gsvej 8 DK-2100 Copenhagen Ø, DenmarkAlternatively, complete an online request form for documentation, health information, or for permission to quote or translate, on the Regional Offi ce web site (http://www.euro.who.int/pubrequest).
© World Health Organization 2010All rights reserved. The Regional Offi ce for Europe of the World Health Organization welcomes requests for permission to reproduce or translate its publications, in part or in full.The designations employed and the presentation of the material in this publication do not imply the expression of any opinion whatsoever on the part of the World Health Organization concerning the legal status of any country, territory, city or area or of its authorities, or concerning the delimitation of its frontiers or boundaries. Dotted lines on maps represent approximate border lines for which there may not yet be full agreement.The mention of specifi c companies or of certain manufacturers’ products does not imply that they are endorsed or recommended by the World Health Organization in preference to others of a similar nature that are not mentioned. Errors and omissions excepted, the names of proprietary products are distinguished by initial capital letters.All reasonable precautions have been taken by the World Health Organization to verify the information contained in this publication. However, the published material is being distributed without warranty of any kind, either express or implied. The responsibility for the interpretation and use of the material lies with the reader. In no event shall the World Health Organization be liable for damages arising from its use. The views expressed by authors, editors, or expert groups do not necessarily represent the decisions or the stated policy of the World Health Organization.
Edited by Elizabeth GoodrichBook design and layout by Marta PasqualatoCover photo ©iStockphoto.com/james knightenThe photographs in this material are used for illustrative purposes only; they do not imply any particular health status, attitudes, behaviours, or actions on the part of any person who appears in the photographs.

iii
Abstract
This publication presents extensive analysis of newly available data from Eurostat’s Labour Force Survey (LFS) to measure health and socioeconomic inequalities in health in 25 European countries, in a period including 1983–2004 at most.
The study fi rst defi ned several, predominantly labour market-related health indicators plus one weighted, overall health index. The authors documented the limitations of using this information for the measurement of average national health status, and focused on the use of the health information for the assessment of socioeconomic inequalities in health. Standard concentration indices were calculated using fi ve different proxies for socioeconomic status. After decomposing the inequality data into its trend and seasonal component, health inequalities were found to have been increasing for most but by no means all countries and health indicators. These results do not appear to be sensitive to the various proxies for socioeconomic status employed. Overall, while not without problems, the LFS may well add a useful and hitherto unexploited resource for measuring socioeconomic inequalities in health across European countries and over time.
Acknowledgements
We gratefully acknowledge the fi nancial and other support provided by the Department of Health of England (United Kingdom) and the WHO European Offi ce for Investment for Health and Development, WHO Regional Offi ce for Europe for the production of this report. We thank in particular Cristina Comunian (WHO European Offi ce for Investment for Health and Development , WHO Regional Offi ce for Europe) for her continued advice and her (almost) infi nite patience. We have benefi ted greatly from the comments by Teresa Lavin (Institute of Public Health in Ireland), Margaret Whitehead and Frances M. Drever (Division of Public Health, University of Liverpool), and Enrique Loyola (Health Intelligence Service, WHO Regional Offi ce for Europe). We are also indebted to Elizabeth Goodrich who copy-edited the text. Any errors are the sole responsibility of the authors.
Stefano Mazzuco, Department of Statistics, Padua University, Italy
Marc Suhrcke, School of Medicine, Health Policy and Practice, University of East Anglia, United Kingdom
WHO European Offi ce for Investment for Health and Development
The WHO European Offi ce for Investment for Health and Development, which coordinated the activities leading to this publication, was set up by the WHO Regional Offi ce for Europe, with cooperation and support from the Ministry of Health and the Veneto Region of Italy. One of its key responsibilities is to provide
evidence on and act upon the social and economic determinants of health. The Offi ce systematically reviews what is involved in drawing together the concepts, scientifi c evidence, technology and policy action necessary to achieve effective investment for the promotion of health and synergy between social, economic and health development. The Offi ce fulfi ls two interrelated main functions:
• to monitor, review and systematize the policy implications of the social and economic determinants of population health; and
• to provide services to help Member States in the WHO European Region increase their capacity to invest in health by addressing these policy implications and integrating them into the agenda for development.

iv
Contents
Abbreviations iv
List of tables v
List of fi gures v
Executive summary vi
1. Introduction 1
2. Related literature 3
3. Description of the LFS data 4
4. A fi rst look at our data 6
5. A second look at our data 14
6. Socioeconomic inequalities in health 18
7. Concluding remarks 24
References 25
Annex 1. Average health indices by country and sex 27
Annex 2. Health inequality indices by country and sex 58
Abbreviations
CRWA continued reduction in working ability
EAP exclusion from active population
ECHP European Community Household Panel
EGP Erikson and Goldthorpe’s class categories
EU European Union
EU-25 countries belonging to the European Union prior to 2007
EU-SILC European Union-Statistics on Income and Living Conditions
ISCED International Standard Classifi cation of Education
ISCO International Standard Classifi cation of Occupations
ISEI International Socio-Economic Index of Occupational Status
LFS Labour Force Survey
PIW permanent inability to work
SES socioeconomic status
SHARE Survey of Health, Ageing and Retirement in Europe
SIOPS Standard International Occupational Prestige Scale
THLI Total Health Limitation Index
TIW temporary inability to work
TRWA temporary reduction in working ability
UNESCO United Nations Educational, Scientifi c and Cultural Organization

v
List of tables
Table 1. LFS questions relating to health issues 5
Table 2. Health indicators defi ned on the basis of LFS health questions 5
Table 3. Health limitation indices (standardized by age) for European countries, men, 2004 6
Table 4. Health limitation indices (standardized by age) for European countries, women, 2004 7
Table 5. Results of generalized additive model for generosity index 15
Table 6. Inequality of several health indices in European countries, men, second quarter, 2004 19
Table 7. Inequality of several health indices in European countries, women, second quarter, 2004 20
List of fi gures
Fig. 1. TIW index (standardized by age) for representative European countries 8
Fig. 2. TRWA index (standardized by age) for representative European countries 8
Fig. 3. CRWA index (standardized by age) for representative European countries 9
Fig. 4. EAP index (standardized by age) for representative European countries 10
Fig. 5. PIW1 index (standardized by age) for representative European countries 10
Fig. 6. PIW2 index (standardized by age) for representative European countries 11
Fig. 7. THLI (standardized by age) for representative European countries 11
Fig. 8. Scatter plots of THLI and prevalence of self-reported chronic illness 12
Fig. 9. Scatter plots of THLI and log of standardized mortality ratio 13
Fig. 10. Scatter plots of THLI and log of life expectancy at 15 13
Fig. 11. THLI before and after weighting with the inverse of generosity score, men, six countries 16
Fig. 12. Decomposition of THLI time series, Italy, men 17
Fig. 13. Health inequality index, Italy 21
Fig. 14. Decomposition of CRWA inequality time series, Italy 22
Fig. 15. Average level and inequality index of TRWA in European countries, second quarter, 2004 23

vi
Executive summary
This paper uses newly available data from Eurostat’s1 Labour Force Survey (LFS) to measure health and socioeconomic inequalities in health in 25 European Union (EU) countries, at most from 1983 to 2004. We believe no other Europe-wide survey offers LFS’s degree of coverage in terms of both time period and number of countries. Lacking such coverage has previously limited the degree of comparability over time and across countries in similar analyses. While the potential of the LFS dataset is signifi cant, it also has a potentially serious drawback from a health perspective: its relatively limited health information is all related to a series of dimensions of sickness absence from the workplace or, from being employed in the fi rst place. Despite encouraging results from some epidemiological literature suggesting that sickness absence is a reliable predictor of mortality, the economics literature highlights a possibly signifi cant bias from generous sickness absence provisions in some social security systems: that is, sickness absence would likely be higher in a country with a more generous social security system than in a country with a less generous one, even if actual health were identical. This paper reports how we tried to extract the relevant health information from LFS’s rich sickness absence data.
We fi rst defi ned several health indicators plus one weighted, overall health index. Our fi rst look at these data confi rmed the hypothesis of a bias driven by the generosity of social security systems: data from Scandinavian countries indicated signifi cantly worse health indicators than, for instance, eastern European countries, a fi nding widely believed to be false. In a second step, we adjusted our health indicators by weighting them according to each country’s degree of generosity. While the adjusted indices appeared slightly more plausible than the unadjusted ones, we would at this stage not claim that our proposed method successfully transformed the health information into a valid measure of population health.
Assuming that social security incentives differ more between than within countries, we felt far more comfortable using the LFS health data to measure the size and evolution of socioeconomic inequalities in health. We calculated standard concentration indices, using fi ve different proxies – related to educational attainment and occupational categories – for socioeconomic status. Once we decomposed the inequality data series into its trend and seasonal components, we found that health inequalities have been increasing for most but by no means all countries and health indicators. These results do not appear to be sensitive to the various proxies for socioeconomic status we employed. As one might expect, eastern European countries have higher levels of inequality, and western central countries have the lowest levels.
We conclude that, while not without problems, the LFS may well add a useful and hitherto unexploited resource for measuring socioeconomic inequalities in health across European countries and over time. Future research should use the LFS data to try to identify and measure the drivers of health inequalities in the region.
1 Eurostat is the statistical offi ce of the European Union and is tasked with providing European level statistics that enable comparisons between countries and regions (Eurostat, 2010).

1
1. Introduction
Finding appropriate data on morbidity and ill health (as opposed to mortality) for a large set of European countries is a challenge for researchers, as there are very few data sources providing comparable sets of health indicators. Particularly challenging is fi nding surveys that combine both relevant health information and socioeconomic indicators in a way that allows analyses of relevant socioeconomic patterns and the determinants or consequences of health. The recent Survey of Health, Ageing and Retirement in Europe (SHARE) is an exception, but it focuses only on the over-50 population and to date has had only two rounds. Also available is the European Union Statistics on Income and Living Conditions (EU-SILC), a “new edition” of the European Community Household Panel (ECHP). This dataset represents the entire population of EU countries and provides some (though not very detailed) information on health status as well as reasonable coverage of socioeconomic data. However, due to the recent switch from the ECHP to the EU-SILC format, a discontinuity exists in the survey design as well as the questionnaire, so longitudinal analysis over several years cannot be carried out (yet). Moreover, the ECHP survey was limited to 8 years and covered a maximum of only 15 countries.
In this paper we leverage a different and newly available source of survey information: Eurostat’s2 Labour Force Survey (LFS). To the best of our knowledge the LFS dataset has not yet been comprehensively exploited for any health-related purpose. The version of the LFS available for our analyses is a harmonized collection of data coming from all the labour force surveys conducted in the 25 European countries.3 The fi nal result is a huge database with impressive coverage across countries and years: for many countries data are available from 1983 to 2004.4 We believe no other EU-wide survey offers this degree of coverage in terms of both time period and number of countries. The LFS also has a large variety of socioeconomic indicators, although they focus on the labour market.5 The main disadvantage for our purposes is that the information on health is rather limited and mainly relates to a series of dimensions of sickness absence from workplaces or from being employed in the fi rst place.6 Despite the potential drawbacks and in light of the scarcity of cross-country European household surveys that can be used to analyse the socioeconomic aspects of health (or even of health per se), we consider the LFS too promising a source to ignore, even if the health information is limited to the sickness-absence dimension. We also draw comfort from the fact that sickness absence is in fact regularly used in the public health literature as a health proxy (Kivimäki et al., 2003).
The fundamental question that arises of course – and that we seek to determine in the present paper – is: what, if anything, can be learnt from the LFS data about health and about the socioeconomic distribution of health? This is a far from trivial issue, since sickness-absence data cannot readily be interpreted as unbiased health information. As the economics literature on the subject amply demonstrates (e.g. Osterkamp and Röhn, 2007; Frick and Malo, 2005; Bonato and Lusinyan, 2004), sickness-absence rates respond sharply to incentives in social security systems and are unlikely to exclusively refl ect health aspects: holding other factors constant, in particular the true level of health, the more generous the social protection system, the more likely workers will claim sickness absence. The task then becomes one of purifying the reported sickness-absence data of such distortions. To do so, we constructed a set of health indices taking into account this source of bias. Provided that absenteeism is induced by the generosity of the sickness-leave system, weighting the health indices with a measure of this generosity would at least partly remove the generosity’s spurious effect on the sickness-absence data. This exercise builds on the efforts of other researchers who,
2 Eurostat is the statistical offi ce of the European Union and is tasked with providing European level statistics that enable comparisons between countries and regions (Eurostat, 2010).3 This includes the 25 countries belonging to the European Union prior to 2007 (EU-25) countries (except the United Kingdom) plus Norway and Iceland.4 At the time of our analysis, LFS data were available covering up to the year 2004. Very recently, additional survey years, extending up to 2007, became available.5 Another unique feature of the LFS is that in many countries and years it was carried out more than once a year – a feature that offers oppor-tunities as well as challenges: while in principle it allows for the analysis of seasonal, cyclical patterns that go unnoticed in the standard annual data, it is not immediately clear how to arrive at the “right” annualized value of any given indicator.6 A further, perhaps minor disadvantage could be that responses to health questions in a survey that is dominated by non-health questions may differ from responses to health questions in a survey primarily seeking health information. Respondents in the former may consider the health questions less important and answer with less attention and effort.

2
without being specifi cally interested in health, have attempted to measure generosity in a country’s social security system (e.g. Scruggs, 2006).
If one or several unbiased and thus comparable health indices can be created in this way, they could say something about health in Europe for a uniquely large set of countries over many years. Taking one step further, it will then also be interesting to look not only at average health comparisons across countries and time, but also at socioeconomic inequalities in health within countries. Bias from generosity in a social security system is likely to be less relevant if one limits measurement of socioeconomic inequalities to individual countries. For this exercise, we followed the methodology proposed by O’Donnel et al. (2008). Increasing work tries to assess the patterns and trends of health inequalities across countries in Europe (Mackenbach et al., 2008), but the degree of comparability over time and between countries in these data may be constrained by their use of data from often different surveys. This problem can be overcome with the help of the LFS data.
The paper is organized as follows: in section 2 we review the relevant previous literature on sickness absence. In section 3 we describe LFS, presenting its relevant health questions. We also describe the proposed health indicators that we derived from these questions. In section 4 we provide cross-county tables and fi gures based on our proposed indicators and compare them with other macro-correlates, e.g. self-reported health from other surveys. The comparison will show that the LFS-based health indicators, if left unchanged, are inadequate for measuring true health. In section 5 we fi rst describe how we attempted to purify the LFS-based health indicators from their assumed bias. We also compare the revised health indicators with the original ones and with the macro-correlates. Section 6 presents results from measuring the socioeconomic inequalities, while section 7 concludes by exploring future research needs and possibilities.

3
2. Related literature
At least two distinct branches of literature must be considered when trying to interpret sickness-absence data as a proxy for health status: the labour economics literature and the public health literature. Somewhat surprisingly, these branches appear to have largely ignored each other so far. At the risk of over-simplifying, on the one hand the economics literature views and analyses sickness absence exclusively as a refl ection of incentives and hardly makes any link between sickness absence and health status (e.g. Ichino and Riphahn, 2005; Rae, 2005; or Holmlund, 2004). In stark contrast, the relevant public health literature exploring sickness absence considers it entirely as a health proxy, worrying little or not at all that sickness-absence data might be distorted by incentives in the social security system (e.g. Kivimäki et al., 2003 or Christensen et al., 2008).
Some economics literature provides notable exceptions to the neglect of the health dimension of sickness absence. Bonato and Lusinyan (2004), for instance, tried to compare country-level sickness-absence rates across 18 European countries. While they found that incentives explain a large share of the cross-country variation, they also found a signifi cant conditional role for life expectancy (as a proxy of health) in that countries with higher life expectancies have lower sickness-absence rates.7
More encouraging evidence supporting the potential utility of sickness absence as a health indicator comes from the public health literature. For instance, Kivimäki et al. (2003) showed that the rate of certifi ed sickness absence was an even more powerful predictor of mortality than established self-reported health measures and available medically diagnosed measures of specifi c conditions. Christiansen et al. (2008) examined the socioeconomic distribution of sickness-absence rates and found gradients similar to those found when using other health variables.
In the present paper we seek to combine the insights from both branches. We adopt from the public health literature the aspiration to interpret sickness absence as a potential measure of health, while we adopt from the economics literature the insight that reported sickness-absence rates also refl ect factors unrelated to health that must be statistically removed to arrive at the infl uence of health in sickness-absence fi gures.
7 Osterkamp and Röhn (2007) also sought to explain cross-country differences in sickness-absence rates in industrial countries but did not consider health as a potential explanatory factor. Frick and Malo (2005) also explored differences in sickness-absence rates across and within European countries, albeit using micro-data. After controlling for institutional factors, they found a signifi cant impact of work-related health problems on sickness absence.

4
3. Description of the LFS data
The LFS is unique for its cross-country and time coverage. In 1983 Eurostat started collecting LFS microdata from Belgium, Denmark, France, Greece, Ireland, Italy, Luxembourg, and the Netherlands. Data from other countries was collected after their EU entry (e.g. Austria, Sweden and Finland in 1995). Thus, the LFS provides data for 25 EU Member States, plus Norway and Iceland, with some exceptions: data for Germany cover only the period since 2002, and data for Malta and United Kingdom are not available.8
LFS data covering only the fi rst or second quarter of the year are made available for the years 1983 to 1997. Subsequently, data from all quarters have become progressively available. Eurostat maintains that “the degree of comparability of the EU [European Union] Labour Force Survey results is considerably higher than that of any other existing set of statistics on employment or unemployment available for Member States” (Charlier and Franco, 2001). However, comparability over time and across countries remains problematical as any of the following may change: the reference period for a given country, the sampling designs and the order of the questions in the questionnaire. Moreover, since 1998, Member States have not simultaneously transitioned to a continuous, quarterly survey (where the reference weeks are spread uniformly throughout the year). This generates an inevitable break in the time-series statistics for each country, which may further limit comparability.
LFS’s main focus is, not surprisingly, the labour market. However, several parts of the questionnaire ask respondents indirectly about their health status. In particular, they are asked for reasons for not working in the reference week, for having worked less than usual, etc., as listed in Table 1. The questionnaire offers to respondents several reasons to explain their answers, such as “own illness, injury or temporary disability”.
Based on these variables and building on the work of Campostrini and Bellini (2000), we constructed several health indicators (see Table 2). However, we standardized the indicators by age in order to account for differences in age structure between countries and over time. One way to standardize by age is to sum the age-specifi c rates, thus constructing an indicator that is similar to the total fertility rate. The formula is:
R=Σr
x
x=65
x=15 (1)
where R is the fi nal rate, rx is the age-specifi c rate and x the age. We computed the indicators separately for men and
women. Table 2 describes how we defi ned age-specifi c rates. The age for all indices is 15–64, since most of them are not relevant for individuals outside working age.
We can use each of these indicators separately, or we can use them collectively to construct a synthetic health index. The latter is obtained as a weighted average of some of the indicators. The weights are defi ned such that more importance is given to indicators that affect a greater proportion of the total population. For instance, those who were not working at the time of the interview but had had a job in the previous eight years may be a small fraction of the population compared to working people. It should be noted that we used only the second permanent inability to work (PIW) indicator (PIW2) to compute the total health limitation index (THLI), since the fi rst cannot be calculated for some years. Also, we did not use the temporary inability to work (TIW) indicator as we found it is much more related to the degree of absenteeism than to health status.
One possible limitation of this set of indices, particularly the synthetic one, is that we have no information on the severity of health problems they refer to. We assume that a temporary inability to work may be caused by a cold or fl u, whereas a continued reduction of working ability is likely to indicate a more serious health issue, so greater weight should be given to the latter indicator than to the former. However, while this may be plausible, we have no way of testing this assumption. It is also to be borne in mind that we do not really have any other true health indicator that
8 Data on the United Kingdom were made available very recently after the results of a disclosure and therefore were not included in the dataset we analysed.

5
could serve as our benchmark in the present case. One might expect that mortality or life expectancy could serve as a legitimate proxy for true population health, but then again life expectancy varies little between developed countries, while morbidity – our focus here – is (possibly much) less than perfectly correlated with mortality. Thus, the question remains of what the best benchmark would be.
Table 1. LFS questions relating to health issues
Question Reference population
Reason for not having worked at all though having a job Working population
Main reason for hours actually worked during the reference week being different from the person’s usual hours
Working population
Main reason for leaving last job or business Inactive population with a job episode ended at most 8 years before interview
Main reason for not being available to start working within two weeks if work were found now
Inactive population
Main reason for working part-time Part-time working population
Main reason for not seeking employment during previous four weeks
Inactive population
Table 2. Health indicators defi ned on the basis of LFS health questions
Indicator Numerator Denominator
Temporary inability to work (TIW): not working in the reference week due to illness, injury or temporary disability
Number of persons who did not work in the reference week, despite having a job, because of health problems
Number of persons having a job
Temporary reduction in working ability (TRWA): absenteeism due to illness, injury or temporary disability
Number of persons who worked less than usual due to illness, injury or temporarily disability
Number of persons having a job
Continued reduction in working ability (CRWA): part-time work due to illness, injury or temporary disability
Number of persons who work part-time due to illness, injury or temporarily disability
Number of persons having a job
Exclusion from active population (EAP): retirement due to illness, injury or temporary disability
Number of persons who left their last job because of health problems
Number of not-working people who had a job in the previous 8 years
Permanent inability to work (PIW1): not seeking a job due to illness, injury or temporary disability
Number of persons not working and not seeking a job because of own illness or disability
Number of not-working people
Permanent inability to work (PIW2): not seeking a job due to illness, injury or temporary disability
Number of persons not working and not available to start working immediately because of own illness or incapacity
Number of not-working people
Note: All indicators are age-specifi c. The overall index was then calculated using formula (1).

6
4. A fi rst look at our data
This section provides cross-country tables and fi gures on our proposed indicators and compares them with other macro-correlates. This attempt to use the LFS-based indicators to measure true health proves disappointing but provides a basis for understanding our second look at these data, which proves more promising.
Table 3. Health limitation indices (standardized by age) for European countries, men, 2004
Country TIW TRWA CRWA EAP PIW2 THLI
Greece 0.007 0.006 0.008 0.947 0.185 0.118
Ireland 0.152 0.021 0.026 1.722 0.014 0.127
Slovenia 0.262 0.082 0 0.697 0.162 0.153
Italy 0.131 0.049 0.028 0.637 0.269 0.174
France 0.329 0.041 0.04 0.837 0.14 0.204
Lithuania 0.048 0.003 0.052 1.553 0.234 0.242
Slovakia 0.103 0.013 0.07 0.926 0.173 0.247
Portugal 0.187 0.018 0.094 1.563 0.07 0.26
Netherlands 0.273 0.098 0.048 1.506 0.023 0.274
Germany 0.159 0.024 0.04 1.036 0.704 0.301
Spain 0.301 0.021 0.009 1.554 0.608 0.314
Belgium 0.334 0.048 0.035 1.548 0.319 0.327
Finland 0.27 0.055 0.023 1.469 0.308 0.334
Estonia 0.102 0.011 0.049 1.732 0.317 0.351
Sweden 0.497 0.175 0.192 0.62 0 0.363
Latvia 0.062 0.018 0.057 1.661 0.683 0.365
Denmark 0.208 0.087 0.056 1.301 0.303 0.372
Czech Republic 0.35 0.022 0.075 2.065 1.286 0.438
Austria 0.126 0.028 0.036 1.844 1.64 0.47
Poland 0.179 0.01 0.188 1.414 0.542 0.479
Norway 0.51 0.109 0.134 3.418 1.184 0.505
Hungary 0.173 0.012 0.09 2.138 1.581 0.561
Cyprus 0.189 0.067 0.067 2.307 0.557 NA
Iceland 0.129 0.058 0 2.708 0.111 NA
Luxembourg 0.197 0.002 0.015 2.018 NA NA
Note: Rows are ordered by THLI score, from lowest to highest.
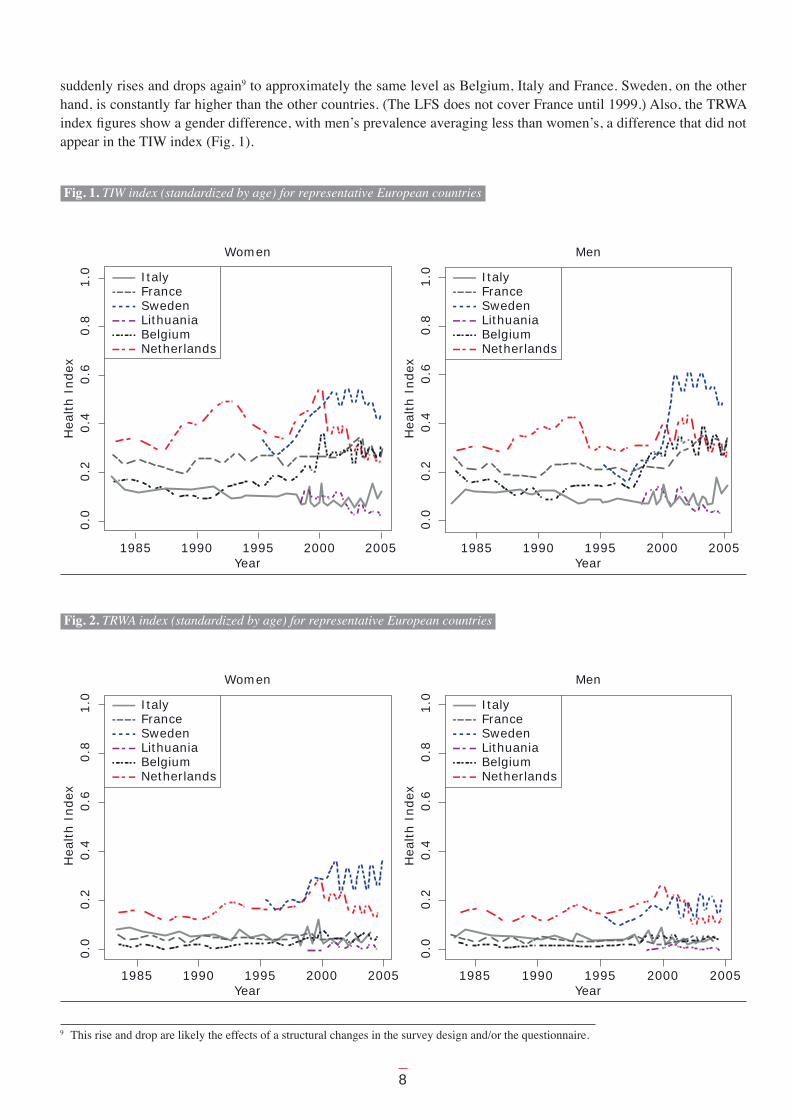
With seven health indicators for 25 countries, separated into males and females, for many years, we ask the reader to forgive us for not displaying all possible tables in the body of this report, relegating most to Annex 1. Tables 3 (men) and 4 (women) show the values of the indices for 2004. Fig. 1–7 present graphs illustrating trends over time for each indicator by gender for what we consider a representative subset of countries. We chose Italy to represent Mediterranean countries, France the western-central countries, Sweden the Scandinavian ones, Lithuania the eastern European ones, and Belgium and the Netherlands the central European ones. Our selection was infl uenced by the fact that these countries have relatively good quality data (e.g. Germany was not chosen because its data cover only 2004). Fig. 1 shows the trend for the TIW index for our sample of countries.

7
Table 4. Health limitation indices (standardized by age) for European countries, women, 2004
Country TIW TRWA CRWA EAP PIW2 THLI
Greece 0.006 0.005 0.009 0.495 0.098 0.069
Slovenia 0.247 0.31 0 0.29 0.052 0.091
Ireland 0.136 0.033 0.015 1.273 0.035 0.092
Lithuania 0.048 0.148 0.029 1.073 0.029 0.165
Italy 0.113 0 0.069 0.572 0.279 0.181
Spain 0.248 0.01 0.8 0.328 0.214
Luxembourg 0.184 0.196 0.047 1.214 0.983 0.232
Slovakia 0.092 0.017 0.068 0.806 0.14 0.246
France 0.31 0.038 0.15 0.757 0.155 0.262
Germany 0.135 0.029 0.083 0.808 0.615 0.266
Belgium 0.273 0.031 0.099 1.292 0.183 0.27
Estonia 0.055 0.007 0.041 1.212 0.209 0.274
Latvia 0.044 0.008 0.038 0.636 0.563 0.292
Portugal 0.153 0.08 0.16 1.373 0.159 0.31
Finland 0.246 0.089 0.034 1.049 0.217 0.316
Austria 0.118 0.016 0.066 1.155 0.919 0.383
Netherlands 0.253 0.01 0.108 1.878 0.094 0.402
Poland 0.16 0.023 0.245 1.054 0.514 0.447
Czech Republic 0.317 0.031 0.124 1.311 0.899 0.491
Hungary 0.167 0.018 0.1 1.764 1.577 0.501
Denmark 0.191 0.104 0.094 1.515 0.277 0.511
Sweden 0.446 0.35 0.866 0 0.607
Norway 0.45 0.024 0.137 3.876 1.086 0.667
Cyprus 0.169 0.089 0.078 1.141 0.531 NA
Iceland 0.1 0.036 0 2.969 0.093 NA
Note: Rows are ordered by THLI score, from lowest to highest.
Interestingly, the TIW index shows some counter-intuitive patterns over time and across countries. First, it might seem odd that the index is higher (and hence the health status lower) in the Netherlands and Sweden than in Lithuania – an issue we return to below in “a second look at the data”. Second, one might expect – on the basis of overall mortality trends and assuming a positive (if imperfect) correlation between mortality and non-fatal illness – that ill health prevalence has decreased (and hence health improved) throughout the period. However, for some countries, such as Belgium and Sweden, TIW increased, whereas it decreased for the Netherlands and Lithuania, and remained roughly stable for other countries. It should be borne in mind that the TIW index measures the short-term prevalence of sickness absence. In most TIW cases, the health issues generating absence from work are of ordinary nature (e.g. infl uenza, colds). Such relatively common and generally far from life-threatening diseases are unlikely to be closely related to mortality, so this counter-intuitive and mixed-trend picture may be less surprising than at fi rst glance. A third, no less surprising feature of Fig. 1 is the much-increased fl uctuation of the trend, starting around the year 2000, in those countries that switched to subannual data reporting. This suggests a seasonal fl uctuation in health status (as in indicators of economic activity) that goes completely unnoticed in the commonly used annual data. The precise nature and explanation of this seasonality is recommended for future research below.
The same pattern applies to the TRWA index (Fig. 2), which measures a temporary reduction of working hours for health reasons. Prevalence is lower than TIW, but we still observe that the Netherlands and Sweden lines dominate the others. The Netherlands line is on the same level as those of other countries until 1992, after which its TRWA index
8
suddenly rises and drops again9 to approximately the same level as Belgium, Italy and France. Sweden, on the other hand, is constantly far higher than the other countries. (The LFS does not cover France until 1999.) Also, the TRWA index fi gures show a gender difference, with men’s prevalence averaging less than women’s, a difference that did not appear in the TIW index (Fig. 1).
Fig. 1. TIW index (standardized by age) for representative European countries
ItalyFranceSwedenLithuaniaBelgiumNetherlands
1.0
0.8
0.6
0.4
0.2
0.0
1985 1990 1995 2000 2005
Women
Year
Hea
lth I
ndex
ItalyFranceSwedenLithuaniaBelgiumNetherlands
1.0
0.8
0.6
0.4
0.2
0.0
1985 1990 1995 2000 2005
Men
Year
Hea
lth I
ndex
Fig. 2. TRWA index (standardized by age) for representative European countries
ItalyFranceSwedenLithuaniaBelgiumNetherlands
1.0
0.8
0.6
0.4
0.2
0.0
1985 1990 1995 2000 2005
Women
Year
Hea
lth I
ndex
ItalyFranceSwedenLithuaniaBelgiumNetherlands
1.0
0.8
0.6
0.4
0.2
0.0
1985 1990 1995 2000 2005Year
Hea
lth I
ndex
Men
9 This rise and drop are likely the effects of a structural changes in the survey design and/or the questionnaire.

9
The CRWA index measures continued reduction in the ability to work, i.e., the prevalence of people working only part-time due to health problems. We might expect that the health problems that force people to permanently reduce their working time would be more serious and less frequent than those forcing a temporary absence (TIW) or a temporary reduction in working hours (TRWA). As expected, the level of CRWA is lower than those of TIW and TRWA. Yet again, the Sweden and the Netherlands lines are far higher than the others. However, part-time jobs are much more supported in the Netherlands and Scandinavian countries than in the rest of the EU, which may help explain the gap as in the case of the temporary health indicators.
Fig. 3. CRWA index (standardized by age) for representative European countries
ItalyFranceSwedenLithuaniaBelgiumNetherlands
0.5
0.4
0.3
0.2
0.1
0.0
1985 1990 1995 2000 2005
Women
Year
Hea
lth I
ndex
ItalyFranceSwedenLithuaniaBelgiumNetherlands
0.5
0.4
0.2
0.1
0.0
1985 1990 1995 2000 2005Year
0.3
Hea
lth I
ndex
Men
Fig. 4 reports the trends in the EAP index, capturing those who retired because of illness, injury or temporary disability. In principle, one would expect that the prevalence of health problems causing this level of work reduction would be even lower than those measured by TIW, TRWA and CRWA. In practice, the index is far higher than the others. This is because the denominator of the EAP index is different from that of other indices and in some cases can be very small.
We also note that the EAP index is extremely variable. Italy, for example, experienced a substantial drop in 1992, probably the result of pension reform implemented that year. Here, Sweden has approximately the same level as France and Lithuania, with a peak in 2000–2001, whereas the Netherlands has the highest proportion of people retired due to health issues.
The PIW1 index (not seeking a job due to illness, injury or temporary disability) also fl uctuates considerably (see, for example, the line for Belgium) and is, therefore, diffi cult to interpret (Fig. 5). Moreover, the data for this index are unavailable until 1992. Given these shortcomings, we did not use this index in creating the THLI. Instead, we used the second version of PIW (PIW2), which is far less variable, available for all years, and based on respondents’ declared availability to start a job were it found quickly. Apart from a strange rise and fall for Belgium, the PIW2 lines are much more stable (Fig. 6). The PIW2 shows an increasing trend, particularly in France, but the level is quite low, so this index has little infl uence on the THLI.

10
Fig. 4. EAP index (standardized by age) for representative European countries
ItalyFranceSwedenLithuaniaBelgiumNetherlands
2.5
2.0
1.5
1.0
0.5
0.0
1985 1990 1995 2000 2005
Women
Year
Hea
lth I
ndex
ItalyFranceSwedenLithuaniaBelgiumNetherlands
2.5
2.0
1.5
1.0
0.5
0.0
1985 1990 1995 2000 2005Year
Hea
lth I
ndex
Men
Fig. 5. PIW1 index (standardized by age) for representative European countries
ItalyFranceSwedenLithuaniaBelgiumNetherlands
2.0
1.5
1.0
0.5
0.0
1985 1990 1995 2000 2005
Women Men
Year
Hea
lth I
ndex
ItalyFranceSwedenLithuaniaBelgiumNetherlands
1985 1990 1995 2000 2005Year
Hea
lth I
ndex
2.0
1.5
1.0
0.5
0.0
Finally, we look in Fig. 7 at the THLI, a weighted average of TIW, TRWA, CRWA, EAP and PIW2; each index’s weight is proportional to the population share on which the indicator is defi ned.

11
Fig. 6. PIW2 index (standardized by age) for representative European countries
ItalyFranceSwedenLithuaniaBelgiumNetherlands
2.0
1.5
1.0
0.5
0.0
1985 1990 1995 2000 2005
Women Men
Year
Hea
lth I
ndex
ItalyFranceSwedenLithuaniaBelgiumNetherlands
1985 1990 1995 2000 2005Year
Hea
lth I
ndex
1.5
1.0
0.5
2.0
0.0
Fig. 7. THLI (standardized by age) for representative European countries
ItalyFranceSwedenLithuaniaBelgiumNetherlands
0.8
0.6
0.4
0.2
0.0
1985 1990 1995 2000 2005
Women Men
Year
Hea
lth I
ndex
ItalyFranceSwedenLithuaniaBelgiumNetherlands
1985 1990 1995 2000 2005Year
Hea
lth I
ndex
0.8
0.6
0.4
0.2
0.0
Do the numbers represented in Fig. 1–7 present an accurate picture of adult health status, especially of morbidity? This is of course hard to judge without a comparable objective morbidity measure. It is, however, disconcerting to see how consistently the Scandinavian countries, which are generally at the top of international health rankings, fare worse than even the new EU countries in eastern Europe, which generally exhibit unexceptional health performance (see also Tables 3 and 4). One way of assessing the usefulness of these data as health proxy would be to compare them to self-reported health data from other surveys, in particular those reporting chronic disease. As a benchmark for such

12
comparison, we selected information on adults (aged 18+) who have any long-standing illness or disability that limits their activities in any way, as provided by the European Quality of Life Survey 2003.10 Fig. 8 shows that, while a signifi cant positive correlation exists between the THLI and self-reported chronic illness, the correlation is rather low. The correlation is even lower when we compare the THLI with mortality indicators, such as the log of the standardized mortality ratio (Fig. 9) or the log of life expectancy at age 15 (Fig. 10). These comparisons make us suspect that, as proposed by the economics literature on the issue of sickness absence, factors other than social security generosity and ill health infl uence how people use or report sickness absence. (Of course self-reported chronic illness is also not a genuine benchmark of ill health here, as we do not know how much bias underlies those numbers. However, despite the well-documented existence of bias in self-reported health measures, these indicators have nevertheless been shown to be very reliable predictors of mortality (Ferraro and Farmer, 1999).)
Interestingly, men show a lower correlation between the THLI and other health proxies used in Fig. 8–10, so if there is a bias, it could be particularly pronounced among men, perhaps because they are more active in the labour market and therefore more exposed to the incentives embedded in social security.
Fig. 8. Scatter plots of THLI and prevalence of self-reported chronic illness
R-squared = 0.134Intercept = 0.137 (0.104)Slope = 0.006 (0.004)0
.60.5
0.4
0.3
0.2
0.1
10 15 20 25 30 4035 10 15 20 25 30 4035
Women
Self-reported chronic illness
TH
LI
SE HU
PL
AT
DK SE LVFI
LTNL
SI
GRIR
ITIT FR
PT
DEEEBE
ES
DK HU
NLPL
FILV
LT
SIGR
IR
ES
FR BEDEEEPT
AT
R-squared = 0.204Intercept = 0.145 (0.081)Slope = 0.006 (0.003)
0.5
0.4
0.3
0.2
Men
Self-reported chronic illness
TH
LI
Note: Abbreviations represent the following countries: AT is Austria; BE is Belgium; DE is Germany; DK is Denmark; EE is Estonia; ES is Spain; FI is Finland; FR is France; GR is Greece; HU is Hungary; IR is Ireland; IT is Italy; LT is Lithuania; LV is Latvia; NL is the Netherlands; NO is Norway; PL is Poland; PT is Portugal; SE is Sweden; and SI is Slovenia.
As noted earlier, the literature suggests a systematic bias in data related to sickness absence. Part of the evidence comes precisely from Sweden, where welfare is recognized to be more generous than in other countries (e.g. Henrekson and Persson, 2004; Johansson and Palme, 2002). Northern European countries in general are known to have generous welfare systems, including sick-leave policies, and this may provide an explanation for the results exposed above. Using time-series data, Henrekson and Persson (2004) found that Sweden’s reforms that entailed more generous compensation for sick leave tended to be associated with permanent increases in total sick leave granted per person employed and vice versa.
10 This survey is owned by the European Foundation for the Improvement of Living and Working Conditions. For more details see http://www.eurofound.europa.eu/areas/qualityofl ife/eqls/2003/eqls.htm, accessed 15 July 2010.

13
Fig. 9. Scatter plots of THLI and log of standardized mortality ratio
R-squared = 0.005Intercept = 0.095 (0.79)Slope = 0.04 (0.145)
0.6
0.5
0.4
0.3
0.2
0.1
5.0 5.2 5.4 5.6 5.8 6.0
Women
Log Standardised Mortality Ratio (25-64)
TH
LI
R-squared = 0.055
Intercept = -0.079 (0.426)Slope = 0.064 (0.068)
0.5
0.4
0.3
0.2
Men
Log Standardised Mortality Ratio (25-64)
TH
LI
6.0 6.5 7.0
NO
AT
SE
ES
DE
FI
NL
FR
GR
PT
IRSI
LT
EE
LV
PL
HUNOSE
AT NL
FIPT
FR DE
ES
GRIR SI
IT
EELV
HU
PL
Fig. 10. Scatter plots of THLI and log of life expectancy at 15
R-squared = 0.002Intercept = -0.578 (5.6)Slope = 0.213 (1.335)0
.60.5
0.4
0.3
0.2
0.1
4.14 4.16 4.18 4.20 4.244.22
Women
Log life expentancy at 15
TH
LI
R-squared = 0.051Intercept = 1.97 (1.835)Slope = -0.405 (0.45)
0.5
0.4
0.3
0.2
Men
Log life expentancy at 15
TH
LI
NO
SE
PL
HU
LV EE
LT
SI IRGR
DE
PT
NLAT
FI
FR
ESLT
EE
LV
PL AT
NOHU
FISE
ES
DENL
PT
FR
SIIR
GR
3.95 4.00 4.05 4.10 4.15

14
5. A second look at our data
The descriptive analysis above clearly shows that the indicators we defi ned need to be “purifi ed” somehow. Having the Scandinavian countries display fairly high sickness-absence rates particularly confi rms this belief in light of other very favourable health indicators from those countries. As we argued before, this fi nding of high sickness-absence rates is likely to be a spurious effect of a greater degree of absenteeism among countries that is likely driven by more generous sick-leave packages. If we could measure this degree of generosity, we would expect to be able to remove its spurious effect. (Since we focus only on eliminating this specifi c bias, we cannot be certain that we have eliminated any other possible bias.)
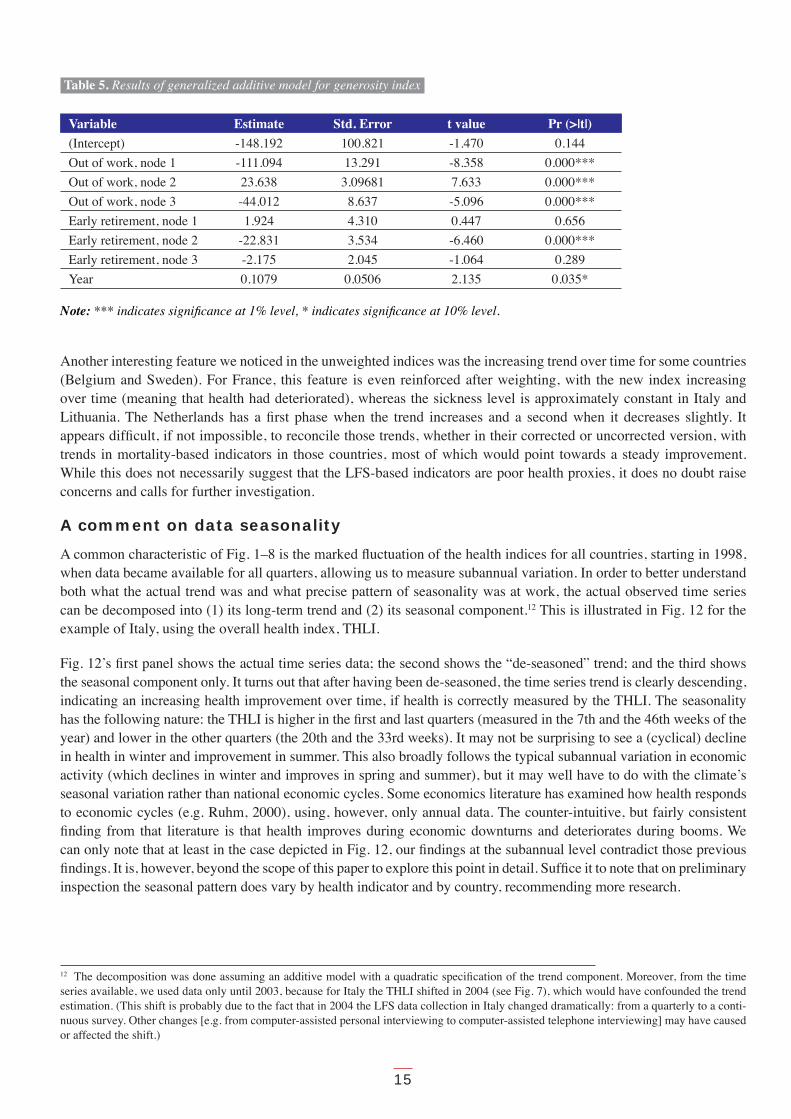
Measuring the degree of generosity in a social security system is fraught with diffi culties. It has often been measured by the level of social expenditure, ignoring some of the more subtle incentives provided in relevant legislation. Fortunately, we have a body of literature that has already attempted to measure what is not easily measurable. Osterkamp and Röhn (2007) defi ned a “generosity index” as an unweighted sum of seven variables on sick leave: waiting period, self-certifi cation, total maximum duration of payment, employer maximum duration of payment, employer amount of payment, sickness fund amount of payment, and external proof. Not surprisingly, these authors found that Sweden and Norway had the highest levels of generosity, confi rming our argument. However, their information is not entirely suffi cient for our purposes: the index was calculated only for a small number of countries and only for the period 1996–2002. Scruggs (2006) defi ned a broader generosity index that took into account income replacement rate (including sickness replacement rate), social insurance coverage and recipients. This author calculated an index of “expected welfare benefi t” as the product of the replacement rate and the coverage rate summed over three programmes (unemployment, sickness and pensions). Scruggs did this for 18 countries of the Organisation for Economic Co-operation and Development for each year from 1972 to 2002, so this index is a good candidate for purifying our health indices, but it does not cover all the countries and years in the LFS dataset. Therefore, we tried to impute the missing values of the generosity index by using a reasonable set of proxies, as follows: the Eurostat database offers some information on country “public expenditure on labour market policies”. In particular, three types of expenditure are potentially useful proxies of welfare generosity: (1) “labour market services”, which includes all interventions where participants’ main activity is job-search related; (2) “out-of-work income and maintenance and support” refers to interventions providing fi nancial assistance to individuals who, for different reasons, are not working temporarily or permanently; and (3) “early retirement” refers to interventions supporting people who retire early. Table 5 shows our results from a non-linear regression between the Scruggs’s generosity index and these variables. The fi t is not perfect but satisfactory (R-squared is 0.71), so the parameters estimated can be used with some degree of confi dence to impute the value of the generosity index where it is missing.11
After having calculated the generosity index for all countries and years, we used it to weigh the indices defi ned above: countries with a high level of generosity are given an (inversely proportional) small weight, while countries with a low level of generosity are given a high weight. In order to see how the weights affected the indices, we report in Fig. 11 the trend of one (THLI for men) before and after weighting, for the same countries considered in Fig. 1–7. The graphs clearly document that the health limitation was overestimated in Sweden and the Netherlands because of generosity in the welfare system and underestimated in Italy because of its comparatively less-developed welfare system. The weights barely affected the France, Belgium and Lithuania indices. Note that even after the indices are weighted, Scandinavian countries still have the highest levels of sickness. This might suggest that we have not fully removed the spurious effect of generosity from the indices. Once again, though, in the absence of an objective benchmark, it remains hard to know what the true level of the health index should be.
11 The fi t is rather good with the exception of eastern European countries, for which the predicted value of the generosity index is sensibly larger than the original value (when it is available). Therefore, we rescaled the predicted values in order to have an index whose magnitude is consistent with Scruggs’s original index.
15
Table 5. Results of generalized additive model for generosity index
Variable Estimate Std. Error t value Pr (>|t|)
(Intercept) -148.192 100.821 -1.470 0.144
Out of work, node 1 -111.094 13.291 -8.358 0.000***
Out of work, node 2 23.638 3.09681 7.633 0.000***
Out of work, node 3 -44.012 8.637 -5.096 0.000***
Early retirement, node 1 1.924 4.310 0.447 0.656
Early retirement, node 2 -22.831 3.534 -6.460 0.000***
Early retirement, node 3 -2.175 2.045 -1.064 0.289
Year 0.1079 0.0506 2.135 0.035*
Note: *** indicates signifi cance at 1% level, * indicates signifi cance at 10% level.
Another interesting feature we noticed in the unweighted indices was the increasing trend over time for some countries (Belgium and Sweden). For France, this feature is even reinforced after weighting, with the new index increasing over time (meaning that health had deteriorated), whereas the sickness level is approximately constant in Italy and Lithuania. The Netherlands has a fi rst phase when the trend increases and a second when it decreases slightly. It appears diffi cult, if not impossible, to reconcile those trends, whether in their corrected or uncorrected version, with trends in mortality-based indicators in those countries, most of which would point towards a steady improvement. While this does not necessarily suggest that the LFS-based indicators are poor health proxies, it does no doubt raise concerns and calls for further investigation.
A comment on data seasonality
A common characteristic of Fig. 1–8 is the marked fl uctuation of the health indices for all countries, starting in 1998, when data became available for all quarters, allowing us to measure subannual variation. In order to better understand both what the actual trend was and what precise pattern of seasonality was at work, the actual observed time series can be decomposed into (1) its long-term trend and (2) its seasonal component.12 This is illustrated in Fig. 12 for the example of Italy, using the overall health index, THLI.
Fig. 12’s fi rst panel shows the actual time series data; the second shows the “de-seasoned” trend; and the third shows the seasonal component only. It turns out that after having been de-seasoned, the time series trend is clearly descending, indicating an increasing health improvement over time, if health is correctly measured by the THLI. The seasonality has the following nature: the THLI is higher in the fi rst and last quarters (measured in the 7th and the 46th weeks of the year) and lower in the other quarters (the 20th and the 33rd weeks). It may not be surprising to see a (cyclical) decline in health in winter and improvement in summer. This also broadly follows the typical subannual variation in economic activity (which declines in winter and improves in spring and summer), but it may well have to do with the climate’s seasonal variation rather than national economic cycles. Some economics literature has examined how health responds to economic cycles (e.g. Ruhm, 2000), using, however, only annual data. The counter-intuitive, but fairly consistent fi nding from that literature is that health improves during economic downturns and deteriorates during booms. We can only note that at least in the case depicted in Fig. 12, our fi ndings at the subannual level contradict those previous fi ndings. It is, however, beyond the scope of this paper to explore this point in detail. Suffi ce it to note that on preliminary inspection the seasonal pattern does vary by health indicator and by country, recommending more research.
12 The decomposition was done assuming an additive model with a quadratic specifi cation of the trend component. Moreover, from the time series available, we used data only until 2003, because for Italy the THLI shifted in 2004 (see Fig. 7), which would have confounded the trend estimation. (This shift is probably due to the fact that in 2004 the LFS data collection in Italy changed dramatically: from a quarterly to a conti-nuous survey. Other changes [e.g. from computer-assisted personal interviewing to computer-assisted telephone interviewing] may have caused or affected the shift.)

16
Fig. 11. THLI before and after weighting with the inverse of generosity score, men, six countries
Unweighted indexWeighted index
1.0
0.8
0.4
0.2
0.0
1985 1990 1995 2000 2005
Netherlands
Year
0.6
Hea
lth I
ndex
1.0
0.8
0.6
0.4
0.2
0.0
1985 1990 1995 2000 2005
Italy
Year
Hea
lth I
ndex
Unweighted indexWeighted index
Unweighted indexWeighted index
1.0
0.8
0.6
0.4
0.2
0.0
1996 1998 2000 2002 2004
Sweden
Year
Hea
lth I
ndex
1.0
0.8
0.6
0.4
0.2
0.0
1985 1990 1995 2000 2005
France
Year
Hea
lth I
ndex
Unweighted indexWeighted index

17
Fig. 11. contd.
Unweighted indexWeighted index
1.0
0.8
0.6
0.4
0.2
0.0
1985 1990 1995 2000 2005
Belgium
Year
Hea
lth I
ndex
1.0
0.8
0.6
0.4
0.2
0.0
1999 2000 20022001 2003 2004 2005
Lithuania
YearH
ealth I
ndex
Unweighted indexWeighted index
Fig. 12. Decomposition of THLI time series, Italy, men
0.1
80.1
40.1
0
1998 1999 2000 2001 2002 2003 2004 2005
Dat
a
Year
0.1
60.1
40.1
20.1
0
1998 1999 2000 2001 2002 2003 2004 2005
Tren
d
Year
0.0
10
0.0
00
-0.0
10
1998 1999 2000 2001 2002 2003 2004 2005
Sea
sonal
Year

18
6. Socioeconomic inequalities in health
We are also interested in knowing what can be said on socioeconomic inequalities in health within countries on the basis of the LFS data. The issue of health inequality is increasingly a concern both in industrialized and developing countries (Marmot, 2005). Arguably, the issue of bias generated by a country’s social security system that we had to grapple with (without overwhelming success) in the previous section is less relevant when measuring socioeconomic inequalities within a given country. More specifi cally, the two major questions are the following.
(1) Which countries have the highest inequality levels (and which ones the lowest)? (2) Has inequality increased in the last few years, as some research suggests?13
Following guidelines from O’Donnel et al. (2008) for measuring socioeconomic inequalities in health, we constructed a health inequality index using the following formula:
C(ν) = 1- —νnμΣhi(1-R
i)ν-1
n
i=1 (2)
where C is the measure of inequality or concentration index, n is the sample size, hi is the ill health indicator for
individual i, μ is the mean level of ill health, and Ri is the fractional rank in the living standard distribution of individual
i. This index is an extended version of the concentration index, the latter being twice the area between the concentration curve and the line of equity. Conventionally, the index is constructed so that it takes a negative value when ill health is disproportionately concentrated among the poor. The parameter ν is an inequality-aversion parameter; when ν=2 we have an ordinary concentration index.
Therefore, we needed an appropriate indicator of living standard in order to calculate the concentration index in formula (2). Unfortunately, the LFS does not give us income variables, and we also do not have other asset indicators. We do, however, have different versions of educational attainment (following the classifi cation of the International Standard Classifi cation of Education (ISCED)14) and occupational status that we can use in measuring socioeconomic status (SES). Since the size and evolution of health inequalities results may well be sensitive to the well-being proxy used in the index calculations, we try to check the robustness of our main fi ndings through the application of different SES indicators.
While the use of the available education variable is fairly straightforward in that it follows an obvious ordinal pattern, occupational status is less easily converted into an ordinal well-being indicator. In order to use occupational category as a proxy of well-being, we transformed it into an ordinal variable. There are three possible choices of ordinal transformation of categories of International Standard Classifi cation of Occupations (ISCO), namely, International Socio-Economic Index of Occupational Status (ISEI), Standard International Occupational Prestige Scale (SIOPS) and (Erikson and Goldthorpe’s class categories (EGP). SIOPS is a prestige measure of occupational status, generated from the popular evaluation of occupational standing; ISEI comes as a socioeconomic scale, created by computing a weighted sum of the socioeconomic characteristics (usually education and income) of each position; EGP differs from the previous two because of its discrete nature (SIOPS and ISEI are scores; EGP is a classifi cation with 11 ordered categories). We use the scales calculated by Ganzeboom and Treiman (1996).
Overall, we measured socioeconomic health inequalities with fi ve possible proxies of well-being, two based on education (ISCED1D and ISCED2D classifi cation) and three based on occupation (EGP, SIOPS and ISEI). In order to avoid an excessively long paper, we focus on the EGP-based results, knowing that – as we have tested – SIOPS and ISEI produce perfectly consistent results. Similarly, the results we obtained for EGP indices are consistent with those obtained using education as a proxy of well-being.
13 See e.g. Mackenbach (2006).14 ISCED is an international classifi cation standard of education created by the United Nations Educational, Scientifi c and Cultural Organization (UNESCO). Several levels of ISCED classifi cation have been generated, and the higher the level, the more detailed the classifi cation. The LFS gives us ISCED1D classifi cation (with three categories, “low”, “medium” and “high”) and ISCED2D classifi cation (with six categories).

19
Tables 6 (for men) and 7 (for women) answer the fi rst question – Where are the biggest (or smallest) health inequalities? – focusing on four LFS-based health indicators (TIW, CRWA, TRWA and THLI).15 From this ranking we cannot draw a straightforward geographic pattern: many eastern European countries show a high inequality, but the highest is in Portugal. The level of health inequality in Finland, furthermore, is close to that of Estonia. The lowest inequality levels are in Belgium and Austria. Luxembourg, by contrast, has one of the highest inequality levels. Interestingly, the ranking of women is a bit different from that of men. Luxembourg, for instance, has a relatively low level of inequality among the women compared to men.
Table 6. Inequality of several health indices in European countries, men, second quarter, 2004
Country TIW TRWA CRWA THLI
Portugal -0.183 -0.673 -0.738 -0.695
Slovakia -0.354 -0.188 -0.487 -0.492
Poland -0.195 -0.418 -0.462 -0.438
Luxembourg -0.473 -0.840 -0.315 -0.402
Estonia -0.311 -1.306 -0.090 -0.394
Finland -0.531 -0.308 -0.410 -0.325
France -0.255 -0.293 -0.282 -0.323
Lithuania -0.389 0.663 -0.315 -0.315
Sweden -0.236 -0.270 -0.241 -0.297
Germany -0.186 -0.124 -0.425 -0.263
Czech Republic -0.081 -0.453 -0.234 -0.234
Denmark -0.480 0.076 -0.432 -0.229
Slovenia 0.046 -0.232 0 -0.227
Italy -0.189 -0.114 -0.400 -0.194
Latvia -0.199 -0.628 -0.098 -0.188
Ireland -0.178 -0.147 -0.108 -0.182
Greece -0.007 -0.202 -0.173 -0.180
Hungary -0.186 -0.190 -0.150 -0.152
Norway -0.334 -0.145 -0.237 -0.114
Netherlands -0.199 -0.042 -0.373 -0.101
Spain -0.133 -0.070 -0.005 -0.079
Austria -0.298 -0.107 -0.011 -0.037
Belgium -0.253 -0.171 0.231 0.023
Cyprus -0.608 -0.133 -0.213 NA
Iceland -0.362 -0.450 0 NA
Note: Rows are sorted by inequality rank in THLI, from most inequality to least.
Fig. 13 attempts to answer the second question – How have health inequalities evolved over time? – by looking at the example of Italy for all six health indicators. While the overall trend in the health inequality indices appears to be decreasing (implying that the concentration of ill health among the poorest increased between 199316 and 2004), it is almost impossible to distil the time trend upon mere visual inspection due to the very marked fl uctuations, which again start when the survey data are available at subannual intervals.
15 Annex 2 has the other health indicators.16 The inequality index cannot be calculated for the years 1983–1992 because the proxies of well-being are not reported.

20
Table 7. Inequality of several health indices in European countries, women, second quarter, 2004
Country TIW TRWA CRWA THLI
Lithuania 0.069 NA -0.962 -0.962
Estonia -0.618 -1.275 -0.750 -0.779
Poland 0.133 -0.317 -0.527 -0.494
Slovakia -0.084 -0.229 -0.60 -0.441
Portugal -0.106 -0.191 -0.655 -0.377
Hungary -0.230 -0.151 -0.333 -0.356
Italy -0.239 -0.203 -0.334 -0.320
Spain -0.125 -0.186 -0.307 -0.301
Czech Republic -0.170 -0.269 -0.315 -0.275
Finland -0.336 -0.225 -0.370 -0.238
Ireland -0.112 0.169 -0.346 -0.214
France -0.165 -0.137 -0.238 -0.182
Norway -0.045 -0.101 -0.307 -0.180
Slovenia 0.040 -0.176 0 -0.176
Greece -0.301 -0.074 -0.424 -0.170
Sweden -0.203 -0.043 -0.340 -0.147
Denmark -0.086 -0.259 -0.013 -0.109
Latvia -0.258 -0.538 0.454 -0.095
Luxembourg -0.337 0.511 -0.180 -0.046
Netherlands -0.077 0.080 -0.241 -0.018
Austria 0.059 0.227 -0.085 0.011
Germany -0.024 0.270 -0.161 0.021
Belgium -0.111 0.256 -0.029 0.106
Cyprus 0.092 -0.156 -0.304 NA
Iceland 0.013 -0.202 0 NA
Note: Rows are sorted by inequality rank in THLI, from most inequality to least.
Hence, not only the average health indices, but even the distribution of the health indicators within a country shows a seasonal pattern. To be better able to detect the trend as well as the shape of the seasonal pattern, we again performed a decomposition analysis. Fig. 14 illustrates the decomposition of CRWA indices for Italy.
It turns out that health inequalities have on average been increasing for men. For women the pattern is less straightforward: the line rises (indicating that health inequality decreases) until 2001 and falls thereafter. The seasonality component seems to indicate that during one year, the highest level of inequality occurred in the second quarter (on average in the fourteenth week) for both sexes. Interestingly, this does not correspond to the quarter when seasonality is at the highest level for the average of the CRWA index (which is the fi rst one, when the seasonality of inequality is at the lowest level). Thus, there is no straightforward link between average health seasonality and health inequality seasonality. This implies that the health responses to the seasonal cycle differ by socioeconomic group. This again points to a potential parallel to the above-mentioned literature that used annual data to look at the association between business cycles and health. While the literature generally only looks at how average population health responds to either economic up- or down-turns, some papers have tried to shed light on the distributional health effects of those cycles (e.g. Kondo et al., 2008; Edwards, 2008; Valkonen et al., 2000). This (rather scarce) literature tends to confi rm the differential health response across socioeconomic groups.

21
Fig. 13. Health inequality index, Italy
1995 2000 2005
Women (standardized by age)
Year
Hea
lth I
neq
ual
ity
1.0
0.5
- 1.0
- 0.5
0.0
TIW
TRWACRWA
PIW2THLI
1995 2000 2005
Men (standardized by age)
Year
Hea
lth I
neq
ual
ity
1.0
0.5
- 1.0
- 0.5
0.0
TIW
TRWACRWA
PIW2THLI
Importantly, the other countries do not replicate the pattern found for CRWA in Italy. While it would be interesting to analyse with more depth all the seasonal components of all countries for all health indicators, doing so would be beyond the scope of this paper.
Trade-offs between average health and health inequalities?
Thus far we have looked separately at average health and its distribution. There is, however, reason to believe that a trade-off may exist between health and its distribution (Bommier and Stecklov, 2002). Understanding this phenomenon is important when considering what policy objectives to set in any given country. If a trade-off exists, diffi cult decisions will have to be made on how the two worthwhile objectives of improving average population health and reducing health inequalities will be balanced (Wagstaff, 2002).

22
Fig. 14. Decomposition of CRWA inequality time series, Italy
Tren
d
0.0
-0.2
-0.4
1998 1999 2000 2001 2002 2003 2004 2005
Year
Sea
sonal 0
.0-0
.2-0
.4
1998 1999 2000 2001 2002 2003 2004 2005
Year
-0.1
-0.5
1998 1999 2000 2001 2002 2003 2004 2005
Year
Dat
a
WomenMen
Fig. 15 is a scatter plot comparing the average level of purifi ed TRWA with its inequality index. Given the way the health indicator and the inequality index are defi ned – the higher the TRWA, the lower the health, and the higher the inequality index, the more pro-poor the distribution – we would expect to see a positive linear relationship if a trade-off indeed exists. This example does not overwhelmingly confi rm such relationship: the trade-off is not widely confi rmed, but we do notice a slight, positive correlation between the two measures.17 However, it should be borne in mind that this pattern is not stable across the different health indicators used here. For other indices, such as the TIW and CRWA, the trade-off between average level of health and inequality is even harder to detect. The same applies to THLI, for which the relationship between average health level and inequality is not clear-cut.
Taken literally, this suggests that there may not be too much of a trade-off between average health and the distribution of health. Hence, there may be ways for countries to simultaneously achieve both an improvement in average health and a reduction in health inequalities. One might be tempted to conclude from these fi ndings that it is possible to
17 The lowest regression line was drawn with the exclusion of two outliers: Lithuania and Sweden.

23
reconcile a good average level of health with low inequality: the two do not appear to be opposed to each other. We caution, however, against a too literal interpretation of this possibility in light of the severe doubts about the extent to which the average level of the health indicators is a reliable proxy of true health.
Fig. 15. Average level and inequality index of TRWA in European countries, second quarter, 20040.1
50.1
00.0
50.0
0
- 1.0 -0.5 0.0 0.5TRWA: inequality index
TRW
A:
aver
age
leve
l
SE
SI NO NLDK
BE
IT
FIFR
CZPTLV
PLLU
EEGRHUSK
DEIE
AT
ES
LT
Note: Abbreviations represent the following countries: AT is Austria; BE is Belgium; CZ is the Czech Republic; DE is Germany; DK is Denmark; EE is Estonia; ES is Spain; FI is Finalnd; FR is France; GR is Greece; HU is Hungary; IE is Ireland; IT is Italy; LT is Lithuania; LU is Luxembourg; LV is Latvia; NL is the Netherlands; NO is Norway; PL is Poland; PT is Portugal; SE is Sweden; SI is Slovenia; and SK is Slovakia.

24
7. Concluding remarks
The present work was primarily explorative in nature. Our intention was to determine the utility of a major European-wide household survey, hitherto unexploited by health researchers, to measure health as well as socioeconomic inequalities in health. Judging whether the resulting health data are indeed reliable proxies for true health is of course compromised by the problem that true health is unobservable. The health information from the LFS is limited in that it considers health only as a reason for different dimensions of “less than normal” labour supply or labour market participation. The epidemiological literature had shown, on the basis of other survey data, that this kind of sickness-absence-related data may after all be a good predictor of later mortality. On the other hand, the economics literature pointed to a strong bias in sickness-absence data in response to the incentives embedded in countries’ social security systems. We thus had to “purify” the LFS health information by each country’s degree of generosity. Nevertheless, while the corrected values appeared slightly more “plausible” than the uncorrected ones, we would at this stage not argue that our proposed method has successfully transformed the health information into a valid measure of countries’ average population health.
Assuming that the incentives embedded in any social security system differ more between than within countries, we felt far more comfortable in using the health data to measure the size and evolution of socioeconomic inequalities in health. We calculated standard concentration indices, using fi ve different proxies – based on educational attainment and occupational categories – for socioeconomic status. Our results were broadly robust to the different SES proxies, both in terms of the size of inequalities and in terms of trends. Once we decomposed the inequality data series into its trend and seasonal components, it became clear that overall, for most countries and most health indicators, health inequalities have been increasing, a result that confi rms other recent research (Mackenbach, 2006). In contrast to earlier research, however, we based our conclusions on a signifi cantly larger sample for a longer period of time.
Given the chiefl y exploratory nature of our analysis, we have probably raised more questions than we have answered. There remains signifi cant scope to explain the pattern and trends in the average health indicators we have employed. We were particularly surprised to see rather pronounced fl uctuations in both health and health inequalities for essentially all health indicators and years as soon as the survey data became available at subannual intervals. Not least, further research should also seek to decompose the pattern and trends in health inequality into its drivers.

25
References
Bergendorff S (2003). Sickness absence in Europe – a comparative study. Fourth International Research Conference on Social Security. Antwerp, Belgium, 5–7 May 2003.
Bommier A, Stecklov G (2002). Defi ning health inequality: why Rawls succeeds where social welfare theory fails. Journal of Health Economics, 21(3):497–513.
Bonato L, Lusinyan L (2004). Work absence in Europe. Washington, DC, International Monetary Fund (IMF Working Paper WP/04/193).
Campostrini S, Bellini P (2000). Sick-leave and other job-related health issues from Labour Force Surveys data, International Statistical Review, 68(2):189–198.
Charlier H, Franco A (2001). The EU Labour Force Survey on the way to convergence and quality. In Proceedings of Statistics Canada Symposium 2001—Achieving data quality in a statistical agency: A methodological perspective. Ottawa: Statistics Canada (http://www.statcan.gc.ca/pub/11-522-x/2001001/session1/6225-eng.pdf, accessed 15 July 2010).
Christensen KB, Labriola T, Kivimäki M (2008). Explaining the social gradient in long term sickness absence: a prospective study of Danish employees. Journal of Epidemiology and Community Health, 62:181–183.
Edwards R (2008). Who is hurt by procyclical mortality? Social Science & Medicine, 67:2051–2058.
Eurostat [web site] (2010). Luxembourg, European Commission (http://epp.eurostat.ec.europa.eu/portal/page/portal/eurostat/home/, accessed 15 July 2010).
Ferraro KF, Farmer MM (1999). Utility of health data from social surveys: Is there a gold standard for measuring morbidity? American Sociological Review, 64(2):303–315.
Frick B, Malo MÁ (2008). Labor Market Institutions and Individual Absenteeism in the European Union: The Relative Importance of Sickness Benefi t Systems and Employment Protection Legislation. Industrial Relations. 47(4): 505-529.
Ganzeboom HBG., Treiman DJ (1996). Internationally comparable measures of occupational status for the 1988 International Standard Classifi cation of Occupations. Social Science Research, 25:201–239.
Henrekson M, Persson M (2004). The effects on sick leave of changes in the sickness insurance system. Journal of Labor Economics, 22(1):87–113.
Holmlund B (2004). Sickness absence: an introduction. Swedish Economic Policy Review, 11:3–8.
Ichino A, Riphahn R (2005). The effect of employment protection on worker effort: absenteeism during and after probation. Journal of the European Economic Association, 3(1):120–143.
Johansson P, Palme M (2002). Assessing the effect of public policy on worker absenteeism. The Journal of Human Resources, 37(2):381–409.
Kivimäki M et al. (2003). Sickness absence as a global measure of health: evidence from mortality in the Whitehall II prospective study. British Medical Journal, 327:364–369.
Kondo N, Subramanian SV, Kawachi I (2008). Economic recession and health inequalities in Japan: analysis with a national sample, 1986–2001. Journal of Epidemiology and Community Health, 62(10):869–875.

26
Mackenbach JP (2006). Health inqualities: Europe in profi le. Rotterdam: Erasmus Medical Centre Rotterdam.
Mackenbach JP et al. (2008). Socioeconomic inequalities in health in 22 European countries. New England Journal of Medicine, 23:2468–2481.
Marmot M (2005). Social determinants of health inequalities. Lancet, 365:1099–1104.
O’Donnel O et al. (2008). Analysing Health Equity Using Household Survey Data: A Guide to Techniques and Their Implementation. Washington DC, World Bank (World Bank Institute Learning Resources Series).
Osterkamp R, Röhn O (2007). Being on sick leave: possible explanations for differences of sick-leave days across countries. CESifo Economic Studies, 53(1):97–114.
Rae D (2005). How to Reduce Sickness Absences in Sweden: Lessons from International Experience. Paris, OECD Economics Department (Working Paper ECO/WKP(2005)29).
Ruhm C (2000). Are recessions good for your health? Quarterly Journal of Economics, 115:617–650.
Scruggs L (2006). The generosity of social insurance, 1971–2002. Oxford Review of Economic Policy, 22(3):349–364.
Valkonen T et al. (2000). Changes in socioeconomic inequalities in mortality during an economic boom and recession among middle-aged men and women in Finland. European Journal of Public Health, 10:274–280.
Wagstaff A (2002). Inequality aversion, health inequalities and health achievement. Journal of Health Economics, 21(4):627–641.
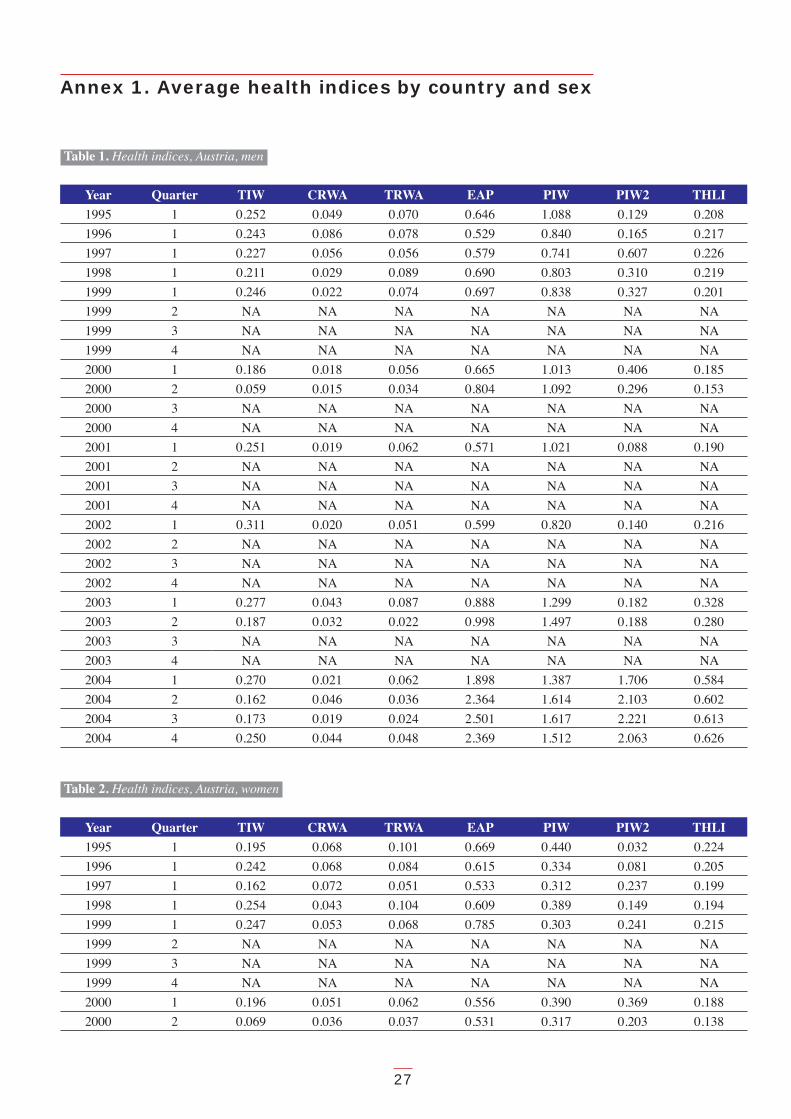
27
Annex 1. Average health indices by country and sex
Table 1. Health indices, Austria, men
Year Quarter TIW CRWA TRWA EAP PIW PIW2 THLI
1995 1 0.252 0.049 0.070 0.646 1.088 0.129 0.208
1996 1 0.243 0.086 0.078 0.529 0.840 0.165 0.217
1997 1 0.227 0.056 0.056 0.579 0.741 0.607 0.226
1998 1 0.211 0.029 0.089 0.690 0.803 0.310 0.219
1999 1 0.246 0.022 0.074 0.697 0.838 0.327 0.201
1999 2 NA NA NA NA NA NA NA
1999 3 NA NA NA NA NA NA NA
1999 4 NA NA NA NA NA NA NA
2000 1 0.186 0.018 0.056 0.665 1.013 0.406 0.185
2000 2 0.059 0.015 0.034 0.804 1.092 0.296 0.153
2000 3 NA NA NA NA NA NA NA
2000 4 NA NA NA NA NA NA NA
2001 1 0.251 0.019 0.062 0.571 1.021 0.088 0.190
2001 2 NA NA NA NA NA NA NA
2001 3 NA NA NA NA NA NA NA
2001 4 NA NA NA NA NA NA NA
2002 1 0.311 0.020 0.051 0.599 0.820 0.140 0.216
2002 2 NA NA NA NA NA NA NA
2002 3 NA NA NA NA NA NA NA
2002 4 NA NA NA NA NA NA NA
2003 1 0.277 0.043 0.087 0.888 1.299 0.182 0.328
2003 2 0.187 0.032 0.022 0.998 1.497 0.188 0.280
2003 3 NA NA NA NA NA NA NA
2003 4 NA NA NA NA NA NA NA
2004 1 0.270 0.021 0.062 1.898 1.387 1.706 0.584
2004 2 0.162 0.046 0.036 2.364 1.614 2.103 0.602
2004 3 0.173 0.019 0.024 2.501 1.617 2.221 0.613
2004 4 0.250 0.044 0.048 2.369 1.512 2.063 0.626
Table 2. Health indices, Austria, women
Year Quarter TIW CRWA TRWA EAP PIW PIW2 THLI
1995 1 0.195 0.068 0.101 0.669 0.440 0.032 0.224
1996 1 0.242 0.068 0.084 0.615 0.334 0.081 0.205
1997 1 0.162 0.072 0.051 0.533 0.312 0.237 0.199
1998 1 0.254 0.043 0.104 0.609 0.389 0.149 0.194
1999 1 0.247 0.053 0.068 0.785 0.303 0.241 0.215
1999 2 NA NA NA NA NA NA NA
1999 3 NA NA NA NA NA NA NA
1999 4 NA NA NA NA NA NA NA
2000 1 0.196 0.051 0.062 0.556 0.390 0.369 0.188
2000 2 0.069 0.036 0.037 0.531 0.317 0.203 0.138

28
Year Quarter TIW CRWA TRWA EAP PIW PIW2 THLI2000 3 NA NA NA NA NA NA NA
2000 4 NA NA NA NA NA NA NA
2001 1 0.218 0.041 0.057 0.358 0.326 0.095 0.147
2001 2 NA NA NA NA NA NA NA
2001 3 NA NA NA NA NA NA NA
2001 4 NA NA NA NA NA NA NA
2002 1 0.270 0.038 0.075 0.662 0.333 0.287 0.270
2002 2 NA NA NA NA NA NA NA
2002 3 NA NA NA NA NA NA NA
2002 4 NA NA NA NA NA NA NA
2003 1 0.248 0.051 0.129 0.696 0.536 0.277 0.304
2003 2 0.166 0.055 0.017 0.679 0.462 0.275 0.237
2003 3 NA NA NA NA NA NA NA
2003 4 NA NA NA NA NA NA NA
2004 1 0.250 0.099 0.050 1.381 0.645 1.219 0.513
2004 2 0.152 0.085 0.020 1.481 0.654 1.178 0.491
2004 3 0.153 0.084 0.024 1.720 0.649 1.293 0.572
2004 4 0.214 0.088 0.042 1.556 0.612 1.349 0.571
Table 3. Health indices, Belgium, men
Year Quarter TIW CRWA TRWA EAP PIW PIW2 THLI
1983 2 NA NA NA NA NA NA NA
1984 2 0.148 0.010 0.016 0.868 NA 0.131 0.089
1985 2 0.159 0.020 0.014 1.127 NA 0.182 0.113
1986 2 0.153 0.025 0.017 1.185 NA 0.066 0.113
1987 2 0.114 0.016 0.005 0.896 NA 0.095 0.074
1988 2 0.094 0.011 0.007 1.096 NA 0.072 0.077
1989 2 0.128 0.015 0.011 1.235 NA 0.194 0.090
1990 2 0.083 0.017 0.016 1.357 NA 0.070 0.092
1991 2 0.086 0.018 0.012 1.283 NA 0.106 0.094
1992 2 0.132 0.023 0.011 1.489 1.973 0.991 0.312
1993 2 0.130 0.025 0.015 1.383 1.878 0.727 0.289
1994 2 0.137 0.018 0.009 1.279 1.760 0.670 0.273
1995 2 0.134 0.021 0.012 1.395 1.884 0.867 0.300
1996 2 0.151 0.012 0.021 1.435 1.895 0.786 0.308
1997 2 0.119 0.026 0.019 1.322 1.831 0.708 0.280
1998 2 0.187 0.020 0.017 1.418 1.786 0.931 0.327
1999 1 0.275 0.037 0.064 1.497 0.054 0.130 0.312
1999 2 0.246 0.014 0.045 1.508 0.064 0.181 0.285
1999 3 0.278 0.024 0.029 1.674 0.060 0.119 0.287
1999 4 0.233 0.023 0.049 1.695 0.142 0.140 0.312
2000 1 0.281 0.032 0.063 1.536 0.096 0.152 0.295
2000 2 0.315 0.023 0.038 1.664 0.082 0.130 0.280
2000 3 0.267 0.038 0.034 1.450 0.087 0.121 0.254
2000 4 0.262 0.023 0.059 1.678 0.080 0.164 0.319
2001 1 0.346 0.033 0.066 1.474 0.145 0.178 0.299

29
Year Quarter TIW CRWA TRWA EAP PIW PIW2 THLI2001 2 0.280 0.041 0.047 1.316 0.181 0.233 0.277
2001 3 0.313 0.032 0.024 1.430 0.122 0.204 0.277
2001 4 0.300 0.025 0.041 1.366 0.111 0.174 0.282
2002 1 0.329 0.030 0.030 1.418 0.123 0.221 0.276
2002 2 0.334 0.042 0.032 1.526 0.149 0.242 0.308
2002 3 0.216 0.038 0.035 1.508 0.157 0.186 0.287
2002 4 0.261 0.032 0.038 1.555 0.160 0.248 0.330
2003 1 0.365 0.023 0.038 1.202 0.138 0.230 0.256
2003 2 0.227 0.044 0.020 1.209 0.183 0.183 0.247
2003 3 0.273 0.021 0.041 1.277 0.091 0.133 0.242
2003 4 0.320 0.034 0.054 1.363 0.137 0.230 0.295
2004 1 0.284 0.035 0.036 1.029 0.080 0.130 0.216
2004 2 0.279 0.030 0.040 1.292 0.155 0.266 0.273
2004 3 0.205 0.064 0.025 1.253 0.147 0.222 0.271
2004 4 0.276 0.024 0.031 1.331 0.119 0.168 0.258
Table 4. Health indices, Belgium, women
Year Quarter TIW CRWA TRWA EAP PIW PIW2 THLI
1983 2 NA NA NA NA NA NA NA
1984 2 0.157 0.031 0.011 0.729 NA 0.155 0.068
1985 2 0.153 0.021 0.021 0.926 NA 0.093 0.068
1986 2 0.118 0.028 0.009 0.799 NA 0.080 0.062
1987 2 0.118 0.036 0.005 0.804 NA NA NA
1988 2 0.095 0.045 0.011 0.793 NA 0.146 0.066
1989 2 0.098 0.026 0.013 1.005 NA 0.041 0.054
1990 2 0.084 0.033 0.013 1.009 NA NA NA
1991 2 0.085 0.025 0.005 0.962 NA 0.042 0.061
1992 2 0.124 0.039 0.013 0.971 0.523 0.610 0.200
1993 2 0.140 0.038 0.018 0.993 0.577 0.674 0.227
1994 2 0.144 0.029 0.019 0.887 0.580 0.657 0.221
1995 2 0.130 0.034 0.018 0.948 0.605 0.530 0.219
1996 2 0.179 0.032 0.027 1.016 0.662 0.583 0.240
1997 2 0.154 0.040 0.011 0.883 0.629 0.511 0.203
1998 2 0.174 0.033 0.032 1.045 0.694 0.749 0.273
1999 1 0.224 0.079 0.044 1.187 0.048 0.120 0.247
1999 2 0.179 0.082 0.030 1.232 0.026 0.149 0.247
1999 3 0.187 0.053 0.022 0.911 0.051 0.196 0.195
1999 4 0.295 0.043 0.033 1.079 0.035 0.143 0.214
2000 1 0.363 0.083 0.074 1.349 0.062 0.157 0.272
2000 2 0.287 0.069 0.066 1.286 0.054 0.141 0.257
2000 3 0.234 0.054 0.036 0.962 0.047 0.174 0.196
2000 4 0.256 0.046 0.051 1.148 0.051 0.132 0.218
2001 1 0.269 0.086 0.025 1.127 0.051 0.233 0.239
2001 2 0.233 0.053 0.050 1.269 0.078 0.191 0.245
2001 3 0.266 0.047 0.027 0.970 0.107 0.203 0.206
2001 4 0.267 0.049 0.039 1.056 0.105 0.199 0.226

30
Year Quarter TIW CRWA TRWA EAP PIW PIW2 THLI2002 1 0.284 0.095 0.046 1.038 0.071 0.162 0.234
2002 2 0.298 0.085 0.036 1.290 0.072 0.155 0.265
2002 3 0.180 0.059 0.022 1.254 0.069 0.161 0.245
2002 4 0.219 0.067 0.025 1.173 0.069 0.175 0.241
2003 1 0.317 0.087 0.040 1.107 0.085 0.192 0.241
2003 2 0.201 0.102 0.025 1.215 0.073 0.181 0.253
2003 3 0.216 0.069 0.029 1.197 0.065 0.236 0.251
2003 4 0.254 0.066 0.057 1.161 0.075 0.198 0.250
2004 1 0.248 0.067 0.049 1.021 0.070 0.142 0.218
2004 2 0.228 0.082 0.026 1.078 0.063 0.153 0.225
2004 3 0.200 0.084 0.026 1.090 0.079 0.190 0.244
2004 4 0.233 0.068 0.040 0.993 0.069 0.177 0.223
Table 5. Health indices, the Czech Republic, men
Year Quarter TIW CRWA TRWA EAP PIW PIW2 THLI
1997 2 0.368 0.104 0.042 3.506 0.652 0.031 0.476
1998 1 0.379 0.091 0.022 2.795 3.174 0.074 0.399
1998 2 0.350 0.102 0.025 2.995 3.357 0.083 0.428
1998 3 0.284 0.080 0.018 2.825 3.330 0.070 0.394
1998 4 0.310 0.082 0.025 2.667 3.283 0.050 0.396
1999 1 0.436 0.082 0.034 2.373 3.031 0.044 0.393
1999 2 0.274 0.087 0.017 2.302 2.835 0.061 0.377
1999 3 0.244 0.081 0.012 2.288 2.766 0.056 0.365
1999 4 0.307 0.077 0.018 2.236 2.791 0.056 0.372
2000 1 0.440 0.073 0.039 0.505 2.625 0.056 0.172
2000 2 0.293 0.086 0.023 1.014 2.760 0.054 0.233
2000 3 0.254 0.076 0.020 0.717 2.919 0.063 0.190
2000 4 0.286 0.086 0.029 2.450 2.902 0.098 0.417
2001 1 0.550 0.083 0.046 2.073 2.665 0.122 0.390
2001 2 0.405 0.080 0.019 2.197 2.792 0.130 0.379
2001 3 0.392 0.074 0.015 2.336 2.962 0.118 0.387
2001 4 0.457 0.073 0.019 2.287 2.895 0.108 0.377
2002 1 0.493 0.078 0.029 2.308 2.916 0.865 0.454
2002 2 0.399 0.075 0.030 2.466 3.060 1.256 0.481
2002 3 0.399 0.081 0.016 2.389 2.985 1.293 0.458
2002 4 0.396 0.093 0.021 2.420 2.914 1.155 0.461
2003 1 0.672 0.091 0.037 2.308 3.001 1.232 0.472
2003 2 0.466 0.089 0.060 2.494 3.114 1.360 0.517
2003 3 0.409 0.090 0.021 2.616 3.193 1.366 0.509
2003 4 0.464 0.105 0.043 2.607 3.186 1.364 0.540
2004 1 0.415 0.106 0.022 2.130 2.822 1.278 0.483
2004 2 0.379 0.082 0.024 2.240 2.882 1.395 0.475
2004 3 0.341 0.093 0.009 2.363 2.988 1.494 0.489
2004 4 0.391 0.089 0.024 2.551 3.070 1.655 0.528

31
Table 6. Health indices, the Czech Republic, women
Year Quarter TIW CRWA TRWA EAP PIW PIW2 THLI
1997 2 0.541 0.139 0.042 2.109 0.498 0.051 0.520
1998 1 0.505 0.124 0.037 1.608 1.735 0.077 0.481
1998 2 0.429 0.114 0.032 1.683 1.826 0.070 0.495
1998 3 0.334 0.106 0.018 1.622 1.788 0.057 0.484
1998 4 0.431 0.116 0.037 1.585 1.744 0.081 0.514
1999 1 0.584 0.101 0.042 1.516 1.678 0.072 0.484
1999 2 0.416 0.098 0.024 1.433 1.652 0.054 0.445
1999 3 0.291 0.104 0.015 1.507 1.650 0.057 0.473
1999 4 0.402 0.119 0.034 1.552 1.669 0.072 0.509
2000 1 0.540 0.107 0.055 0.425 1.572 0.081 0.251
2000 2 0.365 0.104 0.050 0.539 1.666 0.078 0.270
2000 3 0.341 0.110 0.019 0.619 1.715 0.089 0.277
2000 4 0.418 0.126 0.030 1.401 1.680 0.086 0.472
2001 1 0.524 0.125 0.042 1.270 1.569 0.072 0.431
2001 2 0.388 0.138 0.025 1.376 1.564 0.083 0.457
2001 3 0.370 0.158 0.020 1.305 1.525 0.081 0.455
2001 4 0.426 0.144 0.029 1.350 1.607 0.075 0.460
2002 1 0.447 0.146 0.040 1.446 1.610 0.575 0.527
2002 2 0.363 0.143 0.045 1.473 1.663 0.801 0.544
2002 3 0.373 0.143 0.022 1.528 1.693 0.850 0.544
2002 4 0.384 0.140 0.039 1.449 1.668 0.839 0.526
2003 1 0.621 0.138 0.072 1.363 1.674 0.876 0.517
2003 2 0.423 0.136 0.026 1.465 1.707 0.938 0.521
2003 3 0.364 0.145 0.021 1.489 1.738 0.944 0.550
2003 4 0.406 0.149 0.029 1.506 1.731 0.951 0.566
2004 1 0.351 0.130 0.049 1.330 1.649 0.939 0.514
2004 2 0.344 0.134 0.033 1.423 1.715 0.976 0.532
2004 3 0.291 0.115 0.014 1.380 1.709 0.963 0.508
2004 4 0.360 0.115 0.024 1.399 1.707 0.893 0.512
Table 7. Health indices, Denmark, men
Year Quarter TIW CRWA TRWA EAP PIW PIW2 THLI
1983 2 NA NA NA NA NA NA NA
1984 2 0.123 0.023 0.065 1.335 NA 0.096 0.245
1985 2 0.116 0.049 0.046 1.273 NA 0.062 0.216
1986 2 0.147 0.028 0.064 1.161 NA 0.061 0.179
1987 2 0.129 0.025 0.071 1.150 NA 0.124 0.200
1988 2 0.114 0.032 0.079 1.105 NA 0.029 0.197
1989 2 0.116 0.035 0.060 1.165 NA 0.066 0.207
1990 2 0.119 0.039 0.052 1.218 NA 0.067 0.216
1991 2 0.127 0.046 0.050 1.003 NA 0.122 0.211
1992 2 0.100 0.025 0.069 1.443 0.952 0.165 0.326
1993 2 0.129 0.019 0.072 1.094 0.879 0.159 0.291
1994 2 0.104 0.010 0.042 0.658 0.661 0.148 0.210
1995 2 0.077 0.023 0.046 0.823 1.007 0.129 0.229

32
Year Quarter TIW CRWA TRWA EAP PIW PIW2 THLI1996 2 0.116 0.034 0.036 1.005 1.140 0.263 0.296
1997 2 0.086 0.032 0.062 1.068 0.845 0.152 0.291
1998 2 0.152 0.025 0.041 0.993 0.936 0.228 0.264
1999 1 0.153 0.017 0.078 1.260 0.937 0.322 0.371
1999 2 0.101 0.047 0.061 1.188 0.958 0.235 0.331
1999 3 0.105 0.026 0.045 1.387 1.173 0.249 0.337
1999 4 0.152 0.041 0.090 1.264 1.032 0.294 0.371
2000 1 0.144 0.029 0.133 1.138 1.481 0.254 0.361
2000 2 0.131 0.067 0.044 1.250 1.584 0.433 0.360
2000 3 0.130 0.034 0.039 1.271 1.548 0.242 0.278
2000 4 0.129 0.031 0.078 1.105 1.601 0.256 0.300
2001 1 0.213 0.037 0.124 1.375 1.524 0.304 0.424
2001 2 0.189 0.047 0.051 1.508 1.664 0.269 0.367
2001 3 0.154 0.065 0.040 1.433 1.716 0.254 0.324
2001 4 0.196 0.048 0.103 1.496 1.424 0.294 0.417
2002 1 0.253 0.036 0.095 1.382 1.465 0.474 0.409
2002 2 0.236 0.054 0.045 1.537 1.609 0.303 0.376
2002 3 0.188 0.046 0.039 1.323 1.515 0.376 0.320
2002 4 0.256 0.055 0.079 1.295 1.467 0.359 0.375
2003 1 0.224 0.053 0.088 1.350 1.567 0.312 0.397
2003 2 0.165 0.057 0.044 1.514 1.478 0.305 0.386
2003 3 0.162 0.051 0.070 1.247 1.415 0.268 0.341
2003 4 0.177 0.064 0.062 1.372 1.419 0.301 0.391
2004 1 0.254 0.061 0.070 1.029 1.435 0.226 0.334
2004 2 0.187 0.050 0.078 1.168 1.652 0.272 0.334
2004 3 0.164 0.032 0.058 1.368 1.570 0.192 0.321
2004 4 0.218 0.064 0.097 1.728 1.843 0.389 0.437
Table 8. Health indices, Denmark, women
Year Quarter TIW CRWA TRWA EAP PIW PIW2 THLI
1983 2 NA NA NA NA NA NA NA
1984 2 0.160 0.026 0.083 1.102 NA 0.120 0.241
1985 2 0.182 0.028 0.057 0.942 NA 0.098 0.197
1986 2 0.232 0.042 0.076 1.002 NA 0.045 0.210
1987 2 0.186 0.044 0.081 1.312 NA 0.122 0.259
1988 2 0.157 0.040 0.095 1.219 NA 0.103 0.256
1989 2 0.175 0.052 0.102 1.250 NA 0.058 0.284
1990 2 0.191 0.054 0.095 1.196 NA 0.032 0.274
1991 2 0.174 0.036 0.055 1.105 NA 0.081 0.236
1992 2 0.142 0.032 0.087 1.709 1.165 0.180 0.470
1993 2 0.191 0.021 0.103 1.483 1.012 0.303 0.472
1994 2 0.133 0.036 0.061 0.760 0.769 0.156 0.319
1995 2 0.170 0.038 0.069 0.955 0.894 0.323 0.425
1996 2 0.173 0.029 0.058 1.240 1.005 0.357 0.493
1997 2 0.158 0.036 0.071 1.205 0.949 0.299 0.454
1998 2 0.185 0.046 0.064 1.149 0.898 0.222 0.413

33
Year Quarter TIW CRWA TRWA EAP PIW PIW2 THLI1999 1 0.162 0.041 0.085 1.325 0.959 0.272 0.463
1999 2 0.109 0.057 0.056 1.376 1.021 0.204 0.450
1999 3 0.136 0.053 0.061 1.311 0.996 0.462 0.486
1999 4 0.160 0.056 0.085 1.266 0.932 0.243 0.448
2000 1 0.206 0.096 0.170 1.094 1.336 0.300 0.485
2000 2 0.135 0.072 0.100 1.318 1.437 0.296 0.461
2000 3 0.119 0.066 0.070 1.453 1.537 0.360 0.445
2000 4 0.187 0.049 0.146 1.344 1.692 0.542 0.489
2001 1 0.204 0.053 0.152 1.258 1.526 0.311 0.481
2001 2 0.154 0.056 0.066 1.334 1.479 0.358 0.449
2001 3 0.140 0.041 0.058 1.469 1.497 0.269 0.417
2001 4 0.182 0.065 0.080 1.455 1.420 0.358 0.470
2002 1 0.239 0.057 0.111 1.542 1.428 0.403 0.489
2002 2 0.211 0.063 0.082 1.390 1.453 0.423 0.439
2002 3 0.174 0.074 0.077 1.554 1.602 0.597 0.524
2002 4 0.235 0.085 0.128 1.642 1.411 0.411 0.583
2003 1 0.207 0.075 0.140 1.299 1.525 0.358 0.498
2003 2 0.157 0.097 0.078 1.561 1.560 0.502 0.547
2003 3 0.149 0.092 0.058 1.607 1.582 0.379 0.522
2003 4 0.172 0.079 0.103 1.388 1.508 0.455 0.508
2004 1 0.241 0.109 0.124 1.262 1.652 0.340 0.512
2004 2 0.171 0.085 0.093 1.360 1.553 0.249 0.459
2004 3 0.151 0.113 0.053 1.361 1.558 0.292 0.450
2004 4 0.206 0.091 0.127 1.572 1.721 0.513 0.547
Table 9. Health indices, Estonia, men
Year Quarter TIW CRWA TRWA EAP PIW PIW2 THLI1997 2 0.106 0.026 0.030 1.274 1.788 0.021 0.275
1998 2 0.131 0.043 0.045 1.447 2.226 0.212 0.329
1999 2 0.129 0.019 0.028 1.479 2.141 0.157 0.352
2000 1 0.160 0.008 0.172 1.003 1.667 0.202 0.357
2000 2 0.094 NA 0.022 1.539 2.051 0.098 0.337
2000 3 0.050 0.010 0.038 1.477 2.138 0.062 0.325
2000 4 0.097 0.020 0.035 1.329 1.927 0.138 0.343
2001 1 0.144 0.007 0.009 1.551 2.064 0.170 0.351
2001 2 0.052 0.027 0.025 1.758 2.100 0.128 0.369
2001 3 0.033 0.008 0.026 1.624 2.034 0.143 0.338
2001 4 0.106 0.016 0.016 1.147 2.193 0.160 0.266
2002 1 0.067 0.028 NA 1.417 2.258 0.316 0.317
2002 2 0.047 0.007 0.025 1.553 2.294 0.352 0.339
2002 3 0.162 0.013 NA 1.307 2.269 0.276 0.268
2002 4 0.069 0.050 NA 1.387 2.387 0.348 0.326
2003 1 0.330 0.016 NA 1.464 2.388 0.262 0.286
2003 2 0.022 0.009 NA 1.463 2.455 0.040 0.224
2003 3 0.039 0.016 NA 1.598 2.498 0.336 0.278
2003 4 0.113 0.007 0.007 1.372 2.502 0.398 0.272

34
Year Quarter TIW CRWA TRWA EAP PIW PIW2 THLI2004 1 0.055 0.014 0.037 1.346 2.455 0.258 0.284
2004 2 0.098 0.047 0.011 1.675 2.389 0.306 0.339
2004 3 0.035 0.015 0.010 1.911 2.334 0.329 0.333
2004 4 0.071 0.011 0.019 1.607 2.321 0.359 0.287
Table 10. Health indices, Estonia, women
Year Quarter TIW CRWA TRWA EAP PIW PIW2 THLI
1997 2 0.109 0.005 0.024 1.082 1.394 0.287 0.345
1998 2 0.127 0.023 0.022 0.963 1.226 0.227 0.289
1999 2 0.116 0.021 0.059 1.015 1.364 0.105 0.304
2000 1 0.081 0.029 0.053 0.770 1.023 0.172 0.255
2000 2 0.034 0.009 0.027 0.861 1.392 0.038 0.222
2000 3 0.086 0.049 0.006 1.050 1.476 0.165 0.291
2000 4 0.020 0.094 0.022 1.237 1.380 0.183 0.396
2001 1 0.126 0.060 0.022 1.306 1.218 0.096 0.372
2001 2 0.052 0.036 0.016 1.497 1.474 0.172 0.387
2001 3 0.018 0.106 0.025 0.993 1.183 0.088 0.297
2001 4 0.091 0.089 0.052 1.045 1.356 0.088 0.328
2002 1 0.067 0.039 0.011 1.182 1.507 0.385 0.340
2002 2 0.032 0.030 0.017 1.372 1.575 0.258 0.348
2002 3 0.162 0.031 0.007 0.979 1.432 0.357 0.284
2002 4 0.055 0.024 0.049 0.861 1.321 0.276 0.261
2003 1 0.313 0.046 0.040 0.816 1.301 0.233 0.250
2003 2 0.022 0.014 0.028 0.939 1.486 0.214 0.243
2003 3 0.039 NA 0.033 0.918 1.422 0.144 0.222
2003 4 0.081 0.020 NA 0.757 1.172 0.115 0.177
2004 1 0.055 0.037 0.019 0.975 1.413 0.070 0.221
2004 2 0.053 0.040 0.006 1.171 1.653 0.202 0.265
2004 3 0.035 0.042 NA 0.785 1.306 0.106 0.179
2004 4 0.051 0.006 NA 0.685 1.157 0.228 0.160
Table 11. Health indices, Finland, men
Year Quarter TIW CRWA TRWA EAP PIW PIW2 THLI
1995 2 0.160 0.062 0.024 1.379 1.130 0.171 0.303
1996 2 0.177 0.053 0.065 1.393 0.827 0.108 0.320
1997 2 0.173 0.061 0.081 1.138 1.765 0.152 0.305
1998 1 0.231 0.055 0.153 NA 1.930 0.193 NA
1998 2 0.211 0.054 0.072 1.260 2.076 0.319 0.332
1998 3 0.160 0.043 0.066 NA 2.245 0.169 NA
1998 4 0.197 0.037 0.112 NA 2.249 0.180 NA
1999 1 0.240 0.040 0.163 NA 2.118 0.179 NA
1999 2 0.189 0.037 0.062 1.121 2.363 0.299 0.351
1999 3 0.158 0.028 0.060 1.223 2.422 0.285 0.339
1999 4 0.182 0.042 0.103 1.222 2.235 0.232 0.405
2000 1 0.222 0.045 0.184 1.114 2.270 0.229 0.450

35
Year Quarter TIW CRWA TRWA EAP PIW PIW2 THLI2000 2 0.188 0.046 0.091 1.308 2.617 0.273 0.399
2000 3 0.194 0.042 0.094 1.380 2.719 0.309 0.398
2000 4 0.232 0.040 0.101 1.240 2.484 0.279 0.403
2001 1 0.334 0.020 0.148 1.343 2.424 0.297 0.452
2001 2 0.259 0.034 0.079 1.373 2.690 0.317 0.394
2001 3 0.237 0.031 0.071 1.403 2.626 0.251 0.370
2001 4 0.315 0.036 0.093 1.271 2.407 0.342 0.411
2002 1 0.356 0.037 0.141 1.241 2.277 0.196 0.432
2002 2 0.284 0.027 0.079 1.354 2.527 0.380 0.414
2002 3 0.244 0.017 0.085 1.341 2.624 0.309 0.371
2002 4 0.308 0.014 0.124 1.238 2.448 0.310 0.411
2003 1 0.244 0.028 0.113 1.237 2.203 0.251 0.359
2003 2 0.234 0.019 0.056 1.341 2.296 0.271 0.307
2003 3 0.216 0.013 0.066 1.370 2.415 0.268 0.300
2003 4 0.258 0.025 0.098 1.322 2.295 0.311 0.356
2004 1 0.286 0.020 0.086 1.262 2.191 0.251 0.334
2004 2 0.248 0.021 0.050 1.346 2.422 0.283 0.306
2004 3 0.192 0.027 0.080 1.309 2.465 0.307 0.309
2004 4 0.227 0.016 0.093 1.320 2.495 0.320 0.342
Table 12. Health indices, Finland, women
Year Quarter TIW CRWA TRWA EAP PIW PIW2 THLI
1995 2 0.223 0.122 0.046 1.213 0.954 0.192 0.362
1996 2 0.217 0.073 0.107 1.076 0.632 0.153 0.342
1997 2 0.217 0.061 0.103 0.748 1.275 0.147 0.265
1998 1 0.201 0.078 0.167 NA 1.535 0.162 NA
1998 2 0.189 0.099 0.047 0.731 1.326 0.135 0.243
1998 3 0.203 0.087 0.083 NA 1.617 0.158 NA
1998 4 0.249 0.101 0.136 NA 1.609 0.152 NA
1999 1 0.296 0.075 0.231 NA 1.681 0.250 NA
1999 2 0.233 0.054 0.089 0.929 1.655 0.227 0.366
1999 3 0.188 0.071 0.100 0.954 1.731 0.226 0.384
1999 4 0.281 0.045 0.133 0.966 1.778 0.230 0.404
2000 1 0.271 0.059 0.212 0.972 1.775 0.262 0.474
2000 2 0.259 0.051 0.113 1.042 1.838 0.250 0.407
2000 3 0.203 0.075 0.095 1.000 1.835 0.283 0.400
2000 4 0.269 0.048 0.146 0.956 1.770 0.247 0.414
2001 1 0.276 0.055 0.217 0.910 1.752 0.233 0.450
2001 2 0.206 0.047 0.103 0.923 1.815 0.209 0.351
2001 3 0.197 0.038 0.092 0.982 1.898 0.205 0.352
2001 4 0.284 0.044 0.135 1.067 1.897 0.260 0.426
2002 1 0.277 0.033 0.193 1.072 1.900 0.201 0.448
2002 2 0.243 0.033 0.122 1.100 2.016 0.371 0.423
2002 3 0.229 0.053 0.107 1.051 2.001 0.306 0.395
2002 4 0.279 0.041 0.162 1.050 1.843 0.289 0.441
2003 1 0.216 0.035 0.143 1.078 1.747 0.230 0.369

36
Year Quarter TIW CRWA TRWA EAP PIW PIW2 THLI2003 2 0.201 0.039 0.066 1.048 1.815 0.274 0.308
2003 3 0.193 0.035 0.075 1.089 1.778 0.373 0.332
2003 4 0.242 0.030 0.128 1.033 1.721 0.314 0.357
2004 1 0.246 0.028 0.132 1.006 1.640 0.240 0.344
2004 2 0.226 0.031 0.082 0.961 1.713 0.199 0.289
2004 3 0.173 0.036 0.102 0.922 1.778 0.255 0.301
2004 4 0.201 0.038 0.111 1.001 1.619 0.220 0.329
Table 13. Health indices, France, men
Year Quarter TIW CRWA TRWA EAP PIW PIW2 THLI
1983 1 NA NA NA NA NA NA NA
1984 1 0.205 NA 0.049 0.885 NA 0.042 0.133
1985 1 0.203 NA 0.034 0.794 NA 0.030 0.110
1986 1 0.217 NA 0.052 0.800 NA 0.046 0.122
1987 1 0.170 NA 0.028 0.820 NA 0.074 0.109
1988 1 0.171 NA 0.045 0.822 NA 0.034 0.114
1989 1 0.171 NA 0.026 0.753 NA 0.046 0.093
1990 1 0.168 NA 0.041 0.619 NA 0.056 0.087
1991 1 0.211 NA 0.035 0.614 NA 0.033 0.079
1992 1 0.208 NA 0.030 0.964 0.118 0.053 0.169
1993 1 0.215 NA 0.038 0.894 0.125 0.041 0.169
1994 1 0.198 NA 0.029 0.785 0.116 0.057 0.152
1995 1 0.211 NA 0.043 0.825 0.185 0.041 0.160
1996 1 0.219 NA 0.037 0.804 0.172 0.076 0.158
1997 1 0.225 NA 0.041 0.843 0.162 0.035 0.165
1998 1 0.240 NA 0.054 0.775 0.176 0.054 0.164
1999 1 0.245 NA 0.044 0.825 0.191 0.068 0.166
2000 1 0.230 0.052 0.027 0.916 0.194 0.102 0.197
2001 1 0.315 0.048 0.037 1.102 0.219 0.120 0.223
2002 1 0.327 0.053 0.031 1.020 0.246 0.087 0.206
2003 1 0.369 0.056 0.069 0.896 0.099 0.173 0.242
2003 2 0.375 0.049 0.031 0.961 0.071 0.195 0.221
2003 3 0.291 0.045 0.026 0.937 0.094 0.189 0.213
2003 4 0.347 0.040 0.069 0.868 0.090 0.202 0.236
2004 1 0.351 0.034 0.056 0.860 0.087 0.155 0.219
2004 2 0.336 0.041 0.042 0.855 0.076 0.143 0.208
2004 3 0.257 0.049 0.026 0.819 0.077 0.175 0.207
2004 4 0.335 0.044 0.044 0.759 0.062 0.147 0.205
Table 14. Health indices, France, women
Year Quarter TIW CRWA TRWA EAP PIW PIW2 THLI
1983 1 NA NA NA NA NA NA NA
1984 1 0.218 NA 0.041 0.987 NA 0.088 0.128
1985 1 0.240 NA 0.047 0.932 NA 0.052 0.116
1986 1 0.221 NA 0.050 0.985 NA 0.072 0.122
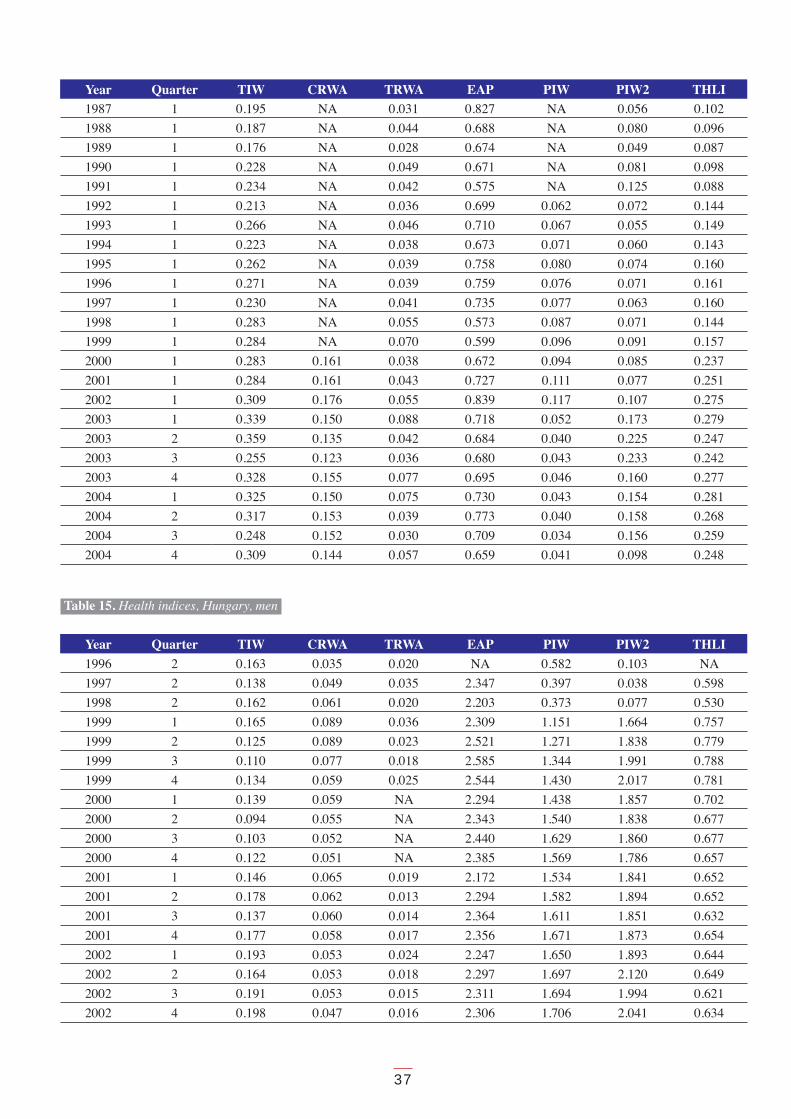
37
Year Quarter TIW CRWA TRWA EAP PIW PIW2 THLI1987 1 0.195 NA 0.031 0.827 NA 0.056 0.102
1988 1 0.187 NA 0.044 0.688 NA 0.080 0.096
1989 1 0.176 NA 0.028 0.674 NA 0.049 0.087
1990 1 0.228 NA 0.049 0.671 NA 0.081 0.098
1991 1 0.234 NA 0.042 0.575 NA 0.125 0.088
1992 1 0.213 NA 0.036 0.699 0.062 0.072 0.144
1993 1 0.266 NA 0.046 0.710 0.067 0.055 0.149
1994 1 0.223 NA 0.038 0.673 0.071 0.060 0.143
1995 1 0.262 NA 0.039 0.758 0.080 0.074 0.160
1996 1 0.271 NA 0.039 0.759 0.076 0.071 0.161
1997 1 0.230 NA 0.041 0.735 0.077 0.063 0.160
1998 1 0.283 NA 0.055 0.573 0.087 0.071 0.144
1999 1 0.284 NA 0.070 0.599 0.096 0.091 0.157
2000 1 0.283 0.161 0.038 0.672 0.094 0.085 0.237
2001 1 0.284 0.161 0.043 0.727 0.111 0.077 0.251
2002 1 0.309 0.176 0.055 0.839 0.117 0.107 0.275
2003 1 0.339 0.150 0.088 0.718 0.052 0.173 0.279
2003 2 0.359 0.135 0.042 0.684 0.040 0.225 0.247
2003 3 0.255 0.123 0.036 0.680 0.043 0.233 0.242
2003 4 0.328 0.155 0.077 0.695 0.046 0.160 0.277
2004 1 0.325 0.150 0.075 0.730 0.043 0.154 0.281
2004 2 0.317 0.153 0.039 0.773 0.040 0.158 0.268
2004 3 0.248 0.152 0.030 0.709 0.034 0.156 0.259
2004 4 0.309 0.144 0.057 0.659 0.041 0.098 0.248
Table 15. Health indices, Hungary, men
Year Quarter TIW CRWA TRWA EAP PIW PIW2 THLI
1996 2 0.163 0.035 0.020 NA 0.582 0.103 NA
1997 2 0.138 0.049 0.035 2.347 0.397 0.038 0.598
1998 2 0.162 0.061 0.020 2.203 0.373 0.077 0.530
1999 1 0.165 0.089 0.036 2.309 1.151 1.664 0.757
1999 2 0.125 0.089 0.023 2.521 1.271 1.838 0.779
1999 3 0.110 0.077 0.018 2.585 1.344 1.991 0.788
1999 4 0.134 0.059 0.025 2.544 1.430 2.017 0.781
2000 1 0.139 0.059 NA 2.294 1.438 1.857 0.702
2000 2 0.094 0.055 NA 2.343 1.540 1.838 0.677
2000 3 0.103 0.052 NA 2.440 1.629 1.860 0.677
2000 4 0.122 0.051 NA 2.385 1.569 1.786 0.657
2001 1 0.146 0.065 0.019 2.172 1.534 1.841 0.652
2001 2 0.178 0.062 0.013 2.294 1.582 1.894 0.652
2001 3 0.137 0.060 0.014 2.364 1.611 1.851 0.632
2001 4 0.177 0.058 0.017 2.356 1.671 1.873 0.654
2002 1 0.193 0.053 0.024 2.247 1.650 1.893 0.644
2002 2 0.164 0.053 0.018 2.297 1.697 2.120 0.649
2002 3 0.191 0.053 0.015 2.311 1.694 1.994 0.621
2002 4 0.198 0.047 0.016 2.306 1.706 2.041 0.634

38
Year Quarter TIW CRWA TRWA EAP PIW PIW2 THLI2003 1 0.248 0.085 0.035 1.974 1.515 1.259 0.594
2003 2 0.161 0.081 0.020 2.034 1.652 1.485 0.578
2003 3 0.189 0.079 0.020 2.088 1.723 1.668 0.590
2003 4 0.178 0.080 0.020 2.082 1.754 1.583 0.588
2004 1 0.215 0.083 0.042 1.986 1.784 1.573 0.586
2004 2 0.173 0.090 0.012 2.139 1.901 1.582 0.561
2004 3 0.140 0.087 0.019 2.234 1.912 1.511 0.569
2004 4 0.157 0.087 0.015 2.068 1.936 1.367 0.532
Table 16. Health indices, Hungary, women
Year Quarter TIW CRWA TRWA EAP PIW PIW2 THLI
1996 2 0.268 0.068 0.060 NA 0.364 0.093 NA
1997 2 0.190 0.120 0.061 1.755 0.263 0.074 0.626
1998 2 0.198 0.087 0.057 1.627 0.234 0.071 0.509
1999 1 0.253 0.069 0.047 1.850 0.872 1.644 0.685
1999 2 0.188 0.075 0.034 1.876 0.901 1.716 0.701
1999 3 0.161 0.090 0.019 1.946 0.962 1.741 0.719
1999 4 0.182 0.108 0.024 1.890 1.054 1.848 0.743
2000 1 0.181 0.090 NA 1.816 1.106 1.812 0.648
2000 2 0.149 0.096 NA 1.851 1.124 1.845 0.655
2000 3 0.126 0.101 NA 1.845 1.154 1.773 0.641
2000 4 0.155 0.110 NA 1.855 1.162 1.882 0.650
2001 1 0.137 0.086 0.042 1.748 1.163 1.723 0.590
2001 2 0.165 0.086 0.040 1.739 1.172 1.861 0.602
2001 3 0.129 0.093 0.018 1.746 1.145 1.900 0.594
2001 4 0.173 0.111 0.013 1.778 1.166 1.846 0.612
2002 1 0.182 0.097 0.025 1.739 1.180 1.870 0.586
2002 2 0.164 0.106 0.018 1.786 1.172 1.922 0.610
2002 3 0.176 0.117 0.009 1.811 1.183 1.965 0.634
2002 4 0.185 0.114 0.014 1.867 1.208 1.889 0.651
2003 1 0.231 0.134 0.039 1.662 1.245 1.439 0.586
2003 2 0.154 0.103 0.023 1.673 1.314 1.465 0.557
2003 3 0.182 0.106 0.011 1.707 1.359 1.620 0.578
2003 4 0.163 0.121 0.021 1.637 1.376 1.525 0.570
2004 1 0.204 0.119 0.036 1.837 1.421 1.592 0.538
2004 2 0.167 0.100 0.015 1.765 1.431 1.577 0.501
2004 3 0.137 0.100 0.013 1.743 1.420 1.484 0.494
2004 4 0.146 0.097 0.032 1.743 1.436 1.357 0.493
Table 17. Health indices, Ireland, men
Year Quarter TIW CRWA TRWA EAP PIW PIW2 THLI
1983 2 NA NA NA NA NA NA NA
1984 2 0.231 0.013 0.058 1.535 NA 0.125 0.223
1985 2 0.210 0.011 0.043 1.314 NA 0.121 0.189
1986 2 0.201 0.013 0.046 1.444 NA 0.125 0.200

39
Year Quarter TIW CRWA TRWA EAP PIW PIW2 THLI1987 2 0.188 0.020 0.042 1.582 NA 0.094 0.207
1988 2 0.176 0.021 0.047 1.441 NA 0.067 0.184
1989 2 0.192 0.013 0.042 1.480 NA 0.138 0.180
1990 2 0.159 0.018 0.040 1.660 NA 0.096 0.169
1991 2 0.170 0.019 0.033 1.476 NA 0.081 0.160
1992 2 0.163 0.018 0.034 1.988 0.487 0.061 0.336
1993 2 0.169 0.017 0.031 1.494 0.383 0.060 0.260
1994 2 0.155 0.026 0.030 2.007 0.437 0.060 0.291
1995 2 0.127 0.030 0.028 2.105 0.478 0.049 0.297
1996 2 0.115 0.015 0.035 1.376 0.329 0.053 0.198
1997 2 0.120 0.020 0.022 1.514 0.402 0.052 0.204
1998 2 0.101 0.026 0.017 1.533 0.427 NA 0.167
1999 2 0.126 0.030 0.015 1.692 0.499 NA 0.121
1999 3 0.110 0.029 0.012 1.815 0.609 NA 0.121
1999 4 0.106 0.034 0.017 1.860 0.591 NA 0.129
2000 1 0.156 0.035 0.026 1.964 0.648 NA 0.136
2000 2 0.102 0.037 0.014 2.083 0.615 NA 0.132
2000 3 0.092 0.029 0.009 2.106 0.733 NA 0.122
2000 4 0.101 0.037 0.019 1.418 0.730 NA 0.131
2001 1 0.170 0.035 0.018 2.131 0.635 NA 0.126
2001 2 0.186 0.032 0.021 1.919 0.697 NA 0.122
2001 3 0.167 0.032 0.009 2.059 0.734 NA 0.131
2001 4 0.149 0.034 0.010 1.956 0.771 NA 0.135
2002 1 0.152 0.036 0.013 2.079 0.644 NA 0.141
2002 2 0.161 0.032 0.013 1.937 0.622 NA 0.125
2002 3 0.132 0.029 0.008 2.029 0.594 NA 0.128
2002 4 0.153 0.027 0.011 1.871 0.612 NA 0.128
2003 1 0.243 0.033 0.016 2.384 0.783 0.044 0.164
2003 2 0.192 0.031 0.020 2.504 0.845 0.038 0.168
2003 3 0.185 0.034 0.012 2.328 0.657 0.023 0.157
2003 4 0.221 0.037 0.023 2.248 0.591 0.015 0.167
2004 1 0.193 0.034 0.021 1.908 0.580 0.033 0.144
2004 2 0.170 0.029 0.023 1.921 0.583 0.016 0.142
2004 3 0.135 0.023 0.013 2.059 0.556 0.038 0.140
2004 4 0.175 0.026 0.012 2.060 0.612 0.029 0.135
Table 18. Health indices, Ireland, women
Year Quarter TIW CRWA TRWA EAP PIW PIW2 THLI
1983 2 NA NA NA NA NA NA NA
1984 2 0.224 0.025 0.051 1.778 NA 0.116 0.160
1985 2 0.212 0.027 0.047 1.489 NA 0.114 0.136
1986 2 0.181 0.037 0.052 1.593 NA 0.143 0.149
1987 2 0.185 0.026 0.041 1.389 NA 0.177 0.131
1988 2 0.219 0.033 0.041 1.631 NA 0.062 0.134
1989 2 0.225 0.031 0.040 1.317 NA 0.100 0.115
1990 2 0.168 0.025 0.038 1.472 NA 0.100 0.118

40
Year Quarter TIW CRWA TRWA EAP PIW PIW2 THLI1991 2 0.208 0.032 0.045 1.514 NA 0.031 0.123
1992 2 0.168 0.025 0.039 1.414 0.088 0.053 0.224
1993 2 0.219 0.021 0.034 1.227 0.091 0.036 0.201
1994 2 0.165 0.031 0.044 1.425 0.116 0.025 0.208
1995 2 0.206 0.029 0.028 1.497 0.104 0.047 0.219
1996 2 0.148 0.023 0.031 1.128 0.071 0.044 0.162
1997 2 0.178 0.019 0.026 1.050 0.117 0.060 0.161
1998 2 0.197 0.029 0.020 1.237 0.128 NA 0.164
1999 2 0.166 0.024 0.017 1.298 0.131 NA 0.084
1999 3 0.139 0.021 0.011 1.337 0.140 NA 0.085
1999 4 0.154 0.027 0.014 1.216 0.147 NA 0.087
2000 1 0.209 0.030 0.038 1.305 0.149 NA 0.100
2000 2 0.177 0.029 0.017 1.398 0.153 NA 0.091
2000 3 0.142 0.029 0.015 1.321 0.145 NA 0.089
2000 4 0.161 0.030 0.019 1.179 0.184 NA 0.097
2001 1 0.155 0.026 0.018 1.522 0.163 NA 0.088
2001 2 0.169 0.031 0.021 1.380 0.154 NA 0.094
2001 3 0.147 0.031 0.010 1.402 0.160 NA 0.099
2001 4 0.126 0.028 0.019 1.390 0.159 NA 0.102
2002 1 0.136 0.017 0.025 1.272 0.137 NA 0.079
2002 2 0.140 0.018 0.021 1.392 0.160 NA 0.085
2002 3 0.112 0.014 0.015 1.402 0.145 NA 0.089
2002 4 0.136 0.016 0.012 1.335 0.154 NA 0.089
2003 1 0.214 0.031 0.016 1.465 0.177 0.030 0.102
2003 2 0.170 0.035 0.024 1.664 0.170 0.003 0.115
2003 3 0.171 0.038 0.010 1.741 0.143 0.059 0.129
2003 4 0.196 0.045 0.029 1.827 0.128 0.059 0.151
2004 1 0.176 0.034 0.028 1.387 0.140 0.033 0.116
2004 2 0.151 0.017 0.020 1.421 0.136 0.039 0.103
2004 3 0.126 0.024 0.010 1.595 0.147 0.016 0.111
2004 4 0.149 0.025 0.018 1.497 0.160 0.014 0.117
Table 19. Health indices, Italy, men
Year Quarter TIW CRWA TRWA EAP PIW PIW2 THLI
1983 2 NA NA NA NA NA NA NA
1984 2 0.182 0.046 0.116 1.682 NA 0.008 0.208
1985 2 0.160 0.034 0.088 1.522 NA 0.011 0.167
1986 2 0.155 0.035 0.071 1.337 NA 0.012 0.148
1987 2 0.162 0.040 0.072 1.154 NA 0.010 0.143
1988 2 0.167 0.040 0.070 1.321 NA 0.006 0.147
1989 2 0.146 0.040 0.057 1.139 NA 0.011 0.131
1990 2 0.170 0.032 0.066 1.301 NA 0.008 0.133
1991 2 0.161 0.035 0.074 1.382 NA 0.003 0.144
1992 3 0.118 0.024 0.048 1.260 1.816 0.035 0.210
1993 2 0.096 0.024 0.074 1.057 1.600 0.035 0.208
1994 2 0.104 0.023 0.049 0.828 1.402 0.043 0.172

41
Year Quarter TIW CRWA TRWA EAP PIW PIW2 THLI
1995 2 0.106 0.020 0.051 0.792 1.356 0.031 0.169
1996 2 0.117 0.022 0.047 0.700 1.279 0.036 0.155
1997 2 0.111 0.016 0.057 0.627 1.198 0.025 0.147
1998 1 0.101 0.020 0.080 0.604 1.068 0.018 0.160
1998 2 0.103 0.019 0.038 0.658 1.134 0.023 0.141
1998 3 0.088 0.019 0.028 0.676 1.223 0.016 0.132
1998 4 0.098 0.024 0.048 0.673 1.167 0.028 0.152
1999 1 0.141 0.019 0.090 0.518 0.996 0.031 0.154
1999 2 0.092 0.023 0.041 0.597 1.032 0.023 0.134
1999 3 0.085 0.023 0.028 0.702 1.111 0.028 0.138
1999 4 0.096 0.019 0.041 0.681 1.137 0.037 0.143
2000 1 0.168 0.017 0.107 0.544 0.965 0.027 0.164
2000 2 0.085 0.012 0.043 0.588 1.026 0.028 0.123
2000 3 0.067 0.017 0.019 0.594 1.102 0.012 0.104
2000 4 0.075 0.018 0.038 0.651 1.136 0.012 0.127
2001 1 0.109 0.014 0.055 0.576 1.098 0.022 0.127
2001 2 0.108 0.012 0.044 0.616 1.063 0.023 0.123
2001 3 0.081 0.011 0.026 0.633 1.126 0.038 0.111
2001 4 0.076 0.013 0.031 0.614 1.171 0.022 0.113
2002 1 0.107 0.019 0.043 0.561 1.032 0.022 0.118
2002 2 0.117 0.017 0.034 0.570 1.079 0.015 0.111
2002 3 0.078 0.020 0.024 0.563 1.107 0.013 0.104
2002 4 0.076 0.014 0.044 0.637 1.118 0.015 0.123
2003 1 0.117 0.014 0.031 0.578 1.117 0.021 0.108
2003 2 0.111 0.013 0.049 0.599 1.105 0.019 0.120
2003 3 0.077 0.015 0.022 0.597 1.150 0.016 0.095
2003 4 0.081 0.014 0.041 0.603 1.180 0.027 0.114
2004 1 0.219 0.032 0.074 0.704 1.483 0.252 0.209
2004 2 0.165 0.036 0.061 0.802 1.609 0.339 0.219
2004 3 0.142 0.034 0.030 0.915 1.708 0.300 0.203
2004 4 0.182 0.044 0.051 0.867 1.565 0.287 0.226
Table 20. Health indices, Italy, women
Year Quarter TIW CRWA TRWA EAP PIW PIW2 THLI
1983 2 NA NA NA NA NA NA NA
1984 2 0.187 0.082 0.131 2.198 NA 0.001 0.203
1985 2 0.154 0.068 0.100 2.107 NA NA 0.172
1986 2 0.163 0.069 0.088 1.876 NA 0.018 0.155
1987 2 0.167 0.060 0.073 1.745 NA 0.003 0.144
1988 2 0.163 0.057 0.084 1.787 NA 0.006 0.151
1989 2 0.155 0.054 0.066 1.605 NA NA 0.133
1990 2 0.183 0.059 0.073 1.791 NA 0.004 0.139
1991 2 0.183 0.064 0.078 1.705 NA 0.011 0.141
1992 3 0.117 0.028 0.052 0.688 0.492 0.011 0.124
1993 2 0.110 0.030 0.086 0.550 0.433 0.016 0.116
1994 2 0.125 0.018 0.054 0.511 0.467 0.010 0.097

42
Year Quarter TIW CRWA TRWA EAP PIW PIW2 THLI1995 2 0.133 0.023 0.077 0.492 0.494 0.020 0.109
1996 2 0.127 0.028 0.040 0.480 0.469 0.031 0.098
1997 2 0.142 0.033 0.073 0.410 0.440 0.019 0.100
1998 1 0.134 0.019 0.068 0.401 0.434 0.008 0.087
1998 2 0.106 0.022 0.068 0.381 0.418 0.012 0.088
1998 3 0.090 0.026 0.022 0.415 0.416 0.011 0.074
1998 4 0.092 0.024 0.047 0.453 0.440 0.010 0.091
1999 1 0.151 0.022 0.097 0.373 0.393 0.009 0.097
1999 2 0.093 0.022 0.051 0.349 0.367 0.013 0.079
1999 3 0.070 0.019 0.024 0.385 0.367 0.010 0.069
1999 4 0.089 0.023 0.048 0.399 0.378 0.010 0.082
2000 1 0.163 0.019 0.131 0.368 0.364 0.014 0.108
2000 2 0.081 0.016 0.037 0.388 0.365 0.023 0.075
2000 3 0.074 0.015 0.026 0.382 0.371 0.008 0.064
2000 4 0.079 0.032 0.045 0.366 0.361 0.017 0.078
2001 1 0.100 0.031 0.043 0.345 0.347 0.014 0.073
2001 2 0.094 0.022 0.037 0.350 0.353 0.016 0.069
2001 3 0.073 0.022 0.016 0.396 0.376 0.013 0.063
2001 4 0.068 0.021 0.026 0.368 0.380 0.019 0.065
2002 1 0.096 0.025 0.042 0.342 0.343 0.014 0.069
2002 2 0.105 0.023 0.026 0.394 0.345 0.010 0.067
2002 3 0.068 0.027 0.017 0.423 0.360 0.012 0.069
2002 4 0.062 0.031 0.041 0.416 0.365 0.018 0.081
2003 1 0.103 0.027 0.037 0.372 0.356 0.008 0.070
2003 2 0.103 0.019 0.046 0.367 0.332 0.010 0.070
2003 3 0.067 0.024 0.022 0.447 0.388 0.014 0.069
2003 4 0.072 0.017 0.044 0.458 0.379 0.012 0.079
2004 1 0.186 0.080 0.070 0.730 0.678 0.340 0.241
2004 2 0.142 0.087 0.045 0.720 0.653 0.351 0.228
2004 3 0.118 0.112 0.035 0.812 0.636 0.319 0.244
2004 4 0.158 0.098 0.067 0.785 0.616 0.289 0.242
Table 21. Health indices, Latvia, men
Year Quarter TIW CRWA TRWA EAP PIW PIW2 THLI
1998 2 0.038 0.195 0.013 NA NA 0.025 0.145
1998 4 0.062 0.164 0.019 NA NA 0.010 0.122
1999 2 0.050 0.147 0.017 NA NA 0.008 0.106
1999 4 0.074 0.188 0.022 NA NA 0.031 0.143
2000 2 0.048 0.143 0.018 NA NA 0.012 0.103
2000 4 0.030 0.161 0.015 NA NA 0.017 0.112
2001 2 0.080 0.141 0.021 0.290 0.323 0.117 0.173
2001 4 0.034 0.155 0.008 0.361 0.456 0.018 0.167
2002 1 0.141 0.042 0.046 1.215 1.740 0.357 0.335
2002 2 0.050 0.038 0.027 0.712 1.234 0.364 0.235
2002 3 0.083 0.044 0.015 1.176 1.848 0.355 0.272
2002 4 0.065 0.061 0.043 0.973 1.377 0.507 0.322

43
Year Quarter TIW CRWA TRWA EAP PIW PIW2 THLI2003 1 0.182 0.045 0.036 1.082 1.807 0.431 0.308
2003 2 0.105 0.040 0.012 1.204 1.869 0.694 0.335
2003 3 0.061 0.048 0.019 1.281 1.879 0.520 0.343
2003 4 0.047 0.061 0.046 1.496 1.962 0.596 0.370
2004 1 0.124 0.063 0.020 1.194 1.715 0.440 0.334
2004 2 0.061 0.057 0.018 1.657 2.053 0.681 0.364
2004 3 0.004 0.042 NA 1.561 1.824 0.186 0.376
2004 4 0.044 0.034 NA 1.688 1.896 0.506 0.331
Table 22. Health indices, Latvia, women
Year Quarter TIW CRWA TRWA EAP PIW PIW2 THLI
1998 2 0.035 0.278 0.012 NA NA 0.014 0.168
1998 4 0.064 0.284 0.044 NA NA 0.025 0.190
1999 2 0.032 0.205 0.023 NA NA 0.019 0.132
1999 4 0.044 0.216 0.012 NA NA 0.007 0.125
2000 2 0.046 0.239 0.018 NA NA 0.008 0.140
2000 4 0.029 0.225 0.012 NA NA 0.016 0.135
2001 2 0.080 0.252 0.040 0.307 0.315 0.132 0.241
2001 4 0.034 0.183 0.018 0.318 0.349 0.032 0.179
2002 1 0.123 0.263 0.101 0.925 1.198 0.287 0.454
2002 2 0.050 0.023 0.076 0.718 1.022 0.244 0.250
2002 3 0.083 0.126 NA 0.691 1.075 0.363 0.291
2002 4 0.034 0.011 0.028 0.959 1.071 0.373 0.284
2003 1 0.166 0.063 0.020 0.988 1.190 0.416 0.329
2003 2 0.069 0.028 NA 0.890 1.064 0.408 0.280
2003 3 0.061 0.077 NA 0.848 0.842 0.234 0.238
2003 4 0.030 0.067 0.035 0.725 1.116 0.404 0.288
2004 1 0.110 0.023 0.014 0.799 0.900 0.330 0.230
2004 2 0.044 0.038 0.033 0.635 1.251 0.562 0.291
2004 3 0.004 0.074 0.006 0.761 0.788 0.094 0.236
2004 4 0.044 0.132 0.015 0.830 1.245 0.496 0.336
Table 23. Health indices, Lithuania, men
Year Quarter TIW CRWA TRWA EAP PIW PIW2 THLI
1998 2 0.062 0.014 NA 0.111 0.017 0.027 0.027
1998 4 0.139 0.055 NA 0.104 0.078 0.072 0.069
1999 2 0.111 NA 0.004 NA 0.043 NA NA
1999 4 0.152 NA 0.010 0.163 NA 0.005 0.023
2000 2 0.095 0.005 0.005 0.980 1.726 0.014 0.193
2000 4 0.045 0.033 0.025 1.136 1.738 0.245 0.301
2001 2 0.165 0.037 0.010 1.163 1.811 0.213 0.289
2001 4 0.070 0.017 0.004 1.277 1.895 0.218 0.310
2002 1 0.081 0.058 0.003 1.295 1.900 0.277 0.327
2002 2 0.042 0.054 0.008 1.377 2.082 0.352 0.306
2002 3 0.048 0.060 NA 1.619 2.173 0.285 0.321

44
Year Quarter TIW CRWA TRWA EAP PIW PIW2 THLI2002 4 0.023 0.014 0.011 1.500 2.156 0.153 0.275
2003 1 0.088 0.068 NA 1.206 2.159 0.178 0.266
2003 2 0.049 0.051 0.003 1.921 2.248 0.149 0.307
2003 3 0.039 0.018 0.003 1.707 2.361 0.194 0.265
2003 4 0.033 0.016 NA 1.560 2.371 0.063 0.227
2004 1 0.027 0.036 0.010 1.399 2.288 0.235 0.238
2004 2 0.046 0.050 0.003 1.485 2.263 0.224 0.232
2004 3 0.027 0.031 NA 1.840 2.508 0.065 0.228
2004 4 0.033 0.035 NA 1.650 2.332 0.071 0.214
Table 24. Health indices, Lithuania, women
Year Quarter TIW CRWA TRWA EAP PIW PIW2 THLI
1998 2 0.078 0.043 NA NA 0.142 0.011 NA
1998 4 0.155 0.064 NA NA 0.034 0.005 NA
1999 2 0.086 NA 0.004 NA 0.047 0.014 NA
1999 4 0.114 NA 0.003 NA 0.032 0.024 NA
2000 2 0.113 0.016 NA 0.654 1.258 NA 0.129
2000 4 0.097 0.123 0.034 0.862 1.362 0.412 0.318
2001 2 0.139 0.071 0.007 0.875 1.308 0.377 0.266
2001 4 0.070 0.063 0.010 1.040 1.545 0.202 0.267
2002 1 0.081 0.107 0.016 0.690 1.402 0.248 0.232
2002 2 0.042 0.013 0.006 0.959 1.609 0.244 0.207
2002 3 0.039 0.036 0.021 0.830 1.573 0.326 0.224
2002 4 0.023 0.029 0.004 0.697 1.356 0.191 0.172
2003 1 0.088 0.031 0.007 0.897 1.608 0.044 0.168
2003 2 0.049 0.035 0.004 0.905 1.573 0.040 0.161
2003 3 0.039 0.032 NA 0.802 1.502 0.198 0.172
2003 4 0.033 0.038 0.020 0.795 1.419 0.075 0.166
2004 1 0.027 0.028 0.020 0.946 1.285 0.137 0.181
2004 2 0.046 0.027 NA 1.026 1.468 0.028 0.157
2004 3 0.027 0.056 NA 0.851 1.564 0.060 0.156
2004 4 0.025 0.030 0.007 0.900 1.286 0.056 0.158
Table 25. Health indices, Luxembourg, men
Year Quarter TIW CRWA TRWA EAP PIW PIW2 THLI
1983 2 NA NA NA NA NA NA NA
1984 2 0.150 0.023 0.036 1.809 NA NA NA
1985 2 0.128 0.014 0.031 1.882 NA NA NA
1986 2 0.125 0.003 0.021 1.381 NA NA NA
1987 2 0.139 0.025 0.042 1.821 NA 0.122 0.140
1988 2 0.119 0.002 0.023 1.598 NA NA NA
1989 2 0.090 0.010 0.034 1.813 NA 0.042 0.120
1990 2 0.092 0.008 0.029 1.820 NA 0.048 0.115
1991 2 0.097 0.002 0.031 2.259 NA NA 0.148
1992 2 0.141 0.019 0.026 NA 1.824 0.481 0.051

45
Year Quarter TIW CRWA TRWA EAP PIW PIW2 THLI1993 2 0.155 0.009 0.035 2.095 1.887 0.147 0.270
1994 2 0.141 0.006 0.018 1.488 1.547 0.072 0.192
1995 2 0.108 0.002 0.036 2.594 2.295 0.588 0.348
1996 2 0.118 0.004 0.011 2.299 2.103 NA NA
1997 2 0.091 NA 0.016 2.405 2.119 0.451 0.327
1998 2 0.089 0.024 0.019 2.782 2.406 0.346 0.343
1999 2 0.092 0.006 0.018 2.122 1.885 NA NA
2000 2 0.057 0.006 0.033 1.766 1.592 NA NA
2001 2 0.120 0.006 0.016 1.803 1.610 0.037 0.221
2002 2 0.109 0.005 0.008 1.865 1.561 NA NA
2003 1 0.136 0.002 0.009 1.981 2.168 0.606 0.242
2003 2 0.136 0.002 0.009 1.981 2.168 0.606 0.242
2004 1 0.201 0.015 0.002 2.051 2.305 NA NA
2004 2 0.201 0.015 0.002 2.051 2.305 NA NA
2004 3 0.201 0.015 0.002 2.051 2.305 NA NA
2004 4 0.201 0.015 0.002 2.051 2.305 NA NA
Table 26. Health indices, Luxembourg, women
Year Quarter TIW CRWA TRWA EAP PIW PIW2 THLI
1983 2 NA NA NA NA NA NA NA
1984 2 0.104 0.007 0.027 0.825 NA NA NA
1985 2 0.067 0.014 0.038 0.876 NA 0.037 0.060
1986 2 0.119 0.007 0.019 1.009 NA NA NA
1987 2 0.069 0.013 0.031 0.704 NA NA NA
1988 2 0.041 0.008 0.015 0.675 NA 0.061 0.040
1989 2 0.094 0.021 0.011 1.021 NA NA NA
1990 2 0.105 0.018 0.011 1.016 NA NA NA
1991 2 0.120 0.028 0.009 0.810 NA NA NA
1992 2 0.112 0.004 0.022 NA 0.190 0.188 0.022
1993 2 0.206 0.004 0.030 1.203 0.246 0.017 0.174
1994 2 0.108 0.029 0.040 1.018 0.254 0.251 0.176
1995 2 0.121 0.013 0.009 1.342 0.272 NA 0.177
1996 2 0.085 0.007 0.004 1.086 0.228 NA NA
1997 2 0.135 NA 0.019 1.044 0.254 0.800 0.180
1998 2 0.069 0.008 0.035 1.251 0.319 NA NA
1999 2 0.098 0.031 0.016 0.894 0.187 0.191 0.128
2000 2 0.086 0.018 0.024 0.841 0.233 0.171 0.106
2001 2 0.102 0.013 0.018 0.716 0.225 0.107 0.115
2002 2 0.057 0.019 0.007 1.142 0.253 0.922 0.178
2003 1 0.123 0.031 0.017 1.284 0.431 NA NA
2003 2 0.123 0.031 0.017 1.284 0.431 NA NA
2004 1 0.187 0.048 0.008 1.234 0.440 0.999 0.236
2004 2 0.187 0.048 0.008 1.234 0.440 0.999 0.236
2004 3 0.187 0.048 0.008 1.234 0.440 0.999 0.236
2004 4 0.187 0.048 0.008 1.234 0.440 0.999 0.236

46
Table 27. Health indices, the Netherlands, men
Year Quarter TIW CRWA TRWA EAP PIW PIW2 THLI
1983 2 NA NA NA NA NA NA NA
1985 2 0.244 0.086 0.130 1.751 NA 0.060 0.284
1987 2 0.227 0.092 0.085 2.154 NA 0.074 0.323
1988 2 0.283 0.079 0.098 2.055 NA 0.068 0.320
1989 2 0.277 0.105 0.114 1.608 NA 0.094 0.331
1990 2 0.313 0.096 0.094 2.225 NA 0.094 0.303
1991 2 0.299 0.107 0.103 2.195 NA 0.170 0.319
1992 2 0.345 0.208 0.138 2.240 2.318 0.092 0.519
1993 2 0.353 0.271 0.153 2.121 2.129 0.139 0.583
1994 2 0.244 0.238 0.130 1.755 1.979 0.110 0.506
1995 2 0.273 0.254 0.125 1.563 1.949 0.119 0.495
1996 2 0.254 0.250 0.140 1.394 1.767 0.105 0.470
1997 2 0.267 0.239 0.143 1.572 1.900 0.126 0.479
1998 2 0.261 0.212 0.162 1.647 2.019 0.135 0.467
1999 2 0.267 0.188 0.161 1.912 2.198 0.141 0.477
2000 1 0.361 0.029 0.232 1.400 1.726 0.224 0.374
2000 2 0.295 0.035 0.171 1.629 2.084 0.212 0.336
2000 3 0.237 0.041 0.150 1.701 2.128 0.204 0.328
2000 4 0.297 0.044 0.181 1.870 2.263 0.159 0.379
2001 1 0.378 0.058 0.195 1.698 2.241 0.039 0.388
2001 2 0.368 0.044 0.163 1.738 2.408 0.027 0.343
2001 3 0.307 0.050 0.149 2.000 2.776 0.027 0.358
2001 4 0.389 0.051 0.184 1.977 2.697 0.019 0.383
2002 1 0.365 0.020 0.117 NA 1.050 0.019 0.124
2002 2 0.300 0.038 0.097 NA 1.819 0.032 0.129
2002 3 0.256 0.028 0.078 NA 1.422 0.028 0.104
2002 4 0.313 0.022 0.124 NA 1.542 0.031 0.138
2003 1 0.292 0.024 0.116 1.418 1.398 0.020 0.252
2003 2 0.246 0.035 0.093 1.473 2.176 0.021 0.245
2003 3 0.212 0.037 0.071 1.426 2.140 0.021 0.234
2003 4 0.253 0.039 0.118 1.405 2.093 0.027 0.281
2004 1 0.266 0.034 0.102 1.236 1.926 0.020 0.243
2004 2 0.226 0.040 0.081 1.244 1.969 0.019 0.226
2004 3 0.197 0.040 0.085 1.346 1.996 0.017 0.241
2004 4 0.238 0.036 0.106 1.343 1.967 0.021 0.263
Table 28. Health indices, the Netherlands, women
Year Quarter TIW CRWA TRWA EAP PIW PIW2 THLI
1983 2 NA NA NA NA NA NA NA
1985 2 0.276 0.094 0.131 1.394 NA 0.056 0.178
1987 2 0.224 0.075 0.091 1.063 NA 0.083 0.182
1988 2 0.290 0.080 0.113 1.258 NA 0.084 0.215
1989 2 0.329 0.077 0.105 1.441 NA 0.072 0.237
1990 2 0.319 0.100 0.101 1.434 NA 0.090 0.211
1991 2 0.363 0.068 0.111 1.467 NA 0.102 0.208

47
Year Quarter TIW CRWA TRWA EAP PIW PIW2 THLI1992 2 0.404 0.212 0.156 1.292 0.641 0.067 0.380
1993 2 0.414 0.202 0.163 1.362 0.675 0.092 0.394
1994 2 0.354 0.240 0.148 1.316 0.692 0.121 0.408
1995 2 0.342 0.201 0.152 1.086 0.693 0.146 0.376
1996 2 0.304 0.177 0.148 1.101 0.680 0.157 0.362
1997 2 0.296 0.190 0.153 1.180 0.785 0.136 0.369
1998 2 0.369 0.246 0.152 1.258 0.839 0.187 0.412
1999 2 0.395 0.258 0.186 1.327 0.934 0.204 0.452
2000 1 0.485 0.078 0.255 1.341 1.101 0.248 0.409
2000 2 0.378 0.090 0.180 1.298 1.215 0.203 0.355
2000 3 0.275 0.090 0.159 1.335 1.265 0.255 0.356
2000 4 0.328 0.081 0.184 1.408 1.322 0.310 0.390
2001 1 0.339 0.089 0.203 1.298 1.363 0.138 0.372
2001 2 0.330 0.097 0.165 1.345 1.435 0.111 0.349
2001 3 0.278 0.100 0.163 1.411 1.425 0.097 0.359
2001 4 0.356 0.098 0.209 1.498 1.463 0.123 0.403
2002 1 0.333 0.050 0.155 NA 0.591 0.127 0.159
2002 2 0.270 0.062 0.121 NA 1.027 0.110 0.143
2002 3 0.231 0.052 0.111 NA 0.815 0.092 0.128
2002 4 0.288 0.058 0.149 NA 0.940 0.109 0.159
2003 1 0.266 0.052 0.156 1.428 0.880 0.083 0.306
2003 2 0.225 0.087 0.118 1.433 1.386 0.083 0.308
2003 3 0.185 0.084 0.098 1.468 1.444 0.088 0.304
2003 4 0.236 0.082 0.163 1.548 1.503 0.075 0.361
2004 1 0.244 0.083 0.147 1.467 1.447 0.096 0.339
2004 2 0.209 0.089 0.122 1.551 1.479 0.077 0.332
2004 3 0.182 0.096 0.096 1.519 1.472 0.085 0.318
2004 4 0.216 0.086 0.141 1.511 1.489 0.071 0.341
Table 29. Health indices, Norway, men
Year Quarter TIW CRWA TRWA EAP PIW PIW2 THLI
1995 2 0.167 0.035 NA 2.328 2.815 NA 0.211
1996 2 0.226 0.032 0.063 NA 2.296 0.653 0.200
1997 2 0.208 0.034 0.080 NA 2.177 0.736 0.218
1998 2 0.182 0.048 0.060 2.466 2.167 0.414 0.279
1999 2 0.234 0.055 0.061 2.631 2.104 0.558 0.305
2000 1 0.267 0.079 NA NA 2.070 NA NA
2000 2 0.269 0.078 0.052 2.424 2.184 0.569 0.314
2000 3 0.255 0.067 NA NA 2.238 NA NA
2000 4 0.262 0.078 NA NA 2.175 NA NA
2001 1 0.422 0.079 NA NA 2.017 NA NA
2001 2 0.363 0.076 0.065 2.801 2.152 1.077 0.338
2001 3 0.308 0.055 NA NA 2.056 NA NA
2001 4 0.392 0.062 NA NA 2.125 NA NA
2002 1 0.439 0.078 NA NA 1.968 NA NA
2002 2 0.398 0.084 0.060 2.625 2.089 0.732 0.350

48
Year Quarter TIW CRWA TRWA EAP PIW PIW2 THLI2002 3 0.347 0.094 NA NA 2.022 NA NA
2002 4 0.381 0.090 NA NA 1.977 NA NA
2003 1 0.409 0.094 NA NA 2.093 NA NA
2003 2 0.341 0.082 0.084 2.599 2.076 0.767 0.366
2003 3 0.323 0.073 NA NA 2.120 NA NA
2003 4 0.448 0.059 NA NA 1.946 NA NA
2004 1 0.427 0.083 NA NA 1.946 NA NA
2004 2 0.369 0.097 0.079 2.476 2.017 0.857 0.366
2004 3 0.264 0.068 NA NA 1.870 NA NA
2004 4 0.326 0.074 NA NA 1.945 NA NA
Table 30. Health indices, Norway, women
Year Quarter TIW CRWA TRWA EAP PIW PIW2 THLI
1995 2 0.239 0.035 NA 2.243 2.142 NA 0.296
1996 2 0.296 0.045 0.119 NA 1.682 0.856 0.307
1997 2 0.309 0.053 0.132 NA 1.375 0.756 0.280
1998 2 0.284 0.058 0.135 2.306 1.615 0.654 0.418
1999 2 0.317 0.088 0.126 2.403 1.699 0.793 0.452
2000 1 0.359 0.069 NA NA 1.562 NA NA
2000 2 0.345 0.086 0.113 2.234 1.500 0.681 0.404
2000 3 0.304 0.079 NA NA 1.643 NA NA
2000 4 0.374 0.089 NA NA 1.503 NA NA
2001 1 0.355 0.079 NA NA 1.585 NA NA
2001 2 0.327 0.108 0.109 2.757 1.483 0.817 0.415
2001 3 0.272 0.097 NA NA 1.568 NA NA
2001 4 0.351 0.098 NA NA 1.665 NA NA
2002 1 0.381 0.089 NA NA 1.638 NA NA
2002 2 0.343 0.116 0.131 2.657 1.700 0.838 0.481
2002 3 0.298 0.113 NA NA 1.634 NA NA
2002 4 0.347 0.107 NA NA 1.587 NA NA
2003 1 0.359 0.123 NA NA 1.673 NA NA
2003 2 0.317 0.111 0.130 2.683 1.746 0.867 0.494
2003 3 0.284 0.103 NA NA 1.718 NA NA
2003 4 0.403 0.099 NA NA 1.668 NA NA
2004 1 0.382 0.097 NA NA 1.651 NA NA
2004 2 0.326 0.100 0.142 2.808 1.725 0.787 0.483
2004 3 0.238 0.092 NA NA 1.618 NA NA
2004 4 0.294 0.091 NA NA 1.660 NA NA
Table 31. Health indices, Poland, men
Year Quarter TIW CRWA TRWA EAP PIW PIW2 THLI
1997 2 0.179 0.179 NA NA 3.194 NA 0.115
1998 2 0.173 0.171 NA NA 3.173 NA 0.110
1999 1 0.233 0.128 NA NA 3.054 NA 0.078
2000 1 0.197 0.137 NA NA 2.765 NA 0.080

49
Year Quarter TIW CRWA TRWA EAP PIW PIW2 THLI2000 2 0.132 0.104 NA NA 2.675 NA 0.061
2000 3 0.112 0.122 NA NA 2.752 NA 0.073
2000 4 0.104 0.120 NA NA 2.754 NA 0.072
2001 1 0.193 0.222 0.023 1.856 2.530 0.090 0.492
2001 2 0.149 0.226 0.015 1.801 2.485 0.093 0.476
2001 3 0.109 0.206 0.007 1.861 2.513 0.077 0.460
2001 4 0.141 0.223 0.016 1.823 2.466 0.096 0.500
2002 1 0.151 0.259 0.010 1.599 2.279 0.103 0.487
2002 2 0.127 0.279 0.007 1.638 2.274 0.075 0.488
2002 3 0.099 0.235 0.008 1.579 2.277 0.074 0.444
2002 4 0.115 0.192 0.016 1.594 2.248 0.108 0.445
2003 1 0.157 0.205 0.015 1.404 2.186 0.109 0.412
2003 2 0.127 0.210 0.011 1.435 2.234 0.046 0.402
2003 3 0.118 0.222 0.008 1.499 2.325 0.060 0.411
2003 4 0.125 0.231 0.019 1.480 2.251 0.081 0.422
2004 1 0.171 0.188 0.014 1.282 2.126 0.479 0.458
2004 2 0.169 0.178 0.009 1.337 2.179 0.513 0.453
2004 3 0.141 0.182 0.014 1.448 2.347 0.630 0.487
2004 4 0.119 0.204 0.014 1.394 2.341 0.700 0.498
Table 32. Health indices, Poland, women
Year Quarter TIW CRWA TRWA EAP PIW PIW2 THLI
1997 2 0.197 0.400 NA NA 2.272 NA 0.201
1998 2 0.202 0.349 NA NA 2.156 NA 0.178
1999 1 0.287 0.285 NA NA 2.142 NA 0.143
2000 1 0.222 0.255 NA NA 1.927 NA 0.120
2000 2 0.146 0.252 NA NA 1.813 NA 0.120
2000 3 0.133 0.239 NA NA 1.905 NA 0.114
2000 4 0.143 0.229 NA NA 1.890 NA 0.107
2001 1 0.176 0.176 0.044 1.385 1.740 0.072 0.405
2001 2 0.130 0.192 0.021 1.431 1.713 0.051 0.407
2001 3 0.102 0.183 0.014 1.359 1.681 0.041 0.382
2001 4 0.112 0.200 0.023 1.306 1.661 0.039 0.393
2002 1 0.134 0.250 0.021 1.219 1.618 0.049 0.389
2002 2 0.111 0.282 0.013 1.213 1.622 0.034 0.395
2002 3 0.092 0.246 0.010 1.181 1.601 0.030 0.374
2002 4 0.094 0.199 0.017 1.172 1.563 0.051 0.365
2003 1 0.133 0.246 0.016 1.063 1.504 0.035 0.345
2003 2 0.127 0.266 0.022 1.080 1.479 0.036 0.357
2003 3 0.111 0.259 0.008 1.074 1.493 0.029 0.349
2003 4 0.113 0.227 0.006 1.061 1.464 0.032 0.338
2004 1 0.156 0.204 0.023 0.939 1.471 0.430 0.397
2004 2 0.152 0.231 0.009 0.997 1.491 0.486 0.423
2004 3 0.130 0.241 0.019 1.005 1.459 0.506 0.438
2004 4 0.116 0.249 0.019 0.970 1.438 0.417 0.421

50
Table 33. Health indices, Portugal, men
Year Quarter TIW CRWA TRWA EAP PIW PIW2 THLI
1986 2 0.306 0.110 0.070 3.661 NA 0.073 0.443
1987 2 0.282 0.111 0.071 3.593 NA 0.099 0.426
1988 2 0.282 0.095 0.063 3.972 NA 0.066 0.406
1989 2 0.216 0.105 0.059 3.855 NA 0.114 0.385
1990 2 0.226 0.101 0.062 3.911 NA 0.007 0.374
1991 2 0.273 0.115 0.080 3.842 NA 0.236 0.385
1992 2 0.383 0.083 0.049 3.211 0.203 0.174 0.428
1993 2 0.360 0.131 0.047 0.352 0.240 0.336 0.192
1994 2 0.329 0.147 0.049 0.276 0.170 0.268 0.195
1995 2 0.319 0.093 0.033 0.256 0.153 0.306 0.142
1996 2 0.334 0.088 0.040 0.362 0.206 0.237 0.152
1997 2 0.299 0.101 0.053 0.458 0.185 0.166 0.177
1998 1 0.277 0.167 0.031 2.295 2.827 0.231 0.404
1998 2 0.242 0.156 0.045 2.080 2.848 0.185 0.362
1998 3 0.235 0.156 0.022 1.858 2.945 0.093 0.314
1998 4 0.227 0.159 0.023 1.635 3.040 0.100 0.306
1999 1 0.229 0.172 0.034 1.533 2.711 0.195 0.318
1999 2 0.179 0.187 0.021 1.673 3.109 0.214 0.334
1999 3 0.189 0.201 0.024 1.719 2.983 0.255 0.353
1999 4 0.222 0.211 0.021 1.944 3.066 0.093 0.385
2000 1 0.247 0.189 0.031 2.039 3.280 0.298 0.386
2000 2 0.204 0.166 0.017 2.002 3.258 0.176 0.340
2000 3 0.262 0.158 0.015 2.063 3.124 0.122 0.333
2000 4 0.217 0.161 0.025 2.135 3.131 0.298 0.365
2001 1 0.374 0.186 0.017 2.971 3.751 0.423 0.455
2001 2 0.360 0.187 0.029 3.052 3.768 0.355 0.465
2001 3 0.296 0.161 0.033 3.064 3.666 0.313 0.464
2001 4 0.363 0.179 0.024 2.957 3.432 0.379 0.469
2002 1 0.444 0.181 0.058 3.314 3.890 0.346 0.525
2002 2 0.398 0.209 0.038 3.388 3.759 0.467 0.552
2002 3 0.362 0.187 0.031 3.503 3.999 0.451 0.563
2002 4 0.371 0.181 0.041 3.307 3.604 0.467 0.582
2003 1 0.281 0.131 0.031 1.904 2.258 0.269 0.355
2003 2 0.261 0.130 0.031 1.914 2.432 0.193 0.352
2003 3 0.226 0.119 0.025 2.030 2.393 0.198 0.350
2003 4 0.262 0.123 0.028 1.835 2.349 0.206 0.338
2004 1 0.222 0.123 0.020 1.648 2.137 0.117 0.296
2004 2 0.204 0.103 0.020 1.708 2.013 0.077 0.284
2004 3 0.198 0.100 0.016 1.742 2.044 0.138 0.292
2004 4 0.235 0.086 0.026 1.580 1.941 0.061 0.269
Table 34. Health indices, Portugal, women
Year Quarter TIW CRWA TRWA EAP PIW PIW2 THLI
1986 2 0.285 0.187 0.076 3.628 NA 0.100 0.407
1987 2 0.299 0.142 0.068 3.738 NA 0.051 0.389
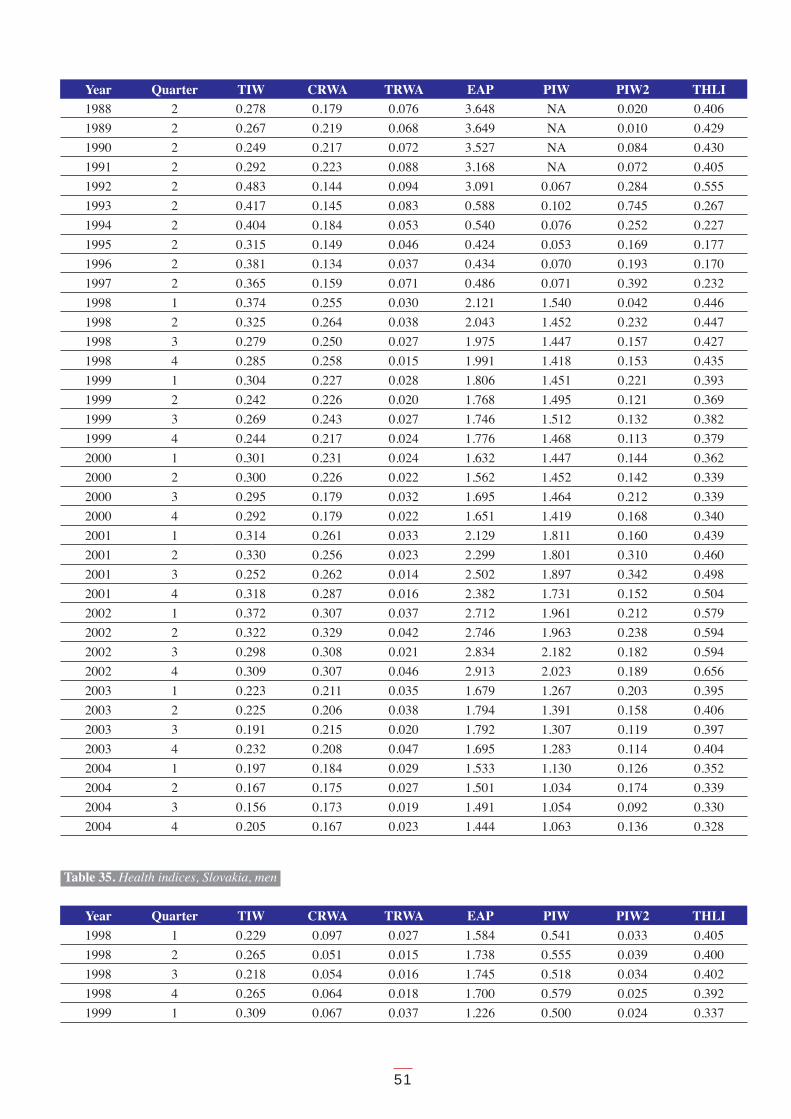
51
Year Quarter TIW CRWA TRWA EAP PIW PIW2 THLI1988 2 0.278 0.179 0.076 3.648 NA 0.020 0.406
1989 2 0.267 0.219 0.068 3.649 NA 0.010 0.429
1990 2 0.249 0.217 0.072 3.527 NA 0.084 0.430
1991 2 0.292 0.223 0.088 3.168 NA 0.072 0.405
1992 2 0.483 0.144 0.094 3.091 0.067 0.284 0.555
1993 2 0.417 0.145 0.083 0.588 0.102 0.745 0.267
1994 2 0.404 0.184 0.053 0.540 0.076 0.252 0.227
1995 2 0.315 0.149 0.046 0.424 0.053 0.169 0.177
1996 2 0.381 0.134 0.037 0.434 0.070 0.193 0.170
1997 2 0.365 0.159 0.071 0.486 0.071 0.392 0.232
1998 1 0.374 0.255 0.030 2.121 1.540 0.042 0.446
1998 2 0.325 0.264 0.038 2.043 1.452 0.232 0.447
1998 3 0.279 0.250 0.027 1.975 1.447 0.157 0.427
1998 4 0.285 0.258 0.015 1.991 1.418 0.153 0.435
1999 1 0.304 0.227 0.028 1.806 1.451 0.221 0.393
1999 2 0.242 0.226 0.020 1.768 1.495 0.121 0.369
1999 3 0.269 0.243 0.027 1.746 1.512 0.132 0.382
1999 4 0.244 0.217 0.024 1.776 1.468 0.113 0.379
2000 1 0.301 0.231 0.024 1.632 1.447 0.144 0.362
2000 2 0.300 0.226 0.022 1.562 1.452 0.142 0.339
2000 3 0.295 0.179 0.032 1.695 1.464 0.212 0.339
2000 4 0.292 0.179 0.022 1.651 1.419 0.168 0.340
2001 1 0.314 0.261 0.033 2.129 1.811 0.160 0.439
2001 2 0.330 0.256 0.023 2.299 1.801 0.310 0.460
2001 3 0.252 0.262 0.014 2.502 1.897 0.342 0.498
2001 4 0.318 0.287 0.016 2.382 1.731 0.152 0.504
2002 1 0.372 0.307 0.037 2.712 1.961 0.212 0.579
2002 2 0.322 0.329 0.042 2.746 1.963 0.238 0.594
2002 3 0.298 0.308 0.021 2.834 2.182 0.182 0.594
2002 4 0.309 0.307 0.046 2.913 2.023 0.189 0.656
2003 1 0.223 0.211 0.035 1.679 1.267 0.203 0.395
2003 2 0.225 0.206 0.038 1.794 1.391 0.158 0.406
2003 3 0.191 0.215 0.020 1.792 1.307 0.119 0.397
2003 4 0.232 0.208 0.047 1.695 1.283 0.114 0.404
2004 1 0.197 0.184 0.029 1.533 1.130 0.126 0.352
2004 2 0.167 0.175 0.027 1.501 1.034 0.174 0.339
2004 3 0.156 0.173 0.019 1.491 1.054 0.092 0.330
2004 4 0.205 0.167 0.023 1.444 1.063 0.136 0.328
Table 35. Health indices, Slovakia, men
Year Quarter TIW CRWA TRWA EAP PIW PIW2 THLI
1998 1 0.229 0.097 0.027 1.584 0.541 0.033 0.405
1998 2 0.265 0.051 0.015 1.738 0.555 0.039 0.400
1998 3 0.218 0.054 0.016 1.745 0.518 0.034 0.402
1998 4 0.265 0.064 0.018 1.700 0.579 0.025 0.392
1999 1 0.309 0.067 0.037 1.226 0.500 0.024 0.337

52
Year Quarter TIW CRWA TRWA EAP PIW PIW2 THLI1999 2 0.233 0.074 0.033 1.163 0.463 0.023 0.336
1999 3 0.224 0.063 0.017 1.172 0.417 0.021 0.324
1999 4 0.272 0.077 0.040 1.163 0.478 0.018 0.342
2000 1 0.351 0.082 0.058 1.168 0.412 0.027 0.381
2000 2 0.179 0.064 0.028 1.137 0.371 0.015 0.333
2000 3 0.222 0.059 0.017 1.190 0.377 0.024 0.323
2000 4 0.214 0.064 0.038 1.237 0.372 0.026 0.345
2001 1 0.311 0.070 0.032 0.794 2.107 0.166 0.260
2001 2 0.251 0.103 0.036 0.835 2.128 0.176 0.290
2001 3 0.181 0.093 0.015 0.986 2.294 0.214 0.305
2001 4 0.206 0.085 0.022 1.065 2.324 0.214 0.318
2002 1 0.226 0.076 0.033 1.105 2.102 0.201 0.327
2002 2 0.221 0.082 0.027 1.238 2.161 0.210 0.351
2002 3 0.142 0.070 0.030 1.362 2.251 0.336 0.386
2002 4 0.190 0.059 0.025 1.199 2.155 0.197 0.310
2003 1 0.250 0.058 0.036 0.956 1.941 0.179 0.279
2003 2 0.130 0.064 0.039 1.044 2.124 0.200 0.288
2003 3 0.137 0.054 0.024 1.025 2.188 0.170 0.252
2003 4 0.114 0.057 0.031 1.129 2.104 0.151 0.281
2004 1 0.205 0.064 0.026 1.101 2.217 0.238 0.317
2004 2 0.127 0.087 0.016 1.147 2.374 0.214 0.307
2004 3 0.128 0.075 0.014 1.321 2.465 0.193 0.309
2004 4 0.152 0.075 0.016 1.306 2.405 0.221 0.312
Table 36. Health indices, Slovakia, women
Year Quarter TIW CRWA TRWA EAP PIW PIW2 THLI
1998 1 0.266 0.168 0.082 1.399 0.489 0.041 0.607
1998 2 0.244 0.118 0.033 1.407 0.454 0.029 0.551
1998 3 0.246 0.115 0.025 1.374 0.451 0.031 0.537
1998 4 0.251 0.112 0.021 1.333 0.467 0.039 0.531
1999 1 0.358 0.057 0.048 1.146 0.430 0.034 0.466
1999 2 0.283 0.058 0.021 1.109 0.373 0.030 0.440
1999 3 0.213 0.058 0.015 1.091 0.310 0.028 0.434
1999 4 0.183 0.066 0.048 1.179 0.283 0.034 0.487
2000 1 0.303 0.065 0.076 1.224 0.280 0.022 0.510
2000 2 0.171 0.061 0.035 1.207 0.290 0.030 0.486
2000 3 0.111 0.065 0.018 1.181 0.270 0.031 0.468
2000 4 0.195 0.081 0.036 1.189 0.295 0.037 0.480
2001 1 0.289 0.082 0.038 1.063 1.608 0.155 0.339
2001 2 0.229 0.068 0.012 1.089 1.633 0.156 0.328
2001 3 0.181 0.064 0.012 1.161 1.627 0.165 0.344
2001 4 0.206 0.074 0.019 1.203 1.638 0.240 0.387
2002 1 0.226 0.055 0.023 1.021 1.509 0.260 0.333
2002 2 0.187 0.062 0.018 0.937 1.507 0.229 0.305
2002 3 0.113 0.066 0.018 0.944 1.497 0.247 0.310
2002 4 0.176 0.072 0.034 0.896 1.426 0.332 0.335

53
Year Quarter TIW CRWA TRWA EAP PIW PIW2 THLI2003 1 0.233 0.082 0.037 0.945 1.360 0.303 0.318
2003 2 0.130 0.086 0.049 0.878 1.365 0.169 0.279
2003 3 0.137 0.083 0.021 0.887 1.294 0.174 0.267
2003 4 0.114 0.097 0.038 0.880 1.248 0.154 0.284
2004 1 0.190 0.101 0.036 0.901 1.353 0.210 0.307
2004 2 0.114 0.084 0.029 0.998 1.385 0.173 0.304
2004 3 0.116 0.104 0.024 1.038 1.435 0.134 0.302
2004 4 0.140 0.066 0.028 1.180 1.524 0.212 0.335
Table 37. Health indices, Slovenia, men
Year Quarter TIW CRWA TRWA EAP PIW PIW2 THLI
1996 2 0.234 NA 0.044 0.468 0.627 0.411 0.155
1997 2 0.263 NA 0.105 0.726 0.301 0.457 0.248
1998 2 0.264 NA 0.027 0.419 0.435 0.862 0.188
1999 1 0.399 NA 0.077 0.556 0.285 0.561 0.198
1999 2 0.257 NA 0.055 0.362 0.312 1.027 0.190
1999 3 0.264 NA 0.028 0.638 0.286 0.521 0.168
1999 4 0.308 NA 0.034 0.635 0.242 1.022 0.218
2000 1 0.364 NA 0.250 0.671 1.184 0.056 0.254
2000 2 0.246 NA 0.056 0.414 1.113 0.148 0.100
2000 3 0.245 NA 0.230 0.346 1.131 0.116 0.210
2000 4 0.243 NA 0.275 0.349 0.863 0.124 0.240
2001 1 0.264 NA 0.159 0.486 1.122 0.106 0.172
2001 2 0.193 NA 0.055 0.398 0.957 0.120 0.093
2001 3 0.257 NA 0.129 0.446 0.823 0.158 0.152
2001 4 0.277 NA 0.161 0.505 0.938 0.128 0.181
2002 1 0.275 NA 0.050 0.472 0.973 0.268 0.111
2002 2 0.209 NA 0.040 0.387 1.019 0.179 0.086
2002 3 0.218 NA 0.026 0.425 0.949 0.069 0.070
2002 4 0.258 NA 0.036 0.638 0.889 0.122 0.109
2003 1 0.257 NA 0.032 0.617 0.939 0.104 0.100
2003 2 0.261 NA 0.016 0.359 0.938 0.098 0.058
2003 3 0.236 NA 0.038 0.600 0.934 0.090 0.103
2003 4 0.286 NA 0.043 1.145 1.004 0.169 0.183
2004 1 0.400 NA 0.056 0.729 1.201 0.128 0.140
2004 2 0.263 NA 0.082 0.700 1.292 0.163 0.154
2004 3 0.221 NA 0.051 0.691 1.227 0.086 0.120
2004 4 0.288 NA 0.060 0.640 1.289 0.152 0.132
Table 38. Health indices, Slovenia, women
Year Quarter TIW CRWA TRWA EAP PIW PIW2 THLI
1996 2 0.285 NA 0.051 0.409 0.369 0.723 0.175
1997 2 0.259 NA 0.113 0.441 0.273 0.524 0.202
1998 2 0.367 NA 0.091 0.284 0.221 0.613 0.174
1999 1 0.399 NA 0.095 0.293 0.224 0.459 0.154

54
Year Quarter TIW CRWA TRWA EAP PIW PIW2 THLI1999 2 0.267 NA 0.028 0.251 0.207 0.640 0.121
1999 3 0.210 NA 0.041 0.347 0.200 0.642 0.151
1999 4 0.305 NA 0.058 0.374 0.308 0.895 0.189
2000 1 0.344 NA 0.238 0.310 0.828 0.180 0.196
2000 2 0.235 NA 0.066 0.398 0.705 0.192 0.108
2000 3 0.263 NA 0.182 0.372 0.773 0.129 0.173
2000 4 0.295 NA 0.254 NA 0.746 0.104 NA
2001 1 0.231 NA 0.139 0.225 0.794 0.029 0.112
2001 2 0.184 NA 0.035 0.217 0.597 0.088 0.057
2001 3 0.234 NA 0.181 0.246 0.662 0.241 0.164
2001 4 0.277 NA 0.203 0.154 0.676 0.122 0.151
2002 1 0.267 NA 0.053 NA 0.613 0.094 NA
2002 2 0.201 NA 0.063 0.234 0.700 0.093 0.074
2002 3 0.209 NA 0.014 0.258 0.817 0.114 0.049
2002 4 0.228 NA 0.035 0.212 0.751 0.122 0.060
2003 1 0.257 NA 0.049 0.298 0.630 0.168 0.080
2003 2 0.261 NA 0.060 0.271 0.712 0.062 0.075
2003 3 0.215 NA 0.048 0.198 0.643 0.070 0.061
2003 4 0.262 NA 0.039 0.327 0.792 0.093 0.079
2004 1 0.352 NA 0.060 0.272 0.840 0.051 0.077
2004 2 0.248 NA 0.080 0.291 0.901 0.052 0.091
2004 3 0.200 NA 0.029 0.297 0.785 0.083 0.069
2004 4 0.281 NA 0.060 0.302 0.871 0.086 0.089
Table 39. Health indices, Spain, men
Year Quarter TIW CRWA TRWA EAP PIW PIW2 THLI
1986 2 0.178 NA NA NA NA NA NA
1987 2 0.149 0.019 0.054 0.711 NA 0.056 0.130
1988 2 0.174 0.016 0.032 0.630 NA 0.053 0.104
1989 2 0.172 0.017 0.022 0.692 NA 0.044 0.098
1990 2 0.181 0.015 0.023 0.687 NA 0.061 0.098
1991 2 0.188 0.012 0.025 0.662 NA 0.077 0.098
1992 2 0.190 0.007 0.016 1.185 NA 0.090 0.235
1993 2 0.199 0.012 0.014 1.000 NA 0.057 0.232
1994 2 0.183 0.011 0.025 0.960 NA 0.060 0.237
1995 2 0.187 0.012 0.019 1.078 NA 0.064 0.245
1996 2 0.180 0.014 0.015 1.070 NA 0.067 0.237
1997 2 0.188 0.009 0.012 1.179 NA 0.073 0.243
1998 1 0.168 0.007 0.017 1.042 NA 0.074 0.203
1998 2 0.158 0.007 0.011 1.076 NA 0.089 0.202
1998 3 0.157 0.006 0.013 1.124 NA 0.075 0.201
1998 4 0.155 0.006 0.012 1.115 NA 0.066 0.199
1999 1 0.170 0.011 0.023 1.236 1.613 0.475 0.291
1999 2 0.203 0.007 0.017 1.313 1.777 0.524 0.286
1999 3 0.182 0.009 0.007 1.365 1.828 0.492 0.277
1999 4 0.172 0.008 0.012 1.345 1.831 0.527 0.291

55
Year Quarter TIW CRWA TRWA EAP PIW PIW2 THLI2000 1 0.211 0.011 0.021 1.371 1.987 0.534 0.293
2000 2 0.188 0.011 0.014 1.472 2.031 0.555 0.294
2000 3 0.186 0.009 0.008 1.525 2.098 0.541 0.289
2000 4 0.189 0.006 0.015 1.488 2.073 0.544 0.295
2001 1 0.240 0.009 0.017 1.361 1.998 0.506 0.273
2001 2 0.237 0.010 0.017 1.517 2.044 0.535 0.290
2001 3 0.199 0.007 0.010 1.516 2.076 0.432 0.266
2001 4 0.232 0.008 0.016 1.497 2.013 0.470 0.280
2002 1 0.237 0.008 0.016 1.299 1.821 0.491 0.258
2002 2 0.246 0.009 0.017 1.359 1.933 0.610 0.274
2002 3 0.221 0.007 0.010 1.345 1.868 0.525 0.255
2002 4 0.232 0.007 0.013 1.325 1.818 0.540 0.268
2003 1 0.251 0.009 0.015 1.265 1.767 0.470 0.253
2003 2 0.225 0.004 0.013 1.303 1.805 0.500 0.249
2003 3 0.231 0.006 0.009 1.328 1.832 0.444 0.243
2003 4 0.232 0.005 0.016 1.313 1.772 0.451 0.258
2004 1 0.236 0.005 0.011 1.248 1.750 0.512 0.255
2004 2 0.255 0.008 0.018 1.317 1.782 0.515 0.266
2004 3 0.256 0.009 0.012 1.327 1.801 0.489 0.255
2004 4 0.235 0.005 0.017 1.325 1.779 0.452 0.257
Table 40. Health indices, Spain, women
Year Quarter TIW CRWA TRWA EAP PIW PIW2 THLI
1986 2 0.151 NA NA NA NA NA NA
1987 2 0.110 0.038 0.043 0.493 NA 0.068 0.063
1988 2 0.129 0.026 0.023 0.414 NA 0.045 0.052
1989 2 0.162 0.024 0.023 0.374 NA 0.060 0.050
1990 2 0.171 0.023 0.025 0.376 NA 0.046 0.052
1991 2 0.187 0.018 0.020 0.384 NA 0.068 0.054
1992 2 0.199 0.014 0.009 0.603 NA 0.038 0.109
1993 2 0.193 0.017 0.012 0.691 NA 0.035 0.134
1994 2 0.164 0.011 0.023 0.648 NA 0.021 0.132
1995 2 0.192 0.018 0.026 0.667 NA 0.047 0.144
1996 2 0.183 0.008 0.015 0.686 NA 0.026 0.137
1997 2 0.210 0.010 0.013 0.684 NA 0.040 0.140
1998 1 0.192 0.010 0.017 0.605 NA 0.037 0.117
1998 2 0.161 0.009 0.012 0.569 NA 0.030 0.110
1998 3 0.145 0.006 0.008 0.578 NA 0.038 0.111
1998 4 0.168 0.008 0.010 0.606 NA 0.038 0.117
1999 1 0.182 0.005 0.023 0.640 0.377 0.234 0.167
1999 2 0.207 0.010 0.016 0.622 0.408 0.267 0.169
1999 3 0.175 0.010 0.011 0.677 0.414 0.263 0.178
1999 4 0.200 0.010 0.014 0.753 0.414 0.343 0.208
2000 1 0.219 0.013 0.018 0.836 0.468 0.294 0.208
2000 2 0.204 0.017 0.015 0.844 0.477 0.310 0.210
2000 3 0.188 0.012 0.019 0.830 0.464 0.261 0.199

56
Year Quarter TIW CRWA TRWA EAP PIW PIW2 THLI2000 4 0.216 0.012 0.022 0.856 0.484 0.320 0.216
2001 1 0.194 0.019 0.012 0.792 0.484 0.312 0.198
2001 2 0.193 0.012 0.013 0.787 0.490 0.278 0.190
2001 3 0.165 0.009 0.013 0.761 0.477 0.244 0.178
2001 4 0.197 0.009 0.014 0.766 0.478 0.311 0.194
2002 1 0.202 0.007 0.019 0.673 0.431 0.222 0.165
2002 2 0.214 0.013 0.021 0.679 0.488 0.330 0.190
2002 3 0.179 0.009 0.005 0.722 0.485 0.314 0.186
2002 4 0.192 0.012 0.010 0.743 0.466 0.295 0.192
2003 1 0.205 0.009 0.017 0.745 0.479 0.248 0.185
2003 2 0.187 0.009 0.010 0.739 0.465 0.289 0.186
2003 3 0.192 0.010 0.006 0.737 0.461 0.291 0.186
2003 4 0.192 0.006 0.015 0.732 0.466 0.263 0.185
2004 1 0.192 0.008 0.013 0.673 0.451 0.245 0.173
2004 2 0.210 0.009 0.014 0.678 0.458 0.278 0.182
2004 3 0.214 0.009 0.013 0.710 0.468 0.249 0.178
2004 4 0.197 0.006 0.016 0.751 0.473 0.295 0.194
Table 41. Health indices, Sweden, men
Year Quarter TIW CRWA TRWA EAP PIW PIW2 THLI
1995 2 0.169 0.121 0.096 0.347 0.223 0.033 0.214
1996 2 0.144 0.133 0.075 0.358 0.213 0.004 0.204
1997 2 0.123 0.101 0.093 0.285 0.238 NA 0.180
1998 2 0.190 0.115 0.105 0.326 0.237 0.010 0.205
1999 2 0.208 0.141 0.149 0.350 0.296 0.004 0.260
2000 2 0.244 0.123 0.133 0.966 0.338 0.112 0.241
2001 1 0.513 0.129 0.205 1.086 0.384 0.108 0.317
2001 2 0.464 0.143 0.116 0.935 0.393 0.113 0.253
2001 3 0.422 0.135 0.097 0.205 0.352 0.095 0.226
2001 4 0.489 0.123 0.150 0.250 0.380 0.082 0.260
2002 1 0.523 0.134 0.180 0.354 0.365 0.072 0.304
2002 2 0.469 0.128 0.125 0.396 0.394 0.082 0.263
2002 3 0.430 0.137 0.102 0.461 0.406 0.068 0.248
2002 4 0.495 0.139 0.179 0.510 0.418 0.080 0.320
2003 1 0.605 0.170 0.231 0.648 0.459 NA 0.394
2003 2 0.563 0.167 0.144 0.808 0.418 NA 0.345
2003 3 0.500 0.157 0.131 0.757 0.454 NA 0.322
2003 4 0.537 0.172 0.217 0.702 0.429 NA 0.397
2004 1 0.496 0.153 0.194 0.535 0.342 NA 0.339
2004 2 0.436 0.168 0.153 0.543 0.390 NA 0.318
2004 3 0.400 0.168 0.116 0.520 0.389 0.071 0.298
2004 4 0.429 0.154 0.202 0.428 0.375 0.075 0.342

57
Table 42. Health indices, Sweden, women
Year Quarter TIW CRWA TRWA EAP PIW PIW2 THLI
1995 2 0.243 0.215 0.156 0.573 0.266 0.070 0.363
1996 2 0.206 0.242 0.117 0.368 0.287 0.078 0.327
1997 2 0.232 0.233 0.149 0.548 0.308 0.036 0.356
1998 2 0.272 0.199 0.140 0.329 0.322 0.058 0.295
1999 2 0.361 0.222 0.242 0.285 0.426 0.022 0.373
2000 2 0.396 0.210 0.231 1.186 0.545 0.085 0.381
2001 1 0.457 0.233 0.309 1.144 0.498 0.093 0.471
2001 2 0.419 0.225 0.219 1.144 0.613 0.094 0.402
2001 3 0.378 0.236 0.163 0.339 0.561 0.103 0.370
2001 4 0.431 0.246 0.257 0.396 0.553 0.103 0.453
2002 1 0.465 0.234 0.292 0.434 0.489 0.091 0.471
2002 2 0.417 0.248 0.243 0.577 0.502 0.065 0.459
2002 3 0.388 0.250 0.178 0.647 0.518 0.100 0.416
2002 4 0.449 0.233 0.276 0.633 0.529 0.093 0.477
2003 1 0.544 0.304 0.349 0.790 0.596 NA 0.592
2003 2 0.497 0.331 0.255 0.853 0.593 NA 0.550
2003 3 0.446 0.336 0.199 0.776 0.511 NA 0.506
2003 4 0.485 0.337 0.340 0.783 0.549 NA 0.613
2004 1 0.440 0.287 0.313 0.722 0.464 NA 0.544
2004 2 0.390 0.307 0.271 0.759 0.520 NA 0.532
2004 3 0.353 0.299 0.202 0.735 0.523 0.071 0.489
2004 4 0.380 0.304 0.313 0.777 0.539 0.073 0.581

58
Annex 2. Health inequality indices by country and sex
Table 43. Health inequality indices, Austria, men
Year Quarter TIW CRWA TRWA PIW2 THLI
1995 1 -0.193 -0.092 0.053 -0.515 -0.034
1996 1 -0.216 -0.373 -0.106 NA -0.152
1997 1 -0.160 -0.143 -0.245 0.041 -0.211
1998 1 -0.243 -0.043 0.081 0.209 0.072
1999 1 -0.125 -0.248 0.035 NA -0.050
1999 2 NA NA NA NA NA
1999 3 NA NA NA NA NA
1999 4 NA NA NA NA NA
2000 1 -0.267 -0.306 0.240 0.570 0.072
2000 2 -0.063 -0.467 0.176 0.545 0.026
2000 3 NA NA NA NA NA
2000 4 NA NA NA NA NA
2001 1 -0.142 -0.168 0.092 -0.248 0.050
2001 2 NA NA NA NA NA
2001 3 NA NA NA NA NA
2001 4 NA NA NA NA NA
2002 1 -0.109 -0.297 -0.249 -0.076 -0.243
2002 2 NA NA NA NA NA
2002 3 NA NA NA NA NA
2002 4 NA NA NA NA NA
2003 1 -0.088 -0.271 0.083 -0.852 -0.121
2003 2 -0.132 0.059 0.060 NA 0.018
2003 3 NA NA NA NA NA
2003 4 NA NA NA NA NA
2004 1 -0.142 0.110 -0.001 NA 0.016
2004 2 -0.298 -0.011 -0.107 NA -0.037
2004 3 -0.204 -0.100 0.163 NA -0.004
2004 4 -0.247 0.090 0.247 NA 0.192
Table 44. Health inequality indices, Austria, women
Year Quarter TIW CRWA TRWA PIW2 THLI
1995 1 0.088 -0.183 0.105 0.380 0.081
1996 1 0.030 -0.082 0.071 -1.075 -0.014
1997 1 -0.022 -0.164 -0.044 -0.537 -0.125
1998 1 0.059 -0.072 0.220 -0.007 0.106
1999 1 -0.031 -0.160 0.165 -0.272 -0.079
1999 2 NA NA NA NA NA
1999 3 NA NA NA NA NA
1999 4 NA NA NA NA NA
2000 1 0.104 -0.106 0.214 0.060 0.040
2000 2 0.037 -0.144 0.445 -0.064 0.115

59
Year Quarter TIW CRWA TRWA PIW2 THLI2000 3 NA NA NA NA NA
2000 4 NA NA NA NA NA
2001 1 0.009 -0.268 0.008 -0.209 -0.147
2001 2 NA NA NA NA NA
2001 3 NA NA NA NA NA
2001 4 NA NA NA NA NA
2002 1 0.011 -0.037 0.116 0.217 0.075
2002 2 NA NA NA NA NA
2002 3 NA NA NA NA NA
2002 4 NA NA NA NA NA
2003 1 -0.088 -0.305 0.351 0.643 0.211
2003 2 -0.081 -0.430 -0.006 NA -0.306
2003 3 NA NA NA NA NA
2003 4 NA NA NA NA NA
2004 1 0.031 -0.117 0.081 1.617 -0.044
2004 2 0.059 -0.085 0.227 NA 0.011
2004 3 -0.037 -0.202 0.159 NA -0.020
2004 4 -0.145 -0.029 0.354 NA 0.058
Table 45. Health inequality indices, Belgium, men
Year Quarter TIW CRWA TRWA PIW2 THLI
1992 2 0.001 0.001 0.001 NA 0.001
1993 2 -0.200 -0.183 -0.057 0.659 -0.045
1994 2 -0.266 0.013 -0.194 -0.143 -0.063
1995 2 -0.339 -0.405 0.122 -0.719 -0.087
1996 2 -0.223 -0.081 -0.120 -0.434 -0.114
1997 2 -0.301 -0.344 -0.225 0.245 -0.295
1998 2 -0.261 -0.148 -0.383 0.095 -0.281
1999 1 -0.315 -0.456 -0.212 0.245 -0.252
1999 2 -0.422 -0.619 -0.521 -0.223 -0.465
1999 3 -0.389 -0.277 -0.354 -0.358 -0.309
1999 4 -0.304 -0.443 -0.317 NA -0.401
2000 1 -0.314 -0.312 -0.166 0.493 -0.161
2000 2 -0.191 -0.066 -0.006 -0.705 -0.077
2000 3 -0.238 -0.036 -0.227 -0.134 -0.156
2000 4 -0.074 0.074 -0.368 -0.226 -0.118
2001 1 -0.218 -0.189 -0.253 NA -0.188
2001 2 -0.172 -0.060 -0.165 NA -0.077
2001 3 -0.304 -0.469 -0.243 NA -0.322
2001 4 -0.366 -0.312 0.098 NA -0.031
2002 1 -0.179 -0.350 -0.091 NA -0.189
2002 2 -0.273 -0.090 -0.025 NA -0.226
2002 3 -0.276 -0.045 -0.181 NA -0.128
2002 4 -0.297 0.087 -0.451 0.112 -0.169
2003 1 -0.385 -0.213 0.007 NA -0.063
2003 2 -0.285 -0.042 -0.092 0.534 -0.130

60
Year Quarter TIW CRWA TRWA PIW2 THLI2003 3 -0.169 -0.202 0.034 NA -0.149
2003 4 -0.263 -0.518 0.198 NA -0.093
2004 1 -0.297 -0.253 -0.268 NA -0.220
2004 2 -0.253 0.231 -0.171 NA 0.023
2004 3 -0.289 -0.166 -0.089 -1.220 -0.338
2004 4 -0.321 -0.559 -0.144 0.385 -0.318
Table 46. Health inequality indices, Belgium, women
Year Quarter TIW CRWA TRWA PIW2 THLI
1992 2 0.001 0.001 NA NA 0.001
1993 2 -0.033 -0.056 0.394 -0.170 0.055
1994 2 0.033 -0.109 -0.008 0.531 -0.080
1995 2 0.058 0.066 0.006 0.798 0.018
1996 2 -0.017 -0.247 -0.146 -0.236 -0.208
1997 2 -0.050 -0.081 -0.034 NA -0.054
1998 2 -0.109 0.098 -0.228 0.021 -0.146
1999 1 -0.064 NA -0.113 0.472 -0.058
1999 2 -0.195 -0.118 0.066 0.227 -0.028
1999 3 -0.149 -0.237 -0.262 -0.281 -0.229
1999 4 -0.072 -0.136 -0.085 -0.241 -0.126
2000 1 -0.066 -0.134 -0.316 0.144 -0.201
2000 2 0.059 -0.008 -0.005 -0.509 0.003
2000 3 0.010 0.276 -0.011 0.172 -0.049
2000 4 -0.153 -0.075 0.325 NA 0.059
2001 1 -0.128 -0.270 -0.286 NA -0.255
2001 2 -0.051 -0.168 0.057 -0.309 -0.037
2001 3 -0.059 -0.264 -0.238 NA -0.219
2001 4 -0.139 0.075 -0.128 -0.272 -0.005
2002 1 -0.135 -0.284 -0.190 NA -0.232
2002 2 -0.125 -0.002 -0.015 NA -0.052
2002 3 -0.219 -0.041 -0.179 NA -0.083
2002 4 -0.236 -0.228 0.398 NA 0.104
2003 1 -0.031 -0.115 0.238 NA -0.029
2003 2 -0.083 -0.166 -0.171 NA -0.136
2003 3 -0.164 -0.350 -0.276 -0.995 -0.293
2003 4 -0.051 -0.067 -0.415 NA -0.365
2004 1 0.035 0.050 -0.199 -0.362 -0.107
2004 2 -0.111 -0.029 0.256 -0.371 0.106
2004 3 -0.140 -0.176 0.091 -0.463 -0.076
2004 4 -0.199 -0.267 0.064 -0.218 -0.059
Table 47. Health inequality indices, the Czech Republic, men
Year Quarter TIW CRWA TRWA PIW2 THLI
1997 2 -0.247 -0.214 -0.098 NA -0.113
1998 1 -0.246 -0.240 -0.194 NA -0.178

61
Year Quarter TIW CRWA TRWA PIW2 THLI1998 2 -0.268 -0.286 -0.005 NA -0.242
1998 3 -0.259 -0.314 0.182 NA -0.182
1998 4 -0.219 -0.349 0.009 NA -0.222
1999 1 -0.226 -0.373 -0.087 NA -0.201
1999 2 -0.203 -0.506 0.077 NA -0.375
1999 3 -0.289 -0.396 0.082 NA -0.264
1999 4 -0.232 -0.492 -0.086 NA -0.351
2000 1 -0.247 -0.230 -0.085 NA -0.258
2000 2 -0.184 -0.382 -0.236 NA -0.377
2000 3 -0.178 -0.353 -0.088 NA -0.323
2000 4 -0.004 -0.336 -0.094 NA -0.256
2001 1 -0.352 -0.128 -0.049 NA -0.128
2001 2 -0.314 -0.212 -0.259 NA -0.255
2001 3 -0.303 -0.103 -0.214 NA -0.146
2001 4 -0.284 0.077 -0.372 NA 0.012
2002 1 -0.370 -0.032 -0.089 NA 0.011
2002 2 -0.356 -0.059 -0.175 -0.055 -0.069
2002 3 -0.234 -0.258 0.350 0.814 -0.112
2002 4 -0.318 -0.321 -0.165 0.815 -0.202
2003 1 -0.263 -0.307 -0.060 -0.032 -0.201
2003 2 -0.188 -0.208 -0.110 -0.559 -0.125
2003 3 -0.222 -0.262 -0.098 -0.419 -0.207
2003 4 -0.203 -0.347 -0.139 0.257 -0.312
2004 1 -0.236 -0.174 -0.164 0.192 -0.101
2004 2 -0.081 -0.234 -0.453 0.209 -0.234
2004 3 -0.170 -0.211 -0.488 0.331 -0.240
2004 4 -0.317 -0.066 -0.188 0.139 -0.146
Table 48. Health inequality indices, the Czech Republic, women
Year Quarter TIW CRWA TRWA PIW2 THLI
1997 2 -0.171 -0.291 -0.104 NA -0.253
1998 1 -0.189 -0.229 -0.313 NA -0.250
1998 2 -0.224 -0.196 -0.092 NA -0.119
1998 3 -0.133 -0.221 -0.218 NA -0.166
1998 4 -0.163 -0.282 -0.325 NA -0.306
1999 1 -0.048 -0.312 -0.176 NA -0.229
1999 2 -0.140 -0.254 -0.386 NA -0.315
1999 3 -0.191 -0.190 -0.370 NA -0.224
1999 4 -0.190 -0.144 0.168 NA -0.072
2000 1 -0.178 -0.030 -0.117 NA -0.112
2000 2 -0.273 0.149 -0.197 NA -0.026
2000 3 -0.211 0.081 -0.174 NA 0.085
2000 4 -0.238 0.021 -0.152 NA 0.010
2001 1 -0.198 -0.064 -0.258 NA -0.070
2001 2 -0.210 -0.305 -0.198 NA -0.274
2001 3 -0.156 -0.304 -0.016 NA -0.188

62
Year Quarter TIW CRWA TRWA PIW2 THLI2001 4 -0.101 -0.303 -0.266 NA -0.257
2002 1 -0.161 -0.369 -0.157 -0.120 -0.279
2002 2 -0.166 -0.321 0.100 -0.128 -0.113
2002 3 -0.214 -0.326 -0.241 -0.311 -0.278
2002 4 -0.130 -0.270 -0.262 -0.428 -0.238
2003 1 -0.166 -0.189 0.008 -0.628 -0.074
2003 2 -0.277 -0.244 -0.210 -0.430 -0.202
2003 3 -0.246 -0.221 -0.020 -0.402 -0.214
2003 4 -0.160 -0.297 -0.106 -1.201 -0.265
2004 1 -0.248 -0.305 -0.053 -0.200 -0.208
2004 2 -0.170 -0.315 -0.269 0.253 -0.275
2004 3 -0.175 -0.234 0.096 0.550 -0.139
2004 4 -0.244 -0.306 0.164 0.729 -0.170
Table 49. Health inequality indices, Denmark, men
Year Quarter TIW CRWA TRWA PIW2 THLI
1992 2 -0.228 -0.637 -0.196 NA -0.198
1993 2 -0.183 -0.336 -0.156 -0.146 -0.141
1994 2 -0.314 0.333 0.028 NA 0.127
1995 2 -0.503 0.017 -0.163 NA -0.142
1996 2 -0.431 -0.434 -0.027 0.186 -0.149
1997 2 -0.373 -0.266 -0.441 NA -0.373
1998 2 -0.255 -0.241 -0.329 NA -0.273
1999 1 -0.322 0.033 -0.213 NA -0.138
1999 2 -0.172 -0.398 0.104 -0.784 -0.307
1999 3 -0.407 -0.342 -0.099 -0.210 -0.090
1999 4 -0.199 -0.182 0.054 0.001 -0.015
2000 1 -0.299 -0.029 -0.040 NA -0.028
2000 2 -0.360 0.239 -0.140 NA -0.022
2000 3 -0.159 -0.090 0.145 NA 0.020
2000 4 -0.407 -0.524 0.033 NA -0.146
2001 1 -0.263 -0.542 -0.024 NA -0.100
2001 2 -0.435 -0.566 -0.137 NA -0.376
2001 3 -0.298 -0.453 -0.296 NA -0.373
2001 4 -0.332 0.302 -0.095 NA 0.044
2002 1 -0.307 -0.086 0.260 NA 0.092
2002 2 -0.265 -0.321 -0.140 NA -0.218
2002 3 -0.313 -0.371 0.001 NA -0.192
2002 4 0.012 -0.447 -0.180 NA -0.269
2003 1 -0.157 -0.203 0.149 NA 0.005
2003 2 -0.463 -0.405 0.041 NA -0.255
2003 3 -0.230 -0.102 -0.239 NA -0.236
2003 4 -0.223 -0.565 0.030 NA -0.277
2004 1 -0.323 -0.573 -0.222 NA -0.342
2004 2 -0.480 -0.432 0.076 NA -0.229
2004 3 -0.095 -0.203 -0.152 NA -0.154
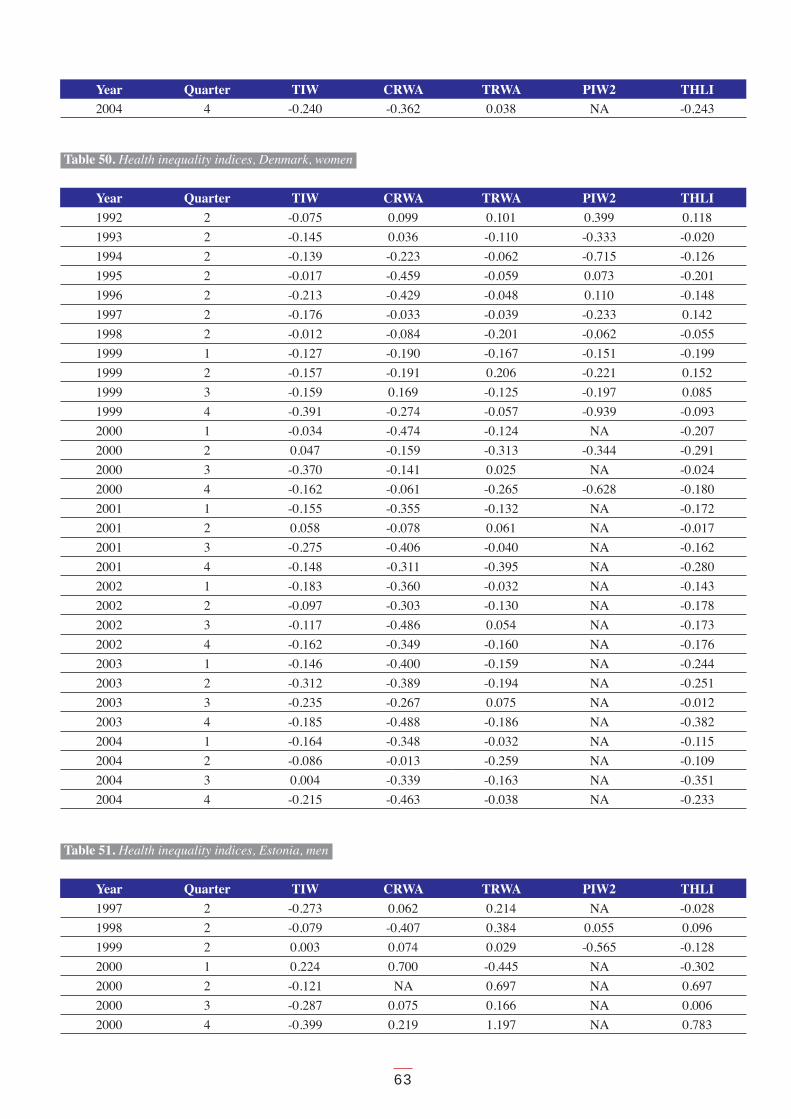
63
Year Quarter TIW CRWA TRWA PIW2 THLI2004 4 -0.240 -0.362 0.038 NA -0.243
Table 50. Health inequality indices, Denmark, women
Year Quarter TIW CRWA TRWA PIW2 THLI
1992 2 -0.075 0.099 0.101 0.399 0.118
1993 2 -0.145 0.036 -0.110 -0.333 -0.020
1994 2 -0.139 -0.223 -0.062 -0.715 -0.126
1995 2 -0.017 -0.459 -0.059 0.073 -0.201
1996 2 -0.213 -0.429 -0.048 0.110 -0.148
1997 2 -0.176 -0.033 -0.039 -0.233 0.142
1998 2 -0.012 -0.084 -0.201 -0.062 -0.055
1999 1 -0.127 -0.190 -0.167 -0.151 -0.199
1999 2 -0.157 -0.191 0.206 -0.221 0.152
1999 3 -0.159 0.169 -0.125 -0.197 0.085
1999 4 -0.391 -0.274 -0.057 -0.939 -0.093
2000 1 -0.034 -0.474 -0.124 NA -0.207
2000 2 0.047 -0.159 -0.313 -0.344 -0.291
2000 3 -0.370 -0.141 0.025 NA -0.024
2000 4 -0.162 -0.061 -0.265 -0.628 -0.180
2001 1 -0.155 -0.355 -0.132 NA -0.172
2001 2 0.058 -0.078 0.061 NA -0.017
2001 3 -0.275 -0.406 -0.040 NA -0.162
2001 4 -0.148 -0.311 -0.395 NA -0.280
2002 1 -0.183 -0.360 -0.032 NA -0.143
2002 2 -0.097 -0.303 -0.130 NA -0.178
2002 3 -0.117 -0.486 0.054 NA -0.173
2002 4 -0.162 -0.349 -0.160 NA -0.176
2003 1 -0.146 -0.400 -0.159 NA -0.244
2003 2 -0.312 -0.389 -0.194 NA -0.251
2003 3 -0.235 -0.267 0.075 NA -0.012
2003 4 -0.185 -0.488 -0.186 NA -0.382
2004 1 -0.164 -0.348 -0.032 NA -0.115
2004 2 -0.086 -0.013 -0.259 NA -0.109
2004 3 0.004 -0.339 -0.163 NA -0.351
2004 4 -0.215 -0.463 -0.038 NA -0.233
Table 51. Health inequality indices, Estonia, men
Year Quarter TIW CRWA TRWA PIW2 THLI
1997 2 -0.273 0.062 0.214 NA -0.028
1998 2 -0.079 -0.407 0.384 0.055 0.096
1999 2 0.003 0.074 0.029 -0.565 -0.128
2000 1 0.224 0.700 -0.445 NA -0.302
2000 2 -0.121 NA 0.697 NA 0.697
2000 3 -0.287 0.075 0.166 NA 0.006
2000 4 -0.399 0.219 1.197 NA 0.783

64
Year Quarter TIW CRWA TRWA PIW2 THLI2001 1 -0.038 -0.873 -0.843 NA -0.858
2001 2 0.065 -0.816 -0.067 NA -0.369
2001 3 0.796 0.304 -0.228 NA -0.095
2001 4 -0.255 -0.272 -0.768 NA -0.625
2002 1 -0.169 -0.551 NA NA -0.551
2002 2 -0.185 0.012 0.588 NA 0.396
2002 3 -0.153 0.611 NA NA 0.611
2002 4 -0.036 -0.781 NA NA -0.781
2003 1 -0.291 -0.774 NA -0.908 -0.818
2003 2 -0.272 0.329 NA NA 0.329
2003 3 -0.592 -0.245 NA NA -0.245
2003 4 -0.526 -0.865 0.127 NA -0.369
2004 1 0.343 -1.089 0.042 NA -0.241
2004 2 -0.311 -0.090 -1.306 NA -0.394
2004 3 -0.707 -0.075 0.829 NA 0.377
2004 4 -0.290 0.694 0.773 NA 0.747
Table 52. Health inequality indices, Estonia, women
Year Quarter TIW CRWA TRWA PIW2 THLI
1997 2 0.002 -0.693 -0.012 NA 0.039
1998 2 0.026 -0.711 -0.241 NA -0.387
1999 2 -0.285 -0.145 -0.625 NA -0.307
2000 1 -0.319 -0.430 -0.160 NA -0.301
2000 2 -0.737 -0.302 -0.449 NA -0.413
2000 3 -0.231 -0.251 -0.339 NA -0.239
2000 4 0.472 -0.202 0.255 NA -0.146
2001 1 -0.069 -0.199 -0.160 NA -0.218
2001 2 -1.002 -0.609 -0.709 NA -0.687
2001 3 0.195 -0.640 -0.362 NA -0.611
2001 4 -0.035 -0.406 0.224 NA -0.196
2002 1 0.118 -0.612 0.679 NA -0.289
2002 2 0.326 -0.617 0.978 NA -0.093
2002 3 -0.206 -0.551 0.581 NA -0.268
2002 4 -0.557 -0.476 -0.333 NA -0.396
2003 1 -0.239 -0.627 -0.434 NA -0.555
2003 2 -0.829 -1.071 1.078 NA 0.004
2003 3 0.403 NA -0.745 NA -0.745
2003 4 -0.184 -0.103 NA NA -0.103
2004 1 -0.633 -0.592 0.466 -0.348 -0.324
2004 2 -0.618 -0.750 -1.275 NA -0.779
2004 3 0.510 0.321 NA 0.644 0.321
2004 4 -0.576 0.506 NA NA 0.506

65
Table 53. Health inequality indices, Finland, men
Year Quarter TIW CRWA TRWA PIW2 THLI
1997 2 -0.286 -0.243 -0.167 NA -0.207
1998 1 NA NA NA NA NA
1998 2 -0.219 -0.874 0.208 NA -0.113
1998 3 NA NA NA NA NA
1998 4 NA NA NA NA NA
1999 1 -0.317 -0.197 -0.181 NA NA
1999 2 -0.136 -0.277 -0.217 -0.894 -0.200
1999 3 -0.151 0.009 -0.216 -0.253 -0.075
1999 4 -0.443 0.153 -0.037 NA -0.087
2000 1 -0.305 -0.096 -0.059 -0.231 -0.052
2000 2 -0.217 -0.162 0.048 0.057 -0.065
2000 3 -0.331 -0.037 -0.194 -0.895 -0.147
2000 4 -0.179 -0.045 -0.196 -0.382 -0.184
2001 1 -0.283 -0.044 -0.042 NA -0.047
2001 2 -0.362 -0.393 -0.079 -0.296 -0.073
2001 3 -0.285 -0.434 -0.017 -0.817 -0.183
2001 4 -0.192 -0.148 -0.112 0.423 -0.214
2002 1 -0.232 -0.116 0.010 -0.127 -0.035
2002 2 -0.195 -0.516 -0.154 -1.306 -0.245
2002 3 -0.177 -0.293 -0.235 0.524 -0.265
2002 4 -0.399 -0.490 -0.021 0.242 -0.083
2003 1 -0.538 -0.100 -0.445 -1.013 -0.386
2003 2 -0.477 0.344 -0.289 NA -0.066
2003 3 -0.555 -0.826 -0.506 -1.291 -0.539
2003 4 -0.426 -0.335 -0.352 NA -0.333
2004 1 -0.592 -0.407 -0.481 -1.181 -0.458
2004 2 -0.531 -0.410 -0.308 -0.403 -0.325
2004 3 -0.449 -0.492 -0.440 NA -0.398
2004 4 -0.475 -0.343 -0.439 -0.175 -0.418
Table 54. Health inequality indices, Finland, women
Year Quarter TIW CRWA TRWA PIW2 THLI
1997 2 -0.159 0.179 0.072 NA 0.028
1998 1 NA NA NA NA NA
1998 2 -0.108 -0.258 -0.319 NA -0.372
1998 3 NA NA NA NA NA
1998 4 NA NA NA NA NA
1999 1 -0.048 -0.112 -0.136 NA NA
1999 2 -0.117 0.027 0.060 -0.292 0.029
1999 3 -0.018 -0.328 -0.028 -0.742 -0.004
1999 4 -0.197 -0.237 -0.018 0.335 -0.017
2000 1 -0.184 -0.243 -0.031 -0.585 -0.020
2000 2 -0.061 0.008 0.110 0.098 0.066
2000 3 -0.139 -0.082 -0.049 NA -0.002
2000 4 -0.079 -0.119 -0.164 NA -0.118

66
Year Quarter TIW CRWA TRWA PIW2 THLI2001 1 -0.146 -0.066 -0.085 0.077 -0.060
2001 2 -0.183 -0.047 -0.069 -0.440 -0.021
2001 3 -0.136 -0.051 -0.144 -0.477 -0.028
2001 4 -0.111 -0.304 -0.033 -0.620 -0.078
2002 1 -0.313 -0.288 0.029 -0.165 -0.009
2002 2 -0.062 0.005 0.028 0.048 0.054
2002 3 -0.164 -0.242 0.183 -0.587 -0.022
2002 4 -0.107 -0.098 -0.003 -0.762 -0.011
2003 1 -0.325 -0.593 -0.202 0.409 -0.268
2003 2 -0.332 -0.235 -0.482 -0.628 -0.377
2003 3 -0.451 -0.349 -0.343 -0.428 -0.279
2003 4 -0.400 -0.101 -0.211 -0.405 -0.176
2004 1 -0.361 -0.355 -0.177 0.015 -0.243
2004 2 -0.336 -0.370 -0.225 0.137 -0.238
2004 3 -0.285 -0.093 -0.248 0.103 -0.204
2004 4 -0.418 -0.095 -0.226 -0.567 -0.196
Table 55. Health inequality indices, France, men
Year Quarter TIW CRWA TRWA PIW2 THLI
1992 1 -0.373 NA -0.029 -0.887 -0.030
1993 1 -0.184 NA -0.250 -0.075 -0.250
1994 1 -0.223 NA -0.239 -0.771 -0.239
1995 1 -0.225 NA -0.083 -0.614 -0.084
1996 1 -0.285 NA -0.197 NA -0.197
1997 1 -0.241 NA -0.289 NA -0.289
1998 1 -0.193 NA -0.182 -0.070 -0.179
1999 1 -0.282 NA -0.072 -0.745 -0.081
2000 1 -0.252 -0.344 -0.256 -0.275 -0.314
2001 1 -0.252 -0.430 -0.162 -0.110 -0.251
2002 1 -0.235 -0.428 -0.032 -0.592 -0.146
2003 1 -0.191 -0.413 -0.025 -0.333 -0.220
2003 2 -0.136 -0.268 -0.262 -0.006 -0.312
2003 3 -0.168 -0.359 -0.175 -1.034 -0.211
2003 4 -0.234 -0.417 -0.088 -0.914 -0.200
2004 1 -0.213 -0.485 -0.107 -0.385 -0.174
2004 2 -0.255 -0.282 -0.293 -0.850 -0.323
2004 3 -0.281 -0.248 -0.134 -0.108 -0.235
2004 4 -0.235 -0.413 -0.242 NA -0.289
Table 56. Health inequality indices, France, women
Year Quarter TIW CRWA TRWA PIW2 THLI
1992 1 -0.194 NA -0.133 0.847 -0.131
1993 1 0.001 NA -0.125 -0.459 -0.126
1994 1 -0.040 NA -0.123 -1.144 -0.125
1995 1 -0.007 NA -0.019 0.010 -0.020

67
Year Quarter TIW CRWA TRWA PIW2 THLI1996 1 -0.101 NA 0.022 0.960 0.025
1997 1 -0.054 NA -0.050 0.205 -0.049
1998 1 -0.087 NA 0.076 0.075 0.078
1999 1 -0.125 NA -0.108 -0.102 -0.114
2000 1 -0.141 -0.254 0.034 -0.299 -0.144
2001 1 -0.089 -0.121 -0.104 -0.404 -0.114
2002 1 -0.085 -0.187 -0.201 -0.121 -0.186
2003 1 0.009 -0.283 -0.206 0.072 -0.258
2003 2 0.037 -0.265 -0.283 -0.622 -0.278
2003 3 -0.041 -0.248 -0.167 -0.272 -0.191
2003 4 -0.128 -0.213 0.001 -0.179 -0.073
2004 1 -0.110 -0.244 -0.146 -0.098 -0.123
2004 2 -0.165 -0.238 -0.137 -0.360 -0.182
2004 3 -0.188 -0.204 -0.097 -0.029 -0.211
2004 4 -0.130 -0.075 0.075 NA -0.047
Table 57. Health inequality indices, Greece, men
Year Quarter TIW CRWA TRWA PIW2 THLI
1992 2 0.054 -0.334 -0.338 -0.219 -0.351
1993 2 -0.009 -0.062 -0.355 -0.144 -0.214
1994 2 -0.048 -0.481 -0.193 NA -0.310
1995 2 0.001 -0.337 -0.220 0.874 -0.235
1996 2 -0.264 -0.329 -0.324 0.785 -0.341
1997 2 0.072 -0.354 -0.121 NA -0.235
1998 1 -0.154 -0.346 -0.201 -0.517 -0.285
1998 2 -0.123 -0.402 -0.069 NA -0.286
1998 3 0.011 -0.494 0.072 0.694 -0.236
1998 4 -0.184 -0.188 0.046 NA 0.042
1999 1 -0.232 -0.168 -0.245 1.334 -0.009
1999 2 -0.384 -0.446 -0.328 0.306 -0.350
1999 3 -0.196 -0.206 -0.378 -0.622 -0.272
1999 4 -0.211 -0.196 -0.144 -1.102 -0.282
2000 1 -0.369 -0.230 0.130 NA -0.102
2000 2 -0.275 -0.109 -0.137 NA -0.158
2000 3 -0.348 -0.236 -0.055 NA -0.145
2000 4 -0.109 -0.351 -0.063 NA -0.387
2001 1 -0.019 -0.318 -0.061 NA -0.234
2001 2 0.199 -0.203 -0.427 NA -0.238
2001 3 0.215 -0.193 -0.222 NA -0.175
2001 4 -0.020 -0.316 0.135 NA -0.200
2002 1 -0.674 -0.931 0.094 NA -0.204
2002 2 -0.251 -0.704 -0.268 NA -0.412
2002 3 -0.296 -0.520 -0.269 NA -0.369
2002 4 -0.342 -0.447 -0.255 NA -0.394
2003 1 0.027 0.044 -0.358 NA -0.246
2003 2 0.212 -0.190 -0.384 NA -0.302
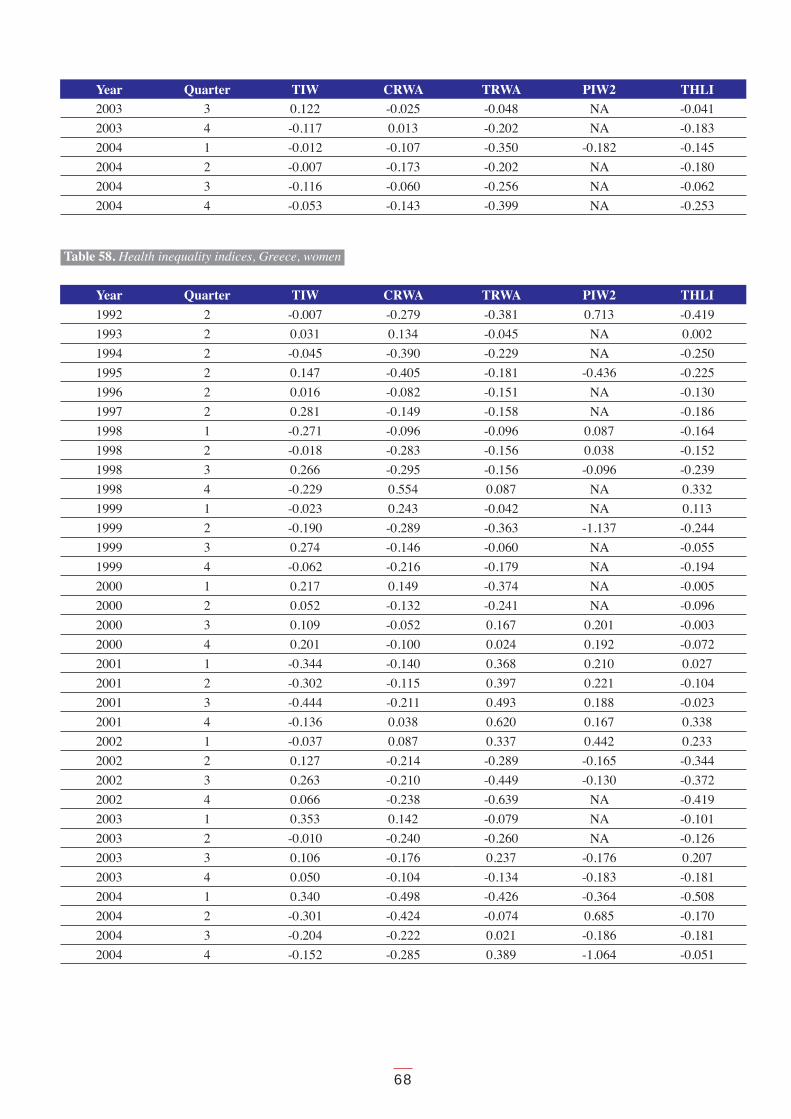
68
Year Quarter TIW CRWA TRWA PIW2 THLI2003 3 0.122 -0.025 -0.048 NA -0.041
2003 4 -0.117 0.013 -0.202 NA -0.183
2004 1 -0.012 -0.107 -0.350 -0.182 -0.145
2004 2 -0.007 -0.173 -0.202 NA -0.180
2004 3 -0.116 -0.060 -0.256 NA -0.062
2004 4 -0.053 -0.143 -0.399 NA -0.253
Table 58. Health inequality indices, Greece, women
Year Quarter TIW CRWA TRWA PIW2 THLI
1992 2 -0.007 -0.279 -0.381 0.713 -0.419
1993 2 0.031 0.134 -0.045 NA 0.002
1994 2 -0.045 -0.390 -0.229 NA -0.250
1995 2 0.147 -0.405 -0.181 -0.436 -0.225
1996 2 0.016 -0.082 -0.151 NA -0.130
1997 2 0.281 -0.149 -0.158 NA -0.186
1998 1 -0.271 -0.096 -0.096 0.087 -0.164
1998 2 -0.018 -0.283 -0.156 0.038 -0.152
1998 3 0.266 -0.295 -0.156 -0.096 -0.239
1998 4 -0.229 0.554 0.087 NA 0.332
1999 1 -0.023 0.243 -0.042 NA 0.113
1999 2 -0.190 -0.289 -0.363 -1.137 -0.244
1999 3 0.274 -0.146 -0.060 NA -0.055
1999 4 -0.062 -0.216 -0.179 NA -0.194
2000 1 0.217 0.149 -0.374 NA -0.005
2000 2 0.052 -0.132 -0.241 NA -0.096
2000 3 0.109 -0.052 0.167 0.201 -0.003
2000 4 0.201 -0.100 0.024 0.192 -0.072
2001 1 -0.344 -0.140 0.368 0.210 0.027
2001 2 -0.302 -0.115 0.397 0.221 -0.104
2001 3 -0.444 -0.211 0.493 0.188 -0.023
2001 4 -0.136 0.038 0.620 0.167 0.338
2002 1 -0.037 0.087 0.337 0.442 0.233
2002 2 0.127 -0.214 -0.289 -0.165 -0.344
2002 3 0.263 -0.210 -0.449 -0.130 -0.372
2002 4 0.066 -0.238 -0.639 NA -0.419
2003 1 0.353 0.142 -0.079 NA -0.101
2003 2 -0.010 -0.240 -0.260 NA -0.126
2003 3 0.106 -0.176 0.237 -0.176 0.207
2003 4 0.050 -0.104 -0.134 -0.183 -0.181
2004 1 0.340 -0.498 -0.426 -0.364 -0.508
2004 2 -0.301 -0.424 -0.074 0.685 -0.170
2004 3 -0.204 -0.222 0.021 -0.186 -0.181
2004 4 -0.152 -0.285 0.389 -1.064 -0.051

69
Table 59. Health inequality indices, Hungary, men
Year Quarter TIW CRWA TRWA PIW2 THLI
1996 2 -0.062 -0.455 -0.054 NA NA
1997 2 -0.254 -0.250 -0.153 -0.365 -0.291
1998 2 -0.165 -0.329 0.131 0.742 -0.107
1999 1 -0.205 -0.259 0.098 0.276 -0.126
1999 2 -0.116 -0.277 0.036 -0.260 -0.173
1999 3 -0.049 -0.238 -0.107 NA -0.231
1999 4 -0.162 -0.190 -0.038 0.690 -0.257
2000 1 -0.142 -0.158 NA -1.269 -0.158
2000 2 -0.107 -0.156 NA 0.532 -0.155
2000 3 -0.107 0.011 NA 0.579 0.011
2000 4 -0.134 -0.082 NA NA -0.082
2001 1 -0.181 -0.058 -0.020 NA -0.058
2001 2 -0.009 -0.044 -0.414 NA -0.146
2001 3 -0.272 -0.083 -0.247 NA -0.097
2001 4 -0.226 -0.254 -0.227 NA -0.185
2002 1 -0.485 -0.113 -0.253 NA -0.134
2002 2 -0.408 -0.047 -0.207 NA -0.086
2002 3 -0.245 0.043 0.173 NA 0.070
2002 4 -0.012 -0.091 -0.310 NA -0.166
2003 1 -0.280 -0.117 0.175 NA 0.011
2003 2 -0.225 -0.151 -0.082 NA -0.101
2003 3 -0.249 -0.159 -0.221 NA -0.170
2003 4 -0.157 -0.158 0.008 -0.804 -0.103
2004 1 -0.209 -0.106 0.013 NA -0.098
2004 2 -0.186 -0.150 -0.190 NA -0.152
2004 3 -0.060 -0.183 -0.085 NA -0.150
2004 4 -0.168 -0.172 -0.030 NA -0.168
Table 60. Health inequality indices, Hungary, women
Year Quarter TIW CRWA TRWA PIW2 THLI
1996 2 -0.098 -0.390 0.056 NA NA
1997 2 0.058 -0.370 -0.209 0.293 -0.282
1998 2 -0.177 -0.519 -0.070 -0.342 -0.315
1999 1 -0.211 -0.436 -0.027 -0.095 -0.191
1999 2 -0.180 -0.488 -0.202 -0.120 -0.321
1999 3 -0.168 -0.476 -0.062 -0.109 -0.318
1999 4 -0.190 -0.518 0.061 -0.797 -0.290
2000 1 0.026 -0.345 NA NA -0.345
2000 2 -0.165 -0.413 NA 0.103 -0.400
2000 3 -0.239 -0.326 NA NA -0.326
2000 4 -0.179 -0.385 NA 0.746 -0.384
2001 1 -0.365 -0.334 -0.079 NA -0.206
2001 2 -0.284 -0.413 -0.465 NA -0.450
2001 3 -0.326 -0.309 -0.249 NA -0.304
2001 4 -0.151 -0.312 -0.187 NA -0.250
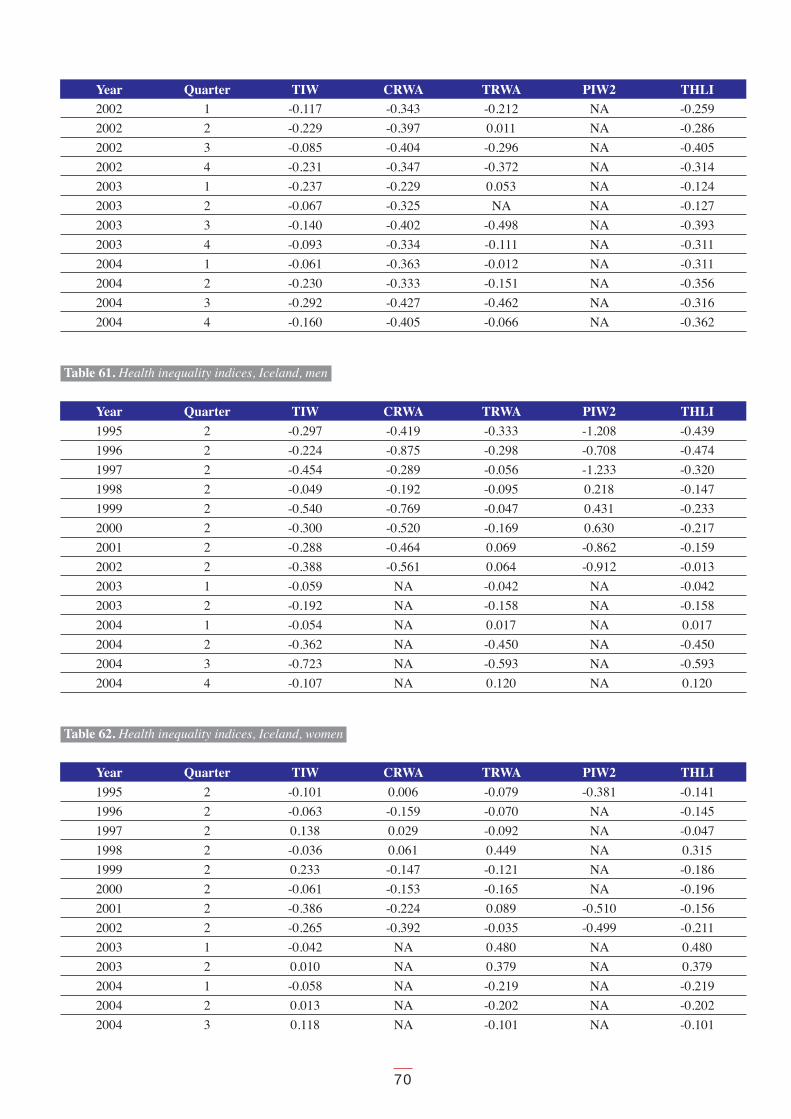
70
Year Quarter TIW CRWA TRWA PIW2 THLI2002 1 -0.117 -0.343 -0.212 NA -0.259
2002 2 -0.229 -0.397 0.011 NA -0.286
2002 3 -0.085 -0.404 -0.296 NA -0.405
2002 4 -0.231 -0.347 -0.372 NA -0.314
2003 1 -0.237 -0.229 0.053 NA -0.124
2003 2 -0.067 -0.325 NA NA -0.127
2003 3 -0.140 -0.402 -0.498 NA -0.393
2003 4 -0.093 -0.334 -0.111 NA -0.311
2004 1 -0.061 -0.363 -0.012 NA -0.311
2004 2 -0.230 -0.333 -0.151 NA -0.356
2004 3 -0.292 -0.427 -0.462 NA -0.316
2004 4 -0.160 -0.405 -0.066 NA -0.362
Table 61. Health inequality indices, Iceland, men
Year Quarter TIW CRWA TRWA PIW2 THLI
1995 2 -0.297 -0.419 -0.333 -1.208 -0.439
1996 2 -0.224 -0.875 -0.298 -0.708 -0.474
1997 2 -0.454 -0.289 -0.056 -1.233 -0.320
1998 2 -0.049 -0.192 -0.095 0.218 -0.147
1999 2 -0.540 -0.769 -0.047 0.431 -0.233
2000 2 -0.300 -0.520 -0.169 0.630 -0.217
2001 2 -0.288 -0.464 0.069 -0.862 -0.159
2002 2 -0.388 -0.561 0.064 -0.912 -0.013
2003 1 -0.059 NA -0.042 NA -0.042
2003 2 -0.192 NA -0.158 NA -0.158
2004 1 -0.054 NA 0.017 NA 0.017
2004 2 -0.362 NA -0.450 NA -0.450
2004 3 -0.723 NA -0.593 NA -0.593
2004 4 -0.107 NA 0.120 NA 0.120
Table 62. Health inequality indices, Iceland, women
Year Quarter TIW CRWA TRWA PIW2 THLI
1995 2 -0.101 0.006 -0.079 -0.381 -0.141
1996 2 -0.063 -0.159 -0.070 NA -0.145
1997 2 0.138 0.029 -0.092 NA -0.047
1998 2 -0.036 0.061 0.449 NA 0.315
1999 2 0.233 -0.147 -0.121 NA -0.186
2000 2 -0.061 -0.153 -0.165 NA -0.196
2001 2 -0.386 -0.224 0.089 -0.510 -0.156
2002 2 -0.265 -0.392 -0.035 -0.499 -0.211
2003 1 -0.042 NA 0.480 NA 0.480
2003 2 0.010 NA 0.379 NA 0.379
2004 1 -0.058 NA -0.219 NA -0.219
2004 2 0.013 NA -0.202 NA -0.202
2004 3 0.118 NA -0.101 NA -0.101

71
Year Quarter TIW CRWA TRWA PIW2 THLI
2004 4 -0.356 NA -0.031 NA -0.031
Table 63. Health inequality indices, Ireland, men
Year Quarter TIW CRWA TRWA PIW2 THLI
1992 2 -0.060 -0.624 0.024 0.313 -0.190
1993 2 -0.184 -0.220 -0.030 NA -0.075
1994 2 -0.090 -0.112 -0.040 NA -0.052
1995 2 -0.075 -0.006 0.083 NA 0.066
1996 2 -0.106 -0.277 -0.084 NA -0.126
1997 2 -0.121 -0.353 -0.135 NA -0.135
1998 2 -0.275 -0.274 0.087 NA -0.143
1999 2 -0.292 -0.267 -0.084 NA -0.191
1999 3 -0.243 -0.395 0.323 NA -0.171
1999 4 -0.255 -0.409 -0.472 NA -0.373
2000 1 -0.250 -0.336 0.115 NA -0.099
2000 2 -0.361 -0.544 0.075 NA -0.328
2000 3 -0.187 -0.326 0.083 NA -0.231
2000 4 -0.262 -0.251 -0.010 NA -0.227
2001 1 -0.225 -0.304 -0.007 NA -0.099
2001 2 -0.266 -0.381 -0.134 NA -0.280
2001 3 -0.355 -0.334 -0.502 NA -0.450
2001 4 -0.302 -0.239 0.033 NA -0.141
2002 1 -0.332 -0.152 -0.051 NA -0.117
2002 2 -0.300 -0.267 -0.315 NA -0.336
2002 3 -0.256 -0.132 0.103 NA -0.103
2002 4 -0.397 -0.274 0.108 NA -0.110
2003 1 -0.231 -0.376 -0.137 NA -0.208
2003 2 -0.347 -0.293 -0.247 NA -0.287
2003 3 -0.206 -0.411 -0.108 NA -0.341
2003 4 -0.233 -0.365 0.039 NA -0.188
2004 1 -0.306 -0.268 -0.092 NA -0.160
2004 2 -0.178 -0.108 -0.147 NA -0.182
2004 3 -0.250 0.008 -0.405 NA -0.139
2004 4 -0.244 -0.093 -0.151 NA -0.179
Table 64. Health inequality indices, Ireland, women
Year Quarter TIW CRWA TRWA PIW2 THLI
1992 2 -0.043 -0.143 0.028 NA -0.028
1993 2 -0.031 -0.107 -0.256 NA -0.137
1994 2 0.016 -0.182 -0.033 NA -0.099
1995 2 -0.033 0.157 0.226 NA 0.106
1996 2 -0.069 0.053 0.003 NA -0.001
1997 2 0.062 -0.113 0.052 NA 0.074
1998 2 -0.165 -0.387 -0.013 NA -0.228
1999 2 -0.122 -0.372 -0.076 NA -0.224

72
Year Quarter TIW CRWA TRWA PIW2 THLI1999 3 -0.082 -0.107 0.324 NA 0.011
1999 4 -0.176 -0.149 -0.461 NA -0.230
2000 1 -0.110 -0.074 -0.096 NA -0.077
2000 2 -0.099 -0.219 0.161 NA -0.075
2000 3 -0.045 0.054 -0.205 NA -0.007
2000 4 -0.027 -0.279 -0.019 NA -0.206
2001 1 -0.063 -0.368 -0.073 NA -0.235
2001 2 -0.051 -0.274 -0.307 NA -0.242
2001 3 -0.138 -0.199 -0.434 NA -0.249
2001 4 -0.126 -0.328 -0.259 NA -0.306
2002 1 -0.088 -0.379 0.028 NA -0.123
2002 2 -0.021 -0.328 0.096 NA -0.065
2002 3 -0.070 -0.212 0.064 NA -0.034
2002 4 -0.081 -0.168 -0.458 NA -0.247
2003 1 -0.030 -0.273 NA NA -0.204
2003 2 -0.187 -0.208 0.015 NA -0.105
2003 3 -0.187 -0.371 -0.057 NA -0.262
2003 4 -0.118 -0.337 -0.257 NA -0.334
2004 1 -0.054 -0.240 0.074 NA -0.073
2004 2 -0.112 -0.346 0.169 NA -0.214
2004 3 -0.187 -0.490 -0.013 NA -0.306
2004 4 -0.146 -0.253 0.230 NA -0.074
Table 65. Health inequality indices, Italy, men
Year Quarter TIW CRWA TRWA PIW2 THLI
1992 3 -0.172 -0.135 -0.148 -0.411 -0.156
1993 2 -0.191 -0.263 -0.201 0.257 -0.220
1994 2 -0.213 -0.083 -0.150 NA -0.132
1995 2 -0.158 -0.593 -0.158 0.167 -0.228
1996 2 -0.153 -0.337 -0.264 -0.259 -0.294
1997 2 -0.219 -0.074 -0.218 0.110 -0.169
1998 1 -0.228 0.090 -0.031 -0.826 -0.014
1998 2 -0.141 -0.189 -0.226 -0.844 -0.202
1998 3 -0.265 -0.085 -0.197 0.133 -0.147
1998 4 -0.141 -0.204 -0.188 -0.338 -0.195
1999 1 -0.160 0.136 -0.206 -0.785 -0.180
1999 2 -0.241 -0.062 -0.060 -0.370 -0.060
1999 3 -0.116 -0.244 -0.333 -0.258 -0.300
1999 4 -0.096 -0.068 -0.085 -1.040 -0.064
2000 1 -0.164 -0.231 -0.092 -0.282 -0.149
2000 2 -0.145 -0.194 -0.232 -0.472 -0.215
2000 3 -0.266 -0.159 -0.149 NA -0.090
2000 4 -0.253 -0.122 -0.133 -0.204 -0.104
2001 1 -0.237 -0.399 -0.263 -0.266 -0.276
2001 2 -0.193 -0.202 -0.216 -0.783 -0.210
2001 3 -0.217 0.030 -0.167 0.307 -0.095

73
Year Quarter TIW CRWA TRWA PIW2 THLI
2001 4 -0.208 -0.285 -0.242 -0.799 -0.275
2002 1 -0.201 -0.374 -0.179 -1.258 -0.230
2002 2 -0.117 -0.393 -0.151 -0.801 -0.232
2002 3 -0.229 -0.005 -0.256 -0.808 -0.156
2002 4 -0.130 -0.092 -0.225 0.236 -0.210
2003 1 -0.096 -0.199 -0.145 -0.528 -0.145
2003 2 -0.144 0.010 -0.161 NA -0.073
2003 3 -0.141 -0.140 -0.364 NA -0.316
2003 4 -0.125 -0.188 -0.108 -0.821 -0.100
2004 1 -0.218 -0.163 -0.115 0.109 -0.135
2004 2 -0.189 -0.400 -0.114 -0.787 -0.194
2004 3 -0.180 -0.350 -0.271 -0.215 -0.300
2004 4 -0.209 -0.174 -0.011 -0.589 -0.030
Table 66. Health inequality indices, Italy, women
Year Quarter TIW CRWA TRWA PIW2 THLI
1992 3 -0.061 -0.341 -0.292 -0.447 -0.304
1993 2 -0.089 -0.332 -0.195 NA -0.233
1994 2 0.021 -0.181 -0.205 -0.058 -0.192
1995 2 -0.041 -0.174 -0.164 -0.156 -0.154
1996 2 -0.124 -0.253 -0.053 -0.241 -0.197
1997 2 -0.190 -0.180 -0.190 NA -0.242
1998 1 -0.131 -0.232 0.042 NA -0.012
1998 2 -0.071 -0.346 -0.025 0.351 -0.083
1998 3 -0.258 -0.521 -0.277 0.129 -0.402
1998 4 -0.096 -0.512 0.010 0.527 -0.152
1999 1 -0.183 -0.202 -0.125 -0.380 -0.162
1999 2 -0.219 -0.348 -0.164 -0.171 -0.184
1999 3 -0.214 -0.123 -0.054 -0.108 -0.074
1999 4 -0.106 -0.175 -0.087 0.044 -0.132
2000 1 -0.085 -0.095 -0.180 -0.096 -0.165
2000 2 0.006 -0.322 -0.067 -0.496 -0.129
2000 3 -0.143 -0.092 -0.119 0.039 -0.119
2000 4 -0.204 -0.105 -0.027 0.050 -0.036
2001 1 -0.124 -0.149 0.055 NA -0.019
2001 2 -0.117 -0.305 -0.136 NA -0.219
2001 3 -0.066 -0.286 -0.124 -0.479 -0.202
2001 4 -0.098 -0.167 -0.228 -0.419 -0.177
2002 1 -0.121 -0.140 0.102 -0.124 0.015
2002 2 -0.199 -0.157 -0.009 -0.733 -0.092
2002 3 -0.305 -0.409 -0.412 -0.002 -0.365
2002 4 -0.130 -0.147 -0.192 -0.122 -0.098
2003 1 -0.179 -0.306 -0.045 NA -0.128
2003 2 -0.091 -0.204 -0.230 -0.760 -0.229
2003 3 -0.025 -0.262 -0.052 -1.049 -0.235
2003 4 -0.055 -0.516 -0.154 NA -0.250

74
Year Quarter TIW CRWA TRWA PIW2 THLI2004 1 -0.221 -0.266 -0.269 -0.388 -0.311
2004 2 -0.239 -0.334 -0.203 -0.112 -0.320
2004 3 -0.128 -0.253 -0.166 -0.292 -0.203
2004 4 -0.190 -0.197 -0.053 -0.331 -0.172
Table 67. Health inequality indices, Latvia, men
Year Quarter TIW CRWA TRWA PIW2 THLI
1998 2 -0.283 -0.595 0.315 NA -0.480
1998 4 -0.139 -0.614 -0.212 NA -0.476
1999 2 -0.315 -0.608 -0.004 NA -0.507
1999 4 -0.164 -0.717 -0.299 NA -0.573
2000 2 -0.227 -0.769 0.021 NA -0.700
2000 4 0.440 -0.834 -0.430 NA -0.706
2001 2 0.402 -0.425 -0.828 NA -0.566
2001 4 -0.049 -0.704 0.073 NA -0.768
2002 1 0.123 -0.088 -0.016 NA 0.155
2002 2 0.055 -0.433 -0.244 0.626 -0.272
2002 3 -0.168 0.290 -0.343 NA 0.106
2002 4 0.403 -0.657 0.021 -1.242 -0.453
2003 1 -0.078 -1.160 -0.345 NA -0.504
2003 2 -0.346 -0.514 -0.319 -0.936 -0.390
2003 3 -0.284 -1.088 -0.777 1.365 -0.905
2003 4 -0.228 -0.537 -0.375 -1.214 -0.494
2004 1 -0.152 -0.695 -0.961 -0.802 -0.652
2004 2 -0.199 -0.098 -0.628 0.330 -0.188
2004 3 -0.755 -0.402 NA -0.645 -0.402
2004 4 -0.656 -0.215 NA NA -0.215
Table 68. Health inequality indices, Latvia, women
Year Quarter TIW CRWA TRWA PIW2 THLI
1998 2 -0.260 -0.608 0.281 NA -0.518
1998 4 -0.065 -0.600 -0.105 NA -0.451
1999 2 -0.348 -0.629 0.434 NA -0.274
1999 4 0.041 -0.613 0.052 NA -0.580
2000 2 0.074 -0.879 -0.299 NA -0.748
2000 4 -0.321 -0.480 -0.367 NA -0.438
2001 2 -0.039 -0.635 -0.407 NA -0.587
2001 4 -0.103 -0.626 -0.300 NA -0.605
2002 1 0.061 -0.117 -0.488 -0.262 -0.235
2002 2 -0.107 -0.506 -0.232 NA -0.369
2002 3 -0.500 -0.808 NA -0.622 -0.771
2002 4 -0.165 0.319 -0.013 NA 0.102
2003 1 -0.199 0.064 0.450 -0.158 0.032
2003 2 0.260 -0.319 NA NA -0.319
2003 3 0.027 -0.388 NA NA -0.388

75
Year Quarter TIW CRWA TRWA PIW2 THLI
2003 4 0.358 -0.153 -0.001 1.346 0.142
2004 1 0.005 -0.172 0.279 0.658 0.094
2004 2 -0.258 0.454 -0.538 -1.336 -0.095
2004 3 -0.744 -0.591 -0.195 NA -0.591
2004 4 -0.021 -0.372 -0.759 NA -0.372
Table 69. Health inequality indices, Lithuania, men
Year Quarter TIW CRWA TRWA PIW2 THLI
1998 2 -0.381 -0.615 NA NA -0.615
1998 4 0.125 -0.753 NA NA -0.753
1999 2 -0.281 NA 1.023 NA 1.023
1999 4 -0.130 NA 0.749 NA 0.749
2000 2 -0.425 0.475 -1.170 NA -0.347
2000 4 -0.005 -0.001 0.068 NA 0.200
2001 2 0.116 -0.640 -1.092 NA -0.734
2001 4 -0.186 -0.508 0.684 NA -0.210
2002 1 -0.401 -0.513 -0.616 NA -0.527
2002 2 0.230 -0.394 -1.135 NA -0.445
2002 3 0.122 -0.249 NA NA -0.249
2002 4 -0.610 0.094 -0.794 NA -0.227
2003 1 0.031 -0.286 NA NA -0.286
2003 2 0.297 -0.326 0.630 NA -0.206
2003 3 -0.195 -0.335 -1.284 NA -0.493
2003 4 -0.181 0.352 NA NA 0.352
2004 1 -0.237 -0.299 -0.624 -1.267 -0.426
2004 2 -0.389 -0.315 0.663 NA -0.315
2004 3 0.149 -0.348 NA NA -0.348
2004 4 -0.234 -0.365 NA NA -0.365
Table 70. Health inequality indices, Lithuania, women
Year Quarter TIW CRWA TRWA PIW2 THLI
1998 2 -0.183 0.053 NA NA 0.053
1998 4 -0.229 -0.362 NA NA -0.362
1999 2 -0.269 NA -0.050 NA -0.050
1999 4 0.106 NA -0.070 NA -0.070
2000 2 0.193 0.199 NA NA 0.199
2000 4 0.394 -0.421 -1.205 NA -0.628
2001 2 0.040 -0.707 -0.625 NA -0.768
2001 4 0.043 0.026 -1.293 NA -0.298
2002 1 0.011 -0.545 -0.684 -0.692 -0.581
2002 2 -0.027 -0.055 -0.606 -0.203 -0.113
2002 3 0.088 -0.513 -1.025 NA -0.637
2002 4 -0.236 -0.945 1.187 NA -0.809
2003 1 -0.134 0.085 -0.351 -0.616 -0.107
2003 2 0.377 -0.600 -0.047 NA -0.501

76
Year Quarter TIW CRWA TRWA PIW2 THLI2003 3 -0.268 -0.501 NA NA -0.501
2003 4 -0.265 -0.247 -0.690 NA -0.432
2004 1 -0.541 -0.386 -0.320 NA -0.324
2004 2 0.069 -0.962 NA NA -0.962
2004 3 0.245 -0.397 NA NA -0.397
2004 4 -0.718 -0.450 0.049 -0.278 -0.459
Table 71. Health inequality indices, Luxembourg, men
Year Quarter TIW CRWA TRWA PIW2 THLI
1992 2 -0.392 -0.160 0.088 NA -0.039
1993 2 -0.392 -0.116 -0.448 -1.136 -0.279
1994 2 -0.217 -0.819 0.142 NA -0.132
1995 2 -0.402 0.645 0.150 NA 0.150
1996 2 -0.443 0.129 0.606 NA 0.507
1997 2 -0.346 NA -0.159 -0.478 -0.166
1998 2 -0.408 -0.102 0.125 NA -0.036
1999 2 -0.536 -0.384 -0.081 NA -0.120
2000 2 -0.467 -0.104 0.381 NA 0.297
2001 2 -0.456 0.467 -0.095 NA 0.040
2002 2 -0.482 -0.610 -0.411 NA -0.537
2003 1 -0.421 -0.557 -0.274 NA -0.330
2003 2 -0.421 -0.557 -0.274 NA -0.330
2004 1 -0.473 -0.315 -0.840 NA -0.402
2004 2 -0.473 -0.315 -0.840 NA -0.402
2004 3 -0.473 -0.315 -0.840 NA -0.402
2004 4 -0.473 -0.315 -0.840 NA -0.402
Table 72. Health inequality indices, Luxembourg, women
Year Quarter TIW CRWA TRWA PIW2 THLI
1992 2 -0.234 -0.767 -0.253 -0.517 -0.392
1993 2 NA 0.103 0.097 0.130 0.170
1994 2 -0.078 -0.410 0.011 NA -0.087
1995 2 -0.025 -0.154 -0.533 NA -0.290
1996 2 -0.207 -0.281 -0.434 NA -0.387
1997 2 -0.192 NA -0.230 NA -0.230
1998 2 -0.261 -0.725 -0.545 NA -0.590
1999 2 -0.253 -0.264 0.173 NA 0.016
2000 2 0.070 0.040 -0.155 NA -0.057
2001 2 -0.151 -0.401 0.198 NA -0.119
2002 2 0.150 -0.641 -0.483 NA -0.627
2003 1 -0.067 -0.410 0.220 NA -0.227
2003 2 -0.067 -0.410 0.220 NA -0.227
2004 1 -0.337 -0.180 0.511 NA -0.046
2004 2 -0.337 -0.180 0.511 NA -0.046
2004 3 -0.337 -0.180 0.511 NA -0.046

77
Year Quarter TIW CRWA TRWA PIW2 THLI2004 4 -0.337 -0.180 0.511 NA -0.046
Table 73. Health inequality indices, the Netherlands, men
Year Quarter TIW CRWA TRWA PIW2 THLI
1992 2 -0.258 -0.145 -0.110 NA -0.149
1993 2 -0.276 -0.231 -0.163 NA -0.199
1994 2 -0.280 -0.196 -0.089 0.254 -0.177
1995 2 -0.228 -0.299 -0.204 0.158 -0.227
1996 2 -0.299 -0.237 -0.102 0.412 -0.164
1997 2 -0.284 -0.318 -0.105 NA -0.181
1998 2 -0.204 -0.273 -0.046 NA -0.098
1999 2 -0.182 -0.240 -0.011 NA -0.128
2000 1 -0.159 -0.048 -0.099 NA -0.103
2000 2 -0.188 -0.380 -0.128 NA -0.163
2000 3 -0.221 -0.197 -0.039 NA -0.020
2000 4 -0.199 -0.193 -0.111 NA -0.102
2001 1 -0.220 -0.162 -0.088 1.556 -0.104
2001 2 -0.253 0.011 -0.120 0.754 -0.119
2001 3 -0.276 -0.153 -0.104 -0.500 -0.103
2001 4 -0.260 0.030 -0.123 0.132 -0.107
2002 1 -0.218 -0.110 -0.038 -0.253 -0.025
2002 2 -0.219 -0.337 -0.086 -0.214 -0.152
2002 3 -0.176 -0.165 -0.075 -0.353 -0.111
2002 4 -0.161 -0.310 -0.171 -0.665 -0.175
2003 1 -0.222 -0.229 -0.006 -0.984 -0.094
2003 2 -0.170 -0.375 -0.117 -0.769 -0.171
2003 3 -0.244 -0.218 -0.128 -0.311 -0.120
2003 4 -0.291 -0.474 -0.025 NA -0.093
2004 1 -0.271 -0.420 -0.045 0.988 -0.105
2004 2 -0.199 -0.373 -0.042 1.026 -0.101
2004 3 NA NA NA NA NA
2004 4 NA NA NA NA NA
Table 74. Health inequality indices, the Netherlands, women
Year Quarter TIW CRWA TRWA PIW2 THLI
1992 2 -0.055 -0.083 0.016 -0.434 -0.048
1993 2 -0.185 -0.072 -0.082 -1.241 -0.063
1994 2 -0.030 -0.070 -0.055 -0.320 -0.081
1995 2 -0.028 0.092 0.015 0.037 0.074
1996 2 -0.013 -0.121 -0.276 -0.341 -0.177
1997 2 -0.041 -0.011 -0.033 -0.495 -0.021
1998 2 -0.163 -0.123 0.255 0.954 -0.007
1999 2 -0.073 -0.040 -0.076 0.557 -0.036
2000 1 -0.108 -0.211 0.044 -0.349 -0.035
2000 2 -0.080 -0.021 0.084 -0.142 0.069

78
Year Quarter TIW CRWA TRWA PIW2 THLI2000 3 -0.093 0.073 0.076 NA 0.104
2000 4 -0.111 0.355 -0.029 0.316 0.105
2001 1 -0.145 0.040 0.028 -0.126 0.014
2001 2 -0.092 0.020 -0.014 0.519 -0.048
2001 3 -0.108 0.196 -0.142 -0.549 0.013
2001 4 -0.065 0.224 -0.014 -0.129 0.009
2002 1 -0.082 -0.232 0.115 -0.303 0.037
2002 2 -0.036 -0.159 -0.198 -0.507 -0.067
2002 3 -0.013 -0.284 -0.011 -0.124 -0.052
2002 4 -0.089 -0.163 -0.090 0.010 -0.029
2003 1 -0.099 -0.188 0.012 -0.857 -0.018
2003 2 -0.070 -0.138 -0.057 -0.425 -0.097
2003 3 -0.014 -0.196 0.013 -0.659 -0.072
2003 4 -0.088 -0.199 -0.016 -0.293 -0.056
2004 1 -0.157 -0.205 0.038 -0.550 -0.052
2004 2 -0.077 -0.241 0.080 -0.209 -0.018
2004 3 NA NA NA NA NA
2004 4 NA NA NA NA NA
Table 75. Health inequality indices, Norway, men
Year Quarter TIW CRWA TRWA PIW2 THLI
1996 2 -0.436 -0.525 -0.161 -1.000 -0.204
1997 2 -0.230 -0.073 -0.106 -0.355 -0.108
1998 2 -0.208 -0.361 0.071 -0.684 -0.064
1999 2 -0.430 -0.400 -0.115 -0.590 -0.256
2000 1 -0.316 -0.284 NA NA NA
2000 2 -0.258 -0.505 0.030 -0.245 -0.101
2000 3 -0.304 -0.470 NA NA NA
2000 4 -0.314 -0.231 NA NA NA
2001 1 -0.275 -0.360 NA NA NA
2001 2 -0.299 -0.327 -0.148 -0.368 -0.171
2001 3 -0.356 -0.280 NA NA NA
2001 4 -0.368 -0.459 NA NA NA
2002 1 -0.310 -0.569 NA NA NA
2002 2 -0.286 -0.553 -0.086 -0.255 -0.268
2002 3 -0.230 -0.251 NA NA NA
2002 4 -0.276 -0.364 NA NA NA
2003 1 -0.376 -0.301 NA NA NA
2003 2 -0.321 -0.374 -0.053 NA -0.098
2003 3 -0.276 -0.482 NA NA NA
2003 4 -0.284 -0.170 NA NA NA
2004 1 -0.335 -0.214 NA NA NA
2004 2 -0.334 -0.237 -0.145 NA -0.114
2004 3 -0.332 -0.570 NA NA NA
2004 4 -0.324 -0.481 NA NA NA

79
Table 76. Health inequality indices, Norway, women
Year Quarter TIW CRWA TRWA PIW2 THLI
1995 2 NA NA NA NA NA
1996 2 -0.140 -0.285 -0.035 -0.129 -0.058
1997 2 -0.106 0.262 0.015 -0.255 0.038
1998 2 -0.113 -0.244 0.069 -0.172 -0.015
1999 2 -0.177 -0.269 -0.062 -0.144 -0.124
2000 1 -0.080 -0.226 NA NA NA
2000 2 -0.144 -0.210 -0.082 -0.208 -0.182
2000 3 -0.106 -0.341 NA NA NA
2000 4 -0.070 -0.293 NA NA NA
2001 1 -0.123 -0.344 NA NA NA
2001 2 -0.063 -0.356 -0.102 0.168 -0.162
2001 3 -0.179 -0.301 NA NA NA
2001 4 -0.109 -0.311 NA NA NA
2002 1 -0.098 -0.410 NA NA NA
2002 2 -0.069 -0.244 -0.041 -0.531 -0.165
2002 3 -0.075 -0.312 NA NA NA
2002 4 -0.138 -0.352 NA NA NA
2003 1 -0.064 -0.341 NA NA NA
2003 2 -0.130 -0.410 0.003 NA -0.122
2003 3 -0.120 -0.321 NA NA NA
2003 4 -0.088 -0.275 NA NA NA
2004 1 -0.090 -0.344 NA NA NA
2004 2 -0.045 -0.307 -0.101 NA -0.180
2004 3 -0.184 -0.247 NA NA NA
2004 4 -0.094 -0.515 NA NA NA
Table 77. Health inequality indices, Poland, men
Year Quarter TIW CRWA TRWA PIW2 THLI
1997 2 0.130 -0.416 NA NA -0.416
1998 2 0.068 -0.508 NA NA -0.508
1999 1 -0.017 -0.230 NA NA -0.230
2000 1 -0.048 -0.449 NA NA -0.449
2000 2 -0.024 -0.188 NA NA -0.188
2000 3 0.030 -0.273 NA NA -0.273
2000 4 -0.064 -0.024 NA NA -0.024
2001 1 0.037 -0.163 -0.499 -0.719 -0.379
2001 2 -0.170 -0.356 -0.487 NA -0.312
2001 3 0.014 -0.234 -0.347 1.451 -0.166
2001 4 0.090 -0.278 -0.601 0.010 -0.347
2002 1 0.016 -0.243 -0.471 0.216 -0.250
2002 2 0.140 -0.143 -0.263 NA -0.149
2002 3 0.100 -0.211 -0.214 NA -0.202
2002 4 0.200 -0.111 -0.605 0.246 -0.253
2003 1 0.063 -0.275 0.495 -0.973 -0.164
2003 2 -0.043 -0.246 -0.239 NA -0.197

80
Year Quarter TIW CRWA TRWA PIW2 THLI2003 3 0.048 -0.265 -0.289 -1.116 -0.249
2003 4 -0.129 -0.396 -0.075 -1.099 -0.266
2004 1 -0.081 -0.482 0.089 -0.706 -0.334
2004 2 -0.195 -0.462 -0.418 -0.880 -0.438
2004 3 -0.054 -0.471 -0.296 -0.890 -0.425
2004 4 -0.175 -0.620 -0.221 -0.616 -0.581
Table 78. Health inequality indices, Poland, women
Year Quarter TIW CRWA TRWA PIW2 THLI
1997 2 0.093 -0.481 NA NA -0.481
1998 2 0.050 -0.477 NA NA -0.477
1999 1 -0.079 -0.447 NA NA -0.447
2000 1 0.079 -0.492 NA NA -0.492
2000 2 0.176 -0.495 NA NA -0.495
2000 3 0.104 -0.393 NA NA -0.393
2000 4 -0.004 -0.467 NA NA -0.467
2001 1 -0.157 -0.307 -0.231 0.365 -0.287
2001 2 0.147 -0.611 -0.582 -1.043 -0.522
2001 3 0.117 -0.547 -0.494 NA -0.515
2001 4 -0.071 -0.526 -0.215 -0.275 -0.471
2002 1 0.090 -0.523 -0.588 -0.394 -0.614
2002 2 0.207 -0.466 -0.484 NA -0.472
2002 3 0.056 -0.393 -0.621 NA -0.455
2002 4 -0.054 -0.612 -0.653 0.805 -0.572
2003 1 0.147 -0.542 -0.438 -1.020 -0.531
2003 2 -0.072 -0.451 -0.373 -0.952 -0.508
2003 3 -0.199 -0.340 -0.153 -0.880 -0.254
2003 4 0.250 -0.456 -0.400 -0.020 -0.473
2004 1 -0.039 -0.740 -0.227 -0.083 -0.464
2004 2 0.133 -0.527 -0.317 -0.119 -0.494
2004 3 -0.001 -0.517 -0.443 -0.121 -0.477
2004 4 -0.023 -0.519 -0.431 -0.095 -0.429
Table 79. Health inequality indices, Portugal, men
Year Quarter TIW CRWA TRWA PIW2 THLI
1992 2 -0.302 -0.103 -0.176 NA -0.167
1993 2 -0.194 -0.553 -0.368 NA -0.539
1994 2 -0.253 -0.592 -0.327 NA -0.509
1995 2 -0.187 -0.420 -0.229 NA -0.383
1996 2 -0.146 -0.440 -0.535 NA -0.477
1997 2 -0.166 -0.674 -0.280 NA -0.479
1998 1 -0.233 -0.669 -0.319 -0.316 -0.515
1998 2 -0.182 -0.725 -0.006 -0.239 -0.466
1998 3 -0.074 -0.699 -0.504 NA -0.654
1998 4 -0.104 -0.655 -0.423 -1.100 -0.630

81
Year Quarter TIW CRWA TRWA PIW2 THLI1999 1 -0.239 -0.801 -0.355 -0.763 -0.582
1999 2 -0.221 -0.765 -0.488 -0.436 -0.713
1999 3 -0.217 -0.718 -0.254 -1.149 -0.554
1999 4 -0.199 -0.681 -0.453 NA -0.668
2000 1 -0.278 -0.702 -0.210 NA -0.602
2000 2 -0.184 -0.820 -0.805 NA -0.812
2000 3 -0.117 -0.732 -0.209 -0.682 -0.664
2000 4 -0.214 -0.569 -0.201 -0.891 -0.453
2001 1 -0.153 -0.679 -0.225 NA -0.668
2001 2 -0.232 -0.702 -0.707 NA -0.697
2001 3 -0.186 -0.683 -0.518 -0.566 -0.661
2001 4 -0.126 -0.771 NA -0.502 -0.605
2002 1 -0.099 -0.746 -0.291 NA -0.602
2002 2 -0.098 -0.738 0.112 NA -0.545
2002 3 -0.125 -0.713 -0.411 NA -0.671
2002 4 -0.142 -0.830 -0.252 NA -0.663
2003 1 -0.277 -0.802 -0.354 NA -0.595
2003 2 -0.125 -0.737 -0.242 -0.548 -0.622
2003 3 -0.022 -0.634 -0.144 NA -0.553
2003 4 -0.182 -0.575 0.032 NA -0.432
2004 1 -0.160 -0.793 -0.317 NA -0.512
2004 2 -0.183 -0.738 -0.673 NA -0.695
2004 3 -0.140 -0.725 -0.107 NA -0.576
2004 4 -0.137 -0.850 -0.241 NA -0.634
Table 80. Health inequality indices, Portugal, women
Year Quarter TIW CRWA TRWA PIW2 THLI
1992 2 -0.061 -0.227 -0.187 NA -0.222
1993 2 -0.015 -0.343 -0.179 NA -0.258
1994 2 -0.042 -0.408 -0.264 NA -0.345
1995 2 -0.161 -0.278 -0.138 NA -0.189
1996 2 -0.101 -0.489 0.042 NA -0.347
1997 2 -0.040 -0.369 -0.199 NA -0.293
1998 1 -0.199 -0.371 -0.264 -0.124 -0.398
1998 2 -0.107 -0.417 -0.348 0.188 -0.235
1998 3 -0.206 -0.413 -0.694 -0.512 -0.516
1998 4 -0.188 -0.345 -0.526 NA -0.390
1999 1 -0.230 -0.575 -0.261 -0.538 -0.429
1999 2 -0.175 -0.576 -0.207 NA -0.472
1999 3 -0.255 -0.433 -0.293 -0.390 -0.558
1999 4 -0.329 -0.334 -0.340 0.154 -0.179
2000 1 -0.060 -0.152 -0.268 -0.193 -0.225
2000 2 -0.162 -0.200 -0.405 -0.539 -0.314
2000 3 -0.059 -0.183 -0.256 -0.553 -0.134
2000 4 -0.181 -0.145 0.104 NA 0.080
2001 1 -0.028 -0.674 -0.784 NA -0.667

82
Year Quarter TIW CRWA TRWA PIW2 THLI2001 2 -0.186 -0.714 -0.124 NA -0.558
2001 3 -0.138 -0.611 0.032 NA -0.515
2001 4 -0.047 -0.682 0.054 NA -0.529
2002 1 -0.161 -0.689 -0.698 NA -0.702
2002 2 -0.081 -0.689 -0.404 NA -0.501
2002 3 -0.121 -0.635 -0.349 NA -0.550
2002 4 0.041 -0.507 -0.123 0.150 -0.470
2003 1 -0.109 -0.518 -0.373 NA -0.514
2003 2 -0.076 -0.651 -0.416 NA -0.520
2003 3 -0.026 -0.321 -0.390 0.367 -0.310
2003 4 -0.080 -0.338 -0.361 NA -0.227
2004 1 -0.085 -0.406 -0.457 -1.272 -0.390
2004 2 -0.106 -0.655 -0.191 -1.276 -0.377
2004 3 -0.177 -0.630 -0.055 NA -0.371
2004 4 -0.147 -0.504 -0.278 NA -0.439
Table 81. Health inequality indices, Slovakia, men
Year Quarter TIW CRWA TRWA PIW2 THLI
1998 1 -0.346 0.015 -0.507 NA -0.126
1998 2 0.053 0.168 -0.023 NA 0.042
1998 3 -0.070 0.098 -0.343 NA 0.070
1998 4 -0.134 -0.328 0.121 NA -0.154
1999 1 -0.175 -0.250 -0.302 NA -0.242
1999 2 -0.158 -0.278 -0.286 NA -0.220
1999 3 -0.246 -0.341 -0.615 NA -0.385
1999 4 -0.288 0.114 -0.384 NA -0.146
2000 1 -0.131 0.128 -0.287 NA -0.179
2000 2 -0.244 0.070 -0.064 NA 0.032
2000 3 -0.186 0.047 -0.416 NA -0.067
2000 4 -0.291 -0.017 -0.231 NA -0.154
2001 1 -0.061 -0.200 -0.251 NA -0.213
2001 2 -0.032 -0.167 0.051 NA -0.086
2001 3 0.033 -0.015 -0.388 NA -0.014
2001 4 -0.083 -0.062 -0.025 NA -0.101
2002 1 -0.128 -0.149 0.016 NA -0.127
2002 2 -0.151 -0.263 0.007 NA -0.118
2002 3 -0.143 -0.138 -0.228 NA -0.162
2002 4 -0.013 -0.083 -0.104 NA -0.019
2003 1 -0.080 -0.059 -0.017 NA -0.132
2003 2 0.091 -0.151 -0.053 NA -0.098
2003 3 0.006 -0.169 -0.402 NA -0.094
2003 4 -0.230 -0.274 0.345 NA -0.021
2004 1 -0.001 -0.502 0.265 NA -0.201
2004 2 -0.354 -0.487 -0.188 NA -0.492
2004 3 -0.278 -0.230 0.494 NA -0.094
2004 4 -0.057 -0.316 -0.376 NA -0.290

83
Table 82. Health inequality indices, Slovakia, women
Year Quarter TIW CRWA TRWA PIW2 THLI
1998 1 -0.215 -0.426 0.030 NA -0.243
1998 2 -0.017 -0.505 -0.143 NA -0.386
1998 3 -0.260 -0.598 -0.217 NA -0.417
1998 4 -0.166 -0.557 -0.065 NA -0.477
1999 1 -0.039 -0.418 0.045 NA 0.005
1999 2 -0.007 -0.527 0.043 NA -0.204
1999 3 -0.152 -0.536 0.229 NA -0.360
1999 4 0.110 -0.592 -0.194 NA -0.443
2000 1 -0.060 -0.456 0.180 NA -0.049
2000 2 -0.200 -0.497 0.486 NA -0.242
2000 3 -0.255 -0.417 0.238 NA -0.257
2000 4 0.006 -0.463 -0.421 NA -0.490
2001 1 -0.340 -0.516 -0.005 NA -0.371
2001 2 -0.121 -0.541 -0.009 NA -0.401
2001 3 -0.007 -0.515 -0.348 NA -0.539
2001 4 -0.101 -0.580 0.074 NA -0.392
2002 1 -0.261 -0.524 0.377 NA -0.283
2002 2 -0.308 -0.561 0.327 NA -0.245
2002 3 -0.269 -0.509 -0.029 NA -0.216
2002 4 -0.152 -0.532 0.449 NA -0.130
2003 1 -0.202 -0.575 -0.065 NA -0.435
2003 2 -0.254 -0.554 -0.049 NA -0.338
2003 3 -0.291 -0.397 -0.555 NA -0.423
2003 4 -0.301 -0.410 -0.316 NA -0.247
2004 1 -0.361 -0.551 -0.100 NA -0.431
2004 2 -0.084 -0.600 -0.229 NA -0.441
2004 3 -0.213 -0.629 -0.593 NA -0.530
2004 4 -0.202 -0.486 -0.403 NA -0.433
Table 83. Health inequality indices, Slovenia, men
Year Quarter TIW CRWA TRWA PIW2 THLI
1996 2 -0.225 NA 0.009 -0.183 0.026
1997 2 -0.120 NA 0.013 NA 0.013
1998 2 -0.249 NA 0.174 -0.870 0.164
1999 1 -0.176 NA 0.170 NA 0.170
1999 2 -0.030 NA 0.336 0.786 0.341
1999 3 -0.027 NA -0.346 0.458 -0.314
1999 4 0.012 NA -0.098 -0.998 -0.140
2000 1 -0.078 NA -0.202 -0.667 -0.203
2000 2 -0.018 NA -0.041 -1.067 -0.047
2000 3 -0.104 NA 0.111 -1.376 0.105
2000 4 -0.055 NA 0.063 -0.789 0.062
2001 1 -0.208 NA 0.213 NA 0.213
2001 2 0.023 NA -0.205 -1.184 -0.208
2001 3 -0.056 NA -0.273 NA -0.273

84
Year Quarter TIW CRWA TRWA PIW2 THLI
2001 4 -0.080 NA -0.151 -0.021 -0.148
2002 1 0.037 NA -0.106 -0.129 -0.124
2002 2 -0.296 NA -0.102 NA -0.102
2002 3 0.024 NA -0.589 0.688 -0.584
2002 4 -0.057 NA 0.059 0.464 0.059
2003 1 -0.135 NA 0.096 0.058 0.114
2003 2 -0.199 NA -0.053 -1.222 -0.087
2003 3 -0.242 NA -0.114 NA -0.114
2003 4 -0.237 NA -0.252 -0.110 -0.240
2004 1 -0.016 NA -0.004 1.240 0.002
2004 2 0.046 NA -0.232 0.292 -0.227
2004 3 0.065 NA -0.396 -1.182 -0.403
2004 4 0.146 NA -0.074 0.754 -0.070
Table 84. Health inequality indices, Slovenia, women
Year Quarter TIW CRWA TRWA PIW2 THLI
1996 2 -0.084 NA -0.105 0.130 -0.076
1997 2 -0.286 NA -0.224 -0.656 -0.230
1998 2 0.068 NA 0.213 -0.648 0.095
1999 1 0.140 NA 0.092 -0.033 0.095
1999 2 0.194 NA -0.143 -0.818 -0.147
1999 3 0.006 NA -0.190 0.826 -0.175
1999 4 0.084 NA 0.345 NA 0.345
2000 1 0.239 NA -0.084 NA -0.084
2000 2 0.017 NA -0.222 -0.764 -0.234
2000 3 -0.233 NA -0.268 -0.134 -0.267
2000 4 -0.225 NA -0.244 0.048 -0.241
2001 1 0.143 NA 0.096 NA 0.096
2001 2 0.009 NA -0.061 NA -0.061
2001 3 0.124 NA -0.053 -0.106 -0.051
2001 4 0.035 NA -0.155 NA -0.155
2002 1 0.183 NA -0.106 -0.898 -0.115
2002 2 -0.007 NA -0.100 0.776 -0.096
2002 3 -0.030 NA 0.098 NA 0.098
2002 4 -0.054 NA -0.154 NA -0.154
2003 1 -0.113 NA 0.286 NA 0.286
2003 2 -0.077 NA 0.035 NA 0.035
2003 3 -0.146 NA -0.291 NA -0.291
2003 4 -0.056 NA 0.196 -0.104 0.209
2004 1 0.196 NA -0.153 NA -0.153
2004 2 0.040 NA -0.176 NA -0.176
2004 3 -0.055 NA 0.223 NA 0.223
2004 4 0.051 NA 0.261 0.897 0.270

85
Table 85. Health inequality indices, Spain, men
Year Quarter TIW CRWA TRWA PIW2 THLI
1992 2 -0.096 -0.259 0.078 -0.374 -0.074
1993 2 -0.186 -0.397 -0.339 0.895 -0.386
1994 2 -0.135 0.014 -0.147 0.313 -0.174
1995 2 -0.232 -0.166 -0.230 NA -0.275
1996 2 -0.080 -0.261 -0.199 -0.548 -0.218
1997 2 -0.172 -0.389 -0.188 0.574 -0.282
1998 1 -0.256 -0.392 -0.213 -0.249 -0.282
1998 2 -0.157 -0.189 -0.357 -0.614 -0.355
1998 3 -0.133 -0.387 -0.074 -0.587 -0.213
1998 4 -0.210 0.060 -0.229 -1.174 -0.210
1999 1 -0.205 -0.316 -0.147 NA -0.189
1999 2 -0.158 -0.149 -0.165 -0.484 -0.184
1999 3 -0.206 -0.537 -0.248 -0.708 -0.383
1999 4 -0.262 -0.605 -0.156 -0.919 -0.200
2000 1 -0.180 -0.614 -0.180 -0.560 -0.297
2000 2 -0.224 -0.597 -0.365 -0.130 -0.428
2000 3 -0.222 -0.534 -0.263 -0.841 -0.408
2000 4 -0.125 -0.684 -0.325 -0.087 -0.386
2001 1 -0.236 -0.263 -0.309 -0.541 -0.223
2001 2 -0.194 -0.115 -0.301 -0.368 -0.164
2001 3 -0.223 -0.261 -0.238 -0.106 -0.205
2001 4 -0.211 -0.375 -0.097 0.796 -0.247
2002 1 -0.179 -0.220 -0.022 -0.377 -0.152
2002 2 -0.176 -0.088 -0.157 -0.173 -0.089
2002 3 -0.218 0.262 -0.388 NA -0.190
2002 4 -0.218 -0.034 -0.295 0.598 -0.194
2003 1 -0.185 -0.049 -0.117 0.215 -0.125
2003 2 -0.215 0.001 -0.102 -0.728 -0.172
2003 3 -0.206 -0.219 -0.321 0.176 -0.320
2003 4 -0.220 -0.091 -0.416 -0.458 -0.369
2004 1 -0.215 -0.143 -0.117 -0.248 -0.153
2004 2 -0.133 -0.005 -0.070 -0.741 -0.079
2004 3 -0.193 -0.155 -0.187 -0.362 -0.359
2004 4 -0.170 0.017 0.136 -0.185 0.109
Table 86. Health inequality indices, Spain, women
Year Quarter TIW CRWA TRWA PIW2 THLI
1992 2 -0.068 -0.222 -0.558 -0.369 -0.486
1993 2 0.012 -0.272 0.047 0.017 -0.186
1994 2 -0.123 -0.322 -0.228 0.673 -0.223
1995 2 -0.068 -0.104 0.037 -0.057 0.006
1996 2 -0.118 -0.260 -0.208 0.146 -0.159
1997 2 -0.195 -0.323 -0.257 -0.143 -0.250
1998 1 -0.114 0.029 -0.276 -0.259 -0.151
1998 2 -0.165 -0.146 -0.131 -0.829 -0.226

86
Year Quarter TIW CRWA TRWA PIW2 THLI1998 3 -0.151 -0.234 -0.297 -0.189 -0.292
1998 4 -0.125 -0.266 -0.503 -0.035 -0.339
1999 1 -0.077 -0.213 -0.285 -0.041 -0.294
1999 2 -0.088 -0.168 -0.238 -0.238 -0.162
1999 3 -0.106 0.112 -0.380 -0.266 -0.266
1999 4 -0.036 -0.245 -0.132 0.073 -0.166
2000 1 -0.150 -0.536 -0.263 0.356 -0.348
2000 2 -0.224 -0.542 -0.046 -0.318 -0.181
2000 3 -0.135 -0.349 0.005 -0.755 -0.191
2000 4 -0.155 -0.570 -0.391 -0.600 -0.481
2001 1 -0.097 -0.436 -0.336 0.847 -0.311
2001 2 -0.072 -0.550 -0.259 -0.370 -0.311
2001 3 -0.170 -0.052 -0.247 -0.098 -0.194
2001 4 -0.056 -0.471 -0.006 0.010 -0.188
2002 1 -0.146 -0.228 -0.348 -0.281 -0.380
2002 2 -0.181 -0.540 -0.069 -0.449 -0.185
2002 3 -0.153 -0.513 -0.291 -0.049 -0.458
2002 4 -0.049 -0.412 0.197 0.070 -0.093
2003 1 -0.160 -0.461 -0.035 0.226 -0.100
2003 2 -0.161 -0.400 -0.027 -0.435 -0.129
2003 3 -0.115 -0.299 -0.330 -0.493 -0.316
2003 4 -0.156 -0.134 -0.104 -0.268 -0.093
2004 1 -0.089 -0.329 0.134 0.185 0.030
2004 2 -0.125 -0.307 -0.186 -0.068 -0.301
2004 3 -0.179 -0.209 0.005 0.070 -0.071
2004 4 -0.192 -0.286 -0.266 0.036 -0.241
Table 87. Health inequality indices, Sweden, men
Year Quarter TIW CRWA TRWA PIW2 THLI
1997 2 -0.146 -0.486 -0.170 NA -0.263
1998 2 -0.195 -0.577 -0.267 0.961 -0.342
1999 2 -0.316 -0.391 -0.041 0.206 -0.124
2000 2 -0.460 -0.350 -0.212 0.026 -0.262
2001 1 -0.357 -0.207 -0.184 -0.141 -0.215
2001 2 -0.285 -0.143 -0.103 -0.147 -0.148
2001 3 -0.264 -0.413 -0.154 -0.662 -0.251
2001 4 -0.201 -0.214 -0.142 -0.934 -0.188
2002 1 -0.257 -0.287 -0.052 -0.338 -0.098
2002 2 -0.281 -0.147 -0.215 -0.609 -0.240
2002 3 -0.279 -0.274 -0.228 -0.496 -0.282
2002 4 -0.334 -0.130 -0.170 -0.559 -0.174
2003 1 -0.315 -0.270 -0.173 NA -0.244
2003 2 -0.294 -0.229 -0.202 NA -0.260
2003 3 -0.300 -0.394 -0.231 NA -0.299
2003 4 -0.303 -0.382 -0.149 NA -0.224
2004 1 -0.312 -0.299 -0.216 NA -0.267

87
Year Quarter TIW CRWA TRWA PIW2 THLI2004 2 -0.236 -0.241 -0.270 NA -0.297
2004 3 -0.311 -0.208 -0.147 NA -0.201
2004 4 -0.215 -0.386 -0.103 NA -0.155
Table 88. Health inequality indices, Sweden, women
Year Quarter TIW CRWA TRWA PIW2 THLI
1997 2 -0.144 -0.404 0.098 0.243 0.039
1998 2 -0.113 -0.331 -0.131 0.554 -0.145
1999 2 -0.174 -0.349 0.055 0.529 -0.076
2000 2 -0.219 -0.454 -0.005 0.234 -0.152
2001 1 -0.155 -0.290 -0.113 -0.203 -0.185
2001 2 -0.140 -0.326 -0.054 -0.138 -0.142
2001 3 -0.163 -0.256 -0.112 -0.331 -0.217
2001 4 -0.129 -0.202 -0.068 -0.294 -0.160
2002 1 -0.177 -0.209 0.017 0.104 -0.073
2002 2 -0.162 -0.254 -0.047 0.158 -0.119
2002 3 -0.173 -0.303 -0.001 0.155 -0.130
2002 4 -0.181 -0.287 -0.014 0.109 -0.122
2003 1 -0.176 -0.228 0.010 NA -0.058
2003 2 -0.182 -0.294 -0.039 NA -0.149
2003 3 -0.214 -0.257 -0.041 NA -0.155
2003 4 -0.131 -0.375 -0.038 NA -0.152
2004 1 -0.166 -0.325 -0.039 NA -0.133
2004 2 -0.203 -0.340 -0.043 NA -0.147
2004 3 -0.217 -0.325 -0.132 NA -0.232
2004 4 -0.142 -0.333 -0.021 NA -0.147

The WHO Regional
Offi ce for EuropeThe World Health Organization (WHO) is a specialized agency of the United Nations created in 1948 with the primary responsibility for international health matters and public health. The WHO Regional Offi ce for Europe is one of six regional offi ces throughout the world, each with its own programme geared to the particular health conditions of the countries it serves.
Member StatesAlbaniaAndorraArmeniaAustriaAzerbaijanBelarusBelgiumBosnia and HerzegovinaBulgariaCroatiaCyprusCzech RepublicDenmarkEstoniaFinlandFranceGeorgiaGermanyGreeceHungaryIcelandIrelandIsraelItalyKazakhstanKyrgyzstanLatviaLithuaniaLuxembourgMaltaMonacoMontenegroNetherlandsNorwayPolandPortugalRepublic of MoldovaRomaniaRussian FederationSan MarinoSerbiaSlovakiaSloveniaSpainSwedenSwitzerlandTajikistanThe former Yugoslav Republic of MacedoniaTurkeyTurkmenistanUkraineUnited KingdomUzbekistan
World Health OrganizationRegional Offi ce for Europe
Scherfi gsvej 8, DK-2100 Copenhagen Ø, Denmark
Tel.: +45 39 17 17 17.Fax: +45 39 17 18 18.
E-mail: [email protected] site: www.euro.who.int