wg11_petro
TRANSCRIPT
8/3/2019 wg11_petro
http://slidepdf.com/reader/full/wg11petro 1/164
Report of the Working Groupon Petroleum & Natural Gas
Sector for the XI Plan(2007-2012)
Ministry of Petroleum & Natural Gas
November 2006

8/3/2019 wg11_petro
http://slidepdf.com/reader/full/wg11petro 2/164
Report of the Working Group on Petroleum and Natural Gas for the XI Plan (2007 – 2012)
This page has been left blank intentionally.
8/3/2019 wg11_petro
http://slidepdf.com/reader/full/wg11petro 3/164
Report of the Working Group on Petroleum and Natural Gas for the XI Plan (2007 – 2012)
Report of Working Group onPetroleum & Natural Gas Sector for the XI Plan
(2007-2012)
Table of Contents
V
EXECUTIVE SUMMARY ......................................................................................................................6
1.1 Economy & Energy .....................................................................................................................6
1.2 International Scenario .................................................................................................................6
1.3 Indian Scenario ...........................................................................................................................7
1.4 Thrust Areas for the Petroleum and Natural Gas Sector ............................................................8
1.5 Acknowledgements ..................................................................................................................10
2 OVERVIEW OF PETROLEUM & NATURAL GAS SECTOR ..........................................................11
2.1 Background ..............................................................................................................................11
2.2 Global Scenario ........................................................................................................................11
2.3 Indian Scenario:........................................................................................................................ 17
3 PERFORMANCE REVIEW OF X PLAN PERIOD ...........................................................................26
3.1 Introduction ...............................................................................................................................26
3.2 Hydrocarbon Reserve Position .................................................................................................26
3.3 Crude Oil and Natural Gas Production .....................................................................................27
3.4 Implementation of New Exploration Licensing Policy (NELP) ..................................................29
3.5 Implementation of Coal Bed Methane (CBM) Policy .................................................................30
3.6 Equity Oil and Gas from Abroad ...............................................................................................30
3.7 Consumption of Petroleum Products during X Plan ..................................................................32
3.8 Refining Capacity .....................................................................................................................33
3.9 Investments ..............................................................................................................................34
4 REVIEW OF POLICY MEASURES ..................................................................................................37
4.1 Marketing and Distribution of Petroleum Products ...................................................................37
4.2 Marketing & Distribution of Natural Gas ....................................................................................40
4.3 Auto Fuel Policy .......................................................................................................................41
4.4 Safety & Environment Management......................................................................................... 42
4.5 Subsidy Structure .....................................................................................................................45
4.6 Regulatory Environment........................................................................................................... 47
4.7 Report of the Expert Committee on Integrated Energy Policy .................................................50
4.8 Dr. C Rangarajan Committee Report .......................................................................................53
4.9 Dr. V. Krishnamurty’s Report on Restructuring of Petroleum Sector .......................................58
5 THRUST AREAS FOR XI PLAN PERIOD .......................................................................................60
5.1 Major Thrust Areas for XI Plan Period ......................................................................................60
6 DEMAND - SUPPLY GAP ANALYSIS FOR XI PLAN PERIOD ......................................................64
Ministry of Petroleum and Natural Gas Page 3 of 164

8/3/2019 wg11_petro
http://slidepdf.com/reader/full/wg11petro 4/164
Report of the Working Group on Petroleum and Natural Gas for the XI Plan (2007 – 2012)
6.1 Demand for Petroleum Products ..............................................................................................64
6.2 Demand Supply Gap for Petroleum Products ...........................................................................67
6.3 Demand for Natural Gas ...........................................................................................................69
6.4 Demand – Supply Gap for Natural Gas ...................................................................................74
7 TOWARDS OIL AND GAS SECURITY ...........................................................................................77
7.1 Towards Oil Security ................................................................................................................77
7.2 Bio-fuels Programme ................................................................................................................77
7.3 Strategic Storage ......................................................................................................................80
7.4 Conservation of Products .........................................................................................................81
7.5 Alternative Sources of Energy ..................................................................................................83
8 TARGETS FOR XI PLAN PERIOD .................................................................................................88
8.1 Exploration and Development of Oil and Gas ...........................................................................88
8.2 Crude Oil and Natural Gas Production .....................................................................................89
8.3 Equity Oil and Gas Abroad .......................................................................................................90
8.4 Refining Capacity Additions ......................................................................................................93
8.5 Crude Oil Requirements and Imports ......................................................................................95
9 MANPOWER PLANNING FOR XI PLAN AND BEYOND ..............................................................100
9.1 Planning for Sustained Availability of Knowledge Workers for the Oil and Gas Industry ... .....100
9.2 Servicing E&P Activities in India .............................................................................................104
10 RESEARCH & DEVELOPMENT FOCUS DURING XI PLAN ......................................................106
10.1 Internationalization of R&D ...................................................................................................106
10.2 Drivers of Global R&D.......................................................................................................... 106
10.3 R&D in developing countries ................................................................................................107
10.4 Exploration & Development .................................................................................................108
10.5 Natural Gas Sector ...............................................................................................................109
10.6 Refining Sector .....................................................................................................................110
10.7 R&D – Way Forward .............................................................................................................112
11 INVESTMENT REQUIREMENT AND INFRASTRUCTURE DEVELOPMENT ...........................114
11.1 Exploration and Production Sector ......................................................................................114
11.2 Refining and Marketing Sector .............................................................................................115
11.3 Natural Gas Sector ..............................................................................................................118
12 CONCLUSIONS & SUGGESTIONS ...........................................................................................123
12.1 Exploration & Production Sector ...........................................................................................123
12.2 Natural Gas Sector ...............................................................................................................123
12.3 Refining Sector .....................................................................................................................125
12.4 Marketing Sector ..................................................................................................................127
12.5 Others ..................................................................................................................................127
13 ANNEXURE ..................................................................................................................................128
13.1 Annexure I – Constitution of the Working Group ..................................................................128
13.2 Annexure II (a) – Constitution of Working Sub Groups .........................................................133
13.3 Annexure II (b) –Sub Group on E&P .....................................................................................136
13.4 Annexure II (c) –Sub Group on NG and Marketing ...............................................................137
13.5 Annexure III - Energy Policy in Asian Economies .................................................................139
13.6 Annexure IV - Herfindahl-Hirschman Index (HHI) .................................................................144
13.7 Annexure V - Year Wise, Product Wise Comparison of Actual & X Plan Projections ...........145
13.8 Annexure VI - Demand Projections by Various Agencies .....................................................146
Ministry of Petroleum and Natural Gas Page 4 of 164

8/3/2019 wg11_petro
http://slidepdf.com/reader/full/wg11petro 5/164
Report of the Working Group on Petroleum and Natural Gas for the XI Plan (2007 – 2012)
13.9 Annexure VII - Demand For Petroleum Products During The XI Plan & Beyond ..................147
13.10 Annexure VIII - Potential for Reducing Oil Demand Through Vehicle Fuel Economy
Improvement.......................................................................................................................... 149
13.11 Annexure IX – Demand Projections By Various Agencies for Natural Gas .........................152
13.12 Annexure X - Refining Capacity at Beginning Of XI Plan ....................................................153
13.13 Annexure XI- Value Addition & Other Benefits of Surplus Capacity ...................................15613.14 Annexure XII- Abbreviations ...............................................................................................158
Ministry of Petroleum and Natural Gas Page 5 of 164

8/3/2019 wg11_petro
http://slidepdf.com/reader/full/wg11petro 6/164
Report of the Working Group on Petroleum and Natural Gas for the XI Plan (2007 – 2012)
Executive Summary
1.1 Economy & Energy
1.1.1 Efficient, reliable and competitively priced energy supplies are prerequisites
for accelerating economic growth. For any developing country, the strategyfor energy development is an integral part of the overall economic strategy.
Efficient use of resources and long-term sustainability remains core
objective of economic planning. Sustainability would take into account not
only available natural resources and issues related to ecological balance
but also established delivery mechanisms, the technological constraints that
are prevalent in the system and immediate compulsion to meet the priority
needs of the economy, economic equity and self-reliance. Simultaneous
and concurrent action is, therefore, necessary to ensure that the short-term
concerns do not detract the economy away from the long-term goals.
1.1.2 Realisation of high economic growth aspirations by the country in thecoming decades, calls for rapid development of the energy market. The
energy resources available indigenously are limited and may not be
sufficient in the long run to sustain the process of economic development
translating into increased energy import dependence. The base of the
country’s energy supply system is tilted towards fossil fuels, which are finite.
This has serious long-term implications as the emerging patterns of energy
consumption, which is heavily skewed towards oil and gas, bring to focus
many ecological and environmental issues.
1.1.3 India meets nearly 30 percent of its total energy requirements through
imports. With the increase in share of hydrocarbons in the energy
supply/use, this share of imported energy is expected to increase. Thechallenge, therefore, is to secure adequate energy supplies at the least
possible cost. Although growth of the energy sector is moderate and has,
to some extent, served the country’s social needs, it has put tremendous
pressure on the Government’s budget.
1.2 International Scenario
1.1.4 Projected global oil consumption is expected to register a substantial
growth over the present levels. Recently published energy reports project
incremental demand of about 38 million barrels per day (mbpd) in 2030
over 80 mbpd level in 2003. Most of this incremental demand will emanate
from developing countries including China and India where oil consumption
is expected to grow at the rate of 3.8 and 2.4 percent respectively as
against the world average of 1.4 percent. Non-OPEC (Organisation of
Petroleum Exporting Countries) production, though showing an upward
trend, will not be sufficient to service this incremental demand emphasising,
once again, the continued dependence of the world on OPEC oil for its
energy requirements.
1.1.5 High oil and gas prices have prompted increased investments in the
exploration and production (E&P) sector posing new challenges for the
sector in the form of increased cost of operations due to high service costs,
exposure to logistically difficult terrain and shortage of technical manpower.
Ministry of Petroleum and Natural Gas Page 6 of 164

8/3/2019 wg11_petro
http://slidepdf.com/reader/full/wg11petro 7/164
Report of the Working Group on Petroleum and Natural Gas for the XI Plan (2007 – 2012)
Global refining scenario indicates very little to negligible addition in
capacities in major developed consuming markets like the USA and the
European countries. Developing countries like the Middle East, China and
India are fast emerging as refining hubs. Needless to say that capacity
augmentation in these regions would also result into possible integration of
both the refining and petrochemicals business.
1.1.6 Natural gas has been rightly termed as the fuel of the 21st century. Natural
gas, the third largest contributor to the global energy basket, is projected to
increase at a rate faster than any other energy source. In the global
context, natural gas market era has truly begun during the last 5 years. The
global gas markets are fast integrating, commercial models are undergoing
rapid changes, and the market structures are evolving and fast changing.
Leading this growth in global gas sector are the Asian markets with special
investment focus on countries like China and India.
1.1.7 It is indeed difficult to predict what will happen to oil prices over a five year
period but current assessments indicate that oil prices will remain high.This will exert downward pressure on the economy, both directly and also
through their impact on world economic growth. Currently, the impact of
high oil prices on the world economy has somewhat been offset because
the industrialised countries have adjusted to these higher oil prices.
Sustained conditions of high oil prices, however, will eventually create
macro-imbalances in the world economy making it vulnerable to any future
‘oil shock’. Simulations with macro-models suggest that if oil prices
increase sharply in future, growth rate could be compromised by between
0.5 and 1.0 percentage points below the levels projected with present levels
of oil prices.
1.3 Indian Scenario
1.1.8 India is and shall remain heavily dependent on coal for about half of its
primary commercial energy requirements with the other half being
dominated by oil and gas put together. The Indian hydrocarbon industry is
currently passing through a challenging phase. Increasing concern for
energy security, increasingly stringent environmental regulations,
emergence of natural gas and soaring crude oil and natural gas prices have
thrown up both challenges and opportunities to the Indian oil and gas
industry.
1.1.9 Projected high domestic demand for petroleum products is expected topush investments into the refining sector. India, with 18 refineries, currently
has a surplus refining capacity which has placed India amongst net
petroleum product exporter countries. Increasingly stringent fuel
specifications have put pressure on the old and non-compliant refineries to
upgrade their refinery configurations to produce compliant fuels. The
Government is seriously considering promoting India as a competitive
refining destination to service export market for petroleum products as also
integrating it with the petrochemical and chemicals businesses to produce
and export higher revenue generating value added products.
1.1.10 Exceptionally high crude oil prices in the international market and an almost
stagnant domestic crude oil production has caused a drain on country’s
Ministry of Petroleum and Natural Gas Page 7 of 164

8/3/2019 wg11_petro
http://slidepdf.com/reader/full/wg11petro 8/164
Report of the Working Group on Petroleum and Natural Gas for the XI Plan (2007 – 2012)
foreign exchange reserves. The Government is committed to mitigating
these challenges and has, in fact, met with accelerated domestic
exploration through its New Exploration Licensing Policy (NELP) policy
initiative. Some of the world class oil discoveries have recently been
reported from blocks offered under the NELP regime. Five NELP rounds
have resulted into 110 PSCs being signed and the Sixth round offering 55exploration blocks is still underway. Besides augmenting domestic
reserves, India has successfully ventured overseas to acquire oil and gas
assets and entered into long-term Liquefied Natural Gas (LNG) contracts as
measures for enhancing energy security.
1.1.11 Creating sustainable transportation system through cross-country crude oil
and petroleum product pipelines in the next few decades, with the objective
of preserving environment and protecting human health and safety would
be a real challenge for the petroleum industry.
1.1.12 Persistence of high oil prices and dependence on imported oil leaves India
with some difficult choices to make. The choice is between (a) passing onthe price increase to the consumer; (b) rationalising taxes and other levies
on petroleum products; and (c) making the National Oil Companies (NOCs)
bear the burden. Although the Government has resorted to a combination
of all above three options in the past, each of these options has its own
drawbacks. In the long run, the only viable policy to deal with high
international oil prices is to rationalise the tax burden on oil products over
time, remove anomaly, if any, in the existing pricing mechanism, realize
efficiency gains through competition at the refinery gate and retail prices of
petroleum products, and pass on the rest of the international oil price
increase to consumers, while compensating targeted groups below the
poverty line as much as possible.
1.1.13 With the advent of LNG and progressive de-control of gas prices, the
natural gas sector in India has progressed and achieved some degree of
maturity. It has managed to receive progressively growing attention from
global companies and has made rapid strides during the last five years.
Current natural gas policy dispensations have created numerous
challenges for the gas sector. Major among them are the demands of
competing consumer industries, ensuring competition and open access in
the pipeline transportation and distribution networks, reducing the supply
demand gap that exists today.
1.4 Thrust Areas for the Petroleum and Natural Gas Sector
1.1.14 The following thrust points, discussed under respective industry segment,
merit consideration for the healthy overall development of the oil and gas
industry.
Exploration & Production
Increasing domestic production by attracting investments, both private and public, in
the upstream sector. This needs to be attempted by involving industry participants in
formulating an investor friendly E&P investment regime.
Ministry of Petroleum and Natural Gas Page 8 of 164

8/3/2019 wg11_petro
http://slidepdf.com/reader/full/wg11petro 9/164
Report of the Working Group on Petroleum and Natural Gas for the XI Plan (2007 – 2012)
Taking all steps to increase the production from ONGC’s (Oil and Natural Gas
Corporation) assets including their maturing field.
Refining
Equipping domestic refining industry both existing and planned to successfully meet
the challenge of producing fuels complying with prescribed environment friendly
specifications which are increasingly becoming stringent.
Promoting India as a competitive and economically viable refining destination to
service both the domestic as well as the export market.
Pipelines
Increasing the coverage of pipelines throughout the country.
Leveraging the inherent advantages of using pipelines to transport products and
enhancing the pipeline infrastructure in product pipelines.
Building a sound gas transportation infrastructure to support the projected growth of
the gas market. Setting up of a regulator under the Petroleum and Natural Gas
Regulatory Board Act, 2006 (PNGRB Act 2006) to regulate the downstream oil and
gas sector, including gas infrastructure, is expected to provide clarity and comfort to
investors interested in India’s gas transportation sector.
Marketing
Steps need to be undertaken by all stakeholders to curb adulteration.
Maintaining viability of retail outlets by synergy among public sector oil marketingcompanies in setting up of new retail outlets.
Introduction of automation of retail outlets throughout the country.
Alternate Fuels
Promoting use of ethanol-blended petrol and bio-diesel throughout the country.
Exploring and exploiting country’s CBM resource.
Research and Development
Promoting Research and Development (R&D) activities through provision of
incentives and funds.
Energy Conservation
Encouraging energy conservation through campaigns aimed at sensitising the people
about the significance of efficient use of energy.
Addressing Workforce Challenges
Proactive planning for sustained availability of knowledge workers for the entire oil
and gas industry.
Ministry of Petroleum and Natural Gas Page 9 of 164

8/3/2019 wg11_petro
http://slidepdf.com/reader/full/wg11petro 10/164
Report of the Working Group on Petroleum and Natural Gas for the XI Plan (2007 – 2012)
1.5 Acknowledgements
1.1.15 The Working Group thanks all the Members from the Government, public
and private sector, autonomous/industry bodies and their representatives of
the Working Group on Petroleum and Natural Gas for the XI Plan for their
contribution, cooperation and support throughout the preparation of thisreport. Thanks are due to Shri Anil Razdan, Additional Secretary, Shri
Prabh Das, Shri Ajay Tyagi, Shri Narsimha Raju, concerned Joint
Secretaries in the Ministry, Shri P K Sinha, Joint Secretary & Financial
Adviser, Shri C.B. Singh, Joint Adviser (F) and their teams for giving
valuable inputs to the Working Group from time to time. The Working
Group thanks the officials of Petroleum Planning and Analysis Cell (PPAC),
Petroleum Conservation and Research Association (PCRA) and Petroleum
Federation of India (PetroFed) and their team members for their inputs and
support. Thanks also to the members of the various working Sub Groups
for timely preparation of the Working Sub Group Reports.
1.1.16 To summarise, the task of achieving an average growth rate in GrossDomestic Product (GDP) between 8 and 9 percent as being projected by
the Government for the XI Plan could be feasible, provided necessary
policy interventions are made in one of the important sectors like oil and
gas which is the back bone of the economy. Keeping the above points in
view the Report of the Working Group on Petroleum and Natural Gas
Sector for the XI Plan has analysed the emerging trends and factors
influencing the oil and gas sector and outlined the action plan for the
aforesaid period 2007-2012. Terms of Reference (TOR) of the Working
Group are at Annexure - I. The report is the outcome of various
deliberations held by various Working Sub Groups constituted for the
purpose, which comprise members from the private as well as public sector.The terms of reference of the various Working Sub Groups are at Annexure
– II (a) to II (c).
Ministry of Petroleum and Natural Gas Page 10 of 164

8/3/2019 wg11_petro
http://slidepdf.com/reader/full/wg11petro 11/164
Report of the Working Group on Petroleum and Natural Gas for the XI Plan (2007 – 2012)
2 Overview of Petroleum & Natural Gas Sector
2.1 Background
1.1.17 Energy is essential for living and vital for development. Affordable energy1
directly contributes to reducing poverty, increasing productivity andimproving quality of life. Likewise lack of access to reliable energy is a
severe impediment to sustainable social development and economic
growth. For any developing country, the strategy for energy development is
an integral part of the overall economic strategy. Efficient use of resources
and long-term sustainability remains core objective of economic planning.
Sustainability would take into account not only available natural resources
and issues related to ecological balance but also established delivery
mechanisms, the technological constraints that are prevalent in the system
and immediate compulsion to meet the priority needs of the economy,
economic equity and self-reliance.
1.1.18 Simultaneous and concurrent action is, therefore, necessary to ensure that
the short-term concerns do not detract the economy away from the long-
term goals.
2.2 Global Scenario
1.1.19 It may be worthwhile to examine how large energy consuming but resource
deficit countries have tackled these issues. Their experience could be
relevant in devising an appropriate energy policy for India.
1.1.20 In Asia, Japan and China are the largest consumers of energy. In Japan,
the energy policy objectives can be summarised as the “3 Es” namely:
Energy security,
Economic development and
Environmental sustainability.
1.1.21 Japan’s objective is to achieve the three goals simultaneously, although
they often contradict one another and the government recognizes the
possibility of trade-offs between them. Owing to conscious policy since
early 70s, Japan has been able to (a) reduce energy consumption through
conservation, (b) reduce oil consumption through diversification, (c)increase use of natural gas over coal (Japan is deficit in both resources)
due to favourable impact on environment, (d) increase nuclear energy and
maximize renewable resources. As a result of their efforts energy mix of
Japan has changed with oil having been diversified into nuclear, natural gas
and coal.
1.1.22 It is understood that China has recently finalized its XI Five Year Plan. The
central tenet relating to energy policy places priority on energy conservation
with a target to decrease energy consumption by 20 percent by 2010 and
pursue logical and reasoned development of the coal sector. It also
1In UK, households that spend less than 10 percent of their income on heating their homes are officially stated to suffer from fuel poverty.
Ministry of Petroleum and Natural Gas Page 11 of 164

8/3/2019 wg11_petro
http://slidepdf.com/reader/full/wg11petro 12/164
Report of the Working Group on Petroleum and Natural Gas for the XI Plan (2007 – 2012)
suggests diversification of energy sources by aggressive development of
electricity, accelerated development oil and natural gas and development of
renewable energy sources.
1.1.23 Thus, it may be seen that both the countries have devised a long-term plan
keeping in mind the available resources with the country. Besides,wherever resources are deficit, efforts are being made to reduce
dependence on them. Details of approaches adopted by Japan and China
are discussed under 13.5. Annexure III: Energy Policy in Asian Economies.
Global Oil Scenario
1.1.24 World oil use is expected to grow from
about 80 million barrels per day
(mbpd) in 2003 to 98 mbpd in 2015
and 118 mbpd in 2030 as per Energy
Information Administration (EIA),
International Energy Outlook (IEO)2006.
1.1.25 In the IEO 2006 reference case, world
oil prices rise from $31 per barrel (in
real 2004 dollars) in 2003 to $57 per
barrel in 2030, and oil’s share of total
world energy use falls from 39 percent to 33 percent. Shift in energy mix
over the period of time is shown in the chart.
1.1.26 To meet the projected increase in world oil demand, total petroleum supply
in 2030 will need to be 38 mbpd higher than the 2003 level of 80 mbpd. Of
this, China is projected to consume additional 9.4 mbpd, US 7.5 mbpd and
Asia (other than China & India) 6 mbpd. The balance growth is expected in
South America, Africa and Middle East. As per the same report India is
expected to consume additional 2.2 mbpd 2. OPEC producers are expected
to provide 14.6 mbpd of the increase. Higher oil prices cause a substantial
increase in non-OPEC oil production—23.7 mbpd, which represents 62
percent of the increase in total world oil supplies over the projection period.
In addition, unconventional resources (including biofuels, coal-to-liquids,
and gas-to-liquids) are expected to become more competitive. In 2003,
world production of unconventional resources totalled only 1.8 mbpd.
Unconventional resource supplies are expected to rise to 11.5 mbpd and
would account for nearly 10 percent of total world energy supply in 2030.
Global E&P Scenario
1.1.27 E&P activities world over are on the rise with spurt in crude oil and natural
gas prices in international market. Consequently, increase in demand-
supply gap in E&P services and availability of technical manpower, are new
challenges for E&P companies. The shortage of rigs, seismic survey crews
and technical manpower is increasing the E&P costs. However, despite
these constraints, the rise in crude oil and natural gas prices is motivating
E&P companies to search for hydrocarbons in frontier and logistically
2Current Indian demand (during 2005-06) is about 112 MMT or 2.24 Mb/d
Ministry of Petroleum and Natural Gas Page 12 of 164

8/3/2019 wg11_petro
http://slidepdf.com/reader/full/wg11petro 13/164
Report of the Working Group on Petroleum and Natural Gas for the XI Plan (2007 – 2012)
difficult areas including deepwater. Few issues of importance in the current
international petroleum scenario are discussed below:
Deep-water exploration in the world: World over oil companies are venturing in this
frontier area, particularly in Gulf of Mexico, North Sea and Western Offshore Africa.
Pursuing development and production from established/ageing fields:
Technological innovations are made to reduce E&P costs and increase recovery.
Identification of cutting-edge technology is a key to developing ageing fields.
Privatization of energy sector in developing regions like East Asia and Pacific,
Latin America, CIS, South Asia: Such opportunities need to be assessed as theseregions are historically, ideologically, politically and culturally, similar to India.
Strategic alliances to reduce/share risks in marginal field exploration and
development: Companies have already entered into such alliances in acreages in
India. The experience can be extended to preferred partners in overseas ventures.
End-product marketing by oil companies engaged in E&P: Major oil companies
are vertically integrated with all the three sectors of petroleum industry - upstream,
downstream and marketing.
Asset/Activity based E&P management through multi-disciplinary teams: In
1990s, major E&P companies and some NOCs started reorganizing themselves into
asset based small companies. This structure, with a multi-disciplinary team of
geoscientists and engineers, has turned some of the marginal producing properties
commercially viable. Besides, a trend of strategic alliance with service companies has
also emerged so that the service companies are now directly participating in E&P
activities by providing technological solutions to field specific problems.
Information technology for strategic advantage: Prodigious growth in information
technology is being utilized by multi-disciplinary teams for Data-
warehousing/interpretation etc. and seamless online connectivity for timely quality
decision-making.
Ministry of Petroleum and Natural Gas Page 13 of 164
20725
158 22694
155
3311
45
7179
42
25030
196
85702
662
Asia
Africa
Middle East
Europe
North America
Total
No. of Refineries
Crude Processing
(kbbl/d)
66
6763South America
20725
158 22694
155
3311
45
7179
42
25030
196
85702
662
Asia
Africa
Middle East
Europe
North America
Total
No. of Refineries
Crude Processing
(kbbl/d)
66
6763South America
Figure 2.1: Current Region-wise Refining Capacity and No. of Refineries

8/3/2019 wg11_petro
http://slidepdf.com/reader/full/wg11petro 14/164
Report of the Working Group on Petroleum and Natural Gas for the XI Plan (2007 – 2012)
R&D: Efforts in R&D are focused towards continuous improvement in efficiency and
cost-effectiveness of E&P techniques besides attaining a technological edge over
competitors and solving new technological challenges.
Global Refining Scenario
1.1.28 Global refinery scenario particularly that of Asia is turning attractive. In
Europe, there has been no substantive addition in the refining capacities. At
a number of places refineries are being closed down because of
environmental concerns and uneconomic size. In the US, refining capacity
has increased marginally. In Central Asia, the refineries are old and require
a huge dose of investment. The only area, which has seen a spurt in
refining capacity, is the Middle East, India and China. The average annual
growth rate of refining capacity in the last one decade in the world is 1.2percent. Most of this capacity addition has been in Asia-Pacific region,
which contributed about 56 percent of the capacity addition. The current
regionwise refining capacity is shown in the Figure 2.1.
1.1.29 The next five years are projected to be crucial for refineries. Cracking
margins are expected to remain strong with strong forecast for oil demand
growth coming from Asia Pacific and the US and move throughout the world
towards cleaner fuels. It is expected that early movers could benefit strong
margins for several years.
1.1.30 Figure 2.2 shows the trend in refining capacity additions in the Atlantic
Basin, Asia Pacific and Middle East Regions. It may be seen from the graph
that over a period of time the refining capacity share of the Atlantic Basin is
reducing and the share of Asia Pacific region is increasing. This is in line
with the trend of maximum refining capacity being added in the Asia Pacific
Ministry of Petroleum and Natural Gas Page 14 of 164
Figure 2.2: Region-wise Trend in Refining Capacity Additions
8/3/2019 wg11_petro
http://slidepdf.com/reader/full/wg11petro 15/164
Report of the Working Group on Petroleum and Natural Gas for the XI Plan (2007 – 2012)
region. The world refining capacity at the end of 2010 is expected to be
about 94 mbpd and around 102 mbpd in 2012. The significant expansion of
capacity forecast for China and India would have the effect of pulling the
locus of world refining more toward the Asia-Pacific region.
1.1.31 Thus, there appears to be an excellent opportunity for capacity
augmentation in the Asia Pacific region. Asia, including India and China, are
projected to account for half the incremental consumption. Asia in general is
projected to be the centre of growth for the next few decades. This perhaps
is an opportune moment for the domestic refining industry to take up this
challenge and make India a major refining destination. The viable route,
therefore, would be to export surplus products and value-add by production
of petrochemicals/polymers and other chemicals. New refineries would
necessarily need to meet the projected fuel standards of developed
countries to access those markets. Further, India has a geographical
advantage due to proximity to source of oil and emerging markets.
Global Natural Gas Scenario
1.1.32 The oil and gas producers and users across the world are sitting up and
revisiting their strategies in view of the increasing prices. The issue of
energy security and broad-basing the energy portfolio has become every
country’s priority.
1.1.33 Natural gas, accounting for 24 percent of the total global primary energy
supply, is the third largest contributor to the global energy basket. Natural
gas consumption is expected to increase at an average of 2.4 percent per
year from 2003 to 2030 as per EIA, IEO 2006. Among the end-use sectors,
the industrial sector remains the largest consumer of natural gas worldwide,
accounting for 52 percent of the total incremental demand for natural gas
between 2003 and 2030. Natural gas is also expected to remain an
important energy source in the electric sector, particularly for new
generating capacity.
1.1.34 In a global context the natural gas era has truly begun during the last five
years. With cross border gas trade becoming a Hobson’s choice for gas
producers who aspire to achieve real business growth, the global gas
markets are fast integrating, the commercial models are undergoing rapid
changes and the market structures are evolving and fast changing. Moreimportantly, the Asian gas markets are leading the growth in global gas
sector, with special investment focus on countries like India and China.
1.1.35 Integration of Global Gas Markets has by far been the most significant
development during the period 2002-07. LNG has been one of the key
drivers of this integration. With an almost 75 percent increase in liquefaction
capacities from 87 MMTPA to more than 150 MMTPA over the past 10
years, the share of LNG in global gas trade has grown from 14 percent to
26 percent. This has also been supported by the fact that there is a
continuous lowering of cost across the LNG value chain, which has
transformed the LNG economics. This has contributed to establishing LNG
as a major viable and flexible option. By meeting the buyers’ expectations
Ministry of Petroleum and Natural Gas Page 15 of 164

8/3/2019 wg11_petro
http://slidepdf.com/reader/full/wg11petro 16/164
Report of the Working Group on Petroleum and Natural Gas for the XI Plan (2007 – 2012)
through price and contractual flexibilities, price review option and
destination flexibility, LNG trading has emerged as a truly global and mature
business.
1.1.36 At the same time, trans-national gas pipelines have continued to be a
dominant gas supply option, especially between contiguous nations, andhave emerged as a dominant integrating factor. The Russia–Poland–
Central Europe pipeline, the Blue Stream project connecting Russia and
Turkey via the Black Sea, the idea of a Northern Trans–Europe Gas
pipeline connecting Russia to Finland and the UK via the Baltic Sea indicate
the integration on the European side. On the Asian side, the Iran-Pakistan-
India Pipeline, the Myanmar-India Pipeline and the Turkmenistan-
Afghanistan-Pakistan-India Pipeline are receiving the highest attention from
the concerned Governments.
1.1.37 Thus, integration of gas markets has become a necessity primarily due to
five important reasons :
a) Firstly, gas has emerged as an important alternative source of energy. The Reserve
to Production ratio of gas at 67 years continues to be ahead of oil at 40 years. There
is therefore an economic imperative for faster monetization of gas reserves from a
commercial perspective of the producing nations.
b) Secondly, the top 15 gas producing nations, except the US, having 78 percent of the
global gas reserves, account for only 27 percent of the global consumption.
Therefore, they have an inescapable need to look for marketing their gas globally.
c) Thirdly, there is an overall globalization trend in all businesses, backed by an
Information Technology boom and 24 X 7 communication links.
d) Fourthly, the Asian boom has a very important role to play in this area. The gas
markets in China and India are shaping out to be major drivers of growth. With
China’s energy demand growing by 15 percent and India’s by 7.8 percent, these two
Asian giants are projected to be the leading gas consumers by the year 2020.
e) Finally, the spiralling oil prices and the uncertainty on the pricing front are helping to
shape the gas market. In this regard, two interesting trends in the oil sector need a
special mention:
The rate of growth of world oil supply is constantly reducing and a flatter trend in
the future is becoming apparent.
The oil prices might settle at comparatively higher levels.
1.1.38 The implications of this integration through global gas trades, propelled by
the five factors mentioned above, are far reaching - economically,
strategically and, indeed, politically too.
1.1.39 The most integrated gas market today is the European market. The
effective integration of sources and markets in Europe not only resulted in
physical demand being met but also ensured the lowest gas prices amongst
the gas importing nations. The European Union (EU) Gas Directive took
decisive shape during 2002-07, driving the gas market reforms of the
Ministry of Petroleum and Natural Gas Page 16 of 164

8/3/2019 wg11_petro
http://slidepdf.com/reader/full/wg11petro 17/164
Report of the Working Group on Petroleum and Natural Gas for the XI Plan (2007 – 2012)
member nations. The Energy Charter Treaty Secretariat based in Belgium
has been playing an active role in enabling smooth trade among the EU
Nations.
1.1.40 The focus now is on the integration of the Asian markets, which would
provide the major platform for growth for the global gas sector. Asia todayaccounts for 70 percent of the total LNG trade; Japan and Korea are
meeting their entire gas requirement through imports. Natural gas accounts
for 3 percent of China’s primary energy consumption and 9 percent of that
of India. These two countries today account for less than 3 percent of the
global gas consumption. But, with greater integration of the natural gas
markets at a global level, the share of natural gas consumption in China
and India together is expected to account for more than 17 percent of the
total global natural gas consumption by the year 2020 as has been reported
in the Energy Intelligence Agency Global Energy Forecast 2004.
1.1.41 Therefore, the next 15 years should be very exciting years for both India
and China for the development of their gas sectors through integration withglobal gas markets. The following table provides an overview of the
expected trend in the LNG Trade:
Table 2.1: LNG Global Trade Projections
Year LNG Global Trade (MMTPA) % Share in World Gas Trade
2003 110 23 percent
2010 180-220 29-31 percent
2020 315 38 percent
1.1.42 Oil and gas policy, a subset of energy policy, will follow from the
assessment of available domestic resources, requirements of growing
economy, needs of the citizens, and the emerging global environment.
Towards this end, the action taken by the Planning Commission in finalizing
the report of the Integrated Energy Policy (IEP) wherein the assessment of
the resources and their likely availability of supplies have been dealt with in
details. However, the overview of the petroleum and Natural Gas sector in
India is as under:
2.3 Indian Scenario:
1.1.43 The structure of primary energy consumption in India shows that coal (51
percent) dominates as the major energy source. Hydrocarbons (45 percent)
is the next available energy provider of the nation. Natural gas is fast
emerging as an alternative; it meets around 9 percent of the primary energy
needs. Considering the global trend of shift in energy mix from oil to gas,
the share of gas in consumption pattern, in the Indian context, is also likely
to increase gradually in the days to come.
1.1.44 Currently, India's consumption (111.9 MMT in 2005-06) of petroleum
products is only about 1/5th of world's average per capita consumption. Inthe X Plan (2002-07), the growth in consumption is expected to be around
Ministry of Petroleum and Natural Gas Page 17 of 164

8/3/2019 wg11_petro
http://slidepdf.com/reader/full/wg11petro 18/164
Report of the Working Group on Petroleum and Natural Gas for the XI Plan (2007 – 2012)
2.6 percent per annum. In India, the indigenous production of crude oil has
not been increasing in tandem with the consumption/demand of petroleum
products. Government of India, under the NELP program, has already given
a number of blocks for exploration, to various national and international
agencies.
1.1.45 The hydrocarbon industry has been passing through very turbulent and
challenging times for the last few years. The increasingly stringent
environmental regulations, emergence of natural gas and soaring crude
prices have thrown up challenges to the oil industry on one hand and
opportunities on the other hand, such as gas business. Although natural
gas is now being used as transport fuel the liquid fuels have traditionally
remained the mainstay of hydrocarbon industry. There has been emphasis
and quest for cleaner alternatives and CNG has merged as an alternative
fuel.
1.1.46 The crude oil and gas reserves as on April 1, 2006 stand at 756 MMTOE
and 1,075 BCM respectively. In 2005-06, crude oil and natural gasproduction by ONGC, OIL and Pvt/JV companies was about 32.19 MMT
and about 32.20 BCM respectively.
Surplus Refining Capacity and Potential for an Export Hub
1.1.47 India has at present 18 refineries with refining capacity at 132.47 MMTPA.
At the end of the X Plan (2007) the refining capacity is expected to reach
148.97 MMTPA against the consumption of about 114 MMTPA thereby
resulting into surplus of refining capacity. India's export performance has
also been very impressive. India has turned into net exporter of petroleum
products from 2001-02 and during the year 2004-05 the net exports were
8.7 MMT. During the year 2005-06, India exported 21.50 MMT of products
mostly comprising of Naphtha, Petrol, Aviation Turbine Fuel (ATF) and
Diesel. By these exports about Rs. 46,785 crore of revenue was generated
by the refining sector. Thus, the Ministry and companies are taking initiative
for exploiting the potential for an export hub in India for petroleum products
based on the export opportunities available in South East and East Asian
countries.
Status of Product Pipelines
1.1.48 Cross-country pipeline networks, preferred as a cost-effective, energy-
efficient, safe and environment friendly mode for transportation of crude oiland petroleum products, have been playing a vital role in meeting India’s
energy demand. They are now a key constituent of the country’s
infrastructure, transporting crude oil from import terminals as well as
domestic sources to inland refineries, and finished products from refineries
to major consumption centres.
1.1.49 Creating sustainable transportation system through cross-country pipeline
in the next few decades with the objective of preserving environment and
protecting human health and safety would be the great challenge for the
petroleum industry. As on 1.4.2006 India has around 7,696 kM of product
pipeline in the country with total capacity of around 55.58 MMTPA. In
addition there are 1850 kM of LPG pipelines with a capacity of 3.83
Ministry of Petroleum and Natural Gas Page 18 of 164

8/3/2019 wg11_petro
http://slidepdf.com/reader/full/wg11petro 19/164
Report of the Working Group on Petroleum and Natural Gas for the XI Plan (2007 – 2012)
MMTPA. During 2005-06, capacity utilization of product pipeline in the
country was around 60 percent only. The share of product movement
through pipeline was only 32 percent of total POL (Petroleum Oil and
Lubricants) consumption as compared to more than 62 percent in
developed countries.
Improvement in Auto Fuels
1.1.50 With the introduction of improved auto-fuels, the quality of fuels in India is
better than in most countries of the region. The following programme for
introduction of improved fuels has been implemented in the country as
decided by the Government.
Euro-III Petrol & Diesel has been introduced from 01.04.05 in all 11 identified cities
(Delhi/National Capital Region. Mumbai, Kolkata, Chennai, Bangalore. Hyderabad,
Ahmedabad, Pune, Surat, Kanpur and Agra).
Introduction of Bharat Stage – II (BS-II) Petrol throughout the country by 01.04.05.
Introduction of BS II Diesel in all states except Rajasthan, West U.P., Uttaranchal,
Madhya Pradesh, Punjab, Himachal Pradesh, and Jammu & Kashmir by 1.4.2005.
Introduction of BS II Diesel in the above states in a phased manner completed by
1.10.2005.
Globalisation and Diversification Efforts
1.1.51 The Indian economy is set to grow at the fastest rate ever in the coming
decades with a major thrust being to manufacturing and services sector as
well as formation of Special Economic Zones (SEZs). India, traditionally animport dependent country, has set forth a clear agenda for development of
the energy sector in the coming decades with a clear emphasis on stepping
up the steam on domestic production while simultaneously pursuing various
import options. The government policy clearly emphasises the need for
energy security through diversification of energy resources while integrating
with the global trends to emerge as an important player in the global arena.
1.1.52 In view of unfavourable demand–supply balance of hydrocarbons in the
country, acquiring equity in overseas oil and gas assets is one of the
important components of enhancing oil and gas security. The Government
is encouraging oil PSUs to aggressively pursue equity oil and gasopportunities overseas. OVL has made an investment commitment of over
US$ 5 billion and has an oil and gas production of 6.6 MMTOE (Oil and oil
equivalent gas) in the year 2005-06. OVL has a target to produce 20
MMTPA of O+OEG by 2020. OIL, IOC and GAIL are also engaged in
acquiring overseas E&P assets. In addition, private Indian companies like
RIL and Essar are also pursuing E&P opportunities abroad.
1.1.53 In the context of energy diversity, natural gas is expected to play a major
role in diversifying the energy options. New domestic finds and LNG
imports have made the market quite vibrant in recent times.
Ministry of Petroleum and Natural Gas Page 19 of 164

8/3/2019 wg11_petro
http://slidepdf.com/reader/full/wg11petro 20/164
Report of the Working Group on Petroleum and Natural Gas for the XI Plan (2007 – 2012)
1.1.54 Retail & Marketing companies took big strides in new growth areas during
the X Plan period towards globalisation and diversification in to related
areas. Among these, initiatives are upward integration into E&P,
diversification to natural gas and forward integration into petrochemicals
business. Companies are gearing themselves for setting up mega
petrochemical hubs with world scale plants. Companies are alsoprogressing well in tapping opportunities in neighbouring countries for
export of its products and services.
Pricing Policy
1.1.55 The country has been witnessing sharp and spiralling increase in
international oil prices combined with considerable volatility since the end of
2003. Another trend being noticed in the international market in recent
months is that the prices of some sensitive petroleum products have been
moving faster and with greater volatility than the prices of crude, depending
on seasonal and regional demands for these products globally.
1.1.56 The prices of crude oil in the international market have increased steeply.
The crude oil price of Indian basket has gone up from about $23 per barrel
during March 2002 to $ 55.72 per barrel for April 2005 to March 2006
average. The average for April 2006 to October 2006 is $66.25 per barrel
representing an increase of about three times.
1.1.57 Considering the impact of the price increase on common man and
economically vulnerable sections of the society, Government has not
increased the domestic prices of sensitive petroleum products in line with
international prices. Holding the price-line has taken its toll on public sector
oil marketing companies. Oil Marketing Companies (OMCs) namely, Indian
Oil Corporation (IOC), Hindustan Petroleum Corporation (HPCL), Bharat
Petroleum Corporation (BPCL) and IBP Ltd, as a result have suffered
losses.
1.1.58 Government has taken several measures to contain the increase in
domestic prices. From March 2005, customs and excise duty on PDS
Kerosene and Domestic LPG has been made nil. Customs duty on petrol
and diesel has been reduced from 20 percent in March 2004 to 10 percent
currently. Ad valorem excise duty for diesel has been reduced from 14
percent in March 2004 to 8 percent. For petrol, the reduction has been
larger from 30 percent in March 2004 to 8 percent at present. In addition to
the tax relief, Government is also directly absorbing a part of the burden.Government has decided to issue oil bonds to the oil marketing companies
to compensate them for their losses.
1.1.59 Several experts have forecast an era of high oil prices to continue. With the
country's high oil import dependence, it is necessary that petroleum
products be priced in a consistent manner under a long-term policy. It is
also essential that economic pricing is blended with social responsibility so
that the oil sector continues to function and service the oil needs of the
economy.
Natural Gas Sector:
Ministry of Petroleum and Natural Gas Page 20 of 164

8/3/2019 wg11_petro
http://slidepdf.com/reader/full/wg11petro 21/164
Report of the Working Group on Petroleum and Natural Gas for the XI Plan (2007 – 2012)
1.1.60 India is fast emerging as the focal point for the future development of the
Asian natural gas market. In recent years, the Indian gas sector has
received a progressively growing attention from global companies and has
made rapid strides. The rapid growth of the Indian economy in the X Plan
has greatly contributed to the development of the Indian energy sector as a
whole and provided a major trigger for the growth of the gas sector as well.While gas occupies only about 9-10 percent of the total energy basket,
primarily due to supply constraints all these years, the scenario is fast
changing.
1.1.61 With the advent of LNG and progressive de-regulation of the gas prices, the
natural gas sector in India is moving towards certain degree of maturity with
better understanding of the pricing mechanisms. Reflecting this, the first
spot cargo of LNG brought in by GAIL truly launched India on the global gas
map with global suppliers showing serious interest on the Indian gas sector.
Gas Infrastructure
1.1.62 On the supply side, there are two LNG terminals at Dahej and Hazira in
Gujarat which are already operational with a total existing capacity of 7.5
MMTPA. The third terminal in Dabhol with a capacity of 5 MMTPA is under
commissioning. There is another terminal at Kochi which is taking a final
shape for implementation.
1.1.63 In terms of transmission pipelines, there is an existing network of 6,300 km
including the Hazira-Vijaipur-Jagdishpur (HVJ) network, Dahej–Vijaipur
Pipeline (DVPL) and other regional networks. During the X Plan, pipelines
like the DVPL, Kelarus–Malanpur Pipeline, Thulendi–Phulpur Pipeline got
commissioned. A number of pipelines, including those by the private sector,
are at various stages of implementation and are likely to be implemented
during the XI Plan.
1.1.64 The city gas distribution sector has simultaneously grown with the gas
sector growth. From coverage of just 2 cities at the beginning of the X Plan,
the city coverage has grown to 10 in 2005-06 across the western, northern
and southern regions of the country. Currently, there is a total city gas
distribution network of about 6,000 km. As far as Compressed Natural Gas
(CNG) supplies are concerned, there are 278 stations dispensing CNG in
the country and the number is expected to continuously grow in the coming
years.
Pricing of Natural Gas
1.1.65 In the beginning of the X Plan period, under the Administered Pricing
Mechanism (APM), gas produced from the nominated fields of ONGC and
OIL was priced at Rs.2,850 per 1000 Standard Cubic Metre (SCM)
uniformly for all customers except in North East, wherein the customers
were charged a price of Rs.1700 per 1000 SCM. Even the gas procured by
GAIL from JVs and sold under APM was similarly priced, with the subsidy
being met by ONGC.
1.1.66 With effect from 1.7.06, the gas pricing for APM gas was changed. It has
been decided in the pubic interest that all available APM gas would be
Ministry of Petroleum and Natural Gas Page 21 of 164

8/3/2019 wg11_petro
http://slidepdf.com/reader/full/wg11petro 22/164
Report of the Working Group on Petroleum and Natural Gas for the XI Plan (2007 – 2012)
supplied only to the power and fertilizer sector consumers against their
existing allocations along with the specific end users committed under Court
orders and small consumers below 50,000 SCMD, at the revised price of
Rs. 3,200/MCM and calorific value of 10,000 Kcal/cubic meter.
1.1.67 All other consumers would be supplied natural gas at market related pricedepending on the producer price being paid to joint venture and private
operators at landfall point, subject to a ceiling of ex-Dahej RLNG (re
gasified LNG) price of US $ 3.86/MMBTU for 2006-07.In case of reduction
in availability of this gas in future, the supplies to APM consumers would be
reduced on a pro-rata basis.
1.1.68 The price of gas for the North–Eastern region will be pegged at 60 percent
of the revised price for general consumers. Thus, the consumer price for
the North-East region has been increased from the existing price of Rs.
1,700 to Rs. 1,920/MCM. Also, w.e.f. 1.07. 2006, ONGC will get a fixed
producer price of Rs. 3,200/MCM till Government takes final decision on
their prices. Producer price for OIL will be considered as equal to that of ONGC.
Free Market Gas
1.1.69 Under this category falls the gas supplied by the JV/Private sector, re-
gasified LNG and new gas supplies by ONGC and OIL. It may be noted that
the gas supplies by the JV/Private sector are governed by the provisions
under the PSCs. Similarly, the gas produced under NELP would be
governed in terms of the NELP provisions. Imported LNG is priced as per
the pricing formula agreed between the LNG supplier and importer for long
term supplies, and as per the spot price for spot purchases. Of course the
gas transportation charges would be regulated by the Regulatory Board
being setup under the PNGRB Act, 2006.
Import Dependence and its Impact
1.1.70 Presently, about 45 percent of primary commercial energy needs are met
from oil and gas. Of this, over 70 percent of domestic oil consumption is
imported mainly from Middle East. Gas imports started in 2004-05 and in
2005-06 about 19 percent of the gas consumption was met from imports.
Import dependence is likely to increase considering low accretion to
domestic oil and gas reserves. In fact, the case of India is not typical and
several oil consuming countries face similar situation. It is expected thatglobal oil dependence on OPEC will continue to rise with countries
competing for scarce resources.
Ministry of Petroleum and Natural Gas Page 22 of 164

8/3/2019 wg11_petro
http://slidepdf.com/reader/full/wg11petro 23/164
Report of the Working Group on Petroleum and Natural Gas for the XI Plan (2007 – 2012)
1.1.71 The import bill for crude oil over last few years is as under:
Table 2.2: Import Bill for Crude Oil
Particulars3 2002-03 2003-04 2004-05 2005-06(P)
2006-07(April-Sep)
Quantity in MMT 82.0 90.4 95.9 99.4 53.6Value
$ Billion
Rs Crore
15.8
76,195
18.3
83,528
26.0
1,17,003
38.8
1,71,702
25.2
1,15,985
Average Price in$/bbl
26.22 27.56 36.99 53.21 64.03
Increase over 02-03
In $/bbl
In $ Billion
In Rs Crore
1.34
2.5
7,333
10.77
10.2
40,808
26.99
23.0
95,507
1.1.72 The country has spent foreign exchange to the tune of about $ 39 billion in
2005-06 towards the import of crude oil. The projected outgo of foreign
exchange on account of import bill of Crude Oil in 2006-07 will remain high.
The crude oil payments are in fact more than double for every barrel of
crude in 2005-06 over 2002-03. This is a high price to pay for our
dependence. Unfortunately, even in the future this position does not appear
to improve. Given our track record in domestic E&P, our situation is likely to
deteriorate.
1.1.73 Oil price vulnerability may affect GDP growth and has the potential todisrupt future development. Obviously India needs to shift focus from short-
term management of energy requirements and pricing to long-term energy
policy in light of core objectives indicated above and particularly in light of
recent price spikes in the international oil markets. The challenge then is to
ensure supply of energy at affordable price within available resources.
Policy direction and intervention need to reorient the approach to match
circumstances.
Industry Structure
1.1.74 Economic theory suggests that larger the number of companies operating in
a sector, the more competitive it is and greater the productivity gains.Though at the same time economists have difficulty in finding perfectly
competitive markets and particularly so in oil and gas. This is so because oil
is intertwined with national interests and energy is recognized as
fundamental for economies to function. In fact it is easier to find regulation
and control in oil sector more so in the developing countries.
1.1.75 Given the nature of oil & gas, the current price scenario and future
projections reveal that oil will increasingly be concentrated in hands of few
nations, it appears, that there could be mounting resistance in moving
towards a free market as visualized above. One of the biggest hurdles that
3Source: PPAC
Ministry of Petroleum and Natural Gas Page 23 of 164

8/3/2019 wg11_petro
http://slidepdf.com/reader/full/wg11petro 24/164
Report of the Working Group on Petroleum and Natural Gas for the XI Plan (2007 – 2012)
India faces today is a lack of political consensus on free pricing of sensitive
petroleum products. Any approach that does not recognize the geopolitical
nature of oil and the current domestic level of consensus would eventually
fail.
1.1.76 At the same time, companies under the state dominate the oil industry inthe country today. These companies follow government policies and
directions and are accountable to the parliament. Besides, the C&AG
(Comptroller and Auditor General) verifies their books of accounts and CVC
oversees their commercial transactions. The present pricing structure is
determined by the Government policy. Even if one argues that the state is
operating a monopoly, it would be a public monopoly with all the attendant
controls and accountability in place.
1.1.77 Competition in Indian markets can come if the state cedes its ground to
other players. As privatization of Navratnas is not an option, reduction in
PSU market share would have to happen organically, which could take
some time, provided there is strong consensus on free pricing of sensitivepetroleum products, which fully translates in the market place.
1.1.78 There is also a need to recognize that competition is a tool to improve
efficiency and service standards but not an end in itself. The objective could
be still achieved, within the present constraints.
1.1.79 In the oil sector currently there are mainly four companies in the marketing
of products namely IOC, BPC, HPC and RIL besides players like Essar and
Shell. The Herfindahl-Hirschman Index (HHI), which is square of the market
share of the companies, for India (see note at 13.6 Annexure – IV) with the
existing companies is higher than the desired number of HHI (range 1000-
1800). However, with the pricing becoming free the market share will align
itself in some desired ratios, which is expected to bring HHI to a reasonable
level. Most competitive markets have five strong players. Thus, the current
structure of the oil sector could continue. In suitable environment, the
current structure will deliver a competitive market. This could be reviewed at
the time of appraisal of the XI Plan.
1.1.80 In addition, the Government could do the following to achieve higher
efficiency and service standards:
At the National Level
Encourage exports from the country compelling refineries to compete world wide,
meet global standards and meet requisite quality specifications.
Create a domestic petroleum product market through a commodity exchange.
Amalgamate individual state markets in one nation wide market with unified state
taxes, remove state tax anomalies, provide level playing field to domestic production
vis-à-vis direct imports (which can be imported without state taxes), and introduce a
uniform VAT which provides full set-off for local levies such as octroi and entry tax.
At the Corporate Level
Ministry of Petroleum and Natural Gas Page 24 of 164

8/3/2019 wg11_petro
http://slidepdf.com/reader/full/wg11petro 25/164
Report of the Working Group on Petroleum and Natural Gas for the XI Plan (2007 – 2012)
Benchmark operation with world standards, the top refineries and make suitable
improvements.
Ensure inter-PSU competition, particularly at the retail level. It could be contended
that this action would lead to duplication of assets. But then competition always does
that, for instance say the airline industry where infrastructure has been duplicated.Duplication of assets is a natural corollary to competition.
Exponential expansion of e-commerce transactions, which promotes competition and
enhances welfare by reducing transaction and search costs.
Ministry of Petroleum and Natural Gas Page 25 of 164

8/3/2019 wg11_petro
http://slidepdf.com/reader/full/wg11petro 26/164
Report of the Working Group on Petroleum and Natural Gas for the XI Plan (2007 – 2012)
3 Performance Review of X Plan Period
3.1 Introduction
1.1.81 At the beginning of the X Plan period, the oil and gas sector was
deregulated with the dismantling of Administered Pricing Mechanism(APM). Earlier, the exploration and development activities were dominated
by the NOCs, mainly ONGC and OIL. However, Private/JV companies were
provided an equal opportunity to get into E&P business after
implementation of NELP. Similarly the refining and marketing sector also
saw the entry of private players in the oil and gas sector during the X Plan
period. Moreover, private/JV companies have emerged as significant
players in hydrocarbon sector during X Plan period.
1.1.82 The likely achievement during X Plan period has been computed by taking
actual performance upto 2005-06. Annual plan target/anticipated
achievements in 2006-07 have been added.
3.2 Hydrocarbon Reserve Position
1.1.83 Total prognosticated resources of the country have been estimated at about
28 billion tonnes. As on 1.4.2006, the balance recoverable reserve position
of Oil plus cccccccc Oil Equivalent of Gas (O+OEG) is about 1,856 MMT,
which has increased by 25 percent from 1,485 MMT in 2002-03 mainly due
to contribution of major discoveries by private/JV companies and NOCs.
The details are as under:
Table 3.1: Hydrocarbon Reserves
Initial In Place(MMT) Ultimate Reserves (MMT) Reserves (MMT) *
Oil Gas O+OEG Oil Gas O+OEG Oil Gas O+OEG
ONGC 4,563.84 1,688.32 6,252.16 1,287.84 942.28 2,230.12 561.48 523.01 1,084.49
OIL 688 251 939 209 170 379 80 110 190
Pvt/JV 548.77 933.59 1,482.36 155.85 511.76 667.61 115.05 466.94 581.99
Total 5,800.61 2,872.91 8,673.52 1,652.69 1,624.04 3,276.73 756.53 1,099.95 1,856.48
* Note : Reserves denote balance recoverable reserves of hydrocarbons
Hydrocarbon in-place Reserves Accretion
1.1.84 The likely achievement in hydrocarbon in-place reserve accretion during X
Plan period is approximately 1,797 MMTOE as against the X Plan target of
785-914 MMTOE, which is almost double. The share of Private/JV
companies is about 58 percent while ONGC and OIL in-place reserve
accretion share accounts for 36 percent and 6 percent respectively. The
details of hydrocarbon in-place reserves accretion during X Plan period are
given below.
Ministry of Petroleum and Natural Gas Page 26 of 164

8/3/2019 wg11_petro
http://slidepdf.com/reader/full/wg11petro 27/164
Report of the Working Group on Petroleum and Natural Gas for the XI Plan (2007 – 2012)
Table 3.2: Summary of X Plan Target Vs. Achievements (In-place Reserve Accretion)
(Figures are in MMTOE)
Company X PlanTarget
Achievementup to March
2006
Likelyachievement
in X plan
IXPlan
Actual
Likelypercent
Achievement
against XPlan target
percentAchievement
against IX
Plan Actual
ONGC 561-576 507.27 671.27 481.80 116.5 139.3
Oil India Ltd. 108-118.5 81.22 103.72 83.46 87.5 124.3
Pvt. / JVcompanies
114-214 858.43 1038.43 229.87 485.2 451.7
TOTAL 785-914 1446.92 1813.42 795.13 198.4 228.1
Oil and Gas Discoveries
1.1.85 During the first 4 years of X Plan, 82 oil and gas discoveries were made byONGC, OIL and Private/JV companies. Most of the gas discoveries were
made in Krishna-Godavari Basin, off the East coast of India. Participation of
private players in oil and gas exploration under NELP has changed
perception about prospectivity of Indian Sedimentary basins. Indian deep
water areas are now considered to be prospective.
3.3 Crude Oil and Natural Gas Production
1.1.86 During X Plan, the likely achievement in production of crude oil and natural
gas is 167.79 MMT and 158.38 BCM respectively, which is higher than the
IX Plan’s actual production and marginally less than the X Plan’s target.
The details of production targets vis-à-vis achievements during X Plan are
in the table.
Table 3.3.: Summary Of X Plan - Targets Vs. Achievements (Production)
Company Activity X PlanTarget
Achievementup to
March06
Likelyachievement
in X plan
IXPlan
Actual
%Achievement
&Achievement
against IXPlan Actual
ONGC Oil & condensateproduction(MMT)
130.03 102.95 130.171 129.05 100.2 100.9
Gas Production
(BCM) 112.11 93.37 115.69 117.21 103.2 98.1
Production O +OEG (MMTOE)
242.14 196.32 245.175 246.26 101.6 99.6
Oil IndiaLtd.
Oil & condensateproduction(MMT)
18.70 12.38 15.88 16.10 84.9 98.7
Gas Production(BCM)
12.61 7.91 10.27 8.59 81.5 119.5
ProductionO+OEG(MMTOE)
31.31 20.29 26.16 24.69 83.5 105.9
Ministry of Petroleum and Natural Gas Page 27 of 164
4

8/3/2019 wg11_petro
http://slidepdf.com/reader/full/wg11petro 28/164
Report of the Working Group on Petroleum and Natural Gas for the XI Plan (2007 – 2012)
Table 3.3.: Summary Of X Plan - Targets Vs. Achievements (Production)
Company Activity X PlanTarget
Achievementup to
March06
Likelyachievement
in X plan
IXPlan
Actual
%Achievement
&Achievement
against IXPlan Actual
Pvt. / JVcompanies
Oil & condensateproduction(MMT)
20.66 17.25 21.55 17.79 104.3 121.2
Gas Production(BCM)
52.77 26.04 32.82 15.66 62.2 209.6
Production O +OEG (MMTOE)
73.43 43.29 54.37 33.45 74.0 162.6
GRANDTOTAL
Oil & condensateproduction(MMT)
169.39 132.59 167.60 162.94 99.0 102.9
Gas Production
(BCM)
177.48 127.32 158.79 141.46 89.5 111.8
Production O +OEG (MMTOE)
346.87 259.90 326.704 304.40 94.1 107.0
1.1.87 The reasons for the shortfall in oil and gas production are - fire at Mumbai
High process platform, non-commensurate drilling results necessitating the
revision of geological models, less production from IOR/EOR projects than
the targets of Feasibility Report (FR), increase in water cut and less than
anticipated performance in few fields.
Implementation of IOR/EOR Projects
1.1.88 18 schemes of IOR/EOR have been approved to increase recovery factor
from ageing oil and gas fields of ONGC. The IOR/EOR schemes under
implementation include 5 offshore, 10 onshore Improved Oil Recovery and
3 Enhanced Oil Recovery schemes as given below:
a. 5 Offshore IOR Projects: Mumbai High North Redevelopment, Mumbai High South
Redevelopment, Neelam (completed in July, 2005), Additional Development Heera
Pt-I (completed in December, 2005) and Additional Development Heera Pt.-II.
b. 3 EOR Projects in Gujarat: Insitu Combustion Balol (completed in November 2001),
Insitu Combustion Santhal (completed in December 2001) and Extended Polymer Sanand (completed in September 2002).
c. 7 IOR Projects in Gujarat: Santhal Infill (completed in November 2003), Gandhar
(completed in July, 2005), Kalol, North Kadi Phase-I, Sobhasan, Jotana (completed)
and North Kadi Phase-II.
d. 3 IOR Projects in Assam: Lakwa Lakhmani, Rudrasagar and Galeki.
1.1.89 The estimated cost of 18 schemes is about Rs. 11,649 crore and expected
oil gain of about 120 MMT by 2030. One scheme, namely, Lanwa is yet to
be approved by ONGC. 8 schemes namely in-situ Combustion Balol, in-situ
Combustion Santhal, Extended Polymer Sanand, Additional Development
Ministry of Petroleum and Natural Gas Page 28 of 164

8/3/2019 wg11_petro
http://slidepdf.com/reader/full/wg11petro 29/164
Report of the Working Group on Petroleum and Natural Gas for the XI Plan (2007 – 2012)
Heera Pt-I, Santhal Infill, Jotana, Gandhar and Neelam have been
implemented by ONGC. As on 1.4.2006, the actual cumulative incremental
oil production from IOR/EOR projects was about 22.65 MMT as compared
to expected oil production of 31.4 MMT, which is about 72 percent of the
planned cumulative incremental crude oil production. The actual investment
by ONGC on these IOR/EOR projects was of the order of Rs. 9,518 crore(89 percent) as against the Plan expenditure of Rs. 10,684 crore till March,
2006.
3.4 Implementation of New Exploration Licensing Policy (NELP)
1.1.90 Government of India has been inviting private investment in exploration of
oil and gas in the country since 1980s. However, initial efforts to attract
private investment were limited to offshore areas only. Since 1991,
Government of India offered exploration blocks almost on a regular basis
for both onshore and offshore areas and announced six bidding rounds till
1995. A New Exploration Licensing Policy (NELP) was formulated in 1997-
98 which provides a level playing field to the private investors by giving thesame fiscal and contractual terms as applicable to NOCs for the offered
exploration acreages.
1.1.91 Under NELP, PSCs for 110 exploration blocks have already been signed. It
is estimated that oil and gas in-place reserves accretion under NELP is
approximately 510 MMTOE from 16 discoveries. Reserve accretions under
NELP have upside potential of further increases after appraisal of all the
hydrocarbon discoveries. In first five rounds of NELP, the expected
investment is of the order of US$ 5 billion. Under NELP, 30 discoveries
have already been made by private/JV companies.
1.1.92 Sixth round of NELP was launched on 23rd February, 2006 by offering 55
exploration blocks comprising 25 onland blocks, 6 shallow offshore blocks
and 24 deepwater blocks. A total of 165 bids were received from
private/foreign companies as well as NOCs for 52 exploration blocks. The
summaries of exploration blocks awarded under each of the bidding rounds
and subsequently signed are given in the following table.
Table 3.4: Summary of NELP Exploration Blocks
Parameter NELP-I NELP-II NELP-III NELP-IV NELP-V
No. of blocks offered 48 25 27 24 20
No. of blocks bid for 28 23 24 21 20No. of bids received 45 44 52 44 69
No. of blocksawarded
25 23 23 21 20
No. of PSCs signed 24 23 23 20 20
Signed on April, 2000July,2001
February,2003
February,2004
December/September,2005
Area Awarded (Sq.km)
1,94,735 2,63,050 2,04,588 1,92,810 1,15,180
Ministry of Petroleum and Natural Gas Page 29 of 164

8/3/2019 wg11_petro
http://slidepdf.com/reader/full/wg11petro 30/164
Report of the Working Group on Petroleum and Natural Gas for the XI Plan (2007 – 2012)
3.5 Implementation of Coal Bed Methane (CBM) Policy
1.1.93 CBM is natural gas (methane) adsorbed in coal and lignite seams and is an
eco-friendly non–conventional source of energy. Coal is both the source
and reservoir rock for CBM. A saturated CBM reservoir could contain up to
five times the amount of gas contained in a conventional gas reservoir of
comparative size, temperature and pressure. CBM production is done by
simple de-pressurization and de-watering process. To harness this new
source the Government of India approved a comprehensive CBM policy in
July, 1997 for exploration and production of CBM gas. As in case of NELP,
the attractive contractual and fiscal terms offered include: no upfront
payment, no signature bonus, no participating interest of Government,
award of blocks through global bidding, no customs duty on imports,
freedom to market gas in domestic market etc.
First and Second Round of CBM Policy
1.1.94 Under the first round of CBM, Contracts for 5 blocks falling in the States of
Jharkhand (2) Madhya Pradesh (2) and West Bengal (1) were signed in
July 2002. Two blocks each were awarded to ONGC–IOC consortium and
Reliance Industries Limited (RIL) and one to Essar Oil Limited. Contracts
for two CBM blocks in West Bengal and Jharkhand were signed with ONGC
and Coal India Limited (CIL) in February 2003. These two blocks were
awarded to the ONGC-CIL consortium on nomination basis. One block in
West Bengal was awarded to M/s GEECL through FIPB route in May 2001
before implementation of the CBM policy.
1.1.95 Under the second round of CBM, 9 blocks falling in the States of
Jharkhand, Chhattisgarh, Madhya Pradesh, Maharashtra, Andhra Pradesh,
Rajasthan and Gujarat were offered under international competitive bidding
in May 2003. A total of 14 bids for 8 CBM blocks were received. 8 CBM
blocks were awarded and contracts were signed on 6 February 2004. The
exploratory efforts carried out by the operators have resulted in
establishment of 6 TCF of CBM gas in 4 CBM Blocks. Production from
these blocks is expected to commence in 2007-08.
Third Round of CBM
1.1.96 Under the third round of CBM, 10 blocks were offered on 23rd February2006 falling in the six States of Andhra Pradesh, Chattisgarh, Jharkhand,
Madhya Pradesh, Rajasthan and West Bengal. Bid closing date was 30th
June, 2006. A total of 26 companies including 8 foreign companies and 18
Indian companies bid either on their own or as consortia. All the blocks
have attracted multiple bids. Evaluation of the bids has been completed.
The award of these blocks was made on 5th October, 2006.
3.6 Equity Oil and Gas from Abroad
1.1.97 In view of unfavourable demand–supply balance of hydrocarbons in the
country, acquiring equity in overseas oil and gas assets is one of the
important components of enhancing energy security. The Government is
Ministry of Petroleum and Natural Gas Page 30 of 164

8/3/2019 wg11_petro
http://slidepdf.com/reader/full/wg11petro 31/164
Report of the Working Group on Petroleum and Natural Gas for the XI Plan (2007 – 2012)
encouraging oil PSUs to aggressively pursue equity oil and gas
opportunities overseas. OVL has made an investment commitment of over
US$ 5 Billion and has an oil and gas production of 6.6 MMTOE in the year
2005-06. OVL has a target to produce 20 MMTPA by 2020.
1.1.98 OIL, IOC and GAIL are also engaged in acquiring overseas E&P assets.OIL–IOC combine has an exploration block in Libya apart from being OVL
partners. GAIL has interest in one Myanmar offshore block. OVL has
signed an MOU with the Mittal Group for leveraging their presence in some
hydrocarbon rich countries such as Kazakhstan. Some of the major E&P
opportunities being pursued by OVL at present are in Ecuador, Thailand,
Venezuela, etc. In addition, private Indian companies like RIL and Essar are
also pursuing E&P opportunities abroad. The X Plan achievement of OVL in
terms of oil and gas production is as under:
Table 3.5: OVL's Oil & Gas Production Compared to the X Plan Targets
Year X Plan Targets Actual *
CrudeOil
(MMT)
NaturalGas
(BCM)
O + OEG(MMTOE)
CrudeOil
(MMT)
NaturalGas
(BCM)
O + OEG(MMTOE)
2002-03 - 0.23 0.23 0.18 0.07 0.25
2003-04 - 0.60 0.60 3.35 0.52 3.87
2004-05 - 0.80 0.80 3.71 1.35 5.06
2005-06 1.20 1.26 2.46 4.87 1.75 6.62
2006-07 4.00 2.05 6.05 4.73 1.71 6.44
Total 5.20 4.94 10.14 16.83 5.41 22.24
* Figures for 2006-07 are anticipated production
Lessons Learnt during X Plan
1.1.99 The following lessons on the exploration front were learnt during X Plan
period while attempting to meet the objectives/goals for the X Plan.
New reserves were added from the areas, which were relinquished by other
operators such as Rajasthan and KG Basin. This indicates that exploration is a
continuous process.
Companies adopting new technologies such as high resolution 3D survey benefited.
No major discoveries have been made by ONGC/OIL. However, private/JV
companies have shown better exploration efficiency.
Increasing the reserve portfolio by improved exploration efficiency and better
interpretation skills is the need of the hour.
Increasing knowledge-building efforts needed to promote acreages in the frontier
basins/sectors to attract investment.
Adoption of state-of-the-art technology for widening the exploration base, both
laterally and vertically, to logistically difficult and geologically complex areas including
Ministry of Petroleum and Natural Gas Page 31 of 164

8/3/2019 wg11_petro
http://slidepdf.com/reader/full/wg11petro 32/164
Report of the Working Group on Petroleum and Natural Gas for the XI Plan (2007 – 2012)
deep waters. Considering the geological and financial risk in such ventures, strategic
partnerships/alliances may be preferred.
Strategic shift towards stratigraphic and strati-structural traps with enhanced 3D
seismic coverage and more intellectual inputs are becoming necessary for realizing
considerable potential from additional plays in the already probed areas.
Extensive and intensive efforts are needed to be put in for augmenting the gas
reserves.
Establishment of E&P and archival database is required to offer blocks through Open
Acreage Licensing Policy (OALP).
1.1.100 On the oil and gas production front, the following needs focused attention:
Faster development of already discovered reserves.
Development of isolated and marginal fields as these may be economical in a highprice scenario.
Continuation of IOR/EOR schemes to augment the recovery/production since a
majority of the producing oil fields have reached the decline stage.
To avoid geological surprises, proper planning and development of effective
monitoring system for implementation of Improved Oil Recovery (IOR) Projects.
Adoption of life cycle concepts for field development to optimize inputs and reduce
costs.
Enhancing productivity by drilling high angle, multilateral, drain holes and horizontalwells for all the fields as carried out in some of the offshore fields.
Development of cluster of marginal fields in offshore conditions by creating common
facilities/utilizing nearby existing infrastructure.
3.7 Consumption of Petroleum Products during X Plan
1.1.101 It has been observed that actual materialization of demand has not been in
line with the projections in spite of reasonable growth of the economy. X
Plan had projected CARG of 3.7 percent for oil during the plan period
(2002-07) under base case and CARG of 5.7 percent under the upper case.
However, as per actual data available for first four years of X Plan, CARG
achievement may be only 2.6 percent4. The details are as follows:
Table 3.6: Consumption of Petroleum Products during X Plan (MMT)
Year X Plan Projections Actual Consumption Variation
2002-03 107.1 104.1 - 3.0
2003-04 111.2 107.7 - 3.5
2004-05 113.6 111.6 - 2.0
2005-06 118.7 111.9 - 6.7
4 Indian Demand has grown only by 2 percent from 2001 till 2005 as per BP Statistical Review of World Energy June 2006. Consumption (BP statistics includes refinery
fuel & loss in demand) has grown from 107 MMT to 115.7 MMT respectively. The demand above is net of F&L.
Ministry of Petroleum and Natural Gas Page 32 of 164

8/3/2019 wg11_petro
http://slidepdf.com/reader/full/wg11petro 33/164
Report of the Working Group on Petroleum and Natural Gas for the XI Plan (2007 – 2012)
2006-07 (P) 123.5 114.0 - 6.5
1.1.102 The product wise details are at Annexure V.
1.1.103 Lower materialization is attributed to following reasons:
Substitution of POL demand by NG/LNG especially after commissioning of Dahej
terminal of PLL.
Structural change in GDP composition with now over 55 percent share being that of
services which is less energy intensive compared to industry and agriculture sectors;
Other factors like high oil prices coupled with conscious efficiency improvement,
improvement in roads, electrification of railways etc.;
Low growth in POL is likely to continue with huge natural gas find in various parts of
the country especially in the East-Coast and entry of many players for bringing LNGthrough imports with a view to provide competitive and clean fuel which is expected to
change the pattern of energy consumption in the country in the near future.
Opening of Auto sector to LPG, expansion of CNG to new cities, Government’s thrust
on development of National and State highways and rural connectivity with the urban
mainstream and resultant thrust to increased road movement activities will all add to
changes in consumption pattern of POL different from the past.
3.8 Refining Capacity
1.1.104 The refining capacity at the beginning of the X Plan was 114.67 MMTPA. X
Plan document placed capacity in the range of 138 MMTPA (under Scenario – I - Keeping in view the competitive environment in the
deregulated scenario, current low refining margins, the slow down of the
product demand and the fact that the companies would need to make
substantial investments in quality upgradation projects, only expansion
projects under implementation may fructify during the X Plan) to 155
MMTPA (under Scenario – II - If the product demand grows at a higher
rate, then in addition to the capacity expansion projects under
implementation, one or two new grass-root projects may also get completed
during the X Plan) by the end of the Plan. Accordingly, increase in capacity
was expected to be in the range of 23.33 MMTPA to 40.33 MMTPA.
Refining Capacity Additions
1.1.105 Compared to the above projections, the likely achievement in refinery
capacity at the end of the X Plan will be 148.97 MMTPA or an increase of
34.30 MMTPA. Clearly, the targets have been adequately met. The details
of refinery capacity addition are as under:
Table 3.7: Refining capacity by the end of X Plan (MMT)
S.No.
Refinery Beginning of XPlan
Additions during XPlan
Beginning of XI Plan
Public Sector
Ministry of Petroleum and Natural Gas Page 33 of 164

8/3/2019 wg11_petro
http://slidepdf.com/reader/full/wg11petro 34/164
Report of the Working Group on Petroleum and Natural Gas for the XI Plan (2007 – 2012)
Table 3.7: Refining capacity by the end of X Plan (MMT)
S.No.
Refinery Beginning of XPlan
Additions during XPlan
Beginning of XI Plan
1 IOC, Digboi 0.65 0.65
2 IOC, Guwahati 1.00 1.003 IOC, Koyali 13.70 13.70
4 IOC, Barauni 4.20 1.80 6.00
5 IOC, Haldia 4.60 1.40 6.00
6 IOC, Mathura 8.00 8.00
7 IOC, Panipat 6.00 6.00 12.00
8 CPCL, Chennai 6.50 3.00 9.50
9 CPCL, Nagapatinam 0.50 0.50 1.00
10 BRPL, Bongaigaon 2.35 2.35
11 HPC, Mumbai 5.50 5.5012 HPC, Visakh 7.50 7.50
13 BPC, Mumbai 6.90 5.10 12.00
14 KRL, Kochi 7.50 7.50
15 NRL, Numaligarh 3.00 3.00
16 ONGC, Tatipaka 0.08 0.08
17 MRPL, Mangalore 9.69 9.69
Total Public Sector 87.67 17.80 105.47
Private Sector
18 RIL, Jamnagar 27.0 6.00 33.00
19 EOL, Jamnagar 10.50 10.50
Total Private Sector 27.00 16.50 43.50
Grand Total 114.67 34.30 148.97
1.1.106 Some planned additions did not materialize during the X Plan due to
change in demand supply dynamics (IOCL Gujarat, 2.0 MMTPA and KRL
Kochi refinery, 2.0 MMTPA) while others faced shortage of land requiring
relocation of existing facilities (HPCL Mumbai refinery, 2.4 MMTPA).
1.1.107 The mid-term appraisal of the X Plan indicated a refining capacity of 141.70
MMTPA at the end of X plan, against which the likely achievement is
148.97 MMTPA i.e. an increase of 7.27 MMTPA.
3.9 Investments
E&P - Financial Outlays of Upstream NOCs during X Plan
1.1.108 Likely achievement of Rs. 78,329.43 crore during X Plan period is
anticipated as against the target of Rs. 51,968.95 crore for NOCs i.e.
ONGC, OIL and OVL. The projects of upstream NOCs were financed
through internal resources only. The company-wise details are as under.
Ministry of Petroleum and Natural Gas Page 34 of 164

8/3/2019 wg11_petro
http://slidepdf.com/reader/full/wg11petro 35/164
Report of the Working Group on Petroleum and Natural Gas for the XI Plan (2007 – 2012)
Table 3.8: Summary of X Plan - Outlay Targets Vs. Achievements E&P (Rs Crore)
Company X PlanTarget
Achieve-ment upto March
2006
Likelyachievement in X
plan
IX PlanActual
%Achieve
ment
%Achievement
against IXPlan Actual
ONGC33418.95
34788.28 49142.56 19989.00 147.0 245.8
OVL 13550.00
17746.78 24401.03 200.00 180.1 12200.5
ONGC +OVL
46968.95
52535.06 73543.59 20189.00 156.6 364.3
OIL 5000.00 2996.89 4785.84 2218.00 95.7 215.8
GRANDTOTAL
51968.95
55531.95 78329.43 22407.00 150.7 349.6
Refining and Marketing
1.1.109 Out of the total targeted X Plan investment of Rs. 36,572 crore for Refinery
and Marketing, Rs. 26,445 cores are to be invested in refining for capacity
augmentation, quality upgradation, de-bottlenecking and revamps in various
refineries, while the balance of Rs. 10,127 crore is for marketing and
pipelines projects. An investment of Rs. 17,674.75 crore is likely to be
realized in the refining sector in the X Plan period. The major shortfalls in
investment are due to deferment of the following projects.
Table 3.9: Shortfall in Investment in Refining sector for the X Plan
Project Investment
Rs Cores
Grassroots refinery of IOCL in Paradip, 1917
Provision of OHCU at IOCL Haldia 1247
Punjab refinery project of HPCL/ GGSRL 1930
Bina refinery project of BPCL/ BORL 873
Expansion/modernization of Kochi Refinery 1383
1.1.110 Though part expenditure has been incurred on the major projects indicated
above, some of these projects are now slated for implementation during the
XI Plan period. Investments in grassroots Paradip Refinery (IOCL), Punjab
Refinery (HPCL/ GGSRL), Bina Refinery (BPCL/BORL) and KRL Kochi
were deferred because of delays in finalization of tax concessions by the
state governments, demand supply considerations and Auto Fuel Policy
requirements. If these projects are excluded from the analysis, the likely
investment at the end of the X Plan is about 95 percent of the targeted
investment. It may be noted that the targeted/likely investment amounts
Ministry of Petroleum and Natural Gas Page 35 of 164

8/3/2019 wg11_petro
http://slidepdf.com/reader/full/wg11petro 36/164
Report of the Working Group on Petroleum and Natural Gas for the XI Plan (2007 – 2012)
mentioned here do not include investment in respect of private sector
refineries.
Natural Gas Sector
1.1.111 In the X Plan, 4 LNG terminals were envisaged, entailing an investment of
Rs. 7,000 – 9,400 crore (US$ 1.5 to 2.0 billion). Besides, transmission and
distribution pipeline investments were envisaged in the range of Rs. 13,000
crore to 15,000 crore (a total investment of Rs. 20,000 crore to Rs. 25,000
crore). This investment was based on the overall supply scenario from both
domestic and international sources. While the domestic scenario was more
predictable, the imported gas scenario had certain uncertainties. The
imported gas supply projected in X Plan period and the actual
achievements are given below :
Table 3.10: Gas supply imports projected in X Plan period Vs actual (MMSCMD)
Source 2002-03 2003-04 2004-05 2005-06 2006-07
LNG projected NIL NIL 20 40 50
LNG Actual NIL NIL 8 18 18-20
Transnational Pipelines NIL NIL NIL NIL 10
Transn’l P/L Actual NIL NIL NIL NIL NIL
1.1.112 In the context of the shortfall of about 40 MMSCMD in supplies from cross
border sources, the investment achieved is also expected to be lower. The
expected actual investment in the X Plan is about Rs. 10,500 crore to
Rs.12,000 crore. The shortfall is due to investment in only two terminals as
against four terminals proposed. Besides, the pipeline investments are inthe range of Rs.6,000 to 7,000 crore vis-à-vis the target of Rs 13,000 crore
to 15,600 crore. The transnational pipeline supply is not even envisaged in
the XI plan.
1.1.113 Against the approved outlay of Rs. 7,500 crore for GAIL, an expenditure of
Rs. 6,999.83 crore is anticipated. In addition the X Plan had an outlay of
Rs. 7,443.81 crore for petrochemical projects against which an expenditure
of Rs. 7,619.77 crore is likely to be made during the X Plan.
Table 3. 11: Summary of Plan Outlay Vs. Expenditure during X Plan (Rs Crore)
Sector Target for the XPlan
Anticipatedexpenditure for X Plan
Percentachievement
Exploration & Production 59468.59 85329.26 143.49
Refining & Marketing 36572.24 26352.90 72.06
Petrochemicals 7443.81 7619.77 102.36
Engineering 171.0 57.53 33.64
Total 103656.00 119359.46 115.15
1.1.114 Thus, the overall achievement in the oil and gas sector was about 115
percent of the approved X Plan outlay.
Ministry of Petroleum and Natural Gas Page 36 of 164

8/3/2019 wg11_petro
http://slidepdf.com/reader/full/wg11petro 37/164
Report of the Working Group on Petroleum and Natural Gas for the XI Plan (2007 – 2012)
4 Review of Policy Measures
4.1 Marketing and Distribution of Petroleum Products
Distribution of Petroleum Products
1.1.115 The current demand of POL in the country is 112 MMTPA, which is
projected to grow up to 132 MMTPA by 2011-12 in base case projections of
XI Plan. The refining capacity of 132 MMTPA is projected to grow to about
200 MMTPA during the same period.
1.1.116 The landscape of country’s POL distribution has undergone a change with
surplus availability situation in most of the products. Imports/exports of
products are taking place on need/economic considerations. Based on
supply-demand balances, companies are entering into bilateral agreements
for product exchanges and sharing infrastructure on commercial
considerations. New infrastructure is being created to fulfil the demand-
supply gap based on rationalization and with a holistic view. After the
enactment of the PNGRB Act 2006, the provisions of the Act shall govern
the entities.
1.1.117 Since logistic costs play a significant role in commercial consideration, with
growing competition, each company is trying to reduce costs of production,
transportation, overheads, etc. Expansion of pipeline network is taking
place for reducing transportation costs and product losses. It is expected
that each company will therefore try to expand its pipeline network in
accordance to the Government policy guidelines and provisions of the Act
including the market/retail service obligations and other regulations under
the Act. The balance products would continue to move by rail/road. Therailways are putting efforts to modernize/upgrade and phase out four
wheeler with BTPN wagons.
1.1.118 Technological intervention by industry to ensure product quality and
quantity across supply chain has been initiated. Automation is being carried
out at retail outlets and terminals/depots. Further, tracking the movement of
tank trucks through Global Positioning System (GPS) is also being
implemented. This ensures smooth operations, which get tracked for any
scrutiny and minimises human intervention in the processes.
1.1.119 Several policies like blending of ethanol/bio-diesel, marketing of different
grades of POL products in different cities etc necessitate infrastructure
build-up and technology adoption by the OMCs.
1.1.120 The policy for blending of ethanol with petrol and of bio-diesel with diesel
throughout the country will have an impact on the petrol and diesel demand.
Similarly, usage of CNG/Auto LPG in transport vehicles has started
affecting consumption of petrol/diesel. The surplus petrol/diesel may have
to be exported. Keeping in view the above the following policies have been
examined.
Marketing of Petrol/Diesel, Kerosene and LPG
Petrol/Diesel
Ministry of Petroleum and Natural Gas Page 37 of 164

8/3/2019 wg11_petro
http://slidepdf.com/reader/full/wg11petro 38/164
Report of the Working Group on Petroleum and Natural Gas for the XI Plan (2007 – 2012)
i. The oil sector has been deregulated since April 2002, with the dismantling of APM,
and currently there are many players including private oil companies in the marketing
of petrol/diesel. The major existing policy is with respect to grant of marketing rights
for transportation fuels.
As per the existing policy any new player willing to market transportation fuels in Indiais required to invest or express intention to invest a minimum of Rs.2,000 crore in the
hydrocarbon sector, i.e., E&P, pipelines, terminals, etc. or the new player may
produce 3 MMT of crude to market the fuel. This policy is an essential requirement to
prevent fly-by-night operators entering the market, and may therefore be continued.
ii. The norms for setting up of retail outlets in low service areas (5.6 percent) and
remote areas (5.3 percent) by all the entities such as OMCs, private companies and
Multinational Companies (MNCs) should continue in order to make available
petrol/diesel in such areas.
iii. Adulteration is a menace, which needs to be tackled by all concerned through
technological and other interventions. Various steps to curb adulteration have beeninitiated. These include introduction of tamper-proof locks, use of GPS in tank-trucks,
introduction of marker system for adulterants like kerosene, retail automation, third
party certification, etc.
iv. Automation of retail outlets (ROs) selling more than 200 KL per month has to be
completed by March 2007. All the new regular ROs to be commissioned after March
2007 with anticipated volume above 200 KL per month should have automation.
v. ROs selling more than 100 KL per month would be covered under third party
certification by March 2007 and all the other regular ROs by March 2009. Effective
April 2007, all new regular ROs may be covered under third party certification and
commissioned.
vi. In order to check the en-route malpractices, all the company owned/dealer
owned/contractor tank trucks would be covered under monitoring of movement
through GPS by March 2007.
vii. The marker system introduced in kerosene can detect adulteration upto 1. percent.
To start with, it has been decided to implement marking of kerosene all over the
country with effect from 1.10.2006. It was also decided to provide test kits to RO
dealers to enable them to test petrol/diesel at the time of receipt at the RO.
Independent testing/separate audit would also be carried out. The estimated industry
expenditure for marker system is around Rs.1,000 crore during the next 5 years.Introduction of marker in naphtha may be implemented in the next phase.
viii. With competition having set in, there is a lot of focus on the customer needs.
Companies have started offering better forecourt services, non-fuel products at ROs,
usage of credit/debit/fleet cards with attractive loyalty programmes to attract and
retain customers and volumes. Innovative methods to improve customer relationship
are being introduced. With more and more ROs being commissioned and with
lowering of per pump throughput, companies may scout for opportunities in non-fuel
retailing to enhance dealers and company income levels.
Kerosene
Ministry of Petroleum and Natural Gas Page 38 of 164

8/3/2019 wg11_petro
http://slidepdf.com/reader/full/wg11petro 39/164
Report of the Working Group on Petroleum and Natural Gas for the XI Plan (2007 – 2012)
i. Respective State Governments are responsible for making dealer-wise PDS
kerosene allocation every month taking into account the State-wise allocation
received by them from the Government of India as per the existing allocation norms.
This is advised to the oil companies who in turn are responsible for placing the
product accordingly. It is also imperative that by the 25th of each month the total
allocation for the month is lifted by the dealers.
ii. The low price of PDS kerosene, being heavily subsidized, is a temptation to
unscrupulous elements in the system to divert this fuel for adulteration with diesel,
which is priced much higher. The study made by NCAER has pointed out the
diversion of PDS Kerosene to be in the order of about 38 percent. This prevents the
fuel from reaching the targeted population.
iii. Subsidised kerosene may be made available only to BPL families and various options
to improve the delivery of subsidy need to be examined. A pilot project for
introduction of smart card system in three districts, Nalanda (Bihar), Nainital
(Uttaranchal) and Latur (Maharashtra), would be launched with effect from 1.1.2007.
PDS kerosene may be allocated to the States only for BPL families using the BPLdata as used by the Department of Food & Public Distribution under TPDS for food
grains. Kerosene for APL families may be made available at free market price as per
requirements. The Government need not allocate kerosene for APL families, which
may be distributed through the existing mechanism of OMCs on commercial
considerations. However, there is a need to strengthen the mechanism for marketing
of free market kerosene.
LPG:
i. Domestic LPG, like kerosene, is subsidized by the Government. The subsidy is
available to all users of the domestic LPG, irrespective of their economic status.
Domestic LPG carries non-merit subsidy as it is not perceived as a fuel for the poor.
There is a case for gradually increasing the prices of domestic LPG to reflect the
market prices.
ii. The price difference between the domestic LPG and non-domestic LPG (Bulk or
packed) is a cause of diversion of domestic LPG to non-domestic use, like hotels,
restaurants, and automotive sector. In order to eliminate/reduce diversion of domestic
LPG to automotive sector and other commercial usage, oil industry has initiated
measures like refill audit to control the diversion.
iii. Auto LPG dispensing facilities have been set up in select areas to control pollution
and to reduce/eliminate diversion of domestic LPG to automotive sector. Thismeasure has yielded results and Auto LPG sales have gone up substantially in the
last two years. In order to further encourage use of auto LPG, Auto LPG Dispensing
Stations (ALDS) may be set up on priority in big towns which are not likely to receive
CNG in the short to medium term. Such investments, of course, would be driven by
commercial considerations.
iv. Government has approved a scheme for different colour coding of domestic and non-
domestic cylinders to prevent diversion of domestic LPG cylinders. This scheme may
be implemented expeditiously, and put into effect by 2007-08.
Ministry of Petroleum and Natural Gas Page 39 of 164

8/3/2019 wg11_petro
http://slidepdf.com/reader/full/wg11petro 40/164
Report of the Working Group on Petroleum and Natural Gas for the XI Plan (2007 – 2012)
4.2 Marketing & Distribution of Natural Gas
Policy for Development of Natural Gas Pipelines and City or Local Natural Gas
Distribution Networks Policy
1.1.121 The draft of the policy has been discussed at length with the industry and
has been developed in line with the PNGRB Act, 2006. The policy is likely
to be soon approved by the Government. The salient features of the draft
policy are given below.
i. All the natural gas and city or local distribution pipelines will be laid in accordance
with the authorization granted by the Regulatory Board under a transparent
mechanism. Dedicated pipelines laid to supply gas to specific consumers originating
from regulated pipelines will not require the authorization.
ii. Regulator shall develop a comprehensive set of technical standards and safetystandards as well as a code for grid connectivity.
iii. Progressive unbundling of common carrier transmission activity and gas
marketing/city/local gas distribution network.
iv. The designed pipeline capacity to be at least 33 percent more than the maximum
capacity requirement of the proposer and those who tie up for capacity. Such
capacity would be made available on ‘open access and non discriminatory’ basis at
transportation rates laid down by the Board.
v. The Board may consider different exclusivity periods for setting up of city gas
distribution networks and for marketing of gas by the entity developing such networks.
vi. Authorization to the proposer may be cancelled with forfeiture of his security deposit,
if the conditions of the authorization are not adhered to or the project is delayed
beyond the stipulated milestone(s).
vii. Once the project is commissioned the bid-bond would convert into a performance
bond and would provide the guarantee for satisfactory compliance of the conditions
stated in the authorization during the life of the project.
viii. The transportation tariff for the transmission pipeline or city or local natural gas
distribution network as also the manner of determining such tariff will be laid down by
the Board.
ix. The Government to prepare long term perspective plan for creating gas pipeline
network in consultation with the Board, State Governments, oil and gas industry, gas
consuming industries and other stake holders. The plan will be kept in view while
authorizing/approving new pipelines.
x. A National Gas Advisory Board (NGAB) shall be constituted to advise the
Government on all matters relating to this policy.
xi. To compliment and supplement the domestic investment, FDI upto 100 percent is
permitted in laying natural gas pipelines under automatic approval route.
Ministry of Petroleum and Natural Gas Page 40 of 164

8/3/2019 wg11_petro
http://slidepdf.com/reader/full/wg11petro 41/164
Report of the Working Group on Petroleum and Natural Gas for the XI Plan (2007 – 2012)
xii. State Governments to ensure various statutory and other clearances on a fast track
basis.
xiii. State Governments shall prepare their plans for developing the city or local gas
distribution networks, prioritizing the cities or local areas.
4.3 Auto Fuel Policy
1.1.122 As per the approved road map under Auto Fuel Policy, introduction of Euro-
III equivalent norms in the entire country from 01.04.2010 together with
Euro IV equivalent emission norms in the 11 major cities of Delhi, Mumbai,
Kolkata, Chennai, Bangalore, Hyderabad, Ahmedabad, Pune, Surat,
Kanpur and Agra was to be reviewed in the year 2006, after the
implementation of Bharat Stage-II emission norms in the entire country and
Euro III equivalent emission norms in these eleven major cities w.e.f.
01.04.2005. Euro-II/III norms have been introduced effective 1.10.2005.
1.1.123 Ministry of Environment and Forest (MoEF) had taken over the Air QualityMonitoring (AQM) project in line with the Cabinet decision on Auto Fuel
policy. MoEF has constituted a new Steering Committee under the
Chairmanship of Secretary, MoEF and Technical Committee under the
Chairmanship of Chairman CPCB. The Steering Committee to conduct and
monitor air quality studies in 6 cities of India as phase-I and the Technical
Committee to provide technical guidance and support to these studies.
1.1.124 The new Technical Committee revised the methodology for these studies
and the revised total cost of the Air Quality Studies in 6 cities, Emission
factor development for vehicles and source profiling for other sources is
Rs.22.20 crore. IOC R&D signed revised MoCs for AQM studies in Delhi,
Bangalore and Pune during the month of March 2006. In-use vehicles
emission factor determination project is being undertaken by ARAI, Pune
and has already completed large portion of the testing. CPCB signed MoCs
for the AQM projects in Mumbai, Chennai and Kanpur. ARAI, Pune and IIT
Mumbai will undertake source profiling of vehicular emissions and other
sources respectively. It is expected that the interim report of these studies
will be available by March 2007. On completion of these studies, the
government would conduct review. It is not expected that delay in review
will materially effect the implementation of the road map approved under
the Auto Fuel Policy.
Major Issues
1.1.125 Implementation of better specifications requires the refineries to incur huge
capital expenditure. For implementation of Euro III/IV fuel specifications,
the PSU refineries would incur significant expenditure over next 3-4 years.
Being a mandated project with no corresponding incremental revenue these
projects place significant burden on refining companies. The projects being
undertaken for the purpose of green fuels need to be incentivised which
could be in form of tax rebates or higher depreciation. At the same time
these projects should attract nil custom and excise duties to reduce the
overall cost.
Ministry of Petroleum and Natural Gas Page 41 of 164

8/3/2019 wg11_petro
http://slidepdf.com/reader/full/wg11petro 42/164
Report of the Working Group on Petroleum and Natural Gas for the XI Plan (2007 – 2012)
1.1.126 It may be recalled that the present projected production indicates a huge
surplus in both petrol and diesel necessitating exports. It has been
mentioned elsewhere in the report that for refineries to access developed
markets would need to meet the latest environmental product specifications
applicable in such markets. Providing incentives would also enable
refineries to export products to the developed nations.
1.1.127 The schedule for introduction of BS IV across the country needs to be
drawn, as BS IV vehicles cannot use BS III fuel even temporarily and like
BS III vehicles using BS II fuel.
1.1.128 Alternative fuels road map needs to be put in place giving adequate time to
all the stake holders. While oil companies have geared up to implement
sale of 5 percent ethanol-blended-petrol and 5 percent bio-diesel-blended-
diesel in the country, availability of ethanol and bio-diesel on a sustained
basis at commercially viable prices has been a major issue.
1.1.129 India has joined UN ECE WP-29 1998 agreement and is now a full member from April 2006. The 1998 agreement envisages creation of Global
Technical Regulations (GTR) for harmonized standards across the world
both in terms of driving cycle for emission measurement and safety
regulations. It is therefore, proposed that an Apex group may review this in
conjunction with the road map proposed in the Auto Fuel Policy to identify
the gap areas.
1.1.130 Indian auto industry would be using various technology options such as
particulate trap, Selective Catalytic Reduction (SCR), DeNox catalyst etc for
meeting the BS IV regulations. It is necessary that the auto industry is
geared to provide the same in time and in line with the proposed schedule.
Similarly, matching fuel quality as per the Euro IV fuel specifications would
have to be supplied by the oil industry in the 11 cities and on major
connecting highways.
1.1.131 The Auto Fuel Policy identified the need for controlling emissions through
improved I&M practices, vehicle retiring policies, better traffic management,
stricter PUC, etc. However, till date limited progress has been made without
having mandated any practice. There is urgent need to introduce these
policies.
4.4 Safety & Environment Management
E&P - OIL
1.1.132 During the plan period, efforts would be made to improve the Health Safety
and Environment (HSE) management in order to match the best global
practices so as to provide occupationally healthier work force, reduced
accident rates, cleaner and greener product with reduced discharges.
1.1.133 Thrust areas to achieve the above objective would be to review the existing
HSE management system and attempt to keep it at par with global
practices in the areas of HSE management and to adopt the international
standards to excel performance in areas of occupational health
management.
Ministry of Petroleum and Natural Gas Page 42 of 164

8/3/2019 wg11_petro
http://slidepdf.com/reader/full/wg11petro 43/164
Report of the Working Group on Petroleum and Natural Gas for the XI Plan (2007 – 2012)
1.1.134 In order to make the E&P operations compatible with the environment and
reduce discharges and emissions, the following would be attempted/put in
place during the XI Plan period:
Establishing self imposed discipline by oil companies in environment management
system for all oil and gas field installations and drilling rigs based on internationalstandards to ensure improvements towards reducing discharges and emissions to
internationally acceptable levels;
Eco-rating of major installations and compulsory environmental audits;
Pro-active measures to prevent marine pollution and to effectively combat oil spills;
Benchmarking at par with international oil majors with respect to environmental
practices;
1.1.135 By strictly adhering to recently developed Quality, Health, Safety and
Environment (QHSE) management system work procedures and plans,maintenance schedules of various equipments and machinery, need based
training, and providing necessary inputs and resources following area of
environment management will continue to receive constant attention.
Natural Gas
1.1.136 The role of safety in the gas sector assumes importance as also the safety
aspects in the various sub-activities of gas sector, i.e. gas handling,
processing/extraction of value added products, storage, transportation,
distribution and utilization. The safety aspects are also important in respect
of LNG import terminals, handling of cryogenic LNG tankers, and use of
LNG in the transport sector.
Safety System and its Management
1.1.137 The responsibility of the respective organization or individuals who would
handle natural gas or its derivatives play a major role in maintaining and
managing the safety systems so as to eliminate or minimize the risks which
may be posed if not adequately monitored and managed. The basic and
essential elements which need to be observed by the designers and
operators involved are:
Process reviews and adherence to standards, codes, practices and statutory laws bythe owners and designers;
Design procedures to ensure safety of the installation;
Proper risk management studies and adherence to them;
Process awareness among the operators;
Proper awareness campaigns to educate the uses of gas (CNG);
Proper maintenance of the equipments and installations;
Training to minimize the human factors in the incidents;
Ministry of Petroleum and Natural Gas Page 43 of 164

8/3/2019 wg11_petro
http://slidepdf.com/reader/full/wg11petro 44/164
Report of the Working Group on Petroleum and Natural Gas for the XI Plan (2007 – 2012)
Safety audits and corrective actions;
Proper communication channel of the system managers with the local administration
and local population;
Proper investigation procedure;
Crisis/Disaster Management Plans/Coordination Plans
Customer service and faster response time;
1.1.138 The above elements, if properly and fully adopted, with an objective of
continuous up-gradation of the safety systems to ensure and enhance
safety, would go a long way in minimizing the risks of the gas handling
systems. Whereas all safety standard, practices and provisions would
minimize the risk of mishap/incident, the crisis management plans would
need to be very effective to contain and minimize the damages in case any
incident does happen.
1.1.139 It is of paramount importance for any organization to organize the
overseeing of the safety, occupational health and environment aspects, as
they are the integral part of safety. To promote highest level of safety in
operations, aspects like health of employees and a clean environment,
need to be looked in totality, as these elements are integral to any activity
or installation in the gas sector. The basic responsibilities of such a body in
an organization may include safety audits, safety inspections and
subsequent follow-up of checklist points, guidance to projects on the
improvement in safe practices etc.
1.1.140 MoPNG constituted a Safety Council assisted by Oil Industry SafetyDirectorate (OISD) in 1986. OISD is involved in formulating and
implementing a series of self-regulatory measures aimed at removing
obsolescence, standardizing and upgrading the existing standards to
ensure safer operations. The standards developed by OISD so far are
mainly aimed at the hydrocarbon industry. Even though the standards are
self-regulatory in nature, following of these standards by the industry at the
design stage would go a long way to ensure safer operations in gas
installations.
Use of CNG in Automotive Sector
1.1.141 Use of CNG as an automotive fuel is being encouraged and propagated
due to environmental considerations in the cities, where gas is available.
After careful consideration of the international practices and the experience
of the industry, national safety standard has been adopted for CNG
installation by the statutory bodies. Further, implementation of OISD
recommended practices need to be considered and overseen in view of the
extensive use/storage of CNG in pressurized containers in automobiles.
The OISD standard on safety requirements for compression, storage,
handling and refuelling of natural gas for use in automotive sector, needs to
be followed by the CNG sector. The standard lays down the minimum
safety requirements at installations handling natural gas for dispensing into
vehicles and minimum checks required in the vehicles by refuelling stations.
Ministry of Petroleum and Natural Gas Page 44 of 164

8/3/2019 wg11_petro
http://slidepdf.com/reader/full/wg11petro 45/164
Report of the Working Group on Petroleum and Natural Gas for the XI Plan (2007 – 2012)
City Gas Distribution
1.1.142 Use of natural gas in the domestic sector, especially in the urban areas,
would gain further importance during the XI Plan period due to the flexibility
and the advantage of natural gas over competing fuels. Safety of such
distribution systems would need to be emphasized. Besides adhering to theinternational codes and practices for the design and operation of such
systems (such as ASME/ANSI B31.8), it would be desirable to develop
indigenous safety codes for city gas distribution and follow the same.
Refining and Marketing
1.1.143 Companies in the petroleum sector are committed to conducting business
with a strong environment conscience for sustainable development, safe
workplaces and enrichment of the quality of life of their employees,
customers and the community at large. Best procedures and practices of
the industry are in place at all operating units and installations to take care
of safety, occupational health and environmental hazards. These facilitiesare periodically reviewed, audited and upgraded for continuous excellence.
The environment management systems at the refineries, pipelines and
major marketing installations are certified under ISO- 14001 standards.
Role of Regulatory Agencies in Safety Management
1.1.144 The regulatory framework for the gas industry in the country will ensure a
uniform standard for all the natural gas based installations and gas
pipelines in the country. Though this framework implementation of the
minimum set of safety standards for the gas industry would be required it
would, however, be desirable for the owners of facilities to take proactive
measures in these matters to provide adequate safeguards to its working
personnel and environment.
4.5 Subsidy Structure
1.1.145 In addition to direct Government subsidy on LPG and kerosene, oil PSUs
are sharing the burden of subsidizing sensitive petroleum products namely
petrol, diesel, domestic LPG and PDS Kerosene. The Government has
enunciated the principle of equitable burden sharing to cushion the impact
of high international oil prices on domestic retail selling prices. Thus all
stakeholders viz. the Government, oil companies including the upstream
PSUs and consumers share the burden of price increase equitably.
1.1.146 In refining operations cost of crude constitutes over 85 percent of the total
product cost. Due to high oil import dependence (about three-fourths of our
crude requirement is imported) in this era of high oil price, our import bill
has burgeoned. In 2005-06, the crude import cost had increased to about
Rs.172,000 crore or by about 50 percent over 2004-05. In 2006-07, the
import bill is expected to be significantly higher. Therefore higher crude
prices necessitate adjustment in retail selling prices of sensitive petroleum
products. The impact is so large, that oil price vulnerability can be a great
dampener to our GDP growth and has the potential to disrupt not only
future development but also our fiscal position significantly.
Ministry of Petroleum and Natural Gas Page 45 of 164

8/3/2019 wg11_petro
http://slidepdf.com/reader/full/wg11petro 46/164
Report of the Working Group on Petroleum and Natural Gas for the XI Plan (2007 – 2012)
1.1.147 The Government is committed to protect the economically vulnerable and
weaker sections of the society by providing life-line energy at affordable
prices. During 2006-07, the projected burden is of the order of Rs 73,500
crore based on prices prevailing during April-May 20066. Oil PSUs will
continue to shoulder the largest share in the total under recoveries during
2006-07. The upstream companies will bear Rs. 24,000 crore giving upmost of their incremental revenues and the downstream companies will
shoulder about Rs. 9,000 crore through implementation of trade parity
concept, lower customs duty for petrol and diesel and commercial
discounts. The Government on its part will provide financial support through
bonds of Rs 28,300 crore. Thus the Government and its oil companies will
shoulder about 87 percent of the total burden.
1.1.148 However, as stated above, the current scenario cannot be sustained for any
length of time and radical solutions are called for.
Subsidy on Domestic LPG
1.1.149 The subsidy for domestic cooking gas should be phased out gradually or at
least substantially reduced. As recommended by the Rangarajan
Committee, a one-time upward adjustment in the price of domestic LPG by
Rs.75 per cylinder may be made. Beyond this one-time increase, it is
necessary to gradually increase the price of domestic LPG so that the retail
price adjusts completely to the market level eliminating the subsidy
altogether as early as possible. Strong political consensus is needed for
implementing the same.
Subsidy on PDS Kerosene
1.1.150 As in case of Domestic LPG, the subsidy on PDS Kerosene also needs to
be pruned. There have been no price increases during the X Plan period or
for now over four years, a situation perhaps not seen even during the APM
regime. In addition there are several reports that indicate that subsidised
kerosene supplies are being diverted denying the benefit to the intended
groups. In view of this, the Government has recently, in principle, accepted
the recommendations of the Rangarajan Committee that subsidy on PDS
Kerosene should be restricted to BPL families, for which detailed
implementation modalities are being finalised. This will help in reducing the
subsidies by 41 percent.
1.1.151 The only fool proof mechanism for preventing leakage and diversion is tomove towards a system of single price at the point of sale by oil companies
to the wholesale dealer with the subsidy being passed on to eligible BPL
households directly.
Subsidy on Petrol and Diesel
1.1.152 Though it has been a consistent assumption that petrol remains the fuel of
the relatively better off, the position has been changing. 71 percent of non-
transport vehicles5 are two wheelers, which run on petrol. Besides two
wheelers continue to sell roughly 7 times every car sold within the country.
Two wheelers essentially provide mobility to the aspiring class, the climbers
5As on 31.3.2003, Total registered two wheelers- 4.75 crores; total non-transport vehicles- 6.70 crores. Data as per Department of Road Transport & Highways
Ministry of Petroleum and Natural Gas Page 46 of 164

8/3/2019 wg11_petro
http://slidepdf.com/reader/full/wg11petro 47/164
Report of the Working Group on Petroleum and Natural Gas for the XI Plan (2007 – 2012)
and the middle class. Yet, there is a case for passing on the full price
impact to these consumers with realignment of excise duties as has been
discussed elsewhere in the report.
1.1.153 Diesel continues to remain the basic transportation fuel. While moderation
in price is required, it cannot be subsidised. Non-revision in price of dieselalone can increase the fiscal deficit.
1.1.154 In case of both petrol and diesel regular and small adjustments in price are
recommended, failing which we may be forced to correct prices in one go
bringing about a price shock. Furthermore, if we are to reduce consumption
of oil products, price signals must be transmitted to the consumers so that
they can make adjustments on their side as well.
4.6 Regulatory Environment
Objective
1.1.155 Different sectors of the Indian economy have progressively moved towards
the market-driven regimes in the past few years. In the sectors requiring
regulatory intervention, viz., electricity, telecom, etc, statutory regulators
have been established. Not only has this facilitated much-needed
investments in these sectors and their orderly growth, the consumers have
benefited on account of availability of better services and products at
competitive prices.
1.1.156 The PNGRB Act, 2006, notified by the Government on 3.4.06 provides for
the setting up of a Regulatory Board with the objective to regulate the
refining, processing, storage, transportation, distribution, marketing and
sale of petroleum, petroleum products and natural gas excluding production
of crude oil and natural gas so as to protect the interests of consumers and
entities engaged in specified activities relating to petroleum, petroleum
products and natural gas and to ensure uninterrupted and adequate supply
of petroleum, petroleum products and natural gas in all parts of the country
and to promote competitive markets and for matters connected therewith or
incidental thereto. The Act, inter alia, provides for a legal framework for
downstream gas sector regulation, and development of the natural gas
pipelines and city or local gas distribution networks.
1.1.157 Regulatory reforms permit and encourage market forces to enhance
competition and produce a more competitive and efficient industry structure.Natural gas pipelines and city gas distribution lines, being part of the
backbone infrastructure of the economy, need a robust regulatory
framework in order to curb monopolistic tendencies among the owners
while ensuring a fair price to the consumers and fair return to the
owner/producers.
Functions of the Regulatory Board
1.1.158 The Board shall have the following functions:
a) Protecting consumer interest by fostering competition and fair trade amongst the
entities;
Ministry of Petroleum and Natural Gas Page 47 of 164

8/3/2019 wg11_petro
http://slidepdf.com/reader/full/wg11petro 48/164
Report of the Working Group on Petroleum and Natural Gas for the XI Plan (2007 – 2012)
b) Register entities to:
i. Market notified petroleum and petroleum products and natural gas subject to
the contractual obligations of the Central Government.
ii. Establish and operate LNG terminals;
c) Authorize entities to:
i. Lay, build, operate or expand common carrier or contract carrier pipelines;
ii. Lay, build, operate or expand city or local natural gas distribution network;
d) Declare pipelines as common carrier or contract carrier;
e) Regulate, by regulations:
i. Access to common carrier or contract carrier pipelines so as to ensure fair trade and competition amongst entities;
ii. Transportation rates for common carrier and contract carrier pipelines;
iii. Access to city or local natural gas distribution networks so as to ensure fair
trade and competition amongst entities;
f) In respect of notified petroleum, petroleum products and natural gas:
i. Ensure adequate availability;
ii. Ensure display of information about the maximum retail prices fixed by theentity for consumers at retail outlets;
iii. Monitor prices and take corrective measures to prevent profiteering by the
entities;
iv. Secure equitable distribution for petroleum and petroleum products;
v. Provide by regulations and enforce, retail service obligations for retail outlets
and marketing service obligations for entities;
vi. Monitor transportation rates charged by natural gas pipelines by common
carrier or contract carrier and the price charged by a local distributioncompany and take corrective action to prevent profiteering by the provider
entities;
g) Levy fees and other charges as determined by regulations;
h) Maintain a data bank of information on activities relating to petroleum, petroleum
products and natural gas;
i) Lay down the technical standards and specifications including safety standards in
activities relating to petroleum, petroleum products and natural gas, including the
construction and operation of pipeline and infrastructure projects related to
downstream petroleum and natural gas sector and for this purpose specify a pipeline
Ministry of Petroleum and Natural Gas Page 48 of 164

8/3/2019 wg11_petro
http://slidepdf.com/reader/full/wg11petro 49/164
Report of the Working Group on Petroleum and Natural Gas for the XI Plan (2007 – 2012)
access code under regulations to establish a framework for third party access to
pipelines;
j) Perform such other functions as may be entrusted to it by the Central Government to
carry out the provisions of this Act.
Strengthening of DGH for Upstream Regulation
1.1.159 Government of India has delegated certain powers vested in it under
Oilfields (Regulation and Development) Act, 1948 and Petroleum and
Natural Gas Rules, 1959, as amended from time to time, to the Directorate
General of Hydrocarbons (DGH). The objective of the delegation of
statutory powers is to empower DGH so that it can effectively oversee the
ever increasing E&P activities in India with more areas coming under
exploration with successive rounds of NELP and CBM. Delegation of
powers to DGH mainly covers monitoring of upstream activities including
CBM operations, review and monitoring of exploration and development
programmes, reservoir monitoring with a view to optimize hydrocarbonrecovery, maintain data repository, lay down norms for declaration of
hydrocarbon discoveries and monitor Government revenue such as royalty
and profit petroleum.
1.1.160 To exercise this delegated powers, DGH, with the approval of Central
Government will prepare transparent guidelines. However, in respect of the
contracts, signed by the Government, DGH will exercise the powers in
accordance and consistent with respective contracts.
1.1.161 The Government has also amended Rule 19 of the P&NG Rules to enable
the Government/DGH to get all data from licensees/lessees, free of cost as
and when they are acquired and become available. All non-proprietary data
can be disclosed by the Government at any time and proprietary data can
be disclosed with the consent of the licensees/lessee at any time and after
5 years from the date from which such data become available or
termination of license/lessee whichever is earlier at the discretion of the
Government.
1.1.162 The above steps have been taken by the Government to promote E&P
activities in the country, strengthen DGH with more powers and enable
creating a National Data Repository (NDR) by facilitating DGH to get data
from NOCs and private companies for all acreages held by them from time
to time. This will also encourage effective use of available data in thecountry in promoting efficient E&P operations.
1.1.163 At the beginning of the X Plan period, the oil and gas sector was
deregulated with the dismantling of APM. Earlier, the exploration and
development activities were dominated by the NOCs, mainly ONGC and
OIL. However, Private/JV companies were provided an equal opportunity to
get into E&P business after implementation of NELP. Similarly the refining
and marketing sector also saw the entry of private players in the oil and gas
sector during the X Plan period. Moreover, private/JV companies have
emerged as significant players in hydrocarbon sector during X Plan period.
Ministry of Petroleum and Natural Gas Page 49 of 164

8/3/2019 wg11_petro
http://slidepdf.com/reader/full/wg11petro 50/164

8/3/2019 wg11_petro
http://slidepdf.com/reader/full/wg11petro 51/164
Report of the Working Group on Petroleum and Natural Gas for the XI Plan (2007 – 2012)
1.1.169 Bidding out of Subsidies: Bidding out of subsidies is considered
operationally challenging as no company would be in a position to service
all customers in an area, or take over customers of another company.
There may be logistics issues involved due to infrastructure constraints.
1.1.170 Assessment of the Sedimentary Basins: MoPNG expects that over 88percent of sedimentary basinal area would be licensed out for exploration
by the end of XI Plan. This is expected to accelerate the exploration to the
extent that all resources viz. funds, workforce, technology and logistics are
expected to be put to test. The policy environment and regulatory regime is
being strengthened to enable facilitation of such rapid opening up of the
sector.
1.1.171 Gas Hydrates: DGH is implementing the National Gas Hydrates
Programme (NGHP) as per the laid down road map. DGH has acquired
core samples from offshore areas through scientific cooperation program
with the USA. India thus became the third country in the world to do so.
This activity will help in assessment of gas hydrates resource potential inIndian waters. After assessment of resource potential, major challenge for
the project will be to develop technologies for exploitation of gas hydrates in
collaboration with Indian/foreign scientists. Globally, gas hydrates is at R&D
stage only.
1.1.172 Oil Shale: During XI Plan, resource estimation for oil shale in India and
identifying suitable technologies to exploit the potential of oil shale has been
planned.
1.1.173 Provide Level Playing Field for Foreign Operators: Under NELP, licences
for exploration are awarded through a competitive bidding system and
NOCs are required to compete on an equal footing with Private Indian and
foreign companies to secure exploration acreages. Similarly, Government
approved a CBM policy in July 1997 for exploration and exploitation of CBM
gas. Under this policy also, a level playing field in CBM exploration has
been provided to NOCs and private companies, both Indian and foreign.
1.1.174 All Non-dedicated Transportation and Distribution Assets to be Common
Carrier: The PNGRB Act 2006 has laid down provisions for declaring
transportation and distribution networks as common or contract carrier.
However, non-dedicated assets could be made available with mutual
consent on commercial terms between the entities.
1.1.175 Follow International Best Practices: Government has already announced
the policy for declaration of hydrocarbon discoveries, which is being
implemented by DGH. As of now the DGH performs the functions of an
upstream regulator, which essentially relates to implementation of
contractual obligations under the PSCs. The issue of adopting best
international practices by the DGH can be considered for implementation.
1.1.176 Mumbai High Crude Price Discovered through an Open Auction: This could
be considered wherein Government can mop up incremental revenue and
this option may be extended uniformly for all domestic oil fields.
Ministry of Petroleum and Natural Gas Page 51 of 164

8/3/2019 wg11_petro
http://slidepdf.com/reader/full/wg11petro 52/164
Report of the Working Group on Petroleum and Natural Gas for the XI Plan (2007 – 2012)
1.1.177 Declared Goods Status for NG/LNG: Oil companies have time and again
requested for treating gas and crude as ‘declared goods’. This helps in
rationalisation of tax rates and the administration of taxes is much easier.
This also saves potential litigations on the subject of rates and applicability
of rates and thus saves oil companies from undue inconveniences and
litigation costsThe Working Group supports this point of view.
1.1.178 LNG Imports: The benefits of long term contracts of LNG are demonstrated
in the PLL Dahej Project. It is an endeavour of MoPNG and the oil
companies to continue to establish such long term linkages in the XI Plan
period.
1.1.179 Strategic Reserves : Taking into account the oil security concerns of the
country, the Government has decided to set up 5 MMT strategic crude oil
storages at various locations in the country viz. Mangalore (1.5 MMT),
Vizag (1.0 MMT) and Padur near Udipi (2.5 MMT). The proposed facilities
would be managed by Indian Strategic Petroleum Reserve Limited (ISPRL),
a special purpose vehicle, owned by OIDB.
1.1.180 Natural Gas Allocation and Pricing: MoPNG has been regulating the
allocation and pricing of gas produced by the NOCs by issuing
administrative orders from time to time. Gas produced by the JVs and by
NELP operators is governed by the respective PSCs. The consumer price
of APM gas has been revised by the Government w.e.f. 1 July 2006 on an
ad-hoc basis, subject to the determination of producer price of ONGC and
OIL by the Tariff Commission. It was also decided that for the APM gas
consumers, other than power and fertilizer sector consumers, the gas price
would be progressively increased over the next three to five years to reflect
the market price. This policy will continue during the XI Plan period. Aspecific volume of gas produced by NOCs would continue to be
administered as regards price, to benefit specified sectors like fertiliser and
power. The MoPNG is committed to allow market determined pricing
mechanism for the domestically produced gas, as has been committed to
producers in the PSCs. As such MoPNG does not envisage any alternate
pricing mechanism for domestic gas in the XI Plan period.
1.1.181 Gas Pipeline Network: The Government is formulating a Gas Pipeline
Policy, which envisages the progressive development of a transmission and
distribution pipeline network, as also the growth of city or local gas
distribution networks in a competitive environment, involving both the public
sector and the private sector. The objective of the policy is to promoteinvestment and to facilitate open access for all players to the pipeline
network on a non-discriminatory basis, promote competition among entities
thereby avoiding any abuse of the dominant position by any entity.
Appropriate regulations on various matters would be notified by the
Regulatory Board under the PNGRB Act, 2006.
1.1.182 Diplomacy to Access Overseas Hydrocarbon Reserves: Government is
taking necessary steps as and when required to get access to overseas
hydrocarbon reserves.
1.1.183 Ensuring Energy Security: During XI Plan, thrust areas identified include
acquiring overseas assets, development of alternate resources (CBM and
Ministry of Petroleum and Natural Gas Page 52 of 164

8/3/2019 wg11_petro
http://slidepdf.com/reader/full/wg11petro 53/164
Report of the Working Group on Petroleum and Natural Gas for the XI Plan (2007 – 2012)
UCG), faster development of existing reserves and accelerated exploration
in the country thereby ensuring energy security.
1.1.184 Merge PCRA with Bureau of Energy Efficiency (BEE): PCRA was created
way back in 1973 at the initiative of oil companies. PCRA has been
contributing to the energy conservation relating to the petroleum sector.BEE has come into being just about five years back and is gathering
momentum in conservation of energy in the power sector. Lot of scope
exists for conservation plan and schemes in the oil and natural gas sector.
Therefore, PCRA should maintain separate identity and keep pursuing the
conservation measures in the petroleum sector. Instead of merging both
the entities it would be more appropriate to take advantage of synergy
between the two entities for getting benefit to the economy. Towards this
end more rigorous efforts towards energy efficiency and oil conservation
may be necessary. There is a need for more intensive focus through
enhanced energy auditing, labelling etc for all the industries.
1.1.185 Boosting Energy Related R&D: MoPNG agrees, in principle, that energyR&D deserves to be given special attention and added attention may be
given with regards to funds’ generation. While creating the proposed
National Energy Fund (NEF), the funding and the rebate structure needs to
be deliberated in detail by all stakeholder and analysed for its impact before
hand as the R&D expenditure of most of the major energy firms are too low
and may not even exceed 0.1 percent of their turnover.
4.8 Dr. C Rangarajan Committee Report
1.1.186 The Government on 26th October 2005 had set up a committee to look into
the various aspects of pricing and taxation of petroleum products with a
view to stabilizing/rationalizing their prices, keeping in view the financial
position of the oil companies, conserving petroleum products, and
establishing a transparent mechanism for autonomous adjustment of prices
by the oil companies. Based on the deliberations in the meetings, the
following three areas were identified by the committee for detailed study in
order to meet the objectives set out in the terms of reference:
Alternative models for pricing of petroleum products;
Taxes and duties on crude oil and petroleum products;
Subsidies on PDS kerosene and domestic LPG.
1.1.187 The recommendations made by the committee can be divided broadly into
three groups. The first set of recommendations relating to pricing of petrol
and diesel are the following:
i. Shift to a trade parity pricing formula for determining refinery gate as well as retail
prices;
ii. Government to keep at arms length from price determination and to allow
flexibility to oil companies to fix the retail price under the proposed formula; and
Ministry of Petroleum and Natural Gas Page 53 of 164

8/3/2019 wg11_petro
http://slidepdf.com/reader/full/wg11petro 54/164
Report of the Working Group on Petroleum and Natural Gas for the XI Plan (2007 – 2012)
iii. Reduce effective protection by lowering the customs duty on petrol and diesel to
7.5 percent.
1.1.188 This set of recommendations should be implemented as an integrated
package as selective implementation will create more distortions.
1.1.189 The second set of recommendations relates to pricing of domestic LPG and
PDS kerosene, viz:
i. Restrict subsidized kerosene to BPL families only;
ii. Raise the price of domestic LPG by Rs. 75/cylinder;
iii. Discontinue the practice of asking ONGC/GAIL/OIL to provide upstream
assistance, but instead collecting their contribution by raising the OIDB cess from
the present level of Rs. 1,800/MT to Rs. 4,800/MT; and
iv. Government to meet the balance cost of subsidy from the budget. The ‘PDSKerosene and Domestic LPG Scheme 2002’ will have to be suitably amended for
this purpose.
1.1.190 This set of recommendations should also be implemented as an integrated
package as partial implementation will not yield sustainable results.
1.1.191 The third set of recommendations relates to restructuring of excise duties
from the present mix of specific and ad-valorem to a pure specific levy and
calibrating the levies at Rs. 5.00 per litre for diesel and Rs. 14.75 per litre
for petrol.
1.1.192 The Government has accepted the following major recommendations of Dr.Rangarajan Committee.
Pricing of Petrol and Diesel
Pricing formula for Petrol and Diesel has been changed to trade parity which would
be a weighted average of the import parity and export parity prices in the ratio of
80:20
Principle of trade parity pricing will apply for the refinery gate price as well as for
determining the retail price.
The relative weights of exports and imports in estimating the trade parity price will be
reviewed and updated every year.
The Government has moved towards providing flexibility to oil companies to fix retail
prices autonomously. However, the current international scenario is not conducive to
pricing freedom with oil prices recording historical high every successive month. The
Government is committed to provide full freedom when international prices stabilize.
Rationalization of Customs Duty
Custom duties on petrol and diesel have been reduced to 7.5 percent from 10
percent.
Ministry of Petroleum and Natural Gas Page 54 of 164

8/3/2019 wg11_petro
http://slidepdf.com/reader/full/wg11petro 55/164
Report of the Working Group on Petroleum and Natural Gas for the XI Plan (2007 – 2012)
Customs duty on crude has been retained at 5 percent.
Customs duty on industrial products other than petrol and diesel may be retained at
10 percent in order to protect domestic producers who suffer sales tax as compared
to direct importers.
Burden Sharing by the Government
The Government has decided to share the burden of not making full adjustment in
domestic retail prices due to high oil prices through the principle of equitable burden
sharing wherein Rs 28,300 crore would be borne in the form of oil bonds during 2006-
07.
Adjustment of Subsidy on Kerosene
The Government has accepted in principle to restrict supply of PDS kerosene to BPL
households.
In computing the quantum of subsidy entitlement of states on PDS kerosene, BPL
households’ estimates of the Planning Commission will be used and a uniform criteria
and estimation methodology will be applied.
Recommendations found Non-implementable at the Current Stage
1.1.193 Some of the recommendations have been found non-implementable in the
current scenario of abnormally high prices. Freight equalisation has been
continued for the present. Besides full price increases required have not
been passed through in periods of volatile international prices.
Rationalization of excise duty and sales taxes remains. Further the
differential in retail prices is being equitably shared rather than met fullyfrom the fiscal budget in a transparent manner.
Other Recommendations
Restructuring of Excise duties
1.1.194 Adjusting excise duties to a higher or a lower level has arguments on both
sides. Those proposing higher level of duties have argued that prices of the
petrol and diesel need to be consciously kept high to provide appropriate
price signal to the consumers. India being oil import dependent, we need
not encourage consumption. At the same time, funds collected through
excise can be utilized to meet funding for social schemes.
1.1.195 The counter argument has been that lower taxation will reduce the burden
of the consumers. A country like India needs to strike a balance between
diverse objectives. Taxation on subsidised products is already minimal with
no excise duty on PDS Kerosene and domestic LPG. Consumption of
these products is restrained through allocations and lower new connections.
In case of petrol and diesel, there is no restraint on consumption except
may be indirectly through higher prices. Therefore, as far as excise duty on
petrol and diesel is concerned, there is merit in high taxation. Similar
practice is followed across Europe by developed countries.
Ministry of Petroleum and Natural Gas Page 55 of 164

8/3/2019 wg11_petro
http://slidepdf.com/reader/full/wg11petro 56/164
Report of the Working Group on Petroleum and Natural Gas for the XI Plan (2007 – 2012)
1.1.196 As regards, advalorem components in excise duty, an 8 percent rate does
not appear excessive though it does compound price increases to a certain
extent. From the taxation point of view, it is necessary to maintain price as
well as quantity buoyancy.
1.1.197 Rangarajan Committee has pointed out that large disparity between exciseduties of petrol and diesel needs to be rectified. This is contrary to the
global trend where the excise levies on both products are more or less
equal. Indeed, in some countries, diesel is costlier than petrol. The
contrarian trend in our economy leads to inefficient substitution of one fuel
for another.
1.1.198 Though, in principle, high taxation can be supported it is necessary to
realign taxes between transportation fuels – petrol, diesel and ATF keeping
in mind the ability of the consumers to shoulder the burden. The current
excise duties along with its consumers is indicated in the table below:
Table 5.1: Current Excise Duties on Petrol, Diesel
TransportationFuel
Excise Duty6 Consumers
Petrol
Rs.13/Ltr + 8 percent
(Rs 15.18/litre)
Mainly owners of two wheelersand cars
Diesel
Rs.3.25/Ltr. + 8 percent
(Rs 5.20/litre)
Trucks, public transport, railwaysand farmers
ATF
8 percent
(Rs 2.66/litre)
Airline travellers
1.1.199 It may be seen that the current policy seems to favour airline travellers who
perhaps can afford higher taxation in contrast to people who travel by buses
in public transport or on rail. Clearly, there is a case to realign excise duty
considering the consumers. ATF could be taxed at the highest level with
petrol being taxed at a lower level. Diesel being the lifeline of commerce
should attract moderate taxation, but the least of the three transportation
fuels.
Restructuring of State Sales Taxes
1.1.200 Rangarajan Committee observes that sales tax collection from oil sector
have consistently been contributing to a third or more of the total sales tax
collections of the states thereby burdening the consumers as well as
building an undesirable dependency at the state level too for revenues on a
single sector. Further, heavy sales tax levies lead to a high degree of
cascading. The Empowered Committee of State Finance Ministers
deliberating on the implementation of VAT should also be entrusted with the
task of evolving a uniform policy on sales tax levies on petroleum products.
1.1.201 Further, on irrecoverable local taxes, the best solution would be to
persuade the concerned Sate Governments/local bodies to withdraw such
6Excise duty as on 1.8.2006, includes education cess.
Ministry of Petroleum and Natural Gas Page 56 of 164

8/3/2019 wg11_petro
http://slidepdf.com/reader/full/wg11petro 57/164
Report of the Working Group on Petroleum and Natural Gas for the XI Plan (2007 – 2012)
levies in view of their distortionary impact. Alternatively, the State
Governments/local bodies may be encouraged to replace the entry
tax/octroi by a surcharge on sales tax on finished petroleum products. The
State Government can compensate the local body out of the surcharge it
collects. However it has been reiterated that the most desirable option is to
eliminate all such duties.
1.1.202 The Ministry agrees with the observations and recommendation of the
Rangarajan Committee, that the state tax7 rationalization is an urgent need.
Though, most states have adopted VAT, there is no uniformity amongst the
tax rates and procedures between various States. In addition, taxes from
local bodies distort the playing field. Government may bring pressure on the
States to eliminate irrecoverable taxes such as octroi and entry taxes and if
required convert these taxes to recoverable taxes.
1.1.203 At a time when the country is entering into Free Trade Agreements (FTAs)
with different countries to form a larger market, it is ironical that we have a
fragmented market within the country. It is absolutely essential to have acommon market for oil products based on VAT throughout the country.
VAT should provide set-off for local taxation such as entry tax and octroi, in
case these taxes are not eliminated.
1.1.204 The lasting solution lies in implementing a unified Goods and Services Tax
(GST) across the country on petroleum products. The Government has
already announced their intent to put in place a GST structure by 2010. It is
hoped that GST would cover the full gamut of taxes and provide set-off for
taxes, including service tax, on inputs whether at the municipal level, state
level or central level while placing imports at par with domestic production.
Eliminate Subsidy on Domestic LPG
1.1.205 The subsidy for domestic cooking gas should be phased out gradually or at
least substantially reduced. As recommended by the Rangarajan
Committee, a one-time upward adjustment in the price of domestic LPG by
Rs.75 per cylinder may be made. Beyond this one time increase, it is
necessary to gradually increase the price of domestic LPG so that the retail
price adjusts completely to the market level eliminating the subsidy
altogether as early as possible. Strong political consensus is needed for
implementing the same.
Adjust PDS Kerosene Subsidy
1.1.206 The observation that the only fool proof mechanism for preventing leakages
and diversion is to move towards a system of a single price at the point of
retail sale for all consumers with the subsidy being passed on to BPL
consumers through alternative mechanisms. We may explore methods to
provide direct subsidy amount to the consumers, with full price applicable at
the retail point.
1.1.207 Further in view of the enhanced programme for rural electrification (Rajiv
Gandhi Grameen Vidyuthikaran Yojana), the need for subsidizing kerosene
over the medium term needs to be reviewed.
7State taxes includes Sales tax, CST, Entry taxes, surcharge and Sales Tax, purchase tax etc.
Ministry of Petroleum and Natural Gas Page 57 of 164

8/3/2019 wg11_petro
http://slidepdf.com/reader/full/wg11petro 58/164
Report of the Working Group on Petroleum and Natural Gas for the XI Plan (2007 – 2012)
4.9 Dr. V. Krishnamurty’s Report on Restructuring of Petroleum Sector
1.1.208 The Advisory Committee on Synergy in Energy (ACSE) headed by Dr. V.
Krishnamurthy had three terms of reference. The committee was to
examine:
i. the core competence of PSUs to assess their competitiveness;
ii. analyse options to leverage their strength to optimally fulfil their requiredcontribution to national objectives of energy security, accelerated growth,sustained development and social objectives of government policy; and
iii. Identify the most appropriate structure of oil PSUs to secure these ends.
Core Competencies
1.1.209 ACSE has observed that oil PSUs need to focus on their respective core
competencies. Non-core activities in the upstream sector need to be farmed
into separate companies/subsidiaries. The focus of upstream companiesshould be primarily on E&P, without distraction and dissipation of energy
and resources in other activities. ACSE suggests that domestic E&P needs
to be intensified by applying latest technology in frontier basis and deep-
water areas. R&D institutes of ONGC should be suitably strengthened. PSU
refineries need to undertake measures for up-gradation of technology, size
and benchmark their operations with international norms.
1.1.210 The Ministry agrees with the recommendation that oil PSUs should focus on
their core competence. Considering the recent track record of ONGC in
E&P, it appears that ACSE’s recommendations that ONGC focus on E&P
are appropriate. In fact one of the urgent requirements of the nation is tofind more oil. The refineries have been advised to benchmark their
operation against their global peers. CHT along with an international
consultant has recently evaluated PSU refineries. Suggestions made are
being evaluated and would be implemented wherever found commercially
beneficial.
Appropriate Structure
1.1.211 On the question of appropriate structure, ACSE has recommended that
merger of PSUs may not be advisable and that the strengthening of the
existing structure through policy changes and management/structural
improvements may be considered. Further, ACSE has recommended thatCPCL, BRPL and IBP should be integrated within IOC while KRL should be
integrated with BPCL. NRL however should maintain its separate identity.
On MRPL, ONGC’s subsidiary, no direct reference has been made, though
indirectly, it has been recommended that the focus of upstream companies
should primarily on E&P, without distraction and dissipation of energy and
resources in other activities.
1.1.212 In line with the recommendations, IOC has already initiated moves for
merger of IBP and BRPL with itself. Similarly, KRL has been merged with
BPC. NRL’s identity is being strengthened and OIL has been granted
permission to raise its stake in NRL to 26 percent.
Ministry of Petroleum and Natural Gas Page 58 of 164
8/3/2019 wg11_petro
http://slidepdf.com/reader/full/wg11petro 59/164
Report of the Working Group on Petroleum and Natural Gas for the XI Plan (2007 – 2012)
Leveraging Strength of Oil PSUs
1.1.213 As regards the management, ACSE has suggested that government
nominee directors on the board of PSUs should play proactive role by
effectively reviewing the projects for synergising creations of infrastructure.
1.1.214 The committee has placed additional responsibilities on government
nominee directors, which it expects to optimize facilities and projects across
companies. For this purpose, it is necessary that the Government directors
interact amongst themselves on a regular basis while being guided by
government policies. This Ministry agrees with this suggestion.
Other Recommendations
1.1.215 ACSE has advised that strategic reserve quantity may be increased to at
least 10 MMT. ACSE has recommended putting in place a comprehensive
energy policy, measures for improvement of energy efficiency etc.
encouraging coal in order to reduce dependence on oil, investment in coalgasification, etc and promoting use of nuclear energy, solar energy, wind
power, etc. The Government has taken in-principle decision to construct 15
MMT of strategic storage in phases.
Ministry of Petroleum and Natural Gas Page 59 of 164

8/3/2019 wg11_petro
http://slidepdf.com/reader/full/wg11petro 60/164
Report of the Working Group on Petroleum and Natural Gas for the XI Plan (2007 – 2012)
5 Thrust Areas for XI Plan Period
5.1 Major Thrust Areas for XI Plan Period
1.1.216 The major thrust areas for the XI Plan which seek to address the challenges
being faced by the industry are outlined below :-
Exploration & Production
1.1.217 Increasing Domestic Oil and Gas Production: To realise the vision of the
President of India, the nation needs to graduate from energy security and
move towards energy independence. Increasing domestic production is
paramount in realising this vision. Bringing more and more acreage under
exploration specially those in the frontier areas/basins, adoption of state-of-
the-art E&P technology, faster development of discovered reserves,
development of marginal fields, continuation of IOR/EOR schemes,
establishment of a National Knowledge Hub in India, ensuring availability of
knowledge workers for the upstream sector etc. are some of the steps that
need to be undertaken to boost domestic production.
1.1.218 Increasing Production in ONGC’s Assets: Good news is that the share of
private sector in total domestic production is increasing; bad news is that
the projections indicate a steep decline in production from aging assets
owned by Government E&P companies. The situation may be corrected,
inter alia, by undertaking multi-pronged measures such as development of
isolated marginal fields, faster development of discovered reserves and
leveraging technology to enhance productivity of existing fields.
Refining
1.1.219 Processing Sour and Heavy Crude: With growth in awareness about
sustainable global development, today Governments can ignore the
environmental damage caused by fossil fuel consumption only at their own
detriment. Fuel specifications used in different applications have
continuously undergone changes and, with time, are expected to become
more and more stringent. Indian refineries need to gear up to meet this
challenge and in order to remain competitive the refineries need to be
upgraded to process low-cost high-sulphur heavy crude to produce fuels
conforming to international specifications. The refineries also need to
understand the importance of continuously improving the fuel quality for
complying with the domestic environmental regulations.
1.1.220 Maximising Export of Petroleum Products: India is expected to emerge
as a serious exporter of petroleum products with substantial surplus
capacity. The actual capacity addition would, however, depend upon
several factors including growth in domestic demand, duty structure which
would impact import and export possibilities, refining margin, and export
potential for the products. Factors adding to the viability of export oriented
refineries include setting up in Special Economic Zone (SEZ) areas,
differential in sweet and sour crude and import of crude oil and petroleum
products being handled through large vessels bringing down the
transportation cost. Goes unsaid that Indian refineries will have to produce
Ministry of Petroleum and Natural Gas Page 60 of 164

8/3/2019 wg11_petro
http://slidepdf.com/reader/full/wg11petro 61/164
Report of the Working Group on Petroleum and Natural Gas for the XI Plan (2007 – 2012)
fuel of international quality suitable for exports which contributes to sound
environmental management.
Pipelines and other Infrastructure
1.1.221 Improving Pipeline Connectivity: Healthy development of the oil and gas
industry hinges on the concurrent development of a commensurate support
infrastructure. Therefore, encouraging investments in ports, petroleum
product pipelines, storage terminals, etc. forms part of the overall plan of
industry development. Due to its inherent advantages, product pipelines
are preferred over other competing transportation modes such as railways
and road. There is an urgent need, therefore, to enhance coverage of
pipelines throughout the country, depending, of course, upon relative
economics.
1.1.222 Encouraging Laying of Gas Transportation Infrastructure:
Transportation of gas within the domestic market is done through gas
pipelines. Availability of a robust gas transportation infrastructure is crucialfor development of the natural gas market. There is a need to create gas
infrastructure and at the same time ensuring co-ordinated development
across the entire value chain. Setting up of a Regulator under the PNGRB
Act 2006 to regulate the downstream oil and gas sector, is expected to
provide clarity and comfort to interested investors in the gas transportation
sector.
Marketing
1.1.223 Minimizing Adulteration: Adulteration is a menace which needs to be
tracked by all concerned through technological and other interventions.
Steps need to be undertaken by all stakeholders to curb adulteration.
Steps already initiated include introduction of tamper-proof locks,
automation of retail outlets, monitoring the movement of tank trucks through
Global Positioning System (GPS), introduction of marker system for
adulterants like kerosene, and third party certification of retail outlets.
1.1.224 Maximizing Automation: Ensuring product quality and quantity across
supply chain is necessary in a competitive environment. Automation is
being carried out at retail outlets and terminals/depots. This is necessary to
minimise human intervention in the processes. Efforts are, therefore,
needed to maximize automation.
1.1.225 Maintaining Retail Outlet Viability: Increased competition amongst
marketing companies has seen a spurt in rollout of retail outlets throughout
the country resulting in decline in outlet throughput. In order to maintain
viability of outlets, it is essential for the public sector oil marketing
companies to have synergy amongst them in setting up of new retail
outlets.
Pricing and Subsidies
1.1.226 Pricing of Sensitive Petroleum Products: Efforts may be made to move
towards providing flexibility to oil companies to fix retail prices of petrol and
diesel autonomously. In case of domestic cooking gas, subsidy may be
Ministry of Petroleum and Natural Gas Page 61 of 164

8/3/2019 wg11_petro
http://slidepdf.com/reader/full/wg11petro 62/164
Report of the Working Group on Petroleum and Natural Gas for the XI Plan (2007 – 2012)
phased out gradually as recommended by the Rangarajan Committee
report. For kerosene, direct subsidy may be provided to the consumers,
particularly those below the poverty line, with full price applicable at the
retail point.
1.1.227 Unified State Taxes and Removal of Tax Anomalies: Amalgamateindividual state markets into one nation wide market with unified state
taxes, remove state taxes anomaly, provide level playing field to domestic
production vis-à-vis direct imports and introduce a uniform VAT which
provides full set off for local levies such as octroi and entry tax.
Emerging New Sources of Fuels
1.1.228 The quest for energy security through increased supplies of conventional
sources such as oil and gas needs to be supported with an impetus being
given to the development of unconventional sources of energy like Coal
Bed Methane (CBM), Gas Hydrates, and Coal Liquefaction etc. Clean coal
technologies such as underground coal gasification (UCG) and conversionof coal to liquid hydrocarbon etc, hold great potential for India as it is rich in
coal resources. There is a need to aggressively pursue the promotion of
bio-diesel and ethanol blended petrol with higher blending ratios.
1.1.229 Exploring and exploiting country’s CBM resource has already gained
momentum with the recent conclusion of the third round of CBM bidding.
For exploring the gas hydrate potential in the Indian deepwaters, a National
Gas Hydrates Programme has been undertaken by the Government since
1997 with active participation from oil and gas companies, research
organisations and DGH. Oil shale another source of unconventional oil is
said to be present in the North-East region in substantial volumes.
Research and Development
1.1.230 Considering the complex nature of initiatives required the policy framework
needs to be in a position to offer very attractive incentives to the sectors,
which proactively get themselves engaged into the R&D activities relating to
various sources of energy with particular emphasis on areas of
conservation and improvement in energy efficiency. There is, therefore, a
need to provide incentive and or funding for undertaking rigorous R&D
activities.
1.1.231 Given the importance of dramatically improved new vehicle fuel economy inthe coming decade, R&D on highly efficient vehicles and technologies such
as fuel cells, hybrid-electric drive-trains, and light-weight materials should
be expanded. New generation of vehicles should expand its focus to
developing both cleaner and more efficient vehicles by adopting aggressive
emissions goals to complement its fuel economy goals.
Energy Conservation
1.1.232 Timely actions by the Government through policy interventions have
provided a favourable climate to foster rational use of energy. From being a
tool to stabilize the temporary disruptions caused by the oil crisis, energy
conservation has now become an important issue. Enhancement of energy
Ministry of Petroleum and Natural Gas Page 62 of 164

8/3/2019 wg11_petro
http://slidepdf.com/reader/full/wg11petro 63/164
Report of the Working Group on Petroleum and Natural Gas for the XI Plan (2007 – 2012)
efficiency is a universally accepted development goal. Energy efficiency
and Demand Side Management/conservation must occupy a central
position in the national strategy. For effectiveness of the programme there
is a need to introduce the target at national level say 1 percent saving per
annum each through conservation measures and efficiency improvements
or varying percentage depending upon the sector/industry. A rupeeinvested in energy efficiency will save more energy than a rupee invested in
energy supply.
Ministry of Petroleum and Natural Gas Page 63 of 164

8/3/2019 wg11_petro
http://slidepdf.com/reader/full/wg11petro 64/164
Report of the Working Group on Petroleum and Natural Gas for the XI Plan (2007 – 2012)
6 Demand - Supply Gap Analysis for XI PlanPeriod
6.1 Demand for Petroleum Products
1.1.233 Various groups have estimated long-term demand projections for oil for the
country from time to time. Some of the main projections are contained in:
India Vision 2020,
India Hydrocarbon Vision 2025
Energy Information Administration (EIA) and
International Energy Agency (IEA)
1.1.234 While the projections by IEA and EIA are based on lower GDP growth ratesand are in the range of 230 MMT to 264 MMT, India Hydrocarbon Vision
(IHV) 2025 projects the demand for the year 2025 in the range of 235 MMT
to 368 MMT. The details of projections made by different groups are given
in Annexure – VI.
Projections for XI Plan
1.1.235 Oil industry in the country has undergone major transformation in the past
few years. From deficit situation till 1999-2000, the country is now net
exporter of petroleum products. Globalization of Indian economy along with
high international oil prices which are a pass-through in the bulk sector has
induced improvement in energy efficiency and shift of demand from liquid to
natural gas/LNG wherever possible. Further, improvement in road
infrastructure and better vehicles has had a sobering effect on the demand
for road transportation fuels. Besides, there is growing contribution from the
services sector in country’s GDP composition.
1.1.236 Low demand in transport fuels like MS and HSD is also due to factors like
expansion of city gas distribution networks i.e. CNG which has grown from
just under 50 TMT sales in 2000-01 to around 0.5 MMT in 2005-06
recording a CARG of 60.9 percent. Besides, introduction of Metro in Delhi
and its expansion to the National Capital Region (NCR), Mumbai and
Bangalore will have significant impact on demand for MS/HSD in future.Hence, it is estimated that POL demand would continue to grow at
moderate rate of growth during XI Plan also.
1.1.237 In future, blending of MS by ethanol and introduction of bio-diesel may also
have a significant impact, though not on the demand per se but in
increasing the production surplus of unblended MS and HSD.
Approach Adopted to Estimate Future Demand
1.1.238 The following two approaches have been considered for assessing the oil
requirements for future.
Ministry of Petroleum and Natural Gas Page 64 of 164

8/3/2019 wg11_petro
http://slidepdf.com/reader/full/wg11petro 65/164
Report of the Working Group on Petroleum and Natural Gas for the XI Plan (2007 – 2012)
Top-down Approach: Overall energy requirements with share of various fuels in the
primary commercial energy basket (considered by Planning Commission and
reported in IEP) by linking GDP with energy elasticity.
Bottom-up Approach: End use approach considering the impact of various
parameters. While assessing the requirements factors like impact of gas, vehiclepopulation growth, improved fuel efficiency, technological improvements in engine
designs, impact of auto LPG, CNG expansion, impact of Metro rail, impact of high oil
prices, conservation/efficiency improvement issues, aviation policy of the
Government, growth of passenger and cargo traffic, fleet expansion plan of airlines,
National Highways Authority of India (NHAI) road construction projects, Railways
freight policy, electrification plans of railway tracks and construction of freight corridor
etc. have been considered.
Declining Elasticity
1.1.239 Factor discussed above have resulted in weakening the relationship
between GDP growth and POL growth. Demand elasticity is declining ascan be seen in the table below:
Table 8.2: GDP vs. Oil Demand Elasticity
Particulars VII Plan VIII Plan IX Plan X Plan*
POL Growth (percent) 6.9 6.8 4.9 2.7
GDP Growth (percent) 6.0 6.8 5.5 7.8
Demand Elasticity 1.15 1.0 0.89 0.35
*2002-06
1.1.240 One of the major reasons for declining elasticity is far higher contribution of
services sector compared to past while contribution from the manufacturing
sector has more or less remained the same, but it too has improved its
efficiency. Year-wise composition of GDP for past few years is given below:
Table 8.3: Composition of GDP (in %)
Year Agriculture Industry Services
1990-91 32.2 21.9 47.8
2000-01 23.9 22.0 54.1
2004-05 20.5 21.9 57.6
2005-06 19.9 26.1 54.0
1.1.241 It is expected that the trend witnessed in POL consumption to intensify, with
high oil price acting as a catalyst towards further reducing consumption and
improving efficiency. The dominance of services sector is also anticipated
to continue in the XI Plan.
Projected Demand
Ministry of Petroleum and Natural Gas Page 65 of 164

8/3/2019 wg11_petro
http://slidepdf.com/reader/full/wg11petro 66/164
Report of the Working Group on Petroleum and Natural Gas for the XI Plan (2007 – 2012)
1.1.242 Based on the above analysis the demand of petroleum products have been
estimated in two scenarios – Base Case and Upper Case. In Base Case,
the consumption in the terminal year of the XI Plan, i.e. in 2011-12 is
estimated at 132 MMT indicating a growth of 2.9 percent per annum. The
year wise details are given below.
Table 8.4: Year-wise Demand of Petroleum Products for XI Plan – Base Case (MMT)
X Plan XI Plan
2006-07 2007-08 2008-09 2009-10 2010-11 2011-12 CARG
114.034 116.089 119.098 121.987 126.973 131.767 2.93%
1.1.243 In the Upper case, the demand is estimated to grow by 4.45 percent to 142
MMT. The demand under upper case scenario is as follows:
Table 8.5: Year-wise Demand of Petroleum Products for XI Plan – Upper Case (MMT)
End of X Plan End of XI Plan
2006-07 2007-08 2008-09 2009-10 2010-11 2011-12 CARG
114.034 117.555 121.951 127.789 136.593 141.793 4.45%
1.1.244 The year wise, product wise figures are given in Annexure – VII.
1.1.245 It may be mentioned that since the oil prices are expected to remain at a
high level in future, alternate sources of energy are likely to becomeincreasingly economically viable. In projections impact of such alternatives
has not been considered and the actual materialization may be different
from the one projected now. In addition, policy initiatives, which encourage
energy efficiencies, could lower the oil demand growth even further. Some
possibilities in the transport sector are discussed in Annexure VIII.
Projections for 2016-17 and for 2021-22
1.1.246 Projections beyond XI Plan are more difficult as uncertainties increase
proportionately. Since demand is a function of so many factors, none of
which can be accurately determined today, including future technologies,
state of the economy, development of alternatives and new products,geopolitical developments etc., assumptions made for working out
projections can easily undergo a radical change. Besides, in the context of
extremely volatile crude and product prices in the international markets,
predicting energy demand is hazardous. Hence, long-term projections
made below are just a rough estimate, indicative and directional and may
be used with caution.
1.1.247 Demand for terminal years of XII Plan are estimated to be as under:
Ministry of Petroleum and Natural Gas Page 66 of 164

8/3/2019 wg11_petro
http://slidepdf.com/reader/full/wg11petro 67/164
Report of the Working Group on Petroleum and Natural Gas for the XI Plan (2007 – 2012)
Table 8.6: Demand of Petroleum Products for XII Plan MMT
PRODUCTS Base Case Upper Case
2016-17 CARG 2016-17 CARG
LPG 16.905 5.8 16.905 5.8
MS 13.501 4.0 14.558 4.6NAPHTHA/NGL 17.364 8.4 17.364 8.4
ATF 7.187 4.0 9.283 5.0
SKO 6.787 -2.6 6.787 -6.3
HSD 58.910 4.0 61.891 4.5
LDO 0.569 0.0 0.569 0.0
LUBES 2.792 1.5 2.862 2.0
FO/LSHS 14.224 0.5 16.451 1.9
BITUMEN 5.315 3.0 5.849 4.0
PET. COKE 6.972 4.0 10.889 8.0
OTHERS 9.687 7.0 15.883 12.0
TOTAL 160.213 4.0 179.291 4.8
1.1.248 The projected demand is higher mainly on account of higher consumption
of naphtha mainly in petrochemical plants projected to come up by that
time.
1.1.249 Indicative demand in the terminal year of XIII (2021-22) Plan is estimated at
190.3 MMT for Base Case and 212.9 MMT under Upper Case.
6.2 Demand Supply Gap for Petroleum Products
Demand of Petroleum Products
1.1.250 The demand of petroleum products considered is as given by Sub-Group
on demand estimation. The total demand for the XI and XII Plan period is
as given below.
MMT
Case 2007-08 2008-09 2009-10 2010-11 2011-12 2016-17
Base 116.1 119.1 122.0 127.0 131.8 160.2
Upper 117.6 122.0 127.8 136.6 141.8 179.3
Product availability
1.1.251 For estimating the petroleum product availability, the data obtained from
various refineries have been taken into consideration. Product availability
estimated (including non-refinery sources8) is as under:
8About 4.2 MMT is expected from non refinery sources, of which about 2 MMT is LPG.
Ministry of Petroleum and Natural Gas Page 67 of 164

8/3/2019 wg11_petro
http://slidepdf.com/reader/full/wg11petro 68/164
Report of the Working Group on Petroleum and Natural Gas for the XI Plan (2007 – 2012)
Table 8.7: Petroleum Product availability during XI Plan MMT
Product 2007-08 2008-09 2009-10 2010-11 2011-12
LPG 9.1 9.7 9.3 11.0 12.8
Naphtha 15.0 14.8 15.0 17.5 18.8
MS 13.7 17.5 27.7 28.9 30.5ATF 6.8 7.4 9.3 10.6 11.0
SKO 10.6 11.3 10.7 10.3 11.3
HSD 58.0 62.6 74.5 84.1 92.3
LDO 1.0 1.0 0.8 0.8 0.6
LOBS 0.8 0.8 0.8 1.1 1.1
FO/LSHS 14.8 15.6 15.6 10.9 9.5
Bitumen 3.7 3.9 4.0 4.0 4.4
Coke 4.1 5.4 8.3 11.0 12.8
Others 5.6 6.5 9.6 11.0 13.2
Total 143.3 156.4 185.6 201.1 218.3
1.1.252 Projections indicate that domestic production of petroleum products would
exceed the upper case demand of the XII Plan by end of XI plan itself by a
large margin. By the end of XII Plan production of petroleum products is
slated to increase to 286 MMT.
Surplus/ (Deficit)
1.1.253 Based on the product availability and demand estimates as given above the
product-wise surplus/ (deficit) situation has been estimated and givenbelow.
Table 8.8: Petroleum Product surplus/(deficit) during XI Plan (MMT)
Base Case
Product 2007-08 2008-09 2009-10 2010-11 2011-12
LPG (1.73) (1.55) (2.42) (1.20) (0.01)
Naphtha 4.61 5.28 4.52 6.33 7.23
MS 4.37 7.65 17.43 18.26 19.42
ATF 2.47 2.63 4.15 5.01 5.13
SKO 1.76 2.80 2.47 2.36 3.59
HSD 15.87 18.82 29.18 37.19 43.92
LDO 0.00 0.00 0.00 0.00 0.00
LOBS (1.63) (1.72) (1.70) (1.48) (1.52)
FO/LSHS 1.17 1.63 2.76 (2.40) (4.38)
Bitumen (0.06) (0.05) (0.17) (0.41) (0.23)
Coke (0.66) 0.67 3.59 5.79 7.11
Others 0.71 1.16 3.80 4.64 6.29
Total 26.88 37.32 63.60 74.08 86.54
Ministry of Petroleum and Natural Gas Page 68 of 164

8/3/2019 wg11_petro
http://slidepdf.com/reader/full/wg11petro 69/164
Report of the Working Group on Petroleum and Natural Gas for the XI Plan (2007 – 2012)
Table 8.8: Petroleum Product surplus/(deficit) during XI Plan (MMT)
Upper Case
Product 2007-08 2008-09 2009-10 2010-11 2011-12
LPG (1.73) (1.55) (2.42) (1.20) (0.01)
Naphtha 5.70 5.02 4.52 6.27 7.22MS 3.67 7.96 17.23 17.79 18.93
ATF 2.45 2.17 3.32 3.96 3.76
SKO 1.18 1.90 1.28 0.91 1.90
HSD 15.71 18.80 28.75 36.11 42.56
LDO 0.00 0.00 0.00 0.00 0.00
LOBS (1.63) (1.72) (1.70) (1.48) (1.52)
FO/LSHS 1.01 1.34 1.96 (3.35) (5.48)
Bitumen (0.10) (0.13) (0.29) (0.58) (0.45)
Coke (0.66) 0.67 3.59 3.79 5.43
Others 0.16 (0.00) 1.56 2.24 4.19
Total 25.76 34.46 57.80 64.46 76.52
1.1.254 While estimating surplus/deficit scenario it is assumed that MS would be
sold throughout the country blended with 5 percent ethanol from 2007-08.
1.1.255 The refineries need to maximize production of LPG, LOBS and bitumen to
an extent, from the national standpoint. Further caution needs to be
exercised while converting bottoms to higher end products as large deficits
in industrial fuels is projected. The bottom upgradation plan needs to be
realigned to local demand. Even globally, as noted elsewhere in the report,large deficit is predicted for FO and LSHS.
1.1.256 In addition the refineries must consider the change in refinery gate price to
trade parity for MS and HSD. The ratio of import parity and export parity will
undergo a change every year depending upon the past experience. If ratio
of exports increases then, domestic realization for MS and HSD will fall
accordingly. Refinery projects require factoring the above conclusions.
6.3 Demand for Natural Gas
1.1.257 Gas demand in India continues to be influenced by the cost economics vis-à-vis alternative fuels pertaining to each of the end use sectors, primarily
power and fertilizer, as also the dynamics of these sectors. The current
natural gas consumption is primarily shared by the power and fertilizer
sector to the tune of 40 percent and 29 percent respectively. This is
followed by the petrochemicals – 9 percent, city gas (CNG/PNG) – 4
percent, LPG/other liquid hydrocarbons – 4 percent and sponge iron/steel
sector – 3 percent.
1.1.258 Various agencies have made assessments in the past regarding natural
gas. The same are at Annexure – IX. For arriving at the future demand for
natural gas, sectorwise analysis has been carried out as under:
Ministry of Petroleum and Natural Gas Page 69 of 164

8/3/2019 wg11_petro
http://slidepdf.com/reader/full/wg11petro 70/164
Report of the Working Group on Petroleum and Natural Gas for the XI Plan (2007 – 2012)
Power Sector Analysis
1.1.259 The power sector would continue to be one of the major consumers for
natural gas. The Ministry of Power has set a target of 70,000 MW
generation for the 5 year period ending 2012, the terminal year of the XI
Plan. The current thermal power generation is about 90,800 MW, of which12 percent (10,900 MW) is gas based. The gas-based power plants, which
would definitely be coming up during the XI Plan period, have a capacity of
1,889.2 MW; the requirement of gas for the same is likely to be 7.5
MMSCMD. Department of Power has made a projection of additional
33,655 MW of gas based power projects, which may come up in the XI
Plan. On an optimistic note, 40 percent of these plants have been assumed
to come up in the XI Plan period. This would translate into roughly 12,700
MW of power generation, requiring around 50.82 MMSCMD gas.
1.1.260 The present requirement of gas for the existing gas-based power plants is
68.19 MMSCMD. Adding gas requirement of 7.50 MMSCMD and 50.82
MMSCMD, as explained in the above Para, the total gas requirement by theend of XI Plan period is likely to be 126.57 MMSCMD. Assuming that the
gas requirement increases in the same proportion every year, the projected
gas demand for the power sector for the XI Plan period would be as under:
Table 8.9: Gas Demand Projections in power sector in XI Plan (MMSCMD)
2007-08 2008-09 2009-10 2010-11 2011-12
Gas Demand 79.7 91.2 102.7 114.2 126.57
Fertilizer Sector Analysis:
1.1.261 It has been well established that natural gas is the most cost effective fuel
vis-à-vis other liquid fuels for fertilizer plants. During the year 2004-05, gas
based fertilizer (urea) production accounted for 66 percent of the total
fertilizer production. Naphtha and FO/LSHS based production accounts for
the balance 34 percent. Requirement of gas for fertilizer sector is expected
to increase in the years to come, not only for meeting the current shortfall
being faced by the existing gas based urea units but also on account of
conversion of Naphtha and FO/LSHS based units to NG/LNG, de-
bottlenecking of existing urea units, setting up of new and expansion of
existing urea units and revival of closed urea units of Hindustan Fertilizers
Corporation Ltd (HFCL) and Fertilizer Corporation of India (FCI). All nongas based urea units will be converted to gas within the next three years.
Under the above scenario, the total requirement of gas for the fertilizer
sector by the end of XI Plan period is expected to be 76.26 MMSCMD. The
break-up of gas requirement year wise and the corresponding production
capacity of urea is given below :
Table 8.10: Projected Gas Demand for XI Plan Period – Fertilizer Sector
2007-08 2008-09 2009-10 2010-11 2011-12
Urea Production Capacity(Lakh tones)
226.16 226.16 259.66 329.35 329.35
Gas Demand (MMSCMD) 41.02 42.89 55.90 76.26 76.26
Ministry of Petroleum and Natural Gas Page 70 of 164

8/3/2019 wg11_petro
http://slidepdf.com/reader/full/wg11petro 71/164
Report of the Working Group on Petroleum and Natural Gas for the XI Plan (2007 – 2012)
City Gas Distribution
1.1.262 This is another sector which has a high growth potential. World-wide, citygas distribution has grown hand in hand with the gas sector development in
terms of supply infrastructure and transmission infrastructure. With the
expected growth in the gas supply and the simultaneous creation of gas
inter-state transmission infrastructure in India, this sector is bound to grow
in the XI Plan period. With the emphasis on clean environment, this sector
would get the necessary thrust in the coming years. In line with this, various
players, primarily led by GAIL, have drawn up ambitious plans to roll out city
gas infrastructure across a number of cities in the country. From the
existing coverage of 10 cities, the coverage is expected to grow to 40 cities
in the next 5-7 years. This sector can be expected to grow at double digit
rates in the later part of the XI Plan period. The current demand estimates
in this sector is about 11 MMSCMD in 2006-07 and 12.08 MMSCMD in
2007-08. Assuming a conservative annual growth of 8 percent, the demand
would go up to about 12.93 MMSCMD, 13.83 MMSCMD, 14.8 MMSCMD
and 15.83 MMSCMD in 2008-09, 09-10, 10-11 and 2011-12 respectively.
Petrochemicals/Refineries/Internal Consumption and Sponge Iron/Steel and other
Industries
1.1.263 The current demand as per the industry estimates in the
Petrochemicals/Refineries and Internal Consumption (of Gas Industries)
sectors is about 25.37 MMSCMD in 2005-06. These industries are
estimated to grow in line with country’s projected economic growth. Hencean annual growth rate of about 7 percent is assumed during the XI plan
period, which would result in a demand of 33.25 MMSCMD by the terminal
year of the XI Plan.
1.1.264 Similarly, the sponge iron/steel sector is also expected to grow at the same
rate of 7 percent from the current level of 6 MMSCMD, reaching a level of
7.86 MMSCMD by the terminal year of the XI plan.
1.1.265 Based on the above analysis, the consolidated demand estimate is
presented below:
Table 8.11: Sector Wise Gas Demand Projections (2007-2012)
2007-08 2008-09 2009-10 2010-11 2011-12
Power 79.70 91.20 102.70 114.20 126.57
Fertilizer 41.02 42.89 55.90 76.26 76.26
City gas 12.08 12.93 13.83 14.80 15.83
Industrial 15.00 16.05 17.17 18.38 19.66
Petrochemicals/Refineries/InternalConsumption
25.37 27.15 29.05 31.08 33.25
Sponge iron/Steel 6.00 6.42 6.87 7.35 7.86
Ministry of Petroleum and Natural Gas Page 71 of 164

8/3/2019 wg11_petro
http://slidepdf.com/reader/full/wg11petro 72/164
Report of the Working Group on Petroleum and Natural Gas for the XI Plan (2007 – 2012)
Total 179.17 196.64 225.52 262.07 279.43
Gas Supply Outlook
1.1.266 On the gas supply side, the domestic supplies would be primarily driven bythe expected supply from the KG basin by RIL in 2008-09. The supply
projected by ONGC in the Plan period is expected to fall from 47.28
MMSCMD in 2007-08 to 32 MMSCMD in 2011-12. Supply from Private
players/JVs is expected to increase from 23.26 MMSCMD to about 57.22
MMSCMD in 2011-12. This increase from private players is primarily due to
the 40 MMSCMD gas supply addition from RIL from 2008-09 onwards.
DGH has projected expected additional supplies of 20, 30 and 40
MMSCMD from RIL fields in 2009-10, 2010-11 and 2011-12 respectively
and 54 MMSCMD from GSPC in each of the above years. How much of
these additional supplies would actually fructify would actually determine
the prospects of the domestic supply scenario and would have a profound
influence on the overall demand-supply balance.
1.1.267 In the analysis, these additional supplies have been considered under
scenario II, an optimistic scenario. Keeping the above aspects in view, the
total projected gas supplies would be 80.54 MMSCMD in 2007-08 expected
to grow to 108.3 MMSCMD in 2011-12 under scenario I (Normal Scenario).
In Scenario II (Optimistic Scenario), the supplies would grow from 80.54
MMSCMD in 2007-08 to 202.30 MMSCMD in 2001-12. The detailed supply
projections under the two scenarios are presented in table below :
Table 8.12: Gas supply projections during XI Plan (MMSCMD)
Sources ‘07-08 ‘08-09 ‘09-10 ‘10-11 ’11-12
ONGC + OIL (A) 57.28 58.42 55.69 54.67 51.08
Pvt./ JVs (As Per DGH) (B) 23.26 61.56 60.28 58.42 57.22
Projected Domestic Supply(A+B)
80.54 119.98 115.97 113.09 108.30
Additional Gas Anticipated (C) 74 84 94
Total Projected Supply
Scenario 1 (A+B)
80.54 119.98 115.97 113.09 108.30
Total Projected SupplyScenario 2 (A+B+C)
80.54 119.98 189.97 197.09 202.30
1.1.268 The estimated gap between domestic gas production and supply is mainly
on account of internal use by the producers themselves, technical flaring
and gas shrinkages.
1.1.269 Looking at the overall demand projections and even the most optimistic
scenario of expected domestic supplies, it is very clear that there would be
a supply shortfall. Therefore, there is a need to step up imports in the
coming 5 years. There is already an import of LNG to the tune of 18
Ministry of Petroleum and Natural Gas Page 72 of 164

8/3/2019 wg11_petro
http://slidepdf.com/reader/full/wg11petro 73/164
Report of the Working Group on Petroleum and Natural Gas for the XI Plan (2007 – 2012)
MMSCMD by PLL at Dahej. This is being supported by the commencement
of LNG supply from the Hazira Terminal of Shell which is, however, yet to
stabilize. To augment the shortfall, the country is already pursuing imports,
both through the LNG route and the transnational pipeline route.
LNG/ Supplies through Transnational Pipelines.
1.1.270 LNG is already an accepted resource in the country. The 5 MMTPA Dahej
terminal of PLL is operating at full capacity. The Hazira terminal of Shell
with a capacity of 2.5 MMTPA is operational but is yet to stabilize. The
Dahej terminal is set to expand to 10 MMTPA by 2010-11. Besides, the
planned Kochi terminal of PLL with a capacity of 2.5 MMTPA (expandable
to 5 MMTPA) is expected by 2010-11. The 5 MMTPA Dabhol terminal is
projected to be fully operational by 2009-10. To begin with the supplies
would be 1.2 MMTPA, which would increase to 2.1 MMTPA in 2008-09 to
cater to the Dabhol Power plant. This terminal would also throw up a
merchant sale volume of 2.9 MMTPA in 2009-10 when long term LNG is
contracted. Given the non-stabilisation of Shell Hazira terminal as yet, it hasbeen assumed that Shell terminal would operate at 2.5 MMTPA capacity
during the XI Plan period. The confirmation of Mangalore LNG terminal
could be a possibility and 1.25 MMTPA imports could perhaps be expected
at this terminal by 2011-12. Given this scenario, the LNG supply is
projected to reach a level of 23.75 MMTPA by the year 2011-12 (Potentially
it can add up 83.12 MMSCMD supplies at full capacity).
1.1.271 Though there is a possibility of supply of about 18 MMSCMD of gas from
the Myanmar through the proposed Myanmar–India Pipeline in 2010-
11/2011-12, this has not been considered for analysis purpose due to the
uncertainties involved. Given the present level of inter-Governmentaldiscussions on the other two pipelines, viz., Iran-Pakistan-India pipeline and
Turkmenistan-Afghanistan-Pakistan-India Gas Pipeline, no gas supplies
have been projected through these pipelines during the XI Plan period. The
overall LNG supply projections are given below :
Table 8.13: LNG supply projections during XI Plan
LNG Supply Source 07-08 08-09 09-10 10-11 11-12
Dahej 5.00 5.00 7.5 10.00 10.00
Hazira 2.50 2.50 2.50 2.50 2.50
Dabhol 1.20 2.10 5.00 5.00 5.00Kochi - - - 2.50 5.00
Mangalore - - - - 1.25
Total LNG Supply (MMTPA) 8.70 9.60 15.00 20.00 23.75
Total LNG Supply (MMSCMD) 30.45 33.60 52.50 70.00 83.12
Assumptions 1) Hazira expansion to 5.0 MMTPA is not considered in XI plan.2) Mangalore terminal is expected to be partially commissioned in 2011-12.
1.1.272 The import plans of various companies would to a great extent augment the
supplies to meet the demand shortfall. Given the two scenarios of supply,
Ministry of Petroleum and Natural Gas Page 73 of 164

8/3/2019 wg11_petro
http://slidepdf.com/reader/full/wg11petro 74/164
Report of the Working Group on Petroleum and Natural Gas for the XI Plan (2007 – 2012)
the total supply including LNG is expected to increase from 100.99
MMSCMD in 2007-08 to a level of 181.42 MMSCMD in 2011-12 under
Scenario I (Normal Scenario). Under Optimistic Scenario II, the total gas
supply is expected to increase from 100.99 in 2007-08 to 275.42 MMSCMD
in 2011-12, especially driven by the additional supply of RIL and GSPC
from 2009-10 onwards.
6.4 Demand – Supply Gap for Natural Gas
1.1.273 It is expected that there would be a demand–supply gap (shortfall in supply)
to the extent of 67.98 MMSCMD in 2007-08 which would fall to 42.81
MMSCMD in 2008 – 09 in both the scenarios. From this level, the gap
would increase steadily to 91.13 MMSCMD by 2011-12 in Scenario I,
whereas under Scenario II, the gap would by and large be bridged from
2009-10 onwards and there is expected to be a demand–supply balance
during the last 3 years of the XI Plan period. The overall demand–supply
balance is presented below :
Table 8.14: Overall Gas Demand Supply projections during XI Plan
Supply 07-08 08-09 09-10 10-11 11-12
Projected Domestic Supply(ONGC /JV/ PVT) (A)
80.54 119.98 115.97 113.09 108.30
Additional anticipated supply (B) 74 84 94
LNG (C) 30.45 33.60 52.50 70.00 83.12
Total Supply (A+C) Scenario 1 110.99 153.58 168.47 183.09 191.42
Total Supply (A+B+C) Scenario 2 110.99 153.58 242.47 267.09 285.42
Demand (MMSCMD) 179.17 196.64 225.52 262.07 279.43
Demand Supply Gap I 68.18 43.05 57.05 78.97 88.03
Demand Supply Gap II 68.18 43.05 -16.95 -5.03 -5.97
Impact of Price of Natural Gas/LNG on Demand and Supply:
1.1.274 Traditionally, India has remained as a supply constrained economy, with
controlled prices of gas. During the X Plan period, LNG supplies
commenced in 2004, which brought in option of higher priced import and itwas accepted by the Indian market. Government has also taken steps
towards a market mechanism, by freeing up all new production from control,
while restricting controlled gas prices to only power, fertilizer and small
consumer sectors. Further, supplies from fields like Panna–Mukta and Tapti
fields have also been at negotiated prices. Import of spot LNG into the
country at the levels of US$ 8-9 per MMBTU and its acceptance by the
customers has opened a truly market driven price discovery. In the Indian
context, the power and fertilizer sectors have always been considered as
price sensitive sectors. Controlled prices have kept these sectors under a
low price regime while the world market was moving towards a high priced
regime in tandem with the upward movement in the crude prices. With thesupply scenario looking up as projected elsewhere in this report, there is an
Ministry of Petroleum and Natural Gas Page 74 of 164

8/3/2019 wg11_petro
http://slidepdf.com/reader/full/wg11petro 75/164
Report of the Working Group on Petroleum and Natural Gas for the XI Plan (2007 – 2012)
increasing realization that the end use sectors would be slowly but steadily
integrating with this trend. Assuming that all the projected domestic
production of gas materializes as above, and the demand also grows as
projected there may be no gas shortage by the end of XI Plan.
1.1.275 The fertilizer sector has made detailed analysis of the competing resources – liquid fuels vs. gas and has decided to switch over entirely to gas during
the course of the XI Plan given the economics of gas. The fertilizer ministry
had indicated that in addition to APM gas, there would be acceptance of
market determined price of gas for the urea plants. Power Ministry has
drawn up plans for 33,654 MW of gas based projects with the qualifying
statement that the generation capacity would be dependent on gas
availability at reasonable prices. They have also not made a sensitivity
analysis. Gas availability is not going to be an issue as the supply prospects
are very bright in the XI Plan. As the prices of the new gas would be market
determined, there is likely to be a price discovery mechanism and Indian
market would be integrating with the global trends. Like in the fertilizer
sector, the power sector would also be moving towards a marketdetermined mechanism, as the gas availability from domestic and
international sources surge in the country and a market system operates,
leading to a logical market linked/acceptable price discovery.
Gas Availability from Transnational Pipelines
1.1.276 Transnational pipelines and gas availability through these sources have
been predicted during the X Plan period also. But these did not materialize
due to various geo-political and economic reasons. During the X Plan
period active discussions at the highest level took place in the government
as well as the company level. Accordingly two pipelines are at an advancedstage of discussion – Iran-Pakistan-India Pipeline and the Myanmar-India
Pipeline. In the case of Myanmar-India Pipeline, there is a likelihood of gas
supply to the tune of 12 MMSCMD and 16 MMSCMD in the years 2010-11
and 2011-12. This necessarily includes gas from the overseas partners of
this project, as India partners’ share of gas would be too low to make it
commercially viable by itself. In the light of the past experience in such
pipelines, it is more appropriate to include such projections, only when
some kind of finality is reached between the partners. Otherwise, it would
distort the picture. At this stage, no such finality has been arrived at and
hence the projections do not include the gas supplies from transnational
pipelines.
Projected Gas Demand for 2012-17 and 2017-22
1.1.277 The IEP has projected gas demand of 682 MMSCMD by 2031-32 in an 8
percent growth scenario with the assumption that power sector would have
20 percent power generation based on gas (from current 12 percent level),
100 percent urea production based on gas and 7 percent growth of other
sectors. But the policy also qualifies the projection by saying that relative
prices of fuels would decide the growth trend. Indian gas market is still in a
stage of transition. The Working Group has assumed that the gas sector
would move towards a market determined pricing mechanism during the XI
plan period. At this point in time when gas is still under controlled prices for power and fertilizer sector and is expected to move through a period of
Ministry of Petroleum and Natural Gas Page 75 of 164

8/3/2019 wg11_petro
http://slidepdf.com/reader/full/wg11petro 76/164
Report of the Working Group on Petroleum and Natural Gas for the XI Plan (2007 – 2012)
transition, it would not be reasonable to assume a growth trend and project
gas demand beyond 2011-12. So after careful consideration, the
projections for gas demand have not been made for 2012-17 and 2017-22.
As the market attains a certain degree of maturity with transition towards
market determined prices and competing alternate fuels lead to a more
realistic market price, which is expected to take place during the XI plan, adetailed study could be carried out to project demand for the longer term.
Ministry of Petroleum and Natural Gas Page 76 of 164
8/3/2019 wg11_petro
http://slidepdf.com/reader/full/wg11petro 77/164
Report of the Working Group on Petroleum and Natural Gas for the XI Plan (2007 – 2012)
7 Towards Oil and Gas Security
7.1 Towards Oil Security
1.1.278 The National Common Minimum Programme (NCMP) emphasizes the need
to put in place policies to enhance the country's energy security. The effortsmade by the Ministry of Petroleum & Natural Gas (MoPNG) in enhancing
the oil & gas security of the country include - facilitating increase in
domestic oil and gas production under NELP, acquiring oil and gas
acreages abroad, facilitating LNG imports, taking initiative to import gas
through transnational pipelines, diversifying crude oil supply sources, taking
steps to build strategic crude oil storage and focus on alternative sources of
energy.
7.2 Bio-fuels Programme
1.1.279 The MoPNG has taken several initiatives to promote blending of bio-fuels
such as ethanol/bio-diesel in petrol/diesel. The steps taken so far,
experience/issues and the future plans are detailed in the following paras.
The role of MoPNG in the bio-fuels programme is limited to facilitating the
blending of bio-fuels with petrol/diesel and marketing of the blend.
Ethanol-Blended Petrol (EBP) Programme
1.1.280 With a view to reducing dependence on imported oil by way of encouraging
use of indigenous sources of energy and to provide a supportive role to the
sugarcane farmers, MoPNG vide notification dated 12.9.2002 had
introduced the scheme of mandatorily supplying 5 percent ethanol blended
petrol (EBP) in 9 major sugar producing States and 4 contiguous UnionTerritories (UTs) w.e.f. 1.1.2003. However, the programme could be
implemented only in a staggered manner because ethanol was not
available in a consistent manner and at reasonable prices. MoPNG issued
an amending notification dated 27.10.2004 making sale of EBP mandatory
in 10 States and 3 UTs if the price of sourcing indigenous ethanol for supply
of ethanol-blended petrol is comparable to the price of indigenous ethanol
for alternative uses; the delivery price of ethanol at the locations is
comparable to the import parity price of petrol at that location; and the
indigenous ethanol industry is able to maintain uninterrupted supply of
ethanol for EBP programme at such prices.
1.1.281 In terms of the notification dated 27.10.2004, the public sector oil marketing
companies (OMCs) invited tenders for purchase of ethanol and finalized the
contracts for ethanol supplies for the areas in Uttar Pradesh, Punjab, Tamil
Nadu, Andhra Pradesh, Karnataka and Maharashtra. The programme
could not be taken up for implementation in the remaining notified
States/UTs on account of court cases and other administrative problems.
The main issues which have affected the programme are availability and
pricing of ethanol.
Availability of Ethanol
1.1.282 The indigenous availability of ethanol on a sustained basis to meet therequirement of EBP programme has been an issue ever since the
Ministry of Petroleum and Natural Gas Page 77 of 164

8/3/2019 wg11_petro
http://slidepdf.com/reader/full/wg11petro 78/164
Report of the Working Group on Petroleum and Natural Gas for the XI Plan (2007 – 2012)
programme was launched in January 2003. Various industrial associations
dealing with alcohol/ethanol, viz., Indian Sugar Mills Association (ISMA), All
India Distillers’ Association (AIDA), and Indian Chemicals Manufacturers
Association (ICMA) etc. have been making varying projections about the
availability of ethanol in the country.
Pricing of Ethanol
1.1.283 As per the existing practice, OMCs mix ethanol with petrol at their
marketing depots for marketing the blend. The blending process is not
considered as ‘manufacturing’. The all-taxes-and-duties-paid ethanol is
mixed with the excise duty-paid petrol, with the final blend carrying no
excise duty. As the final selling price of EBP has been kept same as that of
petrol, while procuring ethanol, OMCs considers that the delivered price of
ethanol at the mixing depots is not more than that of petrol so that they do
not suffer any under recoveries on account of selling EBP. With this broad
principle in mind, OMCs have been procuring ethanol through public
tenders. At present, OMCs are procuring ethanol @Rs.18.75 per litre at ex-factory locations producing ethanol excluding all taxes and duties. But
various associations of ethanol manufacturers want the price to be
escalated upwards based on the ethanol production cost. On the other
hand, OMCs want the ethanol price to be comparable with the price of
petrol at supply locations.
Coverage of whole country except for NE States, J&K, A&N Islands and
Lakshadweep with effect from 1.11.2006
1.1.284 MoPNG reviewed the availability of ethanol with ethanol manufacturers and
based on the confirmation given by the ethanol manufacturers about
availability of ethanol on a long term, MoPNG issued a notification on 20th
September 2006 that oil companies shall sell 5 percent ethanol-blended-
petrol in the entire country (except the North East States, Jammu &
Kashmir, Andaman & Nicobar and Lakshadweep Islands), subject to
commercial viability, with effect from 1.11.2006. The OMCs have issued
public tenders for procuring ethanol for the programme from indigenous
producers for a period of three years extendable by two years. Most of the
State Governments have yet to notify the local taxes/levies on ethanol
meant for blending with petrol and also are yet to issue excise licences to
oil companies for ethanol storage. OMCs have already built necessary
storages for storing ethanol at blending locations.
State Taxation Issues
1.1.285 Despite very clear court rulings distinguishing the role of State
Governments relating to potable and industrial alcohol, and limiting their
role vis-à-vis the latter, the State Governments have been imposing a lot of
licensing and procedural requirements on industrial units producing
industrial alcohol, besides levying a plethora of taxes and restricting inter-
state movement of the product. The EBP programme, being a national
scheme, calls for whole-hearted cooperation from the State Governments.
All the concerned State Governments may ensure that no procedural
restrictions on the industries relating to production/manufacture/storage/
Ministry of Petroleum and Natural Gas Page 78 of 164

8/3/2019 wg11_petro
http://slidepdf.com/reader/full/wg11petro 79/164
Report of the Working Group on Petroleum and Natural Gas for the XI Plan (2007 – 2012)
transportation/distribution/sale of ethanol meant for doping in petrol are put
so that the implementation of the EBP programme is not jeopardized.
Time-frame for Increasing the Ethanol Content to 10 percent
1.1.286 After stabilization of 5 percent EBP sales, ethanol content in petrol would be
considered for increasing to 10 percent by the end of XI Plan, subject to
ethanol availability and commercial viability of blending.
Bio-diesel
1.1.287 Bio-diesel is another bio-fuel which has been receiving the attention of the
Government. A Committee set up under the Chairmanship of Dr. D.N.
Tiwari, former Member, Planning Commission, on “Development of Bio
fuel”, in its report dated April 2003 had recommended launching of a
National Mission on Bio-diesel. The proposed National Mission inter-alia
envisaged large scale plantation of Jatropha, a large shrub found
countrywide and adapted to arid/semi-arid conditions, for generating theenvironment friendly fuel which can be blended with diesel. The Ministry of
Rural Development has been made the nodal Ministry to implement the
National Mission on bio-diesel.
1.1.288 As per the work allocation, different Ministries will look after different
aspects of the bio-diesel programme. On its part, MoPNG formulated a bio-
diesel Purchase Policy in October, 2005, effective 1.1.2006. This policy is a
statement of intent on purchase of bio diesel by the OMCs. This policy, inter
alia, identifies 20 purchase centres of the public sector OMCs all over the
country where these companies would purchase bio-diesel which meets the
standards prescribed by the Bureau of Indian Standards (BIS), from those
bio-diesel manufacturers who register with them after satisfying the
technical specifications, at a specified delivered price fixed for a period of
six months at a time by the OMCs. At present, the procurement price is
Rs.26.50 per litre (delivered at purchase locations inclusive of all taxes)
upto December 2006.
1.1.289 OMCs have not been able to purchase any bio diesel at any of the identified
locations till now. It has been reported that the production of cost effective
non-edible oil seeds (like Jatropha, Karanja, Pongamia, etc.) in India as of
now is significantly low and therefore production of bio-diesel in India based
on indigenously grown non-edible oil seeds is insignificant. The processors
setting up production facilities with small/medium/large scale are seekinghigher price only because their inputs (vegetable oil) are of a higher cost for
obvious reasons. Since plantations of non-edible oil seeds trees like
Jatropha, etc., have been taken up only in recent years on a significant
scale, the situation may improve after 2-3 years when these start yielding oil
seeds and at that time bio-diesel is likely to be cost effective with reference
to petro-diesel.
1.1.290 Even the limited quantities of bio-diesel which have been made available to
the OMCs for trial purposes were priced between Rs. 35/- to Rs. 52/litre at
various locations. Even if the excise duty and sales tax / VAT were to be
completely waived off on bio-diesel, its delivered price at identified locations
would still be much higher than Rs.26.50 per litre, the price up to which
Ministry of Petroleum and Natural Gas Page 79 of 164
8/3/2019 wg11_petro
http://slidepdf.com/reader/full/wg11petro 80/164
Report of the Working Group on Petroleum and Natural Gas for the XI Plan (2007 – 2012)
mixing of bio-diesel with diesel has been found to be commercially viable at
present.
1.1.291 Keeping in view that bio-diesel production/availability is likely to improve in
the next 2-3 years the entire country may be progressively covered with
sale of 5 percent bio-diesel-blended-diesel by the end of XI Plan i.e.31.3.2012. Bio-diesel content could be considered for increasing to 10
percent thereafter depending on the experience gained, availability of bio-
diesel and commercial viability.
1.1.292 There is a need for coordinated action amongst different Ministries for
making the bio-diesel blending programme a success. Planning
Commission/Ministry of Rural Development may ensure plantation of
Jatropha/Karanja and production/availability of bio-diesel for blending with
diesel as per the above schedules.
7.3 Strategic Storage
1.1.293 Oil security can be viewed from either of the standpoints namely short term
or long term. In the long run, increasing the sources of crude on which the
country has complete control can only enhance oil security. For this
purpose, we have employed several strategies, which include enhancing
domestic E&P through NELP, increasing domestic production through
IOR/EOR, and acquiring equity oil abroad by empowering our Navratnas. In
the short term, to tide over supply disruptions, the country is constructing
strategic crude oil storages.
1.1.294 The Government has taken in principle decision to construct 15 MMT of
strategic storage in phases. 5 MMT storage is being built during the 1st
phase. Currently, under ground crude storages are being built at the
following sites:
1 MMT at Visakhapatnam
2.5 MMT at Mangalore
1 MMT at Padur a site near Mangalore
1.1.295 As regards funding, the core critical sovereign reserve being strategic
reserve must be funded by the government. Therefore, strategic crude oil
storage is being funded by the Government through OIDB and is beingimplemented by Indian Strategic Petroleum Reserves Limited (ISPRL), a
SPV under OIDB. It is expected that the project would be completed within
the XI Plan.
Secondary Storages
1.1.296 Secondary storages can help alleviate supply disruptions as well. These
could be added in the XI and the XII Plan as distinct from commercial
storages of oil companies and be funded through participation of oil
companies on voluntary/mandated basis. In addition innovative financing
models including funding through public private partnership using other than
budgetary support could be explored for secondary storages.
Ministry of Petroleum and Natural Gas Page 80 of 164

8/3/2019 wg11_petro
http://slidepdf.com/reader/full/wg11petro 81/164
Report of the Working Group on Petroleum and Natural Gas for the XI Plan (2007 – 2012)
Usage
1.1.297 The use of strategic storage has attracted interest from several quarters.
Normally, sovereign reserves have been held to cover short-term supply
disruptions with the explicit understanding that they would not be used for
price stabilisation. There appears little historical experience of use of strategic reserve for price stabilisation based on which any creditable
inference can be drawn. Though, during 2005, the OECD countries
released strategic reserves after the hurricane damage, the release had
calming effect on the oil markets. We see no harm in India experimenting
with price stabilisation to gain experience and examine whether the
reserves could be put to alternative uses. For this purpose, specific
guidelines are required to be developed before the crude storage can be
used for price stabilisation. In any case a world supply disruption is likely to
invite action from most countries holding strategic reserves to release their
oil.
7.4 Conservation of Products
1.1.298 Industrial, transport and commercial sectors in India consume more than 80
percent of its petroleum products while the rest is consumed in domestic
and agricultural sectors. In view of the above, while campaigns for
conservation in domestic and agricultural sectors would continue,
Petroleum Conservation and Research Association (PCRA) proposes to
focus on industrial, transport and commercial sectors in the coming Five
Year Plan in order to make the target groups aware of the technologies/tips
to conserve petroleum fuels and thus contribute towards reducing India’s
huge crude oil import bill. R&D projects on petroleum conservation taken up
through leading research institutions of the country have shownencouraging results for saving potential of petroleum products. The
proposed campaigns on successful R&D projects, Energy Audit and Driver
Training Program would act as a strong interface between the industry and
PCRA. Apart from the conventional means of communication to the target
groups, PCRA will lay emphasis on making short films highlighting the
success stories on select R&D projects, Energy Audits and Driver Training
Program in order to motivate similar clients in the market.
1.1.299 Research project taken up on fuel wastage at traffic red light due to idling of
vehicles in Delhi brought out an amazing fact that the nation loses an
amount of Rs. 994 Crore per annum due to idling of vehicles at 600 traffic
intersections in the city of Delhi only. Another study carried out on derivingthe most fuel-efficient speed on 3 most popular cars in India showed that 45
kM per hour is the speed for achieving the best fuel efficiency in small
segment cars in India. The study also brought out that the non-effective
period for idling stop based on fuel consumption for these 3 most popular
cars in India is 26 seconds on average. This means, by switching off the
engine at idling for more than 26 seconds at 600 traffic intersections in
Delhi only can save major parts of Rs. 994 crore per year.
1.1.300 Energy Audit carried out on 110 DG sets of India’s oil giant ONGC resulted
in a saving potential of 2,136 kilolitre of HSD oil per annum that is
equivalent to Rs. 10.3 crore per annum. Driver Training Program carriedout for 1,406 drivers of RSRTC (Rajasthan State Road Transport
Ministry of Petroleum and Natural Gas Page 81 of 164

8/3/2019 wg11_petro
http://slidepdf.com/reader/full/wg11petro 82/164
Report of the Working Group on Petroleum and Natural Gas for the XI Plan (2007 – 2012)
Corporation) resulted in an overall improvement in kilometre per litre from
5.0 to 5.09. In terms of financial saving, RSRTC has already recorded a
savings of Rs. 6 crore per annum as a result of Driver Training Program of
PCRA.
1.1.301 TV and Radio would continue to remain as major tools for communicationand PCRA proposes to produce effective TV and Radio spots and run these
on popular TV and FM Radio channels. Panel discussions will be held on
TV channels involving experts from related fields. Apart from the electronic
media, PCRA plans to extend its campaign on outdoor publicity through
hoardings/electronic display boards/kiosks at prominent and strategic
locations throughout the country.
1.1.302 Outdoor publicity will be taken up aggressively in the next Five Year Plan
based upon its effectiveness. PCRA is in the advanced stage of putting up
hoardings on conservation message at ROs of all OMCs, viz. IOCL, HPCL,
BPCL and IBP. PCRA envisages bringing about an attitudinal change in the
minds of the drivers to follow conservation tips displayed at ROs, wherethey spend on average 5 minutes refuelling their vehicles.
1.1.303 PCRA also envisages bringing about the much needed attitudinal change
by involving children in its campaigns. It plans to educate children through
various mediums in their educational curriculum. Internet medium would be
another platform PCRA proposes to focus on in the next Five Year Plan.
1.1.304 On an average PCRA spends Rs. 10 crore every year on education
campaign. During next Five Year Plan, PCRA proposes to spend Rs. 12 to
15 crore every year for the activities mentioned above. Thus, PCRA’s
estimated budget for next five years would stand at a range of Rs. 60 to 75
Crore for educational campaigns.
Other Areas of Conservation
1.1.305 In addition, as a part of the Government’s response to the oil crisis of early
1970s, the PCRA was set up in 1976 to undertake studies to identify the
potential and to make recommendations for achieving conservation of
petroleum products in various sectors of the economy. It sponsors R&D
activities for the development of fuel-efficient equipment/devices and
organizes multi-media campaigns for creating mass awareness for the
conservation of petroleum products. Fuel oil utilization studies, energy
audits, synchronization of traffic signals, boiler modernization scheme,introduction of equipment bank concept, use of energy vans, development
of oil consumption norms, model depot projects, driver training programs,
demonstration clinics/workshops/exhibitions, consumer meets, educational
films/TV spots, hoarding/electronic display, distribution of printed literature,
R&D projects are other activities.
1.1.306 Further, soft loan and subsidies are given by OIDB for conducting energy
audits, purchase of energy audit equipments/instruments, upgradation of
maintenance facilities at garage, LIP rectification, foot valve replacement,
upgradation of testing facilities to foot valve manufacturers for promoting oil
conservation. The oil industry is also promoting the use of alternative
sources of energy to the maximum extent possible. Many petrol pumps are
Ministry of Petroleum and Natural Gas Page 82 of 164

8/3/2019 wg11_petro
http://slidepdf.com/reader/full/wg11petro 83/164
Report of the Working Group on Petroleum and Natural Gas for the XI Plan (2007 – 2012)
provided with SPV system. Some oil company colonies have solar water
heaters, solar cookers, solar lanterns, gobar gas plants, improved choolhas,
efficient kerosene stoves and lanterns. In some select villages in the
districts of Solan, Sultanpur and Jaisalmer Wind mills are also being
considered. All these will act as stimuli for others to emulate.
1.1.307 Petroleum conservation, then becomes our joint responsibility be it the
industries, individual citizens, organizations, oil companies or the
Government. Each one of us has a specific and significant role to play.
7.5 Alternative Sources of Energy
1.1.308 The national endeavour to bridge the ever-increasing gap between demand
and supply of petroleum products in India by intensifying the exploratory
efforts for oil and gas in the Indian sedimentary basins and abroad needs to
be supported by other unconventional sources of energy like Coal Bed
Methane, Gas Hydrates, Coal Liquefaction, etc.
Coal Bed Methane
1.1.309 Exploration Programme in already awarded 16 CBM blocks and another 10
CBM blocks have been offered under the third CBM round will continue
during XI Plan period. In four blocks of CBM, where CBM gas reserves of 6
TCF have already been established, may witness production of CBM during
the Plan period.
1.1.310 MoPNG will offer CBM blocks in future CBM rounds in consultation with the
Ministry of Coal. Under the fourth CBM round, DGH have tentative plans to
offer CBM blocks from Assam, Arunachal Pradesh, Orissa, Jharkhand,
Madhya Pradesh, Gujarat and Tamil Nadu. Once the areas for CBM blocks
are earmarked in consultation with Ministry of Coal, DGH will come out with
more rounds of CBM blocks.
1.1.311 ONGC envisages producing about 1.24 BCM of CBM gas and share of
CBM gas of Private/JV companies is about 2.54 BCM during XI Plan period.
The break-up is given as under:
Table 6.1: Proposed CBM Gas Production during XI Plan (BCM)
Organization 2007-08 2008-09 2009-10 2010-11 2011-12 Total
ONGC 0.30 0.78 0.78 0.78 0.75 1.24
Pvt./JV 0.16 0.48 1.12 2.00 3.20 2.54
Total 0.46 1.26 1.90 2.78 3.95 3.78
Gas Hydrate Resources
National Gas Hydrates Programme
1.1.312 Gas hydrates, generally found in the deep sea, are basically methane
molecules trapped in ice. At present, there is no commercial production of
gas hydrates in any part of the world and the technology is only at R&D
stage.
Ministry of Petroleum and Natural Gas Page 83 of 164
8/3/2019 wg11_petro
http://slidepdf.com/reader/full/wg11petro 84/164
Report of the Working Group on Petroleum and Natural Gas for the XI Plan (2007 – 2012)
1.1.313 The National Gas Hydrate Programme (NGHP) was initially started in 1997
by MoPNG with participating agencies i.e. ONGC, GAIL, DGH, OIL,
National Geophysical Research Institute (NGRI), National Institute of
Oceanography (NIO) and Department of Ocean Development (DOD). This
programme was conceived by the Government for exploring for gas
hydrates in the Indian deep waters, being a future source of unconventionalhydrocarbons. The programme was reconstituted in year 2000 by MoPNG
to give a greater thrust in this direction, by making Director General, DGH
as Technical Coordinator of the programme, Secretary (P&NG) as
Chairman of Steering Committee and six technical working sub-groups,
constituted by involving scientists/engineers from above mentioned
organizations.
1.1.314 Till date, a large number of seismic data covering offshore areas of the
country has been studied including special processing of large data for
identification of gas hydrates signatures.
1.1.315 Based on these studies, three areas in KG Basin, Andaman Sea and westcoast were identified for further scientific investigations. A road map was
also prepared for NGHP. As per the road map, detailed geo-scientific
investigations were carried out in the KG Basin and Kerala-Konkan basin by
NGHP through National Institute of Oceanography (NIO). Based on the
results of seismic data studies and geo-scientific investigations, ten sites in
Mahanadi, KG and Kerala-Konkan basins and Andaman Sea have been
short listed for drilling/coring of gas hydrates in the deepwaters. The
drilling/coring for gas hydrates is a very specialized activity and India will be
only third country in the world to do so, after USA and Japan. The services
for such specialized activity are not available commercially in the world.
With sustained efforts by DGH, with IODP and USA, the drillship JOIDESResolution along with all the scientific equipment and scientists onboard
has collected samples in Indian offshore. From April, 2006 to August, 2006,
under an agreement between DGH and a US consortium of companies.
1.1.316 After obtaining the gas hydrates cores several scientific studies are being
carried out onboard the ship and will also be carried out in several
laboratories in India, USA and Canada for which separate agreements have
been signed by DGH and corresponding agencies. The studies will lead to
understand gas hydrates characterization in Indian offshore areas and also
in carrying out resources estimates, as well as R&D in this field.
1.1.317 During drilling/coring by drill ship presence of huge quantities of GasHydrates has been detected in one of the wells in KG Basin. A specialized
core repository is also being constructed in Panvel, Mumbai for storing all
the valuable gas hydrates cores for future studies. Overall, a good progress
has been made in exploration for gas hydrates in the country, under NGHP.
Pilot test production is planned to be carried out in India by 2009-10 after
developing a suitable mathematical and simulation model.
1.1.318 The production of gas from gas hydrates itself is the biggest challenge
faced by the world scientific community. The basic challenge is to find out a
suitable technology to first dissociate the gas hydrates present in the solid
form below the seabed in deep-sea conditions, as well as the permafrostregions of the world. Another challenges faced, is to produce the
Ministry of Petroleum and Natural Gas Page 84 of 164

8/3/2019 wg11_petro
http://slidepdf.com/reader/full/wg11petro 85/164
Report of the Working Group on Petroleum and Natural Gas for the XI Plan (2007 – 2012)
dissociated gas from gas hydrates at a commercial rate and thirdly the
whole activity presently is uneconomic, as it is to be carried out in deep
waters.
1.1.319 Presently no commercially proven technology exists for production of gas
from gas hydrates, any where in the world. Research work in this regard isgoing in a few countries involved in gas hydrates R&D, including India.
Therefore, giving any time frame for production of gas from gas hydrates is
practically not possible at present. However, as per current plan we may be
able to do some progress on commercial exploitation of gas hydrates,
beyond year 2010, if commercial quantities of gas hydrates are found in
Indian offshore, which will be known only after completing the proposed
drilling/ coring activity presently under progress.
Underground coal gasification (UCG)
1.1.320 Underground coal gasification (UCG) is the in-situ gasification of coal in the
seam. It is achieved by injecting oxidants, gasifying the coal and bringingthe product gas to surface through boreholes drilled from the surface. The
gas is then used for power generation, feedstock for chemical fertilizers and
industrial heating.
1.1.321 UCG was first developed as a large-scale gas production process in the
1960’s and recently trial schemes have been evaluated in many countries
including China, India, Australia, South Africa, the USA and UK. The revival
of interest in UCG is a direct result of improved technology, security of
supply and a realization that gas from underground coal gasification offers
substantial cost reductions for production and CO2 capture.
1.1.322 ONGC and GAIL have been exploring the possibility of exploiting coal gas
by UCG technology. ONGC has signed a draft agreement of collaboration
with the National Mining Research Centre Skochinsky, Institute of Mining
(Russia) and Coal India Ltd. for its UCG project. According to ONGC
estimates, free gas recoverable reserves in the Ahmedabad-Mehsana block
alone are around 230 BCM. It has plans to drill 100 wells and install 4 stage
enriched air compressors to generate 1.5 MMSCMD of gas. The ultimate
aim is to set up a 200 MW power unit.
1.1.323 GAIL has planned a UCG project in Rajasthan. The company is tying up
with Ergo Exergy Technologies Inc., Canada, for sourcing in-situ lignite
gasification technology for its project. GAIL also intends to set up a coalgasification plant based on Shell technology in Talcher (Orrisa) for which a
techno-economic feasibility study has been carried out. The estimated
project cost works out to Rs. 2,400 crore. The Syngas produced from this
gas can be an attractive option for the urea plants around the same
location.
1.1.324 A Coordination Group has been formed in the Department of Fertilizer,
Ministry of Chemicals and Fertilizers to look into the possibility of UCG
utilization in Fertilizer sector. DGH is a member of this Group. Work in this
respect is expected to commence soon. By 2010-11, ONGC has plan to
produce 2.7 MMSCMD of gas through UCG process and envisages to
produce about 2.99 BCM of UCG gas during XI Plan period.
Ministry of Petroleum and Natural Gas Page 85 of 164

8/3/2019 wg11_petro
http://slidepdf.com/reader/full/wg11petro 86/164
Report of the Working Group on Petroleum and Natural Gas for the XI Plan (2007 – 2012)
Conversion of Coal to Liquid Hydrocarbon
Coal Liquefaction Project
1.1.325 During the X Plan, pre-feasibility study on Catalytic Two Stage Liquefaction
(CTSL) technology of M/s Axens NA, USA on coal liquefaction process has
been completed. As a parallel action, another study of similar nature has
also been carried out on Direct Coal Liquefaction (DCL) Technology of M/s
HTI, USA in order to select the best suitable technology for the North-east
coal for liquefaction. Feasibility study will be carried out on the selected
technology in the Phase- II program.
1.1.326 In this program, process optimization test will be carried out in a pilot plant
to confirm liquid product yield, quality and then take up product upgrading
tests. This will be followed by a process guarantee run in a large pilot plant
(3 Tonnes per day capacity or more) in order to avoid risk of scaling up of
pilot plant results to commercial size. If necessary, OIL may look for co-
operation from M/s China Shenouah Coal Liquefaction Company who hasnot only constructed a 6 Tonnes per day pilot plant but is going ahead to
construct a 4 MMTPA commercial plant to start production by the year
2008.
1.1.327 Meanwhile, to confirm availability and assured supply of coal in Assam,
Arunachal Pradesh and Meghalaya for a commercial plant, OIL is in
constant touch with Coal India Limited (CIL). A Joint Task Force between
OIL and CIL has already been formed to study various aspects. OIL plans
to carry out a feasibility study and looking for a suitable technology
depending on economics and gas availability.
Oil Shale
1.1.328 Oil shale exists worldwide in large quantities, in Australia, Brazil, Canada,
China, France, Russia, Scotland, South Africa, Spain, Sweden and USA.
The largest share of oil shale reserves of about 1,000-1,600 billion barrel
exists in US, while in India the reserves are estimated to be about 100
billion barrels.
1.1.329 The term ’oil shale’ is a misnomer. It does not contain oil nor is it commonly
shale. The organic material is mainly kerogen, and the ’shale’ is usually a
relatively hard rock, called marl. Properly processed, kerogen can be
converted into a substance somewhat similar to petroleum. However, it hasnot gone through the ’oil window’ of heat (nature’s way of producing oil) and
therefore, to be changed into an oil-like substance, it must be heated to a
high temperature. By this process the organic material is converted into a
liquid, which must be further processed to produce oil which is said to be
better than the lowest grade of oil produced from conventional oil deposits,
but of lower quality than the upper grades of conventional oil.
1.1.330 There are two conventional approaches to oil shale processing. In one, the
shale is fractured in-situ and heated to obtain gases and liquids by wells.
The second is by mining, transporting, and heating the shale to about
450oC, adding hydrogen to the resulting product, and disposing of and
stabilizing the waste. Both processes use considerable water. The total
Ministry of Petroleum and Natural Gas Page 86 of 164

8/3/2019 wg11_petro
http://slidepdf.com/reader/full/wg11petro 87/164
Report of the Working Group on Petroleum and Natural Gas for the XI Plan (2007 – 2012)
energy and water requirements together with environmental and monetary
costs (to produce shale oil in significant quantities) have so far made
production uneconomic. The available production of oil shale from some
countries is given as under:
Table 6.2: Oil Shale Production in Various Countries (bbl/day)
1996 1999 2002
Estonia 7000 3000 5500
Brazil 3000 3900 3100
China 1200 N/A 2000
Australia N/A 100 900
1.1.331 In India, shale formation is exposed to the surface in the region of Belt of
Schuppen falling in Assam, Arunachal Pradesh and Nagaland areas
towards south of the oil fields of OIL.
1.1.332 Main constraints in oil shale production in North East region are logistically
difficult terrain, non-availability of roads, large power requirements for the
plant and consequent environmental issues. Detailed mapping, extensive
sampling to ascertain the distribution, quantity and quality of oil shale in
North Eastern part of India may be carried out for assessment of oil shale
resources in the region.
Ministry of Petroleum and Natural Gas Page 87 of 164

8/3/2019 wg11_petro
http://slidepdf.com/reader/full/wg11petro 88/164
Report of the Working Group on Petroleum and Natural Gas for the XI Plan (2007 – 2012)
8 Targets for XI Plan Period
8.1 Exploration and Development of Oil and Gas
Exploration
1.1.333 Liberalization policies adopted in E&P sector and continuation of offer of
exploration acreages under NELP and CBM through international
competitive bidding process shall ensure exploration of about 1.245 million
sq. kM of basinal area during the XI Plan period. By the end of XI Plan,
exploration area offered will be about 80 percent of the total sedimentary
basinal area and entire sedimentary basins may be opened up for
exploration by 2015 as against the target of Hydrocarbon Vision by 2025.
1.1.334 Under the nomination regime, there was certainty of getting exploration
blocks of choice but under NELP, exploration blocks are awarded based on
quantitative bidding parameters such as work programme committed and
Government’s take offered by the bidder. Consequently, availability of
exploration acreages will have an element of uncertainty and accordingly
exploration programme in terms of seismic surveys and drilling will only be
indicative.
1.1.335 Exploration programme has been given as under:
Table 9.1: Summary of XI Plan – Exploration Programme
ACTIVITY UNIT ONGC OIL Private/JV Total
Seismic surveys 2D kM 54,359 10,865 63,200 128,424
Seismic surveys 3D Sq. kM 76,398 6,350 67,825 150,573
Exploratory drilling (metreage) kM 1,817.83 572.95 832 3,222.78
Exploratory wells Nos. 651 149 300 1,100
Reserves accretion IIH MMTOE 1,000.7 153.74 975 2,129.44
Development Program
1.1.336 Oil discoveries made in Rajasthan by Cairn Energy India Pty Limited, gas
discoveries in KG basin and other oil and gas discoveries made by NOCs
will be undertaken during XI Plan. During XI Plan period ONGC and OILhave plans to implement IOR/EOR in the ageing fields, develop marginal
and isolated fields and faster development of new discoveries made. The
development wells to be drilled by ONGC, OIL and Private/JV companies
during XI Plan are as under:
Table 9.2: Proposed development wells during XI Plan (Nos.)
2007-08 2008-09 2009-10 2010-11 2011-12 Total
ONGC 231 233 200 176 160 1,000
OIL 35 38 51 56 68 248
Pvt./JV 96 129 93 58 36 412
Ministry of Petroleum and Natural Gas Page 88 of 164

8/3/2019 wg11_petro
http://slidepdf.com/reader/full/wg11petro 89/164
Report of the Working Group on Petroleum and Natural Gas for the XI Plan (2007 – 2012)
Total 362 400 344 290 264 1,660
1.1.337 Oil and gas discoveries made so far under the PSC regime are being
monitored with respect to time frame provided in respective PSC.
8.2 Crude Oil and Natural Gas Production
1.1.338 Based on the established reserves, present status of different fields, input
implementation schedules and health of reservoirs, the crude oil and gas
production profiles for XI Plan is prepared as given below:
Table 9.3: Proposed Crude Oil and Natural Gas production during XI Plan
Crude Oil Production (MMT)
2007-08 2008-09 2009-10 2010-11 2011-12 Total
ONGC 27.16 28.00 29.00 28.53 27.37 140.06
OIL 3.50 3.55 3.73 3.91 4.30 18.99
Pvt./JV 10.57 10.78 9.76 8.75 7.85 47.71
Total 41.23 42.33 42.49 41.19 39.51 206.76
Natural Gas Production (BCM)
2007-08 2008-09 2009-10 2010-11 2011-12 Total
ONGC 22.10 22.53 22.77 22.99 22.00 112.39
OIL 3.13 3.21 3.25 3.28 3.56 16.43
Pvt./JV 8.55 22.55 22.11 21.47 21.07 95.74
Total 33.78 48.29 48.13 47.73 46.63 224.56
1.1.339 Crude oil production of 206.76 MMT during XI Plan period is about 23
percent higher than the X Plan likely achievement of 167.70 MMT. The
increase in crude oil production will be mainly due to contribution by private
company, Cairn Energy Pty Ltd., which will produce about 5-6 MMT per
annum from Rajasthan.
1.1.340 Natural gas production during XI Plan will be about 224.56 BCM, which is
about 41 percent increase as against likely natural gas production of about
158.79 BCM in X Plan period. This increase in gas production is mainly
from K-G basin production of 40 MMSCMD by RIL. The gas production may
further increase by development of GSPC discoveries and other RIL’s
discoveries in KG basin.
1.1.341 Based on the envisaged inputs, it is estimated that overall reserve accretion
during the X Plan in terms of oil plus oil equivalent of gas will exceed the
production volumes during the same period, thus, resulting in Reserve
Replacement Ratio (RRR) of more than unity.
E&P Strategies to Enhance Oil & Gas Production
i. Level playing field to public sector and private sector players including foreign players
and provision of comparable incentives to all E&P companies.
Ministry of Petroleum and Natural Gas Page 89 of 164

8/3/2019 wg11_petro
http://slidepdf.com/reader/full/wg11petro 90/164
Report of the Working Group on Petroleum and Natural Gas for the XI Plan (2007 – 2012)
ii. Pursue extensive exploration in non-producing and frontier basins for knowledge
building and new discoveries, including in deep-sea offshore areas.
iii. Establishment of a ‘Knowledge Hub’ in India.
iv. Strengthening of DGH and upstream oil and gas regulations.
v. Convergence of nomination regime into NELP Regime.
vi. Faster development of oil and gas discoveries.
vii. Development of isolated and marginal fields and creation of surface facilities.
viii. Provide infrastructure status to E&P companies and competitive fiscal terms to attract
significant investments in the sector.
ix. Optimize recovery from ageing oil and gas fields.
x. Continue to offer more CBM exploration blocks.
xi. 100 percent speculative survey to carve out exploration blocks.
xii. Efforts to get methane gas through in-situ gasification of coal.
xiii. Continuation of R&D efforts to exploit the potential of gas hydrates.
xiv. R&D efforts and feasibility to understand the potential of oil shale.
xv. Availability of trained manpower and expertise in E&P sector.
xvi. Continue technology acquisition and absorption along with development of
indigenous R&D and to ensure adequacy of finances for R&D required for building
knowledge infrastructure.
xvii. Make E&P operations compatible with the environment and reduce discharges and
emissions.
xviii. Continue to acquire acreages abroad for exploration as well as production.
8.3 Equity Oil and Gas Abroad
Imperatives
1.1.342 Oil security for a nation, that is, aspiring to be an economic power, is very
vital. Equity oil abroad may lessen our dependence on a few suppliers and
increase our inter-dependence on a global basis. Considering the oil
demand scenario vis-à-vis domestic production level on the one hand and
low crude oil reserve replenishment trend and high risk of domestic
exploration on the other, a major focus of NOCs/Indian private companies
would be to venture abroad to access exploration blocks and producing
properties for equity oil. Access to equity oil through equity participation in
producing property development projects in the short term in non-OPEC
developing areas (Asia, Latin America, Africa) as well as in politically
Ministry of Petroleum and Natural Gas Page 90 of 164

8/3/2019 wg11_petro
http://slidepdf.com/reader/full/wg11petro 91/164
Report of the Working Group on Petroleum and Natural Gas for the XI Plan (2007 – 2012)
friendly countries with large oil potential (Middle East, Russia and FSU
countries) needs to constitute a part of risk capital investment.
Strategic Options
i. Focus on producing property ventures in the short term;
ii. Purchase of equity share of companies as a part of reserves portfolio management;
iii. Focus on exploration acreages in short to medium term;
iv. Promoting upstream sector services to establish international credibility;
Crude Oil and Natural Gas Production from Overseas
1.1.343 The physical targets for oil and gas production during XI Plan period are
given below:
Table 9.4: Crude Oil and Natural Gas Production from Overseas
2007-08 2008-09 2009-10 2010-11 2011-12 Total
Crude OilProduction(MMT)
OIL 0.25 0.5 1.0 1.53 1.6 4.88
OVL 7.02 6.53 5.97 5.76 5.35 30.63
TOTAL 7.27 7.03 6.97 7.29 6.95 35.51
Natural GasProduction(BCM)
OVL 1.75 1.82 1.93 1.97 2.2 9.67
Establishment of National Knowledge Hub
1.1.344 Setting up of National Knowledge Hub (NKH) in India is essential in order to
protect past investment (made in the form of data acquisition), promote
growth by encouraging greater participation by providing access to quality
data in an integrated and synergetic environment, provide level playing field
for small players and establish a link among all E&P companies and
academia. Creation of National Data Repository (NDR), which is an
important component of National Knowledge Hub, is also a part of charter.
1.1.345 National Knowledge Hub will host the NDR and also be a centre of excellence for knowledge sharing and training centre, hosting domain
applications and visualization centre for use by the industry.
i. The National Knowledge Hub (NKH) will comprise the following for use by the
industry
ii. The National Data Repository (NDR)
iii. The National G&G Processing Centre (NPC)
iv. The National Visualization and Application Centre (NVAC)
v. The National Training Centre (NTC)
Ministry of Petroleum and Natural Gas Page 91 of 164

8/3/2019 wg11_petro
http://slidepdf.com/reader/full/wg11petro 92/164
Report of the Working Group on Petroleum and Natural Gas for the XI Plan (2007 – 2012)
vi. The National E&P Knowledge Portal (NKP)
1.1.346 The benefits through National Knowledge Hub (NKH) will be as under:
i. Enable evaluation of the total hydrocarbon potential of the country by integratinggeo-scientific data;
ii. Protect past investment, attract investments and thus promote desired growth infuture by leveraging on modern technology;
iii. Improve the efficiency of hydrocarbon prospecting in the country by providingintegrated and synergetic environment;
iv. Create geo-scientific ambience and link among the geo-scientists, petroleumengineers both from industry and academia to strengthen over-all geo-scientificactivities in India.
Incentives for Upstream Sector
1.1.347 Presently 1.09 million Sq. kM. area is under exploration, which is about 35
percent of Indian sedimentary basinal area of 3.14 million Sq. kM. About 70
percent exploration area is either deepwater and in frontier basins. During
XI Plan period, most of the discoveries is likely to come from logistically
difficult areas and where no production evacuations facilities are in
existence. Exploration companies have to invest heavily on development of
surface facilities such as pipelines gas/oil collecting stations and platforms.
In addition, oil companies will have to invest higher amounts on oil and gas
production from ageing fields to maintain current level of production. To
keep momentum of increased development activities in E&P sector,
requirement of fiscal incentives is inevitable.
1.1.348 In view of above and as an imperative to realize substantial investment in
E&P sector the following incentives need consideration:
i. Granting of infrastructure status to the E&P sector under the Income Tax Act,1961;
ii. Incentives for replacing surface facilities;
iii. Incentives to establish technology hub for service providers in E&P sector.
Major Indicative Physical Parameters for the XI Plan vis-à-vis Likely Achievements
in X Plan
1.1.349 The major indicative physical parameters for the XI Plan vis-à-vis likely
achievements in X Plan are as follows:
Table 9.5: Physical parameters for XI Plan vs. X Plan
Parameter X Plan Target LikelyAchievement
In X Plan
Indicative PhysicalParameters for XI
Plan
Seismic Surveys
2 Dimensional (GLK / LK) 98,327 64,867 128,424
3 Dimensional (Sq kM) 48,305 63,947 150,573
Ministry of Petroleum and Natural Gas Page 92 of 164

8/3/2019 wg11_petro
http://slidepdf.com/reader/full/wg11petro 93/164
Report of the Working Group on Petroleum and Natural Gas for the XI Plan (2007 – 2012)
Table 9.5: Physical parameters for XI Plan vs. X Plan
Parameter X Plan Target LikelyAchievement
In X Plan
Indicative PhysicalParameters for XI
Plan
Exploratory Drilling
No. of Wells 871 944 1,100
Development Drilling
No. of Wells 883 1,191 1,660
Hydrocarbon
In-place ReservesAccretion (MMT)domestic
785-914 1,813.42 2,129.44
Production Oil (MMT)
Domestic: 165.24-169.38 167.70 206.76
Overseas: 5.2 16.83 35.51Total 170.44-174.58 184.57 242.27
Production Gas (BCM)
Domestic: 167.43-176.50 158.79 224.56
Overseas: 4.94 5.41 9.67
Total 172.37-181.44 164.2 234.23
Production Oil & Gas(MMTOE)
Domestic: 332.67-345.88 326.53 431.32
Overseas: 10.14 22.24 45.18
Total 342.81-356.02 348.77 476.5
CBM Gas Production(BCM)
- - 3.78
UCG Gas Production(BCM)
- - 2.99
8.4 Refining Capacity Additions
Refining Capacity Additions in XI Plan
1.1.350 At the beginning of XI Plan (2007-08), the domestic refining capacity is
expected to be 148.97 MMTPA. Considering the projects under
implementation and the project under various stages of approval, the
refining capacity in India is expected to go up to 235 MMTPA during the XI
Plan based on the information furnished by the various companies. The
capacity addition in XI Plan period is expected to be about 92 MMT. The
details of refining capacity additions are given at Annexure – X. however,
the year-wise additions to refining capacity are given below.
Table 9.6: Year-wise Refining Capacity additions during XI Plan (MMT)
Year 2007-08 2008-09 2009-10 2010-11 2011-12
Capacity Addition 9.73 36.00 15.51 15.67 15.08
Ministry of Petroleum and Natural Gas Page 93 of 164

8/3/2019 wg11_petro
http://slidepdf.com/reader/full/wg11petro 94/164
Report of the Working Group on Petroleum and Natural Gas for the XI Plan (2007 – 2012)
1.1.351 Based on the year wise refining capacity addition as given above, the year
wise refining capacity available during XI Plans as on 1st April will be as
follows:
Table 9.7: Year-wise Cumulative Refining Capacity during XI Plan (MMT)
2006 2007 2008 2009 2010 2011 2012 CARG(%)
132.47 148.97 158.70 194.70 210.21 225.88 240.96 12.35%
1.1.352 The details of refinery capacity additions, year wise are as under:
Table 9.8: Year-wise & Company-wise Refining Capacity during XI Plan
Capacity Additions During XI Plan
YEAR REFINERY MMTPA
2007-08 Indian Oil Corporation Limited, Panipat 3.00
Hindustan Petroleum Corporation Limited, Mumbai 2.40
Hindustan Petroleum Corporation Limited, Visakh 0.83
Essar Oil Limited, Jamnagar 3.50
Sub Total 9.73
2008-09 Chennai Petroleum Corporation Limited, Chennai 1.00
Reliance Petroleum Limited, Jamnagar (New) 29.00
Nagarjuna Oil Corporation Limited 6.00
Sub Total 36.00
2009-10 Indian Oil Corporation Limited, Haldia 1.50
Bharat Petroleum Corporation Limited, Bina 6.00
Chennai Petroleum Corporation Limited, Chennai 0.70
Kochi Refineries Limited, Kochi 2.00
Mangalore Refinery & Petrochemicals Limited, Mangalore 5.31
Sub Total 15.51
2010-11 Hindustan Petroleum Corporation Limited, Visakh 6.67
Hindustan Petroleum Corporation Limited, Bhatinda 9.00
Sub Total 15.67
2011-12 Indian Oil Corporation Limited, Paradip 15.00
Oil & Natural Gas Corporation Ltd. Tatipaka 0.08
Sub Total 15.08
2007-12 TOTAL XI PLAN 91.99
1.1.353 However, the actual capacity additions would depend upon several factors
including domestic demand, duty structure which would impact import and
export possibilities, refining margin, and export potential for the products.
However, in view of the likely surplus scenario, the companies depending
upon the commercial viability of the project may review their projects and
Ministry of Petroleum and Natural Gas Page 94 of 164

8/3/2019 wg11_petro
http://slidepdf.com/reader/full/wg11petro 95/164
Report of the Working Group on Petroleum and Natural Gas for the XI Plan (2007 – 2012)
capacity additions. We could expect the refining capacity to turn out to be in
the range of 190 MMT to 200 MMT leaving a scope of exports in the range
of 45 MMT to 55 MMT.
1.1.354 The benefits of surplus refining capacity are at Annexure – XI. However, the
factors like setting up in SEZ areas, differential in sweet and sour crude andimport of crude oil and petroleum products being handled through large
vessels to bring down the cost of transportation may also add to the viability
of the export oriented refineries. Keeping this in view the refineries will have
to make processing facilities for processing of 100 percent heavy/sour
crude.
Refining Capacity Additions in XII Plan
1.1.355 Further into the future projections are complex as assessing the refining
capacity additions particularly in the era of surpluses, during the XII Plan
period is tricky. However a very rough assessment indicates that a capacity
of 67.24 MMTPA (comprising of 43.30 MMTPA in public sector and 23.94MMTPA in private sector) is expected to be added. With this capacity
addition the total refining capacity in the country is likely to reach 302
MMTPA by the end of XII Plan as indicated below:
Table 9.9: Year-wise Refining Capacity additions during XII Plan
1st April 2007 2012 2017 CARG (%)
Refining Cap (MMT) 148.97 240.96 302.27 10.29%
Public Sector 105.47 158.96 202.25 9.17%
Private Sector 43.50 82.00 100.02 12.99%
1.1.356 But actual materialization would depend upon the commercial viability of the
refineries, actual materialization and growth in international oil demand
during XI Plan.
8.5 Crude Oil Requirements and Imports
1.1.357 Crude oil imports have been estimated based on the crude processing as
indicated by refineries and net indigenous crude availability. It is estimated
that by the end of XI Plan period the imported crude requirements would be
195.49 MMT. Imported crude oil requirement goes up substantially during
the plan as indigenous crude production increases only marginally while therefining capacity is increasing substantially. Clearly, infrastructure would
have to cater to higher imports. It is expected that there will not be any
constraints in meeting future imported crude oil requirement.
Table 9.10: Yearwise Crude Oil requirements during XI Plan (MMT)
Particulars 2007-08 2008-09 2009-10 2010-11 2011-12
Processing 148.5 162.7 193.0 211.6 235.0
Table 9.11: Yearwise Crude Oil Imports during XI Plan (MMT)
Ministry of Petroleum and Natural Gas Page 95 of 164

8/3/2019 wg11_petro
http://slidepdf.com/reader/full/wg11petro 96/164
Report of the Working Group on Petroleum and Natural Gas for the XI Plan (2007 – 2012)
Particulars 2007-08 2008-09 2009-10 2010-11 2011-12
Imports 107.27 120.37 150.51 170.41 195.49
Self Sufficiency
1.1.358 Based on estimated indigenous crude oil production, production from non-
refinery sources and demand estimates for base case, the self sufficiency
of products for the XI Plan period is as given below.
Table 9.12: Year-wise Crude Oil Self Sufficiency during XI Plan ( %)
Particulars 2007-08 2008-09 2009-10 2010-11 2011-12
Self Sufficiency percent 27.8 26.0 22.0 19.47 16.8
1.1.359 Due to stagnant indigenous crude oil production and increasing demand the
self-sufficiency is estimated to decline during the XI Plan period from 27.8
percent in 2007-08 to 16.8 percent in 2011-12.
Imports/Exports of Products
1.1.360 The production of products is projected to increase to 218 MMT by the end
of XI Plan and to 286 MMT by the end of XII Plan. As a result of large
capacity additions expected in the XI Plan period, the surplus/deficit
situation will undergo a major change.
1.1.361 The projected import and export requirements are projected below for both
the cases.
Table 9.13: Year-wise Import/Export of petroleum products
Base Case (MMT)
Particulars 2007-08 2008-09 2009-10 2010-11 2011-12
Import 4.07 3.32 4.28 5.49 6.13
Export 30.95 40.64 67.88 79.56 92.68
Upper Case (MMT)
Particulars 2007-08 2008-09 2009-10 2010-11 2011-12
Import 4.11 3.40 4.40 6.60 7.46
Export 29.87 37.86 62.20 71.06 83.98
1.1.362 The export of petroleum products from India show a very high growth and
India could become a major petroleum product exporter. There is a
possibility of simultaneous import and export of some products due to
economic situation, logistics etc. Based on the supply demand situation the
following may be noticed:
i. LPG continues to be in deficit. However by the end of the XI Plan the deficit comes
down to a very low level.
ii. Products like LOBS and Bitumen would continue to remain in deficit.
Ministry of Petroleum and Natural Gas Page 96 of 164

8/3/2019 wg11_petro
http://slidepdf.com/reader/full/wg11petro 97/164
Report of the Working Group on Petroleum and Natural Gas for the XI Plan (2007 – 2012)
iii. FO and LSHS will become substantially deficit in the last two years of the XI Plan.
This is due to the fact that many new refineries and modernization of existing
refineries envisage setting up of cokers resulting in substantial decrease in production
of heavy products like FO and LSHS and converting them into distillate products. In
the process there is a marked increase in production of petroleum coke.
iv. For all other products like Naphtha, MS, ATF/SKO, and HSD the country will have
huge surplus.
1.1.363 Globally too, heavy products appear to become deficit by the same time,
indicating the need for building in some flexibility in the refineries so that
only those products are produced which have a ready market.
Caveats
1.1.364 By the end of XI Plan, the export of petroleum products is projected to be in
the range of 84 MMT to 93 MMT, though this number could be lower, if
some refineries commence production in the next Five Year Plan. In anycase, the export of petroleum products from India shows a very high
growth. There is a possibility of simultaneous import and export of some
products due to economic situation, logistics etc. While India could become
a major petroleum product exporter, export infrastructure would need to be
created.
1.1.365 Further, for India to emerge as a serious exporter it is necessary that the
refineries that are now expanding or coming up, particularly the coastal
refineries, ensure that they can meet the latest fuel specifications of the
developed world. This could mean Euro V standards for products exported
to Europe by 2009. By 2010, all diesel sold in the US would require to be
ultra low sulphur (15 ppm sulphur at retail end or just 5ppm at refinery
gate).
1.1.366 While planning for domestic requirements, the refineries must consider the
change in refinery gate price to trade parity for MS and HSD. The ratio of
import parity and export parity will under go a change every year depending
upon the past experience. If ratio of exports increases then, domestic
realization for MS and HSD will fall accordingly. Refinery projects require
factoring the above conclusions.
1.1.367 Projected world production balances indicate an interesting change. While
currently the world appears to be deficit in light and middle distillates andsurplus in heavy ends, due to new deep processing capacity, by 2010, the
production balance switches to show large surpluses in light and middle
distillate but huge deficit in heavy ends. Domestic demand-production
profile indicates a similar situation for the domestic refinery where both FO
and LSHS could have a deficit of over 4 MMT in the base case or over 5
MMT in the high case. New refineries thus would need to carefully plan their
slates. In any case a little flexibility in varying the slate would enable them
to produce what is profitable – either for domestic requirement or for
exports.
1.1.368 Finally, new crude production is heavier, and with high sulphur content.
New refineries should be able to run only on such crude while existing
Ministry of Petroleum and Natural Gas Page 97 of 164

8/3/2019 wg11_petro
http://slidepdf.com/reader/full/wg11petro 98/164
Report of the Working Group on Petroleum and Natural Gas for the XI Plan (2007 – 2012)
refineries must plan expansions and facilities to process larger quantities of
heavy, high sulphur and acidic crude.
Sustainability of Imports and Crude Oil Availability
1.1.369 Crude oil proved reserves position of the major crude oil producing
countries is as follows:
Table 9.14: Crude Oil Proved Reserves Position of Major ProducingCountries
Country At end 2005 (‘000 mn bbls Share of total (%) R/P ratio
Iraq 115.0 9.6 > 100 years
Kuwait 101.5 8.5 > 100 years
UAE 97.8 8.1 97.4
Iran 137.5 11.5 93.0
Kazakhstan 39.6 3.3 79.6Venezuela 79.7 6.6 72.6
Saudi Arabia 264.2 22.0 65.6
Libya 39.1 3.3 63.0
Azerbaijan 7.0 0.6 42.4
Sudan 6.4 0.5 46.3
Nigeria 35.9 3.0 38.1
Total World 1200.79 100.0 40.6
Source: BP Statistics 2006
1.1.370 A comparison between anticipated world crude oil production (as projected
by EIA in International Energy Outlook 2005) and India’s crude imports is
given below.
Million b/d
Year World Oil Production Crude Imports by India Percent
2010 94.3 3.6 3.8
1.1.371 It may be noted that the above crude imports are based on crudethroughput in Indian refineries with a substantial product export. If crude
throughput to meet only the indigenous demand on overall basis were
considered the requirements would be reduced to that extent. In such a
case the scenario would be as below.
Million b/d
Year World Oil Production Crude Imports by India Percent
2010 94.3 1.9 2.0
9 Oil & Gas Journal has estimated the world reserves even higher at 1292.5 billion barrels. “Worldwide Look at Reserves and Production,” Oil & Gas Journal, Vol. 103,
No. 47 (December 19, 2005), pp. 24-25.
Ministry of Petroleum and Natural Gas Page 98 of 164

8/3/2019 wg11_petro
http://slidepdf.com/reader/full/wg11petro 99/164
Report of the Working Group on Petroleum and Natural Gas for the XI Plan (2007 – 2012)
1.1.372 As seen from the above, it is expected that there will not be any constraints
in meeting future imported crude oil requirement. A point though on quality
of crude is in order. Increasingly, the global production of crude is veering
towards heavier, high sulphur and acidic crude. Refineries would do well to
build in ability to process such types of crude at 100 percent level.
Ministry of Petroleum and Natural Gas Page 99 of 164

8/3/2019 wg11_petro
http://slidepdf.com/reader/full/wg11petro 100/164
Report of the Working Group on Petroleum and Natural Gas for the XI Plan (2007 – 2012)
9 Manpower Planning for XI Plan and beyond
9.1 Planning for Sustained Availability of Knowledge Workers for the Oil and Gas
Industry
1.1.373 “People are the greatest asset” is an oft-repeated phrase. There is nodoubt that in many industries, including oil and gas industry, the next major
competitive edge will be in sustaining availability of skilled people
resources. Companies that learn to continuously develop human resources
not only stand a greater chance to survive, but will also be more profitable.
1.1.374 Acknowledging the concern voiced by the oil and gas industry about the
possible shortage in the future of knowledge workers for the entire industry,
this section analyses this situation. Although part of the same industry
value chain, the upstream and the downstream sectors, grapple with
different sets of HR challenges. But one of the common challenges being
faced by both the sub sectors is planning for sustained availability of knowledge workers.
1.1.375 Computer technology has brought short-term benefits that have allowed the
oil and gas industry to reduce technical manpower requirements at a rate
that has partly offset the decline in demand in the industry. But the future
improvements in efficiency from the technical revolution will not be sufficient
to offset the impending loss of senior expertise over the coming decade.
1.1.376 The existing educational institutions are now inadequate to ensure industry
stability and security. The gap between the availability and demand for
trained manpower is likely to be substantial unless concerted efforts are
made to increase the throughput and therefore number of quality institutesto impart desired training/education. Investment for the development of
qualified human capital is therefore most essential if the targets set forth in
the “Hydrocarbon Vision 2025” are to be achieved.
Upstream Oil and Gas Sector
1.1.377 Globally, numerous significant oil and gas discoveries have been reported
in the past 5 years which will result in enhanced E&P activity in coming
years. In 2006 alone, over 26 countries announced their awards. All this
translates into significant amount of workforce requirements particularly in
areas of Petroleum Engineering, Production Engineering, Drilling Crews
and Geoscientists.
1.1.378 India has also witnessed an increase in E&P activities. India is the fourth
largest oil consumer in the Asia-Pacific region and the Indian oil and gas
sector accounts for more than 30 percent of India’s total import bill. Imports
are set to increase further as evidenced by the growth of key sectors using
oil and natural gas for their energy requirements, unless substantial
discoveries are made in India. The Government of India has awarded over
110 blocks through international competitive bidding under five previous
rounds of NELP. The area opened up in NELP VI is more than twice the
area opened for exploration in NELP V, demonstrating government’s
intentions to actively explore for hydrocarbon reserves.
Ministry of Petroleum and Natural Gas Page 100 of 164

8/3/2019 wg11_petro
http://slidepdf.com/reader/full/wg11petro 101/164
Report of the Working Group on Petroleum and Natural Gas for the XI Plan (2007 – 2012)
1.1.379 Against a backdrop of rising demand locally as well as globally and
intention of the government to actively explore further, a boom is expected
in the Indian E&P sector. As a consequence of this, all the resources in the
sector will need to be augmented. The scarcity of service providers and
rigs is commonly known. That has resulted in astronomical rise in the rates
demanded by the service sector. The infrastructure like logistics, ports,roads, rail links, roads, etc available for exploration and development of
reservoirs is available with constraints. The human resource scenario has
already reached an increasingly competitive stage and in future the industry
may struggle to maintain the required level of E&P activities due to lack of
trained manpower. The gap on account of demand-supply mismatch may
get further aggravated by the exodus of these critical skills from the
domestic industry on account of international requirements. The
development of the sector has reached at major crossroads. If the
bottlenecks to development are not found solution to, the investments and
in turn the energy security of country would cause to be compromised.
1.1.380 The Government is sensitive to the requirement of the oil and gas industryas a whole and the upstream industry in specific, for trained and skilled
manpower. The local upstream industry as well as the global industry looks
at India as a source of skilled and cost optimal manpower. In order to help
plan actions that will result in servicing this demand, Ministry of Petroleum &
Natural Gas in August 2006, got a study done through PetroFed on the
subject. The findings of the report relating to shortage of knowledge
workers indicated a substantial supply-demand gap in the skills.
Skill Shortage in the Upstream Sector
1. Geologists, geophysicists, loggers, tool-pushers, drillers, petro-physicists andproduction engineers are considered a global commodity rather than that belonging to
a country. In these sets of critical skills a significant shortfall is expected in the next
10 years.
Most of these skills are in excess today in India, however, in view of the significant
E&P activity expected the projected demand in India will far exceed the supply of
talent. The peak shortfall across all key skills is expected be about 8,700 in year
2016, if remedial action is not taken immediately. This makes the situation of talent
gap in India far more acute.
2. Not enough talent is available to the sector at the entry level: The E&P sector
faces a critical challenge in attracting the young talent. The Indian education sector prepares around 400+ students in E&P related geo-science courses. Of the students
passing out of petro-technical streams only 56 percent join E&P companies with 12
percent of these being recruited for overseas positions. The entry to E&P sector is
limited to 56 percent due to the low awareness of the job opportunities in the sector at
the entry level and the perceived higher attractiveness of other sectors mainly IT,
Telecom (29 percent of students move to other such sectors).
3. The Indian industry will require an additional 800 petro-technical students by 2017
(600 of these by 2012). This will require an increase in the number of students taking
up education related to this sector. However, the sector faces the following
challenges in attracting young talent:
Ministry of Petroleum and Natural Gas Page 101 of 164

8/3/2019 wg11_petro
http://slidepdf.com/reader/full/wg11petro 102/164
Report of the Working Group on Petroleum and Natural Gas for the XI Plan (2007 – 2012)
Low Industry Awareness: College as well as school students are not aware of the
career paths and opportunities available in the E&P sector (short term and long
term) and how they compare with career in other sectors.
Low Industry Attractiveness: Generally tougher working conditions and low
attractiveness of the field job, coupled with a favourable alternative job marketscenario make the E&P sector low on attraction for employees at all levels.
Suggested Action Plan
1.1.381 The report identified suggested some action points for the Government, the
organizations and the education sector.
Government
Implementing a plan to communicate the attractiveness of the industry to the public at
large, especially students.
Undertaking periodic reviews of the manpower requirements in the industry in
association with the Ministry of Human Resource and Development.
Establishing higher number of educational institutions across the country and
updating the course curriculum offered as per industry requirements.
Institutionalisation of Industry-Academia interface with proper monitoring and review
controls.
Organizations
High degree of collaboration between the industry and educational institutions.
Actively participate in communication campaigns aimed to draw young talent to the
E&P sector.
Educational Institutes
Expand training programmes to address emerging skills shortage.
Expand current capacities (intake in E&P related courses) as well as set up new
courses.
Institutionalize feedback mechanisms to industry and professionals’ opinion on how toimprove effectiveness of the educational system catering to the E&P industry.
Downstream Oil and Gas Sector
1.1.382 Phase-wise deregulation of the downstream sector in India has attracted
private investments making it a very competitive industry. This new era of a
competitive market has forced government enterprises to revisit their
strategies, including those related to human resources. Downstream
players have accordingly chalked out ambitious plans to support the
economic growth targets of the country. Realization of all these plans
needs to be supported by adequate mobilization of knowledge workers.
Ministry of Petroleum and Natural Gas Page 102 of 164

8/3/2019 wg11_petro
http://slidepdf.com/reader/full/wg11petro 103/164
Report of the Working Group on Petroleum and Natural Gas for the XI Plan (2007 – 2012)
1.1.383 Refining industry is set to grow at a rapid pace with the Government
seriously considering promoting India as a competitive and economically
viable refining destination. Plans of the Government to developing specific
suitable locations within India as Petroleum Chemicals and Petrochemicals
Investment Regions (PCPIR) goes a step further to suggest integration of
petrochemical business with the proposed or existing refinery capacities.Globally, Middle East, India and China are the only areas which have seen
a spurt in refining capacity additions in recent years. In India, the refining
capacity is slated to grow over two times in the next decade or so.
Marketing and distribution of refined petroleum products will be another
challenge facing the downstream industry.
1.1.384 In view of the expected activities in the downstream sector in India, the
demand for skilled manpower is expected to far exceed the availability of
talent. In addition pull from overseas as well as domestic job opportunities
due to higher compensation, attrition, ageing workforce etc are some
factors, which may result in scarcity of talent in the downstream industry in
India.
1.1.385 Demand for personnel in the Petroleum sector is growing at such an
alarming rate that the supply of knowledge workers in all disciplines is not
expected to keep pace with the requirement. Within the downstream sector
this applies more to the refining segment as compared to the marketing
segment largely due to the requirement of specialised skill-sets for the
refining segment. Although compensation levels in the downstream sector
are comparable with competing industries, it’s structuring, in this largely
government dominated industry, makes it unattractive.
1.1.386 Today the sector is witnessing widespread movement of talent from thegovernment to the private sector. The large differential between the
employee compensation may be one of the reasons. What is not very
encouraging for the sector is that a lot of talent is flowing out of the country
to destinations such as the Middle East which are fast developing their
refining capacities. Retention of mid-carrier talent will be a severe
challenge for the oil & gas industry in India during the next decade. NOCs
in particular are highly vulnerable as they hold the highest number of
trained human resources available in the industry, which is being sought out
by private players. Also, oil and gas industry is facing competition from
other industries like IT and BPO for qualified talent.
Suggested Action Plan
1.1.387 Skilled manpower, especially at entry level, is projected to be in shortage. It
is imperative that special education and training institutes are brought up in
order not only to service the domestic industry needs but also to leverage
upon the available educated manpower and turn them into petroleum
workforce for meeting even the global demand.
1.1.388 To avoid the collapse of "the engine that drives the economy," petroleum
professionals must help create a broad-based, nationwide effort to educate
key stakeholders regarding the nation's energy future, provide outreach to
the public and to students, and beef up in-house and university-led R&D.
The success of this mission will require cooperation and collaboration on an
Ministry of Petroleum and Natural Gas Page 103 of 164

8/3/2019 wg11_petro
http://slidepdf.com/reader/full/wg11petro 104/164
Report of the Working Group on Petroleum and Natural Gas for the XI Plan (2007 – 2012)
unprecedented scale by key stakeholders across the spectrum - but
industry itself must be willing to gear up, commit needed funds to match
governmental outlays, and work with others to develop and deliver a long-
range plan.
Setting up of Rajiv Gandhi Institute of Petroleum Technology (RGIPT)
1.1.389 The gap between the availability and requirement of trained manpower is
likely to be substantive unless concerted efforts are made to increase the
number of quality institutions to impart the desired education/training. The
existing institutes namely Indian School of Mining (ISM), Dhanbad,
Maharashtra Institute of Technology (MIT), Pune, Indian Institute of
Technology (IIT), Kharagpur, and Banaras Hindu University (BHU) etc. are
unable to meet the burgeoning requirements of Petroleum sector.
1.1.390 Therefore, it has been proposed to set RGIPT at Peeparpur in Sultanpur
District of Uttar Pradesh, RGIPT is proposed to be an institute of excellence
in the petroleum sector which will provide the manpower to meet therequirement in India and globally. The institute will cater to the educational
and training requirement of all segments of the petroleum Industry in the
upstream, midstream and downstream sectors. The proposed institute is
envisaged to serve as a benchmark for training and education in the field of
petroleum technology covering the entire hydrocarbon value chain by
imparting quality education. It will also play a prominent role in promoting
and co-coordinating R&D in the domain of petroleum and natural gas. The
setting up of the proposed Rajiv Gandhi Institute of Petroleum Technology
(RGIPT) will thus go a long way in catering to the requirements of the
petroleum industry in the years to come.
1.1.391 “RGIPT Society” comprising of all the stakeholders is being registered to
enable early acquisition of land as waiting for the cabinet approval in this
regard may delay the whole process. The society will cease to exist as soon
as the proposed RGIPT Act comes into effect.
1.1.392 Out of the total estimated requirement of funds of Rs.416 crore for setting
up of RGIPT, it is estimated that Rs.174 crore would be required during the
XI Plan starting from the year 2009-10. While Rs.59.50 crore would be
required during 2009-10, Rs.58.5 crore and Rs.56 crore would be required
during 2010-11 and 2011-12 respectively. It is also estimated that Rs.191
crore would be required during XII Five Year Plan while Rs.51 crore would
be required during XIII Five Year Plan.
9.2 Servicing E&P Activities in India
1.1.393 E&P service providers have played a key role in enabling success for E&P
operators worldwide. Since the late 1990s, the balance in technology
development and intellectual property has clearly shifted towards service
providers. E&P companies leverage on latest technologies and specialist
services of oilfield service providers to reduce underground risks thereby
improving chances of success in E&P operations.
1.1.394 Efforts of Government of India to reduce dependence on expensive
imported crude oil, through increased domestic production has kick-started
Ministry of Petroleum and Natural Gas Page 104 of 164

8/3/2019 wg11_petro
http://slidepdf.com/reader/full/wg11petro 105/164
Report of the Working Group on Petroleum and Natural Gas for the XI Plan (2007 – 2012)
a number of initiatives like NELP, Open acreage policy, speculative
surveys, CBM policy to intensify exploration activities in the country.
Growth in such activities has led to multi-fold growth in demand for
technology and oilfield services. Demand for rigs have risen globally in
response to relatively high energy prices and the service companies are
operating at their fullest capacity. Oilfield services other than rig supply arealso facing similar situation. Availability of services in India is becoming
constrained and expensive.
1.1.395 E&P service providers are facing constraints in providing services to Indian
E&P companies, viz. high fiscal levies, complex and time consuming
regulatory processes, and weak infrastructure and logistics in providing
services efficiently. Only a few international service companies in the field
of drilling, seismic data acquisition, processing, mud logging etc. have
established themselves in India. This has left very limited choice of service
providers available to E&P companies with maximum unfavourable impact
on small operators in the current scenario.
1.1.396 The E&P industry is already facing the bottleneck of services on cost,
quality and timeliness front. Unless the country is prepared to facilitate
growth of service industry to be able to address to the above described
growth in service requirement, the development of E&P industry and energy
security would be compromised.
Ministry of Petroleum and Natural Gas Page 105 of 164

8/3/2019 wg11_petro
http://slidepdf.com/reader/full/wg11petro 106/164
Report of the Working Group on Petroleum and Natural Gas for the XI Plan (2007 – 2012)
10 Research & Development Focus during XIPlan
10.1 Internationalization of R&D
1.1.397 Internationalization of R&D is not a new phenomenon. When expanding
internationally, firms have always needed to adapt technologies locally to
sell successfully in host countries. However, it was traditionally the case
that R&D was reserved for the home countries of the Transnational
Companies (TNCs). Now a number of new features are emerging in the
internationalization process. TNCs are setting up R&D facilities outside
developed countries that go beyond adaptation for local markets.
Increasingly, in some developing and South-East European and CIS
countries, TNCs’ R&D is targeting global markets.
1.1.398 Till date, only a small number of developing countries and economies in
transition are participating in the process of R&D internationalization.However, some locations are now perceived as attractive for highly
complex R&D. This indicates that it is possible for countries to develop the
capabilities that are needed to connect with the global R&D systems. From
a host-country perspective, R&D internationalization opens the door not
only for the transfer of technology created elsewhere, but also for the
technology creation processes itself. This may enable some host countries
to strengthen their technological and innovation capabilities.
1.1.399 Innovative activity is essential for economic growth and development.
Moreover, sustainable economic development requires more than simply
“opening up” and waiting for new technologies to flow in. It demandscontinuous technological effort by domestic enterprises, along with
supportive government policies. With the increasing knowledge intensity of
production, the need to develop technological capabilities is growing.
Greater openness to trade and capital flows does not reduce the imperative
of local technological effort. On the contrary, liberalization, and the open
market environment associated with it, have made it necessary for firms —
be they large or small, in developed or developing countries — to acquire
the technological and innovative capabilities needed to become or stay
competitive.
10.2 Drivers of Global R&D.
1.1.400 Global R&D expenditure has grown rapidly over the past decade to reach
some $677 billion in 2002. The top ten countries by such expenditure, led
by the United States, account for more than four-fifths of the world total.
Only two developing countries (China and the Republic of Korea) feature
among the top ten. However, the share of developed countries fell from 97
percent in 1991 to 91 percent in 2002, while that of developing Asia rose
from 2 percent to 6 percent. A conservative estimate is that TNCs account
for close to half of global R&D expenditures, and at least two-thirds of
business R&D expenditures (estimated at $450 billion). In fact, the R&D
spending of some large TNCs is higher than that of many countries. Six
TNCs (Ford, Pfizer, DaimlerChrysler, Siemens, Toyota and General Motors)spent more than $5 billion on R&D in 2003. In comparison, among the
Ministry of Petroleum and Natural Gas Page 106 of 164

8/3/2019 wg11_petro
http://slidepdf.com/reader/full/wg11petro 107/164
Report of the Working Group on Petroleum and Natural Gas for the XI Plan (2007 – 2012)
developing economies, total R&D spending came close to, or exceeded, $5
billion only in Brazil, China, the Republic of Korea and Taiwan Province of
China. The world’s largest R&D spenders are concentrated in a few
industries, notably IT hardware, the automotive industry, pharmaceuticals
and biotechnology.
10.3 R&D in developing countries
1.1.401 The share of host developing countries in the global R&D systems of TNCs
is rising, but unevenly. Only a few economies have attracted the bulk of the
R&D activity. Developing Asia is the most dynamic recipient. In the case of
R&D expenditures by majority-owned foreign affiliates of United States
TNCs, for example, the share of developing Asia soared from 3 percent in
1994 to 10 percent in 2002. The increase was particularly noticeable for
China, Singapore, Hong Kong (China) and Malaysia.
1.1.402 Indian petroleum sector has graduated from a mere producer to designer of
new products and processes. This important sector is a strategic partner inthe eternal journey of the Indian industry into 21st Century. In order to be a
catalyst in the entire development cycle, R&D policy for petroleum sector
ought to be industry friendly. It must include attributes, which should
effectively inculcate the culture of academia-industry interactions, export
orientation, competitiveness apart from the development of human
resources.
1.1.403 R&D activities would require close interaction between industry and
research organisations. Involvement of the industry was considered
essential in the areas of selection/prioritisation of R&D projects, becoming
the stake holder for the R&D projects, project formulation and monitoring
the progress of the projects and implementation of the findings of R&D
works etc.
1.1.404 There has to be paradigm shift in the approach for carrying out R&D. As is
well known, R&D functions are very dynamic, and concepts and strategies
change very often. Without taking risk in R&D efforts no break-through will
be achieved.
1.1.405 India is spending around Rs.200-250 crore on R&D efforts in the
hydrocarbon sector having an annual turnover of around Rs.400,000 crore.
There is an urgent need to increase expenditure in R&D, keeping in
proportion to the turnover of the industry.
1.1.406 There is huge scope for improvement in the hydrocarbon sector through
R&D. Emphasis is required to encourage a culture of R&D in the oil
industry. The benefits of R&D could be multiplied by ensuring close
interaction between refining industry and research institutions. In the
industry, there is also scope for collaborative R&D.
1.1.407 Today Indian refining industry is facing new challenges which includes
surplus capacity, volatile refining margins, stringent fuel specifications,
emergence of alternatives such as fuel cells, hydrogen etc. Besides the
need for improving energy efficiency is increasingly becoming paramount.
There have been concerns over depleting crude oil resources and we ought
Ministry of Petroleum and Natural Gas Page 107 of 164

8/3/2019 wg11_petro
http://slidepdf.com/reader/full/wg11petro 108/164
Report of the Working Group on Petroleum and Natural Gas for the XI Plan (2007 – 2012)
to look at ways and means to enhance recovery rate while at the same time
look at alternative energy sources.
1.1.408 As the country takes its place in the global arena, India has to match world-
class technologies and indeed turn from consumers to providers of
technologies. A high oil price provides great incentive in coming up withalternatives. Further, it has been statistically proved that innovation is not
prerogative of large corporation but small companies could be equally
innovative. This provides scope for a comprehensive R & D program.
1.1.409 R&D could be tackled at two levels - (a) at the level of educational
institutes, universities and colleges and (b) at the industry level.
1.1.410 To build a culture of R&D in the educational institutes, encouragement is
needed to undertake basic research in the hydrocarbon sector on specified
areas relating to their fields through government grants. These grants
could come from OIDB. Institutes like IITs and engineering colleges could
take up research in their departments to further their knowledge base aswell.
1.1.411 At the corporate level, R&D thrust should be driven by business level
strategy i.e. in refining - technology to upgrade heavy petroleum residue to
clean fuels, alternative source of energy/technology which can replace
fossil fuel, process/catalyst improvement etc. and in the upstream-
improving extraction ratio, E&P evaluation etc.
1.1.412 Keeping this in view, following areas are identified for R&D in the
hydrocarbon sector during the XI Plan:
10.4 Exploration & Development
1.1.413 Most of the R&D activities carried out in India prior to the NELP regime
were undertaken by the two National Oil Companies i.e. ONGC & OIL. The
R&D activities included areas like Drilling, Production, Geological &
Geophysical, Reservoir Engineering etc and were specific to company’s
requirement. ONGC however, by virtue of its nation wide operations, did
carry out certain R&D activities in the national interest. This included
estimation of prognosticated resources for the entire country. In order to
supplement R&D efforts, DGH has also taken up R&D projects. Some of
the important R&D projects in the exploration & production sector are as
under:
Projects with Alberta Research Council (ARC): Review of Sedimentary Basins in
India to estimate the prognosticated reserves of Oil & Gas in India and establishment
of data repository in India.
Projects with Energy Resources & Development Unit (ERDU) of the Department of
Trade & Industries, UK are Study on Frontier Basins in India and suggesting
utilization of available technologies for optimizing the exploration of hydrocarbon
resources from these areas and Evaluation of Development plans involving new
technologies
Ministry of Petroleum and Natural Gas Page 108 of 164

8/3/2019 wg11_petro
http://slidepdf.com/reader/full/wg11petro 109/164
Report of the Working Group on Petroleum and Natural Gas for the XI Plan (2007 – 2012)
R&D Project for Gas Hydrates is also being carried out under the National Gas
Hydrate Programme (NGHP). The potential challenge for this project is to produce
gas from gas hydrates. Recently, DHG has collected core samples of gas hydrates in
offshore areas for resource assessments.
Underground coal gasification (UCG) is the in-situ gasification of coal in the seam.ONGC and GAIL have been exploring the possibility of exploiting coal gas by UCG
technology. By 2010-11, ONGC has plan to produce 2.7 MMSCMD of gas through
underground coal gasification process and envisages to produce about 2.99 BCM of
UCG gas during XI Five Year Plan period.
Oil Shale: Detailed mapping, extensive sampling to ascertain the distribution, quantity
and quality of oil shale in North Eastern part of India may be carried out for
assessment of oil shale resources in the region.
Coal Liquefaction Project by OIL: During the X Five Year Plan, Pre-Feasibility Study
(PFS) on Catalytic Two Stage Liquefaction (CTSL) technology of M/s Axens NA, USA
on coal liquefaction process has been completed. OIL has now earmarked aboutRs.250 Crore during XI plan period for commercialization of this process.
Research and Development in Exploration & Production Technology by ONGC
1.1.414 ONGC has institutionalised Research and Development in exploration and
production (E&P) and related sectors and established seven separate R&D
institutions to undertake specific activities in key areas of exploration,
drilling, reservoir management, production technology, ocean engineering,
safety and environment protection. Further, regional laboratories
established at various Assets and Basins of the ONGC support these
institutes.
1.1.415 ONGC R&D institutes are equipped with laboratories, computer processing
systems and computer workstations, and utilize specialized multi-
disciplinary expert teams. These institutes also leverage research through
international and national consortia, alliances and joint industry programs.
1.1.416 Significant benefits that are envisaged from these R&D efforts, inter alia,
include - delineation of lateral extension of proven play and accretion of
additional reserves, establishment of shallow and deeper new plays in
proven areas adding to new reserves, better reservoir delineation through
3D-3C and 4D seismic, online monitoring of proven producing fields
towards maximization of ultimate recovery while managing good health of the reservoir over its entire life cycle, improved oil recovery from the heavy
oil belt etc.
10.5 Natural Gas Sector
1.1.417 In the light of the expected growth in the natural gas sector during the XI
Plan, R&D and technology development and transfer efforts in the natural
gas sector assumes a very important dimension. Technologies in deepsea
exploration, gas transportation by sea, on-board re-gasification, gas to
liquids (GTL) are some of the major technologies which need active pursuit.
There are also other R&D projects that are planned by GAIL during the XI
Plan (2007-2012) :
Ministry of Petroleum and Natural Gas Page 109 of 164

8/3/2019 wg11_petro
http://slidepdf.com/reader/full/wg11petro 110/164
Report of the Working Group on Petroleum and Natural Gas for the XI Plan (2007 – 2012)
i. Pilot Plant for Separation of Light Hydrocarbon Mixtures by Adsorption
Process: GAIL, in collaboration with IIT-Kanpur, has developed an adsorption
process for separation of light hydrocarbon mixtures. A pilot plant is planned to be
set up at GAIL, Pata in association with EIL, R&D for undertaking field trials.
ii. Pilot Scale Testing of Coke Inhibitors for Gas Cracker Furnaces with IIT,Kanpur: GAIL has set up a pilot Gas Cracker at Petrochemical Plant, Pata for
testing coke inhibitors. Pilot scale experiments are partially complete. It is planned to
carry out more number of experiments for testing coke inhibitors.
iii. Underground Coal Gasification: General License Agreement with M/s Ergo
Exergy for UCG Technology: Underground Coal Gasification has been identified
as a thrust area. A General License Agreement with M/s. Ergo Exergy, Canada is
planned for Underground Coal Gasification (UCG) Technology till pilot stage to
produce syn-gas and subsequently power. The agreement shall be valid for 10
years.
iv. Development of Catalyst and Process for the Conversion of Waste Plastics,LPW to Value Added Liquid Fuels with IIP, Dehradun: GAIL and IIP, Dehradun
have signed a contract agreement in June 2006 for developing catalyst and process
for conversion of waste plastics (HDPE/LLDPE/LDPE waste) and Low Polymer Wax
to liquid fuels (BTX/Diesel/Gasoline). Completion time of the project is 2 years from
the date of signing of contract agreement.
v. Contribution to Hydrogen Corpus Fund set up by MOP&NG : Hydrogen Corpus
Fund has been set-up by MOP&NG with contributions from OIDB, IOC, ONGC,
HPCL, BPCL and GAIL for development of hydrogen based technologies. IOC R&D
is the overall coordinator of research work while OIDB is the fund manager. GAIL will
be undertaking R&D projects in hydrogen storage, transportation and dispensing.
vi. Development of APPS Package for Natural Gas Pipelines with IIT- Chennai: The
objective is to upgrade the developed leak detection package with IIT-Madras to a
complete Application Software (APPS) package for natural gas pipelines.
10.6 Refining Sector
1.1.418 The need for self reliance in the petroleum sector led to the creation of
engineering, design and R&D institutions like EIL and national laboratories
(IIP, NCL). Subsequently R&D centres were created in major Public sector
oil companies like IOCL, EIL, CPCL and BPCL to enhance the
technological knowledge base. Other institutions like Oil industrialDevelopment Board (OIDB), Centre for High Technology (CHT) were
created to ensure effective coordination and planning. All this contributed
significantly towards technological self reliance in the petroleum refining
industry. Research and development activities got a fillip in 1995 with
setting up of an expert committee under Dr. S. Ganguly to review the
technological gaps and make recommendations to make Indian refineries
more flexible, technologically competitive and productive. The committee
emphasized on close interaction between refining industry and research
institutions to improve their effectiveness.
Ministry of Petroleum and Natural Gas Page 110 of 164

8/3/2019 wg11_petro
http://slidepdf.com/reader/full/wg11petro 111/164
Report of the Working Group on Petroleum and Natural Gas for the XI Plan (2007 – 2012)
1.1.419 Keeping in view the future concerns of the downstream petroleum sector,
the areas of research identified in the eleventh five year plan are presented
below.
i. Coal to Clean Fuels (CTL): Coal Gasification offers a potential route of using
available resources more cleanly and efficiently. India having abundant reserves of coal need to have a serious look at coal gasification technology. The residue
material in our refineries such as coke, asphalt, pitch, visbroken tar etc could also be
potential candidates for gasification. Gasification of such material opens entire
range of opportunities for the refiners in terms of generating steam, power,
hydrogen, methanol, ethanol, DME, FT fuel etc.
ii. Gas to Liquid Technology (GTL): GTL involves Fischer Tropsch (FT) processes
which become viable at crude oil prices of above US $ 30/bbl. It may also be
possible to sell half of the products as high value chemicals, such as 1-alkenes, at
double of the liquid fuel price, which will make FT synthesis viable at even lower
crude oil prices. Various reports say GTL is profitable in the US$15 to 25 per bbl oil
(Brent) range. A key deterrent to the profitability of a new GTL plant is the capitalcost. However, number of studies have compared the full GTL & LNG trains and
found that modern units with US$ 20,000 - 30,000/bbl cost, GTL is competitive with
LNG. The research issues that need to be addressed are indigenisation of the
coal/coke gasification and gas liquefaction technology with stress on adaptability to
available feed stock, scale up and improvement in performance both with respect to
economics as well as environment. China is reported to have already gone ahead in
this direction by tying up with SASOL to establish coal to liquid fuel capabilities in
China.
iii. New Heavy Oil Upgrading Process: Heavy oils relatively have high carbon to
hydrogen ratio. Thus, one way of upgrading heavy oils is through “carbon rejection.”(E.g. delayed coking). This involves removing some carbon atoms, thereby leaving
the remaining oil with a higher ratio of hydrogen to carbon and, hence, a lighter oil.
Other way of upgrading heavy oils is through “hydrogen addition”. This involves
hydrogen addition, which increases hydrogen to carbon ratio and produces light oil.
Until now, hydrogen addition has lagged behind carbon rejection, accounting for an
estimated one-fifth of global residue upgrading capacity. However, with the advent of
a new heavy oil upgrading technology, hydrogen addition is poised to take a great
leap forward. By using proprietary mixing devices between hydrocarbons and
hydrogen, the process achieves high conversion rates at lower temperature and
pressure. The technology is based on catalytic hydro-cracking, which converts larger
molecules and other hetero atom molecules into naphthenic oil fractions, while
nitrogen, sulfur and heavy metals are reduced and/or eliminated. From an overallenergy viewpoint, one of the great virtues of the process is that it uses hydrogen in
an extremely efficient way. At current market prices, it adds at least $4 worth of
added value for each $1 of hydrogen utilised.
iv. Alternative Energy Source - Hydrogen as a Fuel/Fuel Cell : Hydrogen, a fuel for
the future can be produced from biomass using gasification, fermentation or aqueous
form reforming process. This can be taken up for further research and development.
IOC-R&D has been identified as nodal agency by MoP&NG for hydrogen research
within oil and gas sector in India which is focusing on use of H2-CNG blends in
Automotive Vehicles with carburettor system. Production of hydrogen from
alternative source rather than conventional production from fossil fuel need to be
Ministry of Petroleum and Natural Gas Page 111 of 164

8/3/2019 wg11_petro
http://slidepdf.com/reader/full/wg11petro 112/164
Report of the Working Group on Petroleum and Natural Gas for the XI Plan (2007 – 2012)
developed as the future road map to achieve hydrogen economy in the country.
Thus this project needs to be suitably taken up for development.
v. Petrochemicals and Polymers: R&D activities in the areas of poly-
olefins/petrochemicals are also needed to be initiated. Activities under this
programme will necessarily be to create facilities and expertise for long-rangeprocess/product development; catalyst design, development and evaluation,
development of different grades of polymers and copolymers depending upon
market demand etc. A product Application & Development Centre for polymers is
required to be set up at a suitable location. The main function of this centre would
be development of new products, forecasting emerging application, technical support
to customers / end users etc. Set up of such R&D Centre would certainly provide
impetus to the refinery and petrochemical integration.
vi. Catalyst and Technology Development for Gas oil Desulphurisation: De-Hydro
Desulphurisation (DHDS) catalyst developed by IOCL – R&D) is being scaled up.
IOCL is putting up new Diesel Hydro Treating (DHDT) at BRPL through their in-
house efforts and will use their own desulphurisation catalyst. In view of clean fuelrequirement due to implementation of BS-II, Euro-III and subsequently
implementation of Euro-IV specification in selected cities effective 2010 as per the
Auto Fuel Policy of GoI, this project shall be pursued further. Alternative
technologies for desulphurization of diesel and gasoline streams such as oxidative
desulphurization, adsorptive desulphurization and desulphurization through bio-
catalytic routes shall also be taken up.
vii. Future Fuels, Lubricants and Additives from Biomass and Non-Edible
Vegetable Oils: Processes from renewable resources such as non-edible vegetable
oil and biomass should be exploited to produce future fuels including gasoline, jet
fuels and diesel. Technology for fast pyrolysis of biomass should be developed withsubsequent upgrading of bio oil within the current refinery units
10.7 R&D – Way Forward
1.1.420 R&D Expenditure in Hydrocarbon Sector : India is spending around
Rs.300-370 Crores per annum on R&D efforts in the Hydrocarbon Sector.
Whereas, the annual turnover of only the oil PSU is more than Rs.500,000
crores. This is substantially lower compared to the research expenditure in
developed countries which spend about 1% of the turnover towards
research and development.
1.1.421 Mission Oriented Approach: Indian R&D has to compete more and morewith world-class technology provided by international licensors. Piecemeal
approach towards technological development instead of total value chain
integration has resulted in widening of the gaps in core technologies. The
need of the hour is to follow a mission-oriented approach on co-operative
basis in which nationally identified technology for development shall be
considered in totality including all aspects like catalyst development, design,
instrumentation, vendor development etc.
1.1.422 Involvement of Private Sector in R&D: Presently, most of the funding for
R&D comes from government or the public sector. Under the present
scenario when private sector is also playing a significant role in the growth
Ministry of Petroleum and Natural Gas Page 112 of 164

8/3/2019 wg11_petro
http://slidepdf.com/reader/full/wg11petro 113/164
Report of the Working Group on Petroleum and Natural Gas for the XI Plan (2007 – 2012)
of petroleum industry, we must ensure funding of research coming from
private sector also.
1.1.423 Incentives for usage of indigenous technology: Attractive incentives to
the first users of indigenous may help in curbing the tendency to go for
outright import of technology. The incentives can be in form of excise/taxbenefits, financial contribution from OIDB or a government corpus fund to
cover the commercial risk being taken by the first user.
Ministry of Petroleum and Natural Gas Page 113 of 164

8/3/2019 wg11_petro
http://slidepdf.com/reader/full/wg11petro 114/164
Report of the Working Group on Petroleum and Natural Gas for the XI Plan (2007 – 2012)
11 Investment Requirement and InfrastructureDevelopment
11.1 Exploration and Production Sector
Infrastructure Development
1.1.424 The main infrastructure development activities relating to the E&P sector
are building up process platforms, laying of pipelines, oil and gas collecting
stations and other surface facilities for evacuation of crude oil and natural
gas from field areas to delivery points.
1.1.425 Infrastructure development activities in E&P sector are highly dependent on
the location of oil and gas fields either onland or offshore, size of the
reservoir, prevailing prices of crude oil and natural gas as well as techno-
economic consideration of the development plan of the discoveries. Due to
the uncertainties involved in the E&P business, realistic assessment of infrastructural development activities cannot be made in advance.
1.1.426 After the implementation of NELP, operators now have freedom to market
oil and gas produced from their blocks. Under the provisions of NELP the
operator enjoys certain incentives such as cost recovery of admissible
expenditure as per production sharing contract and ‘nil’ customs duty on
import of select items. Recent oil and gas field development activities in the
KG basin and Rajasthan are currently being undertaken by the private
operators. Similarly, NOCs are also taking up the infrastructure
development projects. Some of the surface facilities developed by ONGC in
offshore and onland areas need replacement in a phased manner during XIPlan period.
1.1.427 With increased E&P activities, oilfield service companies have been
encouraged to establish their service centres in India taking advantage of
India’s growth in information technology (IT) sector as well as advantage of
manpower. During XI Plan period, establishment of E&P service provider
hubs can be envisaged.
1.1.428 Exploration companies have to invest heavily on development of surface
facilities. In this regard, Government also has the responsibility of
facilitating the operators by providing necessary permission and incentives
for infrastructure development. In view of encouraging investment in E&Pinfrastructure and as an imperative to realize substantial investment in E&P
sector, the Working Group supports demand for grant of infrastructure
status to the E&P sector.
Plan Outlay and Internal Resource Generation for NOCs
1.1.429 With the implementation of NELP and CBM Policy, exploration cost in the
country is directly financed by E&P companies. Government of India need
not incur any expenditure on E&P, at the same time Government is
benefited by way of getting profit petroleum share, royalty and other taxes,
once the commercial production commences from the licensed areas. Major
NOCs, viz. ONGC, OIL and ONGC Videsh Limited (OVL) are financing E&P
Ministry of Petroleum and Natural Gas Page 114 of 164

8/3/2019 wg11_petro
http://slidepdf.com/reader/full/wg11petro 115/164
Report of the Working Group on Petroleum and Natural Gas for the XI Plan (2007 – 2012)
activities through their own generated internal resources or financing
through loans.
1.1.430 The gap between internal resources generation and capital expenditure is
expected to be made up through extra-budgetary financing by way of loans
from Banks/Financial Institutions, carry forward surplus from previousperiod and increase in commodity prices.
1.1.431 The plan outlay and internal resources for domestic E&P activities to be
carried out by major NOCs is as under:
Table 10.1: Plan Outlay for Upstream NOCs for XI Plan
Plan Outlay (Rs. Crore) Internal Resources (Rs. Crores)
ONGC 82,670 70,525
OIL 10,176 10,176
OVL 58,674 29,971Total 15,1520 11,0672
1.1.432 OVL has a plan outlay of Rs. 58,674 crore for investment in overseas E&P
activities. The internal resource generation by OVL will be around Rs.
29,972 crore. The gap between plan outlay and internal resources
generation is expected to be made up through loan provided by ONGC and
international financing.
1.1.433 In addition to above, investment by Private/JV companies on E&P may be
around US$9 billion during XI Plan period. This investment may increasefurther in event of discoveries and development plans undertaken thereafter
by private/foreign companies.
11.2 Refining and Marketing Sector
1.1.434 India’s oil markets are expected to grow, albeit relatively slow, in future.
Large investments are required to meet the demand for oil products. The
level of investments required is quite high and in the current circumstances
where the oil PSUs equitably share the burden of high oil prices, the public
sector companies would be stretched to meet the investment requirements
through their internal and extra budgetary resources. It is estimated that the
refining and marketing companies in the public sector would require aninvestment of about Rs. 92,000 crore in refining, marketing and associated
infrastructure under their Plan expenditure.
LPG Import Infrastructure
1.1.435 The LPG demand projections for the XI Plan are given at Annexure VII.
The LPG demand, both for base case and upper case, are the same.
Years Demand (TMTPA)
2007-08 10,853
2008-09 11,246
Ministry of Petroleum and Natural Gas Page 115 of 164

8/3/2019 wg11_petro
http://slidepdf.com/reader/full/wg11petro 116/164
Report of the Working Group on Petroleum and Natural Gas for the XI Plan (2007 – 2012)
2009-10 11,683
2010-11 12,183
2011-12 12,770
1.1.436 The indigenous LPG production by the terminal year of the XI Plan periodi.e. 2011-12 would be about 12,762 TMTPA, out of which availability from
RIL would be about 1,600 TMTPA. The indigenous availability projections
include availability to the tune of about 1,740 TMTPA from the three
grassroots refineries at Paradip, Bina and Bhatinda proposed under the XI
Plan period. Therefore, the overall availability of LPG in the country by the
end of XI plan is projected to be almost equal to the projected demand.
1.1.437 However, in a market driven economy, RIL and other private companies
may have their own strategy for marketing of LPG and the possibility of the
same not being available to OMCs cannot be ruled out. Under such a
scenario, it may become pertinent to analyse the LPG import infrastructure
and to assess whether it is adequate to support the increased import
requirement during the XI Plan period and beyond.
1.1.438 In addition to the existing LPG import facilities, following additional LPG
import facilities are proposed / under construction :
Cavern Storage of 60 TMT at Vishakapatnam by M/s. SALPG expected to be
commissioned by July, 2007. With its commissioning, while the tankage at
Vishakapatnam will improve, the throughput capacity is likely to remain same due to
logistics considerations.
LPG import terminal at Ennore by IOC with storage of 30 TMT and rated capacity of 600 TMTPA. This facility is expected to be commissioned during 2008-09.
1.1.439 With commissioning of the above facilit ies, the total LPG import
infrastructure for PSU oil companies by 2008-09 will be as under :
LPG ImportFacility
Tankage(TMT)
Rated capacity(TMTPA)
Max. achievablecapacity (TMTPA)
Kandla 30 600 1000
Mangalore 16 600 1200
Ratnagiri 20 200 300
Tuticorin 4 100 200
Vishakapatnam 60 600 600
Haldia 34 600 900
Ennore 30 600 900
TOTAL 194 3300 5100
1.1.440 From the above table, it may be analysed that the present and proposed
LPG import infrastructure is adequate for handling LPG import requirement
of the country by the terminal year of the XI Plan period considering that the
entire production of indigenous LPG including at RIL, Jamnagar is available
Ministry of Petroleum and Natural Gas Page 116 of 164
8/3/2019 wg11_petro
http://slidepdf.com/reader/full/wg11petro 117/164
Report of the Working Group on Petroleum and Natural Gas for the XI Plan (2007 – 2012)
for domestic use. The LPG import capacity will be adequate even without
the production at RIL, Jamnagar as well as non availability of LPG from the
three new refineries at Paradip, Bina and Bhatinda.
1.1.441 Considering the Regional balance of supply demand during the terminal
year of the XI plan, following scenario emerges :
Region Demand (TMT) Availability (TMT) Variance
North West 7532 7689 (+) 157
East 1567 2072 (+) 505
South 3671 3001 (-) 670
Total 12770 12762 (-) 8
1.1.442 It can be seen from the above that whereas the overall availability almost
matches with the demand projections, regional imbalances with respect toavailability v/s demand are projected with deficit in Southern Region and
surplus availability in the East. This situation also will require operation of
LPG import terminals to facilitate coastal movements to South from West
and East. Further, in case RIL product is not available and commissioning
of new refineries is delayed, LPG imports to the tune of about 3,400 TMTPA
will be required.
1.1.443 As brought out at para 11.2.6 above, the LPG import capacity in the country
after commissioning of LPG import terminals at Vizag and Ennore will be
about 3,300 TMTPA with maximum achievable capacity of about 5,100
TMTPA. Therefore, LPG import capacity will be adequate to meet the
import requirement by the end of XI Plan even with RIL product not being
available. However, in such an event, following constraints may be
encountered by the OMCs:
At present around 2 MMTPA is pumped in the Jamnagar-Loni LPG pipeline to meet
the deficit in Northern Region. Out of this quantity, around 1.7 MMTPA is pumped
from RIL, Jamnagar and balance around 0.3 MMTPA from Kandla. The maximum
pipeline pumping capacity ex-Kandla is presently about 0.7 MMTPA. Therefore in the
event of product not being available from RIL, Jamnagar, the pipeline movement will
be adversely affected necessitating movement of product to Northern Region plants
by road and therefore, incurring higher cost. To avoid such a situation, capacity
augmentation of Kandla Samakhiali Pipeline section upto 1.5 MMTPA on Jamnagar –Loni LPG pipeline needs to be taken up. This would facilitate imports at Kandla to
meet the deficit in Northern Region through pipeline.
Utilisation of some of the import locations like Ratnagiri, Haldia and Vizag beyond
their rated capacity will not be economical from logistics considerations.
Port Infrastructure to Support POL Traffic
1.1.444 The Department of Shipping usually works out the port-wise volume of
traffic for the Plan period. However the following points need to be
considered while carrying out any projection in respect of POL related traffic
at the ports.
Ministry of Petroleum and Natural Gas Page 117 of 164

8/3/2019 wg11_petro
http://slidepdf.com/reader/full/wg11petro 118/164
Report of the Working Group on Petroleum and Natural Gas for the XI Plan (2007 – 2012)
It is expected that POL traffic through the Kandla port would increase after the
refinery projects under implementation in the State of Gujarat are complete and the
fertilizer industry switches from Naphtha to gas as feedstock in line with their fertilizer
policy. In that eventuality exports of POL through Kandla port will increase.
Similarly, traffic projections at Paradip, Haldia, Ennore and Chennai would require tobe in line with the refinery expansion projects planned in the country during the XI
Plan period. There may be diversion of traffic between Paradip and Haldia
depending upon the progress in implementation of the refinery projects.
While planning up-gradation of ports, the requirement of night navigation/berthing
facility should be reviewed in detail. The provisioning for night navigation and
adequate berthing facility would reduce the turn-around time and would lead to more
efficient use of port facilities.
Intensive dredging programme may be embarked upon at ports in order to
maintain/improve draft in navigation channels and port berthing facilities so that
ships of larger size can be handled at the ports.
11.3 Natural Gas Sector
1.1.445 With the enactment of the PNGRB Act 2006 and the expected setting up of
a Regulator during 2006-07, the natural gas industry is poised for a major
growth. This is supported by the supply side expectations from both
domestic and international sources, as described in the earlier chapter on
Supply Outlook. Under the normal and optimistic scenario, the total supply
from all sources would be 191.42 MMSCMD and 285.42 MMSCMD
respectively by the terminal year of the XI Plan, as compared to the current
level of 110.89 MMSCMD. This projected trend in supply supported by a
strong demand would require parallel investments in the building of re-
gasification and pipeline transmission and distribution Infrastructure, in
order to facilitate faster monetization of gas reserves, to ensure smooth flow
of LNG supplies into the country and to reach a wide spectrum of
consumers across the country.
1.1.446 The key growth drivers for the Indian gas market are gas pricing,
infrastructure, regulation and end-use sector reforms. Gas pricing is moving
towards a market determined pricing mechanism and Indian gas market is
aligning with the global trends. Regulatory framework is being put in place.
As regards the end-use sector reforms, the same are taking place at
varying paces in different sectors.
1.1.447 The gas supply options for the Indian market are numerous and the
relevant ones in the context of the XI Plan are as below:
INDIAN GAS SECTOR: SUPPLY OPTIONS
New Domestic Discoveries (East Coast)
Offshore Finds (Reliance, GSPC)
Transnational Pipeline Imports (North –West and North-East)
Iran - Pakistan -India
Turkmenistan – Afghanistan – Pakistan –India
Ministry of Petroleum and Natural Gas Page 118 of 164
8/3/2019 wg11_petro
http://slidepdf.com/reader/full/wg11petro 119/164
Report of the Working Group on Petroleum and Natural Gas for the XI Plan (2007 – 2012)
Myanmar –India
Additional LNG Imports (West Coast)
Dabhol
Kochi
Dahej Expansion
Mangalore
Supply–Demand to be Driven by Key Growth Drivers
1.1.448 On the LNG front, the expected re-gasification investments would be driven
by the expansion of the Dahej LNG terminal from the current 5 MMTPA
capacity to 10 MMTPA by 2009-10. The Dabhol LNG terminal capacity
build-up is expected to be 1.2 MMTPA and 2.1 MMTPA in 2007-08 and
2008-09 respectively and reach the full capacity of 5 MMTPA by 2009-10.The investments in Kochi Terminal of PLL would be in full swing in the first
three years of the XI Plan and the terminal is expected to be operational in
2010-11 at a capacity of 2.5 MMTPA which would grow to 5 MMTPA by the
terminal year of the XI Plan. The Mangalore terminal is expected to be
partially commissioned by the terminal year with an initial supply of 1.25
MMTPA. These plans translate into a total investment of Rs.9,220 crore
during the XI plan.
Ministry of Petroleum and Natural Gas Page 119 of 164

8/3/2019 wg11_petro
http://slidepdf.com/reader/full/wg11petro 120/164
Report of the Working Group on Petroleum and Natural Gas for the XI Plan (2007 – 2012)
1.1.449 On the investment in transmission pipeline front, there are a number of
plans by different players in the industry. GAIL has drawn up major plans
for creation of the inter-state transmission grid in line with the emergence of
gas sources on the west and east coasts of the country. The total
investments of GAIL for creation of pipeline infrastructure in the XI Plan is
expected to be in the order of Rs.11,120 crore. This primarily includesongoing projects like Dahej–Uran Pipeline (DUPL), Vijaipur–Kota Pipeline
(VKPL), Jagoti– Pitampur Pipeline (JPPL) and Dabhol–Panvel Pipeline
(DPPL). The planned investments include the Jagdispur–Haldia Pipeline
(JHPL), Dadri–Nangal Pipeline (DNPL), Kochi–Coimbatore–Bangalore
Pipeline, Mangalore–Bangalore–Chennai Pipeline, and link pipelines to the
envisaged transnational pipelines. Besides, there are other private players
who have obtained Right of Usage (ROUs) and planned some inter-state
pipelines. Such pipelines include Kakinada–Uran–Ahmedabad Pipeline,
Hyderabad–Goa Pipeline, Kakinada–Bhopal–Jamnagar Pipeline and
Kakinada–Cuttack–Haldia Pipeline and Vijaywada–Chennai Pipeline. The
total expected investment in these inter-state pipelines is about Rs.21,000
crore.
1.1.450 In terms of the distribution pipelines, there are very good prospects of
expansion and many players are expected to participate in the growth of
this sector. From the current coverage of 10 cities, the city gas distribution
network is expected to grow to about 40 cities all over the country in line
with the expected emergence of supply sources. The total investment in
this sector is expected to be in the order of Rs.9,000 crore in the XI Plan.
1.1.451 Putting all these investments together, the gas sector is predicted to see a
total investment of about Rs.40,000 crore during the XI Plan period with gas
transmission pipelines taking a major share of about 53 percent, while LNG
re-gas terminals and city gas distribution infrastructure taking a share of 24
percent and 23 percent respectively. (These investments do not includeupstream investments in E&P). The details of the year-wise projected
Ministry of Petroleum and Natural Gas Page 120 of 164
BHATINDA
I r a n - P a k - I n d i a P i p e
T u r k - A f g - P a k - I n d i a P i p e l i n e
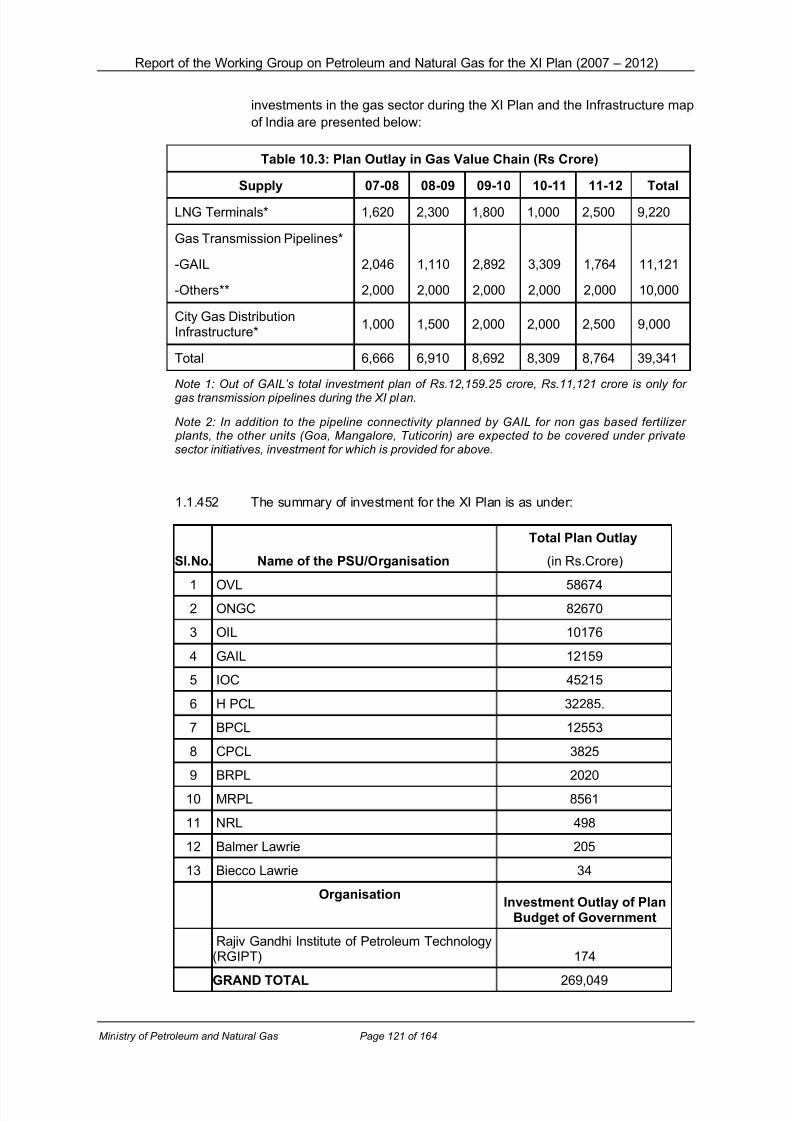
8/3/2019 wg11_petro
http://slidepdf.com/reader/full/wg11petro 121/164
Report of the Working Group on Petroleum and Natural Gas for the XI Plan (2007 – 2012)
investments in the gas sector during the XI Plan and the Infrastructure map
of India are presented below:
Table 10.3: Plan Outlay in Gas Value Chain (Rs Crore)
Supply 07-08 08-09 09-10 10-11 11-12 Total
LNG Terminals* 1,620 2,300 1,800 1,000 2,500 9,220
Gas Transmission Pipelines*
-GAIL
-Others**
2,046
2,000
1,110
2,000
2,892
2,000
3,309
2,000
1,764
2,000
11,121
10,000
City Gas DistributionInfrastructure*
1,000 1,500 2,000 2,000 2,500 9,000
Total 6,666 6,910 8,692 8,309 8,764 39,341
Note 1: Out of GAIL’s total investment plan of Rs.12,159.25 crore, Rs.11,121 crore is only for gas transmission pipelines during the XI plan.
Note 2: In addition to the pipeline connectivity planned by GAIL for non gas based fertilizer plants, the other units (Goa, Mangalore, Tuticorin) are expected to be covered under privatesector initiatives, investment for which is provided for above.
1.1.452 The summary of investment for the XI Plan is as under:
Sl.No. Name of the PSU/Organisation
Total Plan Outlay
(in Rs.Crore)
1 OVL 586742 ONGC 82670
3 OIL 10176
4 GAIL 12159
5 IOC 45215
6 H PCL 32285.
7 BPCL 12553
8 CPCL 3825
9 BRPL 2020
10 MRPL 8561
11 NRL 498
12 Balmer Lawrie 205
13 Biecco Lawrie 34
OrganisationInvestment Outlay of Plan
Budget of Government
Rajiv Gandhi Institute of Petroleum Technology(RGIPT) 174
GRAND TOTAL 269,049
Ministry of Petroleum and Natural Gas Page 121 of 164

8/3/2019 wg11_petro
http://slidepdf.com/reader/full/wg11petro 122/164
Report of the Working Group on Petroleum and Natural Gas for the XI Plan (2007 – 2012)
1.1.453 Government has proposed to set up RGPIT, an institute of excellence in the
petroleum sector to cater to the educational and training requirements of all
segments of the petroleum industry. Out of the total estimated requirement
of funds of Rs.416 crore for setting up of RGPIT, it is estimated that Rs.174
crore would be required during the XI Plan period starting from the year
2009-10.
1.1.454 Activity-wise break-up of the XI Plan expenditure by Oil PSUs is as follows:
XI Plan Break Up Rs Crore
Upstream 159,161
Refining 81,545
Gas 13,079
Marketing 6,080
Crude Pipelines/Crude Oil Terminal 4,230
R&D (including in upstream) 1,418
Others including RGIPT 3,536
TOTAL 269,049
1.1.455 The above investments are based on the information received from various
companies and does not include investment in the oil and gas sector by theprivate sector. However, these investments may undergo some change at
the time of finalisation of the Annual Five Year Plans.
Ministry of Petroleum and Natural Gas Page 122 of 164

8/3/2019 wg11_petro
http://slidepdf.com/reader/full/wg11petro 123/164
Report of the Working Group on Petroleum and Natural Gas for the XI Plan (2007 – 2012)
12 Conclusions & Suggestions
12.1 Exploration & Production Sector
i. Opening up of 80 percent of India’s sedimentary basinal area for exploration.
ii. Crude oil production of 206.76 MMT in XI Plan, which is 23 percent higher than the
likely achievement of the X Plan.
iii. Natural gas production of 224.56 BCM in XI Plan, which is 41 percent higher than the
likely achievement of X Plan.
iv. Pursue extensive exploration in non-producing and frontier basins for knowledge
building and new discoveries, including in deep-water offshore areas.
v. Establishing a ‘Knowledge Hub’ in India.
vi. Undertaking 100 percent speculative survey in the course of the XI Plan.
vii. Strengthening of DGH and upstream regulation in oil and gas sector.
viii. Faster development of oil and gas discoveries.
ix. Development of isolated and marginal fields and creation of surface facilities.
x. Provide infrastructure status to E&P companies and competitive fiscal terms to attract
significant investments in the sector.
xi. Optimize recovery from ageing oil and gas fields.
xii. Continue to offer more CBM exploration blocks.
xiii. Efforts to obtain methane gas through in-situ gasification of coal.
xiv. Continuation of R&D efforts to exploit the potential of Gas Hydrates and Oil Shale.
xv. Availability of trained manpower and expertise in the E&P sector.
xvi. Continue to acquire acreages abroad for exploration as well as production
12.2 Natural Gas Sector
i. The Indian gas market is poised for growth. The pace of growth would be determined
by the increase in supply of natural gas, investments in creation of related
infrastructure and in the downstream sectors, viz, power, fertilizer, city gas
distribution, etc.
ii. There are a number of gas demand projections based on economic and end use
methodologies. All such projections indicate robust growth in gas demand over the
XI Plan period. Demand is projected to rise from 179 MMSCMD in 2007-08 to 279
MMSCMD by the year 2011-12.
Ministry of Petroleum and Natural Gas Page 123 of 164

8/3/2019 wg11_petro
http://slidepdf.com/reader/full/wg11petro 124/164
Report of the Working Group on Petroleum and Natural Gas for the XI Plan (2007 – 2012)
iii. The domestic supply of gas during the XI Plan period is expected to rise sharply as
compared to the X Plan period mainly due to the recent discoveries in the K-G Basin.
The domestic gas supply figure estimates are 80 MMSCMD in 2007-08 going up to
202 MMSCMD by 2011-12 as an optimistic scenario.
iv. Successful outcome in some of the NELP blocks would further augment the domesticgas supply in the XI Plan period.
v. Import of LNG which commenced in 2004 for the first time is projected to increase to
23.75 MMTPA (83.12 MMSCMD) during the XI Plan period with new LNG
regasification terminals being set up in the country.
vi. Over the long term, gas imports as LNG and through transnational pipelines, as and
when they materialise, would play the role of bridging the gap between demand and
supply of natural gas in the country.
vii. Gas sector would require large investments in setting up of terminals, pipeline
infrastructure, processing facilities and city gas networks. It has been projected thataround Rs. 40,000 crore would be required during the XI Plan period by the natural
gas sector.
Major Gas Sector Challenges
1.1.456 The planned growth in the XI Plan would require that the government and
the gas sector players identify and meet the challenges in terms of policy as
well as strategic initiatives. The gas sector challenges are envisaged in the
following areas :
Gas pricing
Technology
Import substitution
Sector policy developments
Creation of infrastructure
Institutional support structure
1.1.457 Gas Pricing: While gas pricing was a major issue during the X Plan period,
currently it is now fairly established that gas/LNG is a competitive
alternative vis-à-vis other fuels. It is important that the price acceptance is
established across sectors including power. End use sector reforms and
competitiveness must go hand in hand with gas sector development.
1.1.458 Technology: Energy security being an important issue for the country, there
is a need to step up efforts on the technology front so that viable
alternatives are established. Promising technologies like gas from deep-
sea, gas from coal, gas hydrates and gas storage in the upstream side,
CNG by ships and on-board LNG re-gasification in the mid-stream side and
Distributed Power/Combined Heat and Power (CHP) in the downstream
side are some of the important and potential technologies that need to bepursued during the XI Plan period.
Ministry of Petroleum and Natural Gas Page 124 of 164

8/3/2019 wg11_petro
http://slidepdf.com/reader/full/wg11petro 125/164
Report of the Working Group on Petroleum and Natural Gas for the XI Plan (2007 – 2012)
1.1.459 Gas Imports: Import dependence to bridge the gap in demand and supply is
expected to continue in the XI plan. Transnational pipelines pose a number
of geo-political challenges. There is also a need for an international charter
to address legal/regulatory issues in such cross border transactions. In the
case of LNG, while the experience of Indian market has been fairly good,
integration with global pricing regime and management of risks(market/price/political) would be an important challenge for companies in all
the cross-border options.
1.1.460 Sector Policy: A concrete sector policy needs to take shape during the first
year of the XI plan. The Petroleum and Natural Gas Regulatory Board
needs to address the gas pipeline policy and the city gas distribution policy
which would provide the necessary thrust for triggering gas sector
investments. At the same time, as the country expands the infrastructure
across the country, there would be a need to develop both technical and
safety standards – related to transmission and distribution pipelines/other
related infrastructure. In addition, government policy to provide
infrastructure status to gas sector projects and declared goods status for natural gas can give the necessary fillip to growth of the gas sector.
1.1.461 Creating Infrastructure: Gas sector poses unique challenges as every
investment needs a parallel and complementary investment across the gas
value chain. There is a need to create upfront infrastructure while at the
same time ensuring co-ordinated development across the entire gas value
chain. Financing and structuring of deals in such large investments is also a
major requirement. At the same, developing the indigenous manufacturing
base in turbines, CNG kits, compressors, gas based automobiles etc would
have major bearing on the sector development.
1.1.462 Institutional support infrastructure: To support such a major growth in the
sector, there would be a need to develop a strong training infrastructure to
produce trained manpower.
12.3 Refining Sector
1.1.463 Competitive Market: In the oil sector currently there are mainly four
companies in the marketing of products namely IOC, BPC, HPC and RIL
besides players like Essar and Shell. The Herfindahl-Hirschman Index
(HHI) for India with the existing companies is higher than the desired
number of HHI. However, with the pricing becoming free the market share
will align itself in some desired ratios, which is expected to bring HHI to areasonable level. Most competitive markets have five strong players. Thus,
the current structure of the oil sector could continue. In a suitable
environment, the current structure will deliver a competitive market. This
could be reviewed at the time of appraisal of the XI Plan.
1.1.464 In addition, the Government could do the following to achieve higher
efficiency and service standards:
At the National Level
i. Encourage exports from the country compelling refineries to compete globally, meet
global standards and meet requisite quality specifications.
Ministry of Petroleum and Natural Gas Page 125 of 164

8/3/2019 wg11_petro
http://slidepdf.com/reader/full/wg11petro 126/164
Report of the Working Group on Petroleum and Natural Gas for the XI Plan (2007 – 2012)
ii. Create a domestic petroleum product market through a commodity exchange.
iii. Amalgamate individual state markets in one nation-wide market with unified state
taxes, remove state tax anomalies, provide level playing to domestic production vis-à-
vis direct imports (which can be imported without state taxes), and introduce a
uniform VAT which provides full set off for local levies such as octroi and entry tax.
At the Corporate Level
i. Benchmark operations with global best practices adopted by world’s top refineries
and make suitable improvements.
ii. Ensure inter-PSU competition, particularly at the retail level. It could be contended
that this action would lead to duplication and wastage of resources. But then
competition always does that, for instance, the airlines industry where infrastructure
has been duplicated. Duplication of assets is a natural corollary to competition.
iii. Exponential expansion of e-commerce transactions, which promotes competition andenhances welfare by reducing transaction and search costs.
1.1.465 Demand of Petroleum Products: The demand of petroleum products have
been estimated in two scenarios – Business as Usual or Base Case and
Upper Case. In Base Case, the consumption in the terminal year of the XI
Plan i.e. in 2011-12 is estimated at 132 MMT indicating a growth of 2.9
percent per annum. In the Upper case, the demand is estimated to grow by
4.45 percent to 142 MMT. It may be mentioned that since the oil prices are
expected to remain at a high level in future, alternate sources of energy are
likely to become increasingly economically viable. In our projections impact
of such alternatives has not been considered and the actual materialization
may be different from the one projected now.
1.1.466 The refineries need to maximize production of LPG, LOBS and bitumen to
an extent, from the national standpoint. Further caution needs to be
exercised while converting bottoms to lighter products as large deficits in
industrial fuels is projected. The bottom upgradation plan needs to be
realigned to local demand. Even globally, as noted elsewhere in the report,
large deficit is predicted for FO and LSHS.
1.1.467 Refining capacity additions: The actual refining capacity additions would
depend upon several factors including domestic demand, duty structure
which would impact import and export possibilities, refining margin, andexport potential for the products. However, in view of the likely surplus
scenario, the companies depending upon the commercial viability of the
project may review their projects and capacity additions. We could expect
the refining capacity to turn out to be in the range of 190 MMT to 200 MMT
leaving a scope of exports in the range of 45 MMT to 55 MMT.
1.1.468 Auto Fuel Policy: The Auto Fuel Policy identified the need for controlling
emissions through improved I&M practices, vehicle retiring policies, better
traffic management, stricter PUC, etc. However, till date limited progress
has been made without having mandated any practice. There is an urgent
need to introduce these policies.
Ministry of Petroleum and Natural Gas Page 126 of 164

8/3/2019 wg11_petro
http://slidepdf.com/reader/full/wg11petro 127/164
Report of the Working Group on Petroleum and Natural Gas for the XI Plan (2007 – 2012)
1.1.469 R&D focus: To build a culture of R&D in our educational institutes we may
encourage them to do basic research in the hydrocarbon sector on
specified areas relating to their fields through Government grants. These
grants could come from OIDB. Institutes like IITs and engineering colleges
could take up research in their departments to further their knowledge base
as well.
1.1.470 At the corporate level, R&D thrust should be driven by business level
strategy i.e. in refining - technology to upgrade heavy petroleum residue to
clean fuels, alternative source of energy/technology which can replace
fossil fuel, process/catalyst improvement etc. and in the upstream-
improving extraction ratio, E&P evaluation etc.
12.4 Marketing Sector
1.1.471 Existing Policies to Continue: The oil sector has been deregulated since
April 2002, with the dismantling of APM, and currently there are many
players including private oil companies in the marketing of petrol/diesel. Themajor existing policies like grant of marketing rights for transportation fuels,
setting up ROs in remote and far flung areas etc need to continue.
1.1.472 Steps to Control Adulteration: Adulteration is a menace, which needs to be
tackled by all concerned through technological and other interventions.
Various steps to curb adulteration have been initiated. These include
introduction of tamper-proof locks, automation of retail outlets, monitoring
the movement of tank-trucks through GPS, introduction of marker system
for adulterants like kerosene, third party certification of retail outlets, etc.
12.5 Others
1.1.473 Setting up of Rajiv Gandhi Institute of Petroleum Technology (RGIPT):
Investment in the development of qualified human capital is essential if the
targets set forth in ‘Hydrocarbon Vision 2025’ are to be achieved. The gap
between the availability and requirement of trained manpower is likely to be
substantive unless concerted efforts are made to increase the number of
quality institutions to impart the desired education/training. The existing
institutes namely Indian School of Mining (ISM), Dhanbad, Maharashtra
Institute of Technology (MIT) Pune, Indian Institute of Technology (IIT),
Kharagpur, and Banaras Hindu University (BHU) etc. are unable to meet
the burgeoning requirements of the petroleum sector.
1.1.474 The proposed RGIPT at Peeparpur in Sultanpur District of Uttar Pradesh,
as an institute of excellence in the petroleum sector, will provide the
manpower to meet the requirement in India and globally.
Ministry of Petroleum and Natural Gas Page 127 of 164

8/3/2019 wg11_petro
http://slidepdf.com/reader/full/wg11petro 128/164
Report of the Working Group on Petroleum and Natural Gas for the XI Plan (2007 – 2012)
13 Annexure
13.1 Annexure I – Constitution of the Working Group
C O N S T I T U T I O N O F T H E W O R K I N G G R O U P
No. M-13026/9/2006-Pet.
Government of India
Planning Commission
(Power & Energy Division)
Yojana Bhawan, Sansad Marg,
New Delhi, the 20th April, 2006.
ORDER
Subject: Constitution of a Working Group on Petroleum & Natural Gas Sector for
formulation of the XI Plan (2007- 2012).
It has been decided to constitute a Working Group on Petroleum & Natural Gas in the context
of preparation of XI Plan (2007-2012). The Composition and Terms of Reference of the Group will be
as follows:
A. Composition:
Secretary, Ministry of Petroleum & Natural Gas – Chairman.
Members:
Representatives of the Ministries
1. Adviser (Energy), Planning Commission
2. Representative of Ministry of Surface Transport
3. Representative of Department of Economic Affairs, Ministry of Finance
4. Representative of the Department of Industrial Policy and Promotion
5. Representative of Ministry of Power
6. Representative of Department of Chemicals & Petro-Chemicals
Ministry of Petroleum and Natural Gas Page 128 of 164

8/3/2019 wg11_petro
http://slidepdf.com/reader/full/wg11petro 129/164
Report of the Working Group on Petroleum and Natural Gas for the XI Plan (2007 – 2012)
7. Representative of Department of Fertilizers
8. Representative of Ministry of Environment & Forest
9. Representative of Department of Commerce
10. Joint Adviser (Petroleum), Planning Commission
11. Joint Secretary and Financial Adviser, Ministry of Petroleum & Natural Gas – Member-Secretary
PSUs
1. Chairman & Managing Director, Oil and Natural Gas Corporation Ltd.
2. Chairman & Managing Director, Oil India Ltd.
3. Chairman & Managing Director, Indian Oil Corporation Ltd.
4. Chairman & Managing Director, Bharat Petroleum Corporation Ltd.
5. Chairman & Managing Director, Hindustan Petroleum Corporation Ltd.
6. Chairman & Managing Director, Gas Authority of India Ltd.
Private Sector Representatives
1. Representative(s) of CII, FICCI, ASSOCHAM and TERI - one each
2. Representative of Reliance Industries Limited.
B. Terms of Reference
I. The terms of reference of the Working Group will be as under:
1. To review the IEP Report and to suggest measures to operationalise its recommendations during
the XI Plan Period.
2. To review the recommendations of Dr. C. Rangarajan’s Committee on Pricing and Taxation of
Petroleum Products and to suggest measures to make them operational during the XI Plan.
3. To review the recommendations of Dr. V. Krishnamurty’s report on Restructuring of Petroleum
Sector and to suggest measures to make them operational during the XI Plan.
4. To review the likely achievement during the X Plan period in meeting the targets set for
exploration, production of crude oil & natural gas, addition to refining capacity and investments.
An analysis of the reasons for shortfalls, if any, may be highlighted.
5. To recommend an industry structure that would enhance number of players, promote competition,
provide a consistent and transparent pricing regime and raise conversion, transportation, & end
use efficiency.
6. To review the subsidy structure in the Petroleum & Natural Gas Sector and to suggest measures
to make them transparent and targeted.
Ministry of Petroleum and Natural Gas Page 129 of 164
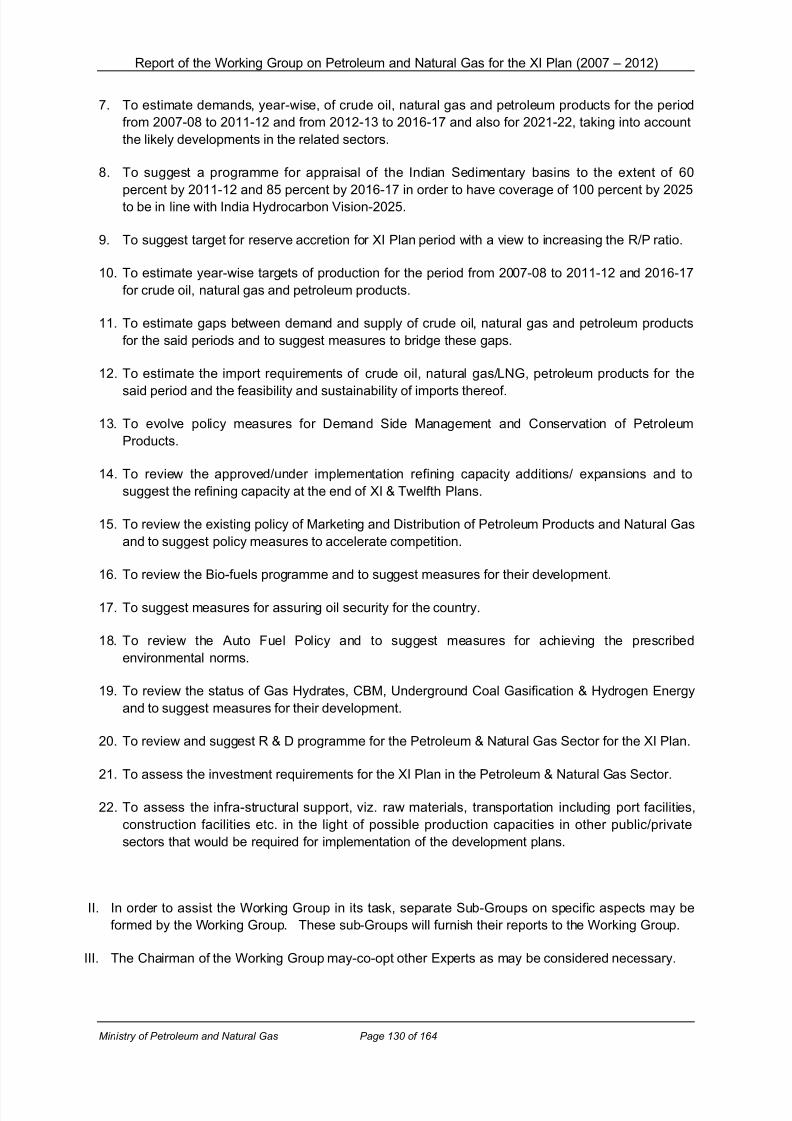
8/3/2019 wg11_petro
http://slidepdf.com/reader/full/wg11petro 130/164
Report of the Working Group on Petroleum and Natural Gas for the XI Plan (2007 – 2012)
7. To estimate demands, year-wise, of crude oil, natural gas and petroleum products for the period
from 2007-08 to 2011-12 and from 2012-13 to 2016-17 and also for 2021-22, taking into account
the likely developments in the related sectors.
8. To suggest a programme for appraisal of the Indian Sedimentary basins to the extent of 60
percent by 2011-12 and 85 percent by 2016-17 in order to have coverage of 100 percent by 2025to be in line with India Hydrocarbon Vision-2025.
9. To suggest target for reserve accretion for XI Plan period with a view to increasing the R/P ratio.
10. To estimate year-wise targets of production for the period from 2007-08 to 2011-12 and 2016-17
for crude oil, natural gas and petroleum products.
11. To estimate gaps between demand and supply of crude oil, natural gas and petroleum products
for the said periods and to suggest measures to bridge these gaps.
12. To estimate the import requirements of crude oil, natural gas/LNG, petroleum products for the
said period and the feasibility and sustainability of imports thereof.
13. To evolve policy measures for Demand Side Management and Conservation of Petroleum
Products.
14. To review the approved/under implementation refining capacity additions/ expansions and to
suggest the refining capacity at the end of XI & Twelfth Plans.
15. To review the existing policy of Marketing and Distribution of Petroleum Products and Natural Gas
and to suggest policy measures to accelerate competition.
16. To review the Bio-fuels programme and to suggest measures for their development.
17. To suggest measures for assuring oil security for the country.
18. To review the Auto Fuel Policy and to suggest measures for achieving the prescribed
environmental norms.
19. To review the status of Gas Hydrates, CBM, Underground Coal Gasification & Hydrogen Energy
and to suggest measures for their development.
20. To review and suggest R & D programme for the Petroleum & Natural Gas Sector for the XI Plan.
21. To assess the investment requirements for the XI Plan in the Petroleum & Natural Gas Sector.
22. To assess the infra-structural support, viz. raw materials, transportation including port facilities,
construction facilities etc. in the light of possible production capacities in other public/private
sectors that would be required for implementation of the development plans.
II. In order to assist the Working Group in its task, separate Sub-Groups on specific aspects may be
formed by the Working Group. These sub-Groups will furnish their reports to the Working Group.
III. The Chairman of the Working Group may-co-opt other Experts as may be considered necessary.
Ministry of Petroleum and Natural Gas Page 130 of 164
8/3/2019 wg11_petro
http://slidepdf.com/reader/full/wg11petro 131/164
Report of the Working Group on Petroleum and Natural Gas for the XI Plan (2007 – 2012)
IV. The Working Group will submit its report to the Planning Commission latest by the 30th September,
2006.
V. Non-official members of the Working Group shall be entitled to payment of TA/DA from Planning
Commission as per SR 190 (a). Official members will be paid TA/DA by their respective
Departments/Organizations as per the rules of entitlement applicable to them.
VI. The name(s) of representative(s) of various organizations as per the above composition may be
communicated to the Member-Secretary of the Working Group under intimation to Shri Surya P.
Sethi, Adviser (Energy), Planning Commission.
VII. Shri R.C. Mahajan, Joint Adviser (Petroleum), Planning Commission, Room No. 218, Yojana
Bhavan, Tel No. 23096743, will be the Nodal Officer for this Working Group in the Planning
Commission and further query/correspondence in this regard may be made with him.
(K.K.Chhabra)
Under Secretary to the Government of India
To
Chairman & Members (including Member-Secretary) of the Working Group.
Ministry of Petroleum and Natural Gas Page 131 of 164

8/3/2019 wg11_petro
http://slidepdf.com/reader/full/wg11petro 132/164
Report of the Working Group on Petroleum and Natural Gas for the XI Plan (2007 – 2012)
Copy for information to:
1. P.S. to Deputy Chairman/MOS (Plg.)/Members/Member-Secretary, Planning Commission.
2. All Principal Advisers/ Advisers/JS (SP & Adm.)
3. Prime Ministers’ Office, South Block, New Delhi
4. Information Officer, Planning Commission
5. For general information in Yojana Bhawan through e-mail
(K.K.Chhabra)
Under Secretary to the Government of India
Ministry of Petroleum and Natural Gas Page 132 of 164

8/3/2019 wg11_petro
http://slidepdf.com/reader/full/wg11petro 133/164
Report of the Working Group on Petroleum and Natural Gas for the XI Plan (2007 – 2012)
13.2 Annexure II (a) – Constitution of Working Sub Groups
C O N S T I T U T I O N O F W O R K I N G S U B G R O U P S
It was decided to form following Working Sub-Groups:-
1. Working Sub Group on Demand: Members
a. Mr. V P Joy - Director b. Mr. Vijay Sethi - Convenor c. Others – Members from all OMCs, private sector, Ministry of Surface Transport,
Ministry of Railway, GAIL and Petronet LNG TORs
a. Item 6, 7, 8, 9 and relevant portion of 13.
2. Working Sub Group on Production: Members
a. Mr. Ravi Capoor - Director b. Mr. A R Tamankar - Convenor c. Others – Members from all refineries including stand alone refineries and those of
private sector, TORs
a. Item 6, 7, 8, 9 and relevant portion of 13.
3. Working Sub Group on R&D: Members
a. Dr. K.S. Balaraman - Executive Director(CHT)b. Mr. R K Malhotra - Convenor c. Others – R&D Groups of Refineries/OMCs and Rep. of EIL
TORsa. Item 11, 12 and relevant portion of 13.
4. Working Sub Group on Project Implementation: Members
a. Director (Projects) - EILb. Head of MMC (EIL) - Convenor c. Others – Members from all OMCs/Refineries as desired
TORs
a. Item 4 and 10.
5. Working Sub Group on Restructuring Petroleum Sector: Members
a. Mr. Ravi Capoor - Director b. Inputs from Petrofed, FICCI, and CII.
TORsa. Item 3.
6. Working Sub Group on Pricing:
Ministry of Petroleum and Natural Gas Page 133 of 164

8/3/2019 wg11_petro
http://slidepdf.com/reader/full/wg11petro 134/164
Report of the Working Group on Petroleum and Natural Gas for the XI Plan (2007 – 2012)
Membersa. Mr. V P Joy - Director b. Mr. Ram Singh - Convenor c. Representative from Deptt. of Economic Affairs.
TORsa. Item 2 and 5
7. Working Sub Group on Energy Policy: Members
a. Mr. A K Arora, DG(Petrofed) - Convenor b. Representative from FICCIc. Representative from CII
TORsa. Item 1
The Terms of Reference of the Working Sub Groups are as under :
Terms Of Reference of Sub Group On Refining
1. To review the IEP Report and to suggest measures to operationalise itsrecommendations during the XI Plan Period.
2. To review the recommendations of Dr. C. Rangarajan’s Committee on Pricing andTaxation of Petroleum Products and to suggest measures to make them operational duringthe XI Plan.
3. To review the recommendations of Dr. V. Krishnamurty’s report on Restructuring of Petroleum Sector and to suggest measures to make them operational during the XI Plan.
4. To review the likely achievement during the X Plan period in meeting the targets set for refining capacity and investments. Any analysis of the reasons for shortfalls, if any, may behighlighted.
5. To review the subsidy structure in the Petroleum and Natural Gas Sector and to suggestmeasures to make them transparent and targeted.
6. To estimate demands, year-wise, of crude oil and petroleum products for the period from2007-08 to 2011-12 and 2012-13 to 2016-17 and also for 2021-22, taking into account thelikely developments in the related sectors.
7. To estimate year-wise targets of production for the period from 2007-08 to 2011-12 and2016-17 for crude oil and petroleum products.
8. To estimate gaps between demand and supply of crude oil and petroleum products for
the said periods and to suggest measures to bridge these gaps.
Ministry of Petroleum and Natural Gas Page 134 of 164

8/3/2019 wg11_petro
http://slidepdf.com/reader/full/wg11petro 135/164
Report of the Working Group on Petroleum and Natural Gas for the XI Plan (2007 – 2012)
9. To estimate the import requirements of crude oil and petroleum products for the saidperiod and the feasibility and sustainability of imports thereof.
10. To review the approved/under implementation refining capacity additions/expansions andto suggest the refining capacity at the end of XI & Twelfth Plans.
11. To review the Auto Fuel Policy and to suggest measures for achieving the prescribedenvironmental norms.
12. To review and suggest R&D programme for the Petroleum and Natural Gas Sector for theXI Plan.
13. To assess the investment requirements for the XI Plan in the Petroleum Sector.
Ministry of Petroleum and Natural Gas Page 135 of 164

8/3/2019 wg11_petro
http://slidepdf.com/reader/full/wg11petro 136/164
Report of the Working Group on Petroleum and Natural Gas for the XI Plan (2007 – 2012)
Annexure-II(b)
13.3 Annexure II (b) –Sub Group on E&P
Subject : Sub-Group on Exploration & Production of Hydrocarbons to assist Working
Group on Petroleum & Natural Gas for XI Plan
It has been decided to constitute a Sub-Group on ‘Exploration & Production of Hydrocarbons’
to assist Working Group on Petroleum & Natural Gas in the context of preparation of the XI Five Year
Plan with the composition as indicated below:
Convener - JS (Exploration)
Members
A Representatives from Ministries:
Ministry of Petroleum & Natural Gas
i) DG, DGHii) Director (E I)iii) Director (E II) - Member Secretary
b) Ministry of Finance - One
c) Ministry of Environment & Forest - One
d) Ministry of Industry - One
e) Planning Commission - One
f) Ministry of Coal - One
(for Coal Bed Methane)
B Representative of PPAC & OISD - One each
C Public Sector Undertaking (PSUs)
a) ONGC, Director (Exploration)/Director (Operations)/ Director (Finance)b) OIL – Director (Exploration & Dev.)/ Director (Operations)c) GAIL – Director (Project)/ Director (Planning)d) OVL – Managing Director e) EIL – One Representativef) GSPC – One representative
D Private Sector and Others
a) Representative of CIIb) Representative of Reliance Industries Limitedc) Representative of Cairn Energy India Pty Ltd.d) Representative of British Gas
Ministry of Petroleum and Natural Gas Page 136 of 164

8/3/2019 wg11_petro
http://slidepdf.com/reader/full/wg11petro 137/164
Report of the Working Group on Petroleum and Natural Gas for the XI Plan (2007 – 2012)
13.4 Annexure II (c) –Sub Group on NG and Marketing
Subject: Sub-Group on Natural gas and Marketing to assist Working Group on
Petroleum & Natural Gas for XI Plan
1. Working Sub Group on Marketing and Distribution of Natural Gas:
Membersa. Mr. Ajay Tyagi - Joint Secretary(M)b. Mr. Swami Singh - Director(NG) - Convenor c. Others – Members from Department of Expenditure, Department of Economic
Affairs, Department of Road Transport and Highways, Department of Commerce,Department of Chemicals & Petrochemicals, Department of Fertilizers, GAIL,ONGC, OIL, TERI, Gas Industry Group and Petrofed
2. Working Sub Group on Marketing & Distribution of Petroleum Products:
Membersa. Mr. Ajay Tyagi - Joint Secretary(M)b. Mr. Pramod Nangia - Director(M)c. Mr. K. Rajeswara Rao - Addl. Director(M), PPAC - Convenor d. Others – Members from all OMCs, private sector, Department of Expenditure,
Department of Economic Affairs, Department of Road Transport and Highways,Department of Commerce, Department of Chemicals & Petrochemicals,Department of Fertilizers, PCRA, RIL, ASSOCHAM, FICCI, CII and Petrofed
Terms Of Reference of Sub Group On Marketing & Distribution of Natural Gas:
1. To review likely achievement during the X Plan period in meeting the targets set for production of Natural Gas. An analysis of the reasons for shortfall, if any, may behighlighted.
2. To review pricing structure of Natural Gas and to suggest measures to make them moretransparent and market determined.
3. To estimate demands, year-wise, of Natural Gas for the period from 2007-08 to 2011-12and from 2012-13 to 2016-17 and also for 2021-22, taking into account the likelydevelopments in the related sectors.
4. To estimate year-wise targets of production for the period from 2007-08 to 2011-12 and2016-17 for Natural Gas.
5. To estimate gaps between demand and supply of Natural Gas for the said periods and tosuggest measures to bridge these gaps.
6. To estimate the import requirements of Natural Gas/LNG for the said period and the
feasibility and sustainability of imports thereof.7. To review the existing policy of Marketing and Distribution of Natural Gas and to suggestpolicy measures to accelerate competition.
8. To assess the investment requirements for the XI Plan in the down-stream Natural GasSector.
Ministry of Petroleum and Natural Gas Page 137 of 164

8/3/2019 wg11_petro
http://slidepdf.com/reader/full/wg11petro 138/164
Report of the Working Group on Petroleum and Natural Gas for the XI Plan (2007 – 2012)
Terms of Reference of Sub Group on Marketing & Distribution of Natural Gas:
1. To evolve policy measures for Demand Side Management and Conservation of Petroleum Products.
2. To review the existing policy of Marketing and Distribution of Petroleum Products and tosuggest policy measures to accelerate competition.
To review the Bio-fuels programme and to suggest measures for their development.
Ministry of Petroleum and Natural Gas Page 138 of 164

8/3/2019 wg11_petro
http://slidepdf.com/reader/full/wg11petro 139/164
Report of the Working Group on Petroleum and Natural Gas for the XI Plan (2007 – 2012)
13.5 Annexure III - Energy Policy in Asian Economies
E N E R G Y P O L I C Y I N A S I A N E C O N O M I E S
We have examined experiences in Japan, a developed country with virtually no energy resource and
China, now the second largest energy consumer and a developing country with some similarities with
India.
A comparison of available resources with Japan and China is as follows:
Energy Resources available with Japan & China and their Consumption in 200410
Particulars Japan China
Reserves R/P Ratio Reserves R/P Ratio
Oil in Billion Tons Nil Nil 2.3 13.4 yrs
Gas in TCM Nil Nil 2.23 54.7 yrs
Coal in Billion Tons 0.36 * 114.50 59 yrs
Oil Consumption in MMT 242 309
Gas Consumption in BCM 72 39
Coal Consumption in
MTOE
121 957
* As negligible production, RP ratio is in excess of 500 years
Japan
Japan's energy policy objectives are summarised as the “3 Es”:
Energy security,
Economic development and
Environmental sustainability.
Japan’s objective is to achieve the three goals simultaneously, although they often contradict one
another and the government recognizes the possibility of trade-offs between them. Details of Japans
efforts are at the Attachment.
The changes in energy mix may be seen in the table below:
10Source: BP Statistical Review of World Energy, 2005
Ministry of Petroleum and Natural Gas Page 139 of 164

8/3/2019 wg11_petro
http://slidepdf.com/reader/full/wg11petro 140/164
Report of the Working Group on Petroleum and Natural Gas for the XI Plan (2007 – 2012)
Particulars 1980 2002 Growth
Percent
MTOE Percent MTOE Percent
Coal 59.6 17.2 100.0 19.3 2.4
Oil 235.7 68.0 255.5 49.4 0.4
NG 21.4 6.2 66.4 12.8 5.3
Nuclear 21.5 6.2 76.9 14.9 6.0
Others 8.4 2.4 18.1 3.5 3.6
Total 346.5 100 516.9 100 1.8
Through conscious policy, Japan has been able to reduce energy consumption through conservation,
reduce oil consumption through diversification, increase use of natural gas over coal (Japan is deficitin both resources) due to favourable impact on environment, increase nuclear energy and maximize
renewable resources. As a result of their efforts energy mix of Japan has changed. Oil has been
diversified into nuclear, natural gas and coal.
China11
China has recently finalized its XI Five-year plan. The central tenants relating to energy policy are:
Place priority on energy conservation: targeted decrease in energy consumption by 20percent by 2010
Primary reliance on Coal: pursue logical and reasoned development, improve recovery andextraction rates, reduce impact on environment, promote reorganization of the coal industry,create some coal companies with production capacity of 100 MT/year, standardizetechnologies for high efficient and clean burning of coal, develop coal to liquid technologies,promote use of clean coal and use low grade coal for electricity generation.
Diversification of energy sources
Electricity – Aggressive development: Develop high efficiency and environmentfriendly large scale thermal power plants, promote clean coal based electricitygeneration, moderately develop natural gas based plants and aggressively promote
nuclear power generation through construction of 1 million KW class reactors
Oil and Natural Gas – Accelerated development: Intensively exploit off shore areas,major oil & gas basins and new onshore areas, promote exploration of coal bedmethane, oil shale, oil sands, methane hydrates and other non conventional types of oil/gas, create large integrated bases for refining particularly in areas of highconsumption, less efficient refineries would be closed
Renewable energy – Develop greatly: Promote renewable energyproduction/consumption through favourable fiscal policies, tax structures, investmentpolicies and a compulsory market share for renewable energy, greatly enhance windpower generation by the construction of thirdly 100,000 kW class wind farms,increase the production of biomass energy, bio-ethanol and bio-diesel and promote
11Source: China’s “XI Five-Year Guidelines” with Focus on Energy Policy, Yue Zhang, IEEJ, April 2006
Ministry of Petroleum and Natural Gas Page 140 of 164

8/3/2019 wg11_petro
http://slidepdf.com/reader/full/wg11petro 141/164
Report of the Working Group on Petroleum and Natural Gas for the XI Plan (2007 – 2012)
the use in the production of solar energy, geothermal energy and ocean power generation.
Thus, it (may be seen that| both the countries have devised a long-term plan keeping in mind the
available resources with |he country. Besides, wherever resources are deficit, efforts arm being madeto reduce dependence on them. China, due its similarities with India, offers better inputs for
developing our energy policy and their specific targets can also help in setting direction for our
country. It is interesting to note that it is placing reliance on coal as primary source of energy while at
the same time encouraging efficiency, and energy conservation.
Ministry of Petroleum and Natural Gas Page 141 of 164

8/3/2019 wg11_petro
http://slidepdf.com/reader/full/wg11petro 142/164
Report of the Working Group on Petroleum and Natural Gas for the XI Plan (2007 – 2012)
Attachment
Japan: Policy Initiatives12
Japan is the fourth largest energy consumer in the world. In 2001, total primary energy supply (TPES)
was 520.7 Mtoe, up by 19 percent from 1990 levels. Japan’s dependence on oil has decreased from
58 percent in 1990 to 49.2 percent in 2001. In 2000, coal accounted for 19.2 percent, followed by
nuclear (16 percent), natural gas (12.4 percent), hydro (1.4 percent), combustible renewable and
wastes (1 percent), geothermal energy (0.6 percent) and other renewable (0.2 percent). Oil use was
replaced mainly by natural gas whose share increased from 9.9 percent, nuclear power from 12.1
percent and coal from 16.9 percent.
Every 3-4 years, the government publishes the Long-Term Energy Supply and Demand Outlook, the
first having been published in 1967 and the latest (10th Outlook) in July 2001. The Outlook shows the
forecast impact of energy policies and measures in place, the difference between their impact and the
various objectives as well as how to tackle the difference. The Outlooks are prepared by the Advisory
Committee for Natural Resources and Energy whose role is to advise the Ministry of Economy, Trade
and Industry
Japan’s principal challenge in the energy sector is supply vulnerability because it is an archipelago
and lacks domestic energy resources. Several measures to ensure energy security have, therefore,
been strongly promoted since the first and second oil crisis, and at present include the following key
policies:
Energy efficiency: Implemented by a Law Concerning the Rational Use of Energy (energyconservation standards and the so-called Top-Runner Programme); financial support toenergy efficiency (promoting Home and Business Energy Management Systems, taxincentives for the introduction of energy-efficient equipment, etc.); and informationdissemination.
Diversification of energy supply sources: Implemented by further diversification away fromoil; fuel-switching in the power sector (from coal to natural gas); further use of natural gas,nuclear power and renewable (renewable portfolio standard); and energy R&D.
Development of resources: Through development of methane hydrates. Originally Japanhoped to increase “Japanese-flag crude oil” to such a level that it accounts for approximately30 percent of Japan’s total crude oil imports. JNOC13 was set up nearly 40 years ago to findand secure gas and oil supplies for resource-poor Japan, only to bleed 720 billion yen ($6.9billion) of red ink in mostly dry wells in 305 projects across the globe14. Under theseconditions, Japan decided in August 2000 to withdraw the long-term target of increasing theJapanese-developed crude oil to account for 30 percent of Japan’s total crude oil imports and
worked out a new policy measure aimed at establishing a core oil development company or companies that can maintain and expand its business on its own to assure stable and efficientoil supply.
Oil stockpiling and emergency policies: Implemented by Petroleum Stockpiling Law;Petroleum Supply and Demand Optimisation Law and IEA’s Co-ordinated EmergencyResponse Measure.
International co-operation for enhancing energy security: Implemented by enhancingenergy security through IEA, APEC, ASEAN+3 and bilateral contacts, in particular with Asian
12Source: Energy Policies of IEA Countries, JAPAN, 2003 Review
13The government provided financial assistance through the government-owned Japan National Oil Corp. (JNOC) to private oil & gas exploration and development
projects overseas in the form of equity capital investment, loans and guaranteeing debts.
14Daily times, March 20, 2005: Japan National Oil Corp to be disbanded.
Ministry of Petroleum and Natural Gas Page 142 of 164

8/3/2019 wg11_petro
http://slidepdf.com/reader/full/wg11petro 143/164
Report of the Working Group on Petroleum and Natural Gas for the XI Plan (2007 – 2012)
energy-consuming countries; and promotion of cooperation with oil and gas-producingcountries.
Ministry of Petroleum and Natural Gas Page 143 of 164

8/3/2019 wg11_petro
http://slidepdf.com/reader/full/wg11petro 144/164
Report of the Working Group on Petroleum and Natural Gas for the XI Plan (2007 – 2012)
13.6 Annexure IV - Herfindahl-Hirschman Index (HHI)
H E R F I N D A H L - H I R S C H M A N I N D E X ( H H I )
A competitive market is one with a sufficiently large number of firms competing with one another that
prices are kept at levels that reflect social costs. Since market power usually leads to high prices
and/or low quality, and often stifles future innovations, it hurts consumers and should be restricted.
There are numerous ways to obtain market power. If there are only a few firms in a market, so
concentration is high, then each firm will have some market power to charge a high price. When the
market is highly concentrated, it is also easier for firms to coordinate their pricing behaviour so a high
level of prices can be maintained. Market power may also exist even with many small firms in the
market, when there is a dominant firm. A common way of obtaining more market power is through
mergers and acquisitions.
In merger analysis, the next step would be to calculate market shares of the parties involved and the
concentration level of the market. When measuring concentration, the Herfindahl-Hirschman Index
(HHI) is often used by the US antitrust agencies. The HHI is the sum of the squared market shares of
all the participants. For example, if there are three firms in the market, with market shares 50 percent,30 percent, and 20 percent, respectively, then the HHI is: 50^2+30^2+20^2=3,800. As a result, a
monopoly market has an HHI equal to 10,000. A competitive market has an HHI that is low. Unlike
other indexes (for example, the four -firm concentration ratio), the HHI assigns greater weights to the
market shares of the larger firms, in accord with their relative importance in the market.
A market is characterized as unconcentrated (HHI below 1,000), moderately concentrated (HHI
between 1,000 and 1,800), and highly concentrated (HHI above 1,800). To get a sense of these
thresholds, an HHI of 1,000 corresponds to ten firms of equal size, and an HHI of 1,800 corresponds
to five and half firms of equal size. Although the exact numerical cut-off does not have precise
justifications, it provides a broad framework for further analysis. In practice, the US antitrust
authorities change in the HHI from the pre-merger level is very dramatic and there is other evidence
that suggests that a post-merger price increase is likely. Such analysis linking market concentration to
market power is often called structural analysis. Antitrust analysis has evolved over time with the
development of economic theories and empirical methods.
Ministry of Petroleum and Natural Gas Page 144 of 164

8/3/2019 wg11_petro
http://slidepdf.com/reader/full/wg11petro 145/164
Report of the Working Group on Petroleum and Natural Gas for the XI Plan (2007 – 2012)
13.7 Annexure V - Year Wise, Product Wise Comparison of Actual & X Plan Projections
Year wise Comparison of X Plan Demand
(Figs. In TMT)
PRODUCT 02-03 03-04 04-05 05-06 2006-07
X Plan Actual Var (+/-) X Plan Actual Var (+/-) X Plan Actual Var (+/-) X Plan Actual
Var
(+/-) X Plan OE Var (+/-)
LPG 8776 8351 -425.1 9528 9305 -223 10310 10245 -65 11,123 10304 -819 11,966 10494 -819
NAPHTHA 10823 11962 1138.8 10723 11868 1145 8668 13993 5325 9,128 12262 3134 9,128 8983 3134
MS 7620 7570 -50.1 8202 7897 -305 8813 8251 -563 9,419 8648 -771 10,067 11333 -771
ATF 2370 2271 -99.1 2445 2484 39 2523 2813 290 2,605 3298 693 2,691 3630 693
SKO 11000 10404 -595.8 11000 10230 -770 11000 9395 -1605 11,000 9359 -1641 11,000 9414 -1641
HSD 42146 36645 -5501.3 44508 37074 -7434 46966 39650 -7316 49,555 40152 -9403 52,324 40583 -9403
LDO 1500 2064 563.6 1500 1619 119 1500 1477 -23 1,500 885 -615 1,500 905 -615
FO/LSHS 13184 12738 -445.9 13520 12945 -575 13876 13540 -336 14,253 12733 -1520 14,653 2421 -1520
BITUME 2808 2986 178.4 2892 3373 481 2979 3340 361 3,069 3515 446 3,161 13454 446
LUBES 1202 1250 48.1 1245 1427 182 1283 1336 53 1,342 2104 762 1,386 3592 762
OTHERS 5668 7885 2217.0 5668 9529 3861 5668 7596 1928 5,668 8658 2990 5,668 9225 2990
TOTAL 107097 104126 -2971.4 111231 107751 -3480 113586 111634 -1952 118662 111920 -6742 123544 114034 -6742
Ministry of Petroleum and Natural Gas Page 145 of 164

8/3/2019 wg11_petro
http://slidepdf.com/reader/full/wg11petro 146/164
Report of the Working Group on Petroleum and Natural Gas for the XI Plan (2007 – 2012)
13.8 Annexure VI - Demand Projections by Various Agencies
EIA – Energy Information Administration, USA BAU – Business as Usual
IEA – International Energy Agency BCS – Best Case Scenario
IHV – India Hydrocarbon Vision 2025
As the available projections by the various agencies are for different years, the same have been interpolated or extrapolated to bring them to common yearsand have been converted into MMscmd for the purpose of comparison.
Ministry of Petroleum and Natural Gas Page 146 of 164

8/3/2019 wg11_petro
http://slidepdf.com/reader/full/wg11petro 147/164
Report of the Working Group on Petroleum and Natural Gas for the XI Plan (2007 – 2012)
13.9 Annexure VII - Demand For Petroleum Products During The XI Plan & Beyond
D E M A N D F O R P E T R O L E U M P R O D U C T S D U R I N G T H E X I P L A N & B E Y O N D
Year-wise/product-wise demand Projections for XI Plan; both under Base Case and Upper Case are
as under:
Summary of XI Plan Demand Projections
Base Case TMT
PRODUCTS 2006-07 2007-08 2008-09 2009-10 2010-11 2011-12 XI Plan
(OE) CARG
LPG 10494 10853 11246 11683 12183 12770 4.0
MS 8983 9377 9828 10242 10667 11097 4.3
NAPHTHA/NGL 11333 10425 9517 10441 11138 11588 0.4
ATF 3630 4335 4774 5187 5569 5907 10.2
SKO 9414 8830 8510 8222 7962 7729 -3.9
HSD 40583 42210 43797 45328 46871 48419 3.6
LDO 905 951 951 849 786 569 -8.9
LUBES 2421 2453 2487 2521 2556 2592 1.4
FO/LSHS 13454 13601 13959 12806 13327 13874 0.6
BITUMEN 3592 3772 3961 4159 4367 4585 5.0
PET. COKE 4736 4736 4736 4736 5210 5731 3.9
OTHERS 4489 4893 5333 5813 6337 6907 9.0
TOTAL 114034 116437 119098 121987 126973 131767 2.93
Upper Case
PRODUCTS 2006-07 2007-08 2008-09 2009-10 2010-11 2011-12 XI Plan
(OE) CARG
LPG 10494 10853 11246 11683 12183 12770 4.0
MS 8983 9330 9775 10442 11197 11605 5.3
Ministry of Petroleum and Natural Gas Page 147 of 164

8/3/2019 wg11_petro
http://slidepdf.com/reader/full/wg11petro 148/164
Report of the Working Group on Petroleum and Natural Gas for the XI Plan (2007 – 2012)
NAPHTHA/NGL 11333 10077 9517 10441 11138 11588 0.4
ATF 3630 4356 5227 6011 6612 7274 14.9
SKO 9414 9414 9414 9414 9414 9414 0.0
HSD 40583 42374 43818 45751 47952 49776 4.2
LDO 905 951 951 849 786 569 -8.9
LUBES 2421 2453 2487 2521 2556 2592 1.4
FO/LSHS 13454 13754 14250 13611 14277 14982 2.2
BITUMEN 3592 3808 4036 4279 4535 4808 6.0
PET. COKE 4736 4736 4736 4736 7210 7411 9.4
OTHERS 4489 5449 6494 8052 8734 9006 14.9
TOTAL 114034 117555 121951 127789 136593 141793 4.45
Ministry of Petroleum and Natural Gas Page 148 of 164

8/3/2019 wg11_petro
http://slidepdf.com/reader/full/wg11petro 149/164
Report of the Working Group on Petroleum and Natural Gas for the XI Plan (2007 – 2012)
13.10 Annexure VIII - Potential for Reducing Oil Demand Through Vehicle Fuel Economy
Improvement
P O T E N T I A L F O R R E D U C I N G O I L D E M A N D T H R O U G H V E H I C L E F U E L E C O N O M Y I M P R O V E M E N T
1 5
Cars, trucks and other transport vehicles account for about 75 percent of road transportation fuel use
(petrol and diesel) and about 1/3rd of total consumption of petroleum products in the India.
Unlike the low prospects for increasing domestic oil production, there are very good prospects for
reducing oil demand and cutting future oil imports by raising the efficiency of our vehicles. A wide
range of technologies are technically proven and readily available, including engine modifications
such as variable valve control or friction reduction, weight reduction, better engine and transmission
controls, aerodynamic drag reduction, and tire improvements. Many of these technologies are already
used to some degree in other countries but only in a relatively small fraction of new vehicles.
Widespread adoption of these commercially available measures could improve the average fuel
economy of new vehicles by 40–65 percent within a decade.
Technologies for Passenger Vehicle Fuel Economy Improvement
Technology Fuel Economy (Percentage)* Improvement
Weight reduction 10–30
Aerodynamics 4–10
Variable valve control 12–16
Direct injection spark ignition 5–23
Other engine refinements 5–10
Improved transmissions 6–14
Hybrid powertrain—near and mid-term 40–80
Hybrid powertrain—longer term 100–200
*Improvements relative to US average mid-1990s passenger vehicle at 25 MPG.
In addition these evolutionary improvements, vehicle manufacturers around the world are developingand starting to manufacture innovative hybrid electric vehicles. These vehicles feature a relatively
small internal combustion engine along with an electric drivetrain including an electric motor and
battery for storing electrical energy. The hybrid electric vehicles produced so far exhibit 50–85 percent
greater fuel efficiency compared to typical new cars in their size class, although not all of this
improvement is due to the hybrid drivetrain. Improving fuel economy does add to the first cost of a
vehicle. But the value of the fuel savings usually more than offsets this first cost premium.
Policies for Improving the Efficiency of New Vehicles
15 Adapted from STRATEGIES FOR REDUCING OIL IMPORTS: EXPANDING OIL PRODUCTION VS. INCREASING VEHICLE EFFICIENCY, Howard Geller, April
2001, American Council for an Energy-Efficient Economy
Ministry of Petroleum and Natural Gas Page 149 of 164

8/3/2019 wg11_petro
http://slidepdf.com/reader/full/wg11petro 150/164
Report of the Working Group on Petroleum and Natural Gas for the XI Plan (2007 – 2012)
A combination of policies including: tougher regulations; financial incentives; continued R&D; and
consumer education and marketing should be adopted to ensure that vehicles sold during the next
few decades are “gas sippers” rather than “gas guzzlers.”
Tough Fuel Economy Standards
Tougher average fuel economy standards are essential for significantly increasing new vehicle
efficiency across the fleet.
Current fuel economy standards should be averaged for each category and set. Thereafter they may
be increased by 8 percent per year during the XI Plan and 5 percent beyond the end of XI Plan. The
average fuel economy of all new cars, commercial vehicles and two wheelers would increase by
about 45 percent by 2012. Vehicle manufacturers will protest and say “it can’t be done” or “it will cost
a fortune,” but would comply as experience in the US indicates when the original US CAFE standards
were debated. But the car manufacturers complied with the original standards at reasonable cost and
with high consumer acceptance.
Financial Incentives
Tougher fuel standards should be complemented by financial incentives that facilitate compliance.
Financial incentives should provide both positive and negative signals—helping to build consumer
demand for high-efficiency vehicles while penalizing those who purchase inefficient vehicles.
Relatively inefficient cars—those with a composite fuel economy rating below the Average may be
subject to a “gas guzzler tax.” The tax, for instance, could be an additional 8 percent excise duty for
vehicles at efficiency of above 90 percent of the average and increases to a maximum of additional 24
percent excise as fuel economy drops. Similar principle may also be applied to other vehicles
including commercial vehicles and two wheelers, category wise. The additional revenue could be
used to pay for incentives offered to buyers of high-efficiency vehicles.
High first cost is a major obstacle to the widespread production and sale of hybrid and fuel cell
vehicles. Tax incentives could be offered in order to stimulate mass production and support initial
sales of these innovative vehicles. The amount of the tax incentive (or most of the incentive) should
be based on the fuel economy achieved. Also, vehicles should have relatively low pollutant emissions
as well as high fuel efficiency in order to be eligible for a tax incentive.
Labeling and Promotion
Complementing stronger standards and financial incentives, the government could introduce energy
labelling to high fuel efficiency and low-emitting vehicles. This would make it easier for consumers to
identify “greener vehicles,” and for manufacturers or others to promote “buying green.” Energy
labelling may be based on a combination of fuel economy and tailpipe emissions, recognizing the best
vehicles in each category but also giving all vehicles an absolute score so that buyers could compare
vehicles across categories.
Research and Development
Given the importance of dramatically improving new vehicle fuel economy in the coming decades,
R&D on highly efficient vehicles and technologies such as fuel cells, hybrid-electric drivetrains, and
lightweight materials should be expanded.
Potential Fuel Savings and Other Benefits
Ministry of Petroleum and Natural Gas Page 150 of 164

8/3/2019 wg11_petro
http://slidepdf.com/reader/full/wg11petro 151/164

8/3/2019 wg11_petro
http://slidepdf.com/reader/full/wg11petro 152/164
Report of the Working Group on Petroleum and Natural Gas for the XI Plan (2007 – 2012)
13.11 Annexure IX – Demand Projections By Various Agencies for Natural Gas
EIA – Energy Information Administration, USA BAU – Business as Usual
IEA – International Energy Agency BCS – Best Case Scenario
IHV – India Hydrocarbon Vision 2025
As the available projections by the various agencies are for different years, the same have been interpolated or extrapolated to bring them to common yearsand have been converted into MMscmd for the purpose of comparison.
Ministry of Petroleum and Natural Gas Page 152 of 164

8/3/2019 wg11_petro
http://slidepdf.com/reader/full/wg11petro 153/164
Report of the Working Group on Petroleum and Natural Gas for the XI Plan (2007 – 2012)
13.12 Annexure X - Refining Capacity at Beginning Of XI Plan
R E F I N I N G C A P A C I T Y A T B E G I N N I N G O F X I P L A N
Sl. No. REFINERY MMTPA
PUBLIC SECTOR
1 Indian Oil Corporation Limited, Digboi 0.650
2 Indian Oil Corporation Limited, Guwahati 1.000
3 Indian Oil Corporation Limited, Koyali 13.700
4 Indian Oil Corporation Limited, Barauni 6.000
5 Indian Oil Corporation Limited, Haldia 6.000
6 Indian Oil Corporation Limited, Mathura 8.000
7 Indian Oil Corporation Limited, Panipat 12.000
8 Hindustan Petroleum Corporation Limited, Mumbai 5.500
9 Hindustan Petroleum Corporation Limited, Visakh 7.500
10 Bharat Petroleum Corporation Limited, Mumbai 12.000
11 Kochi Refineries Limited, Kochi 7.500
12 Chennai Petroleum Corporation Limited, Chennai 9.500
13 Chennai Petroleum Corporation Limited, Nagapatinam 1.000
14 Bongaigaon Refinery & Petrochemicals Limited, Bongaigaon 2.350
15 Numaligarh Refinery Limited, Numaligarh 3.000
16 Oil & Natural Gas Corporation Limited, Tatipaka 0.07817 Mangalore Refinery & Petrochemicals Limited, Mangalore 9.690
TOTAL PUBLIC SECTOR 105.468
PRIVATE SECTOR
18 Reliance Petroleum Limited, Jamnagar 33.000
19 Essar Oil Limited, Jamnagar 10.500
TOTAL PRIVATE SECTOR 43.500
GRAND TOTAL 148.968
Ministry of Petroleum and Natural Gas Page 153 of 164

8/3/2019 wg11_petro
http://slidepdf.com/reader/full/wg11petro 154/164
Report of the Working Group on Petroleum and Natural Gas for the XI Plan (2007 – 2012)
C A P A C I T Y A D D I T I O N I N X I P L A N
S.NO. REFINERY MMTPA
PUBLIC SECTOR
1 Indian Oil Corporation Limited, Haldia 1.502 Indian Oil Corporation Limited, Panipat 3.00
3 Indian Oil Corporation Limited, Paradip 15.00
4 Hindustan Petroleum Corporation Limited, Mumbai 2.40
5 Hindustan Petroleum Corporation Limited, Visakh 7.50
6 Hindustan Petroleum Corporation Limited, Bhatinda 9.00
7 Bharat Petroleum Corporation Limited, Bina 6.00
8 Chennai Petroleum Corporation Limited, Chennai 1.70
9 Kochi Refineries Limited, Kochi 2.00
10 Mangalore Refinery & Petrochemicals Limited, Mangalore 5.31
11 Oil & Natural Gas Corporation Ltd. Tatipaka 0.08
TOTAL PUBLIC SECTOR 53.49
PRIVATE SECTOR
12 Reliance Petroleum Limited, Jamnagar (New) 29.00
13 Essar Oil Limited, Jamnagar 3.50
Nagarjuna Oil Corporation Limited 6.00
TOTAL PRIVATE SECTOR 38.50
GRAND TOTAL 91.99
C A P A C I T Y A D D I T I O N I N 1 2 T H P L A N
S.NO. REFINERY MMTPA
PUBLIC SECTOR
1 Indian Oil Corporation Limited, Koyali 4.30
2 Indian Oil Corporation Limited, Mathura 3.00
3 Indian Oil Corporation Limited, Panipat 6.00
4 Mangalore Refinery & Petrochemicals Limited, Mangalore 15.00
5 Mangalore Refinery & Petrochemicals Limited, Kakinada 7.50
6 Mangalore Refinery & Petrochemicals Limited, Rajasthan 7.50
7 Essar Oil Limited, Jamnagar 18.00
TOTAL 61.30
Ministry of Petroleum and Natural Gas Page 154 of 164
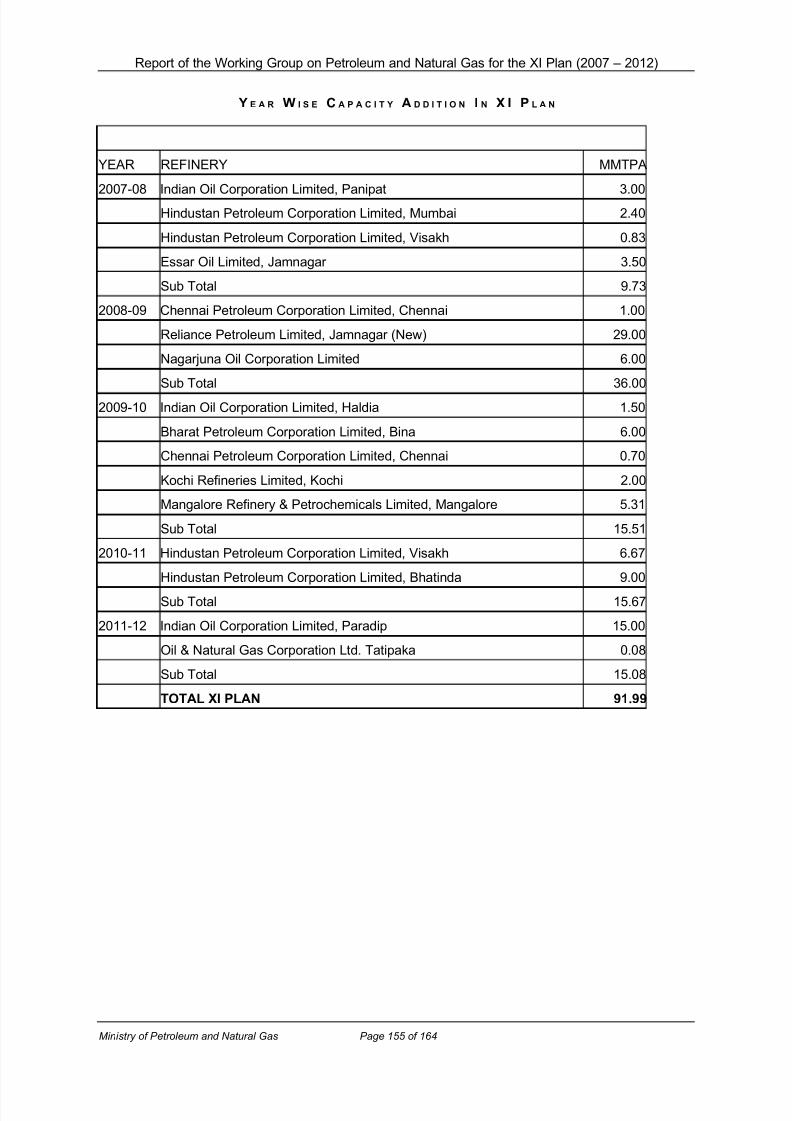
8/3/2019 wg11_petro
http://slidepdf.com/reader/full/wg11petro 155/164
Report of the Working Group on Petroleum and Natural Gas for the XI Plan (2007 – 2012)
Y E A R W I S E C A P A C I T Y A D D I T I O N I N X I P L A N
YEAR REFINERY MMTPA
2007-08 Indian Oil Corporation Limited, Panipat 3.00Hindustan Petroleum Corporation Limited, Mumbai 2.40
Hindustan Petroleum Corporation Limited, Visakh 0.83
Essar Oil Limited, Jamnagar 3.50
Sub Total 9.73
2008-09 Chennai Petroleum Corporation Limited, Chennai 1.00
Reliance Petroleum Limited, Jamnagar (New) 29.00
Nagarjuna Oil Corporation Limited 6.00
Sub Total 36.00
2009-10 Indian Oil Corporation Limited, Haldia 1.50
Bharat Petroleum Corporation Limited, Bina 6.00
Chennai Petroleum Corporation Limited, Chennai 0.70
Kochi Refineries Limited, Kochi 2.00
Mangalore Refinery & Petrochemicals Limited, Mangalore 5.31
Sub Total 15.51
2010-11 Hindustan Petroleum Corporation Limited, Visakh 6.67
Hindustan Petroleum Corporation Limited, Bhatinda 9.00
Sub Total 15.67
2011-12 Indian Oil Corporation Limited, Paradip 15.00
Oil & Natural Gas Corporation Ltd. Tatipaka 0.08
Sub Total 15.08
TOTAL XI PLAN 91.99
Ministry of Petroleum and Natural Gas Page 155 of 164
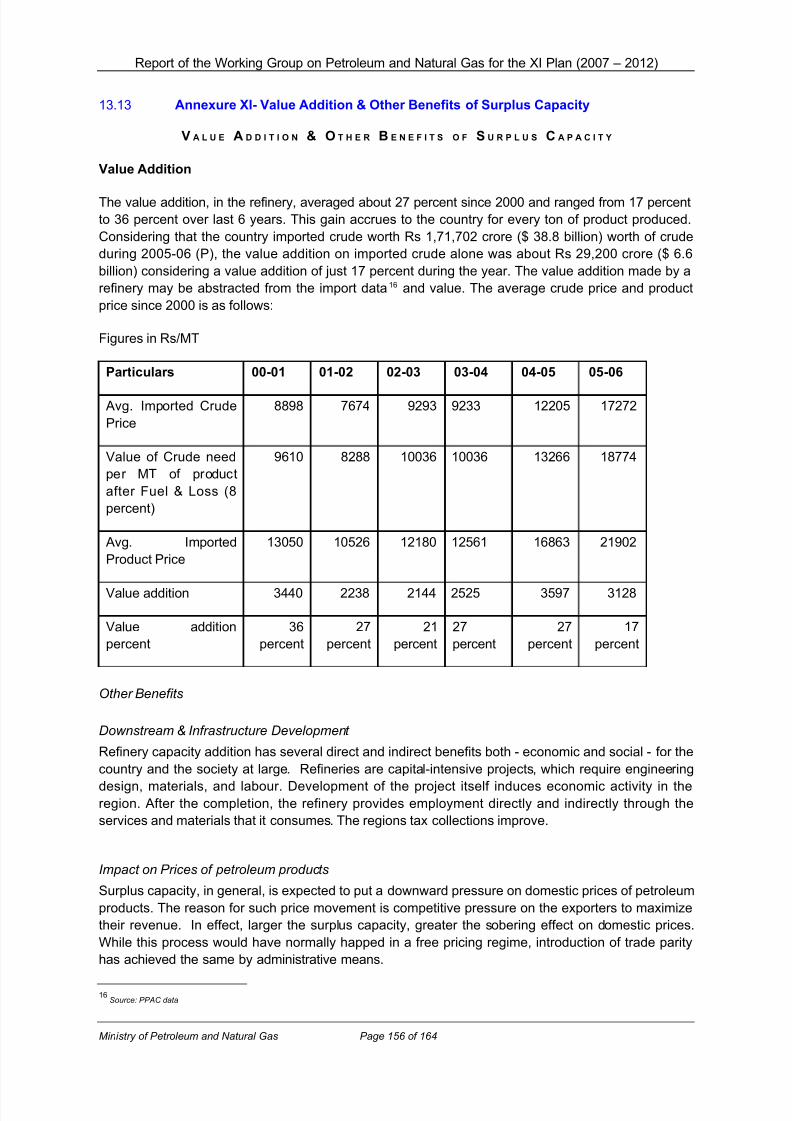
8/3/2019 wg11_petro
http://slidepdf.com/reader/full/wg11petro 156/164
Report of the Working Group on Petroleum and Natural Gas for the XI Plan (2007 – 2012)
13.13 Annexure XI- Value Addition & Other Benefits of Surplus Capacity
V A L U E A D D I T I O N & O T H E R B E N E F I T S O F S U R P L U S C A P A C I T Y
Value Addition
The value addition, in the refinery, averaged about 27 percent since 2000 and ranged from 17 percent
to 36 percent over last 6 years. This gain accrues to the country for every ton of product produced.
Considering that the country imported crude worth Rs 1,71,702 crore ($ 38.8 billion) worth of crude
during 2005-06 (P), the value addition on imported crude alone was about Rs 29,200 crore ($ 6.6
billion) considering a value addition of just 17 percent during the year. The value addition made by a
refinery may be abstracted from the import data16 and value. The average crude price and product
price since 2000 is as follows:
Figures in Rs/MT
Particulars 00-01 01-02 02-03 03-04 04-05 05-06
Avg. Imported Crude
Price
8898 7674 9293 9233 12205 17272
Value of Crude need
per MT of product
after Fuel & Loss (8
percent)
9610 8288 10036 10036 13266 18774
Avg. Imported
Product Price
13050 10526 12180 12561 16863 21902
Value addition 3440 2238 2144 2525 3597 3128
Value addition
percent
36
percent
27
percent
21
percent
27
percent
27
percent
17
percent
Other Benefits
Downstream & Infrastructure Development
Refinery capacity addition has several direct and indirect benefits both - economic and social - for the
country and the society at large. Refineries are capital-intensive projects, which require engineering
design, materials, and labour. Development of the project itself induces economic activity in theregion. After the completion, the refinery provides employment directly and indirectly through the
services and materials that it consumes. The regions tax collections improve.
Impact on Prices of petroleum products
Surplus capacity, in general, is expected to put a downward pressure on domestic prices of petroleum
products. The reason for such price movement is competitive pressure on the exporters to maximize
their revenue. In effect, larger the surplus capacity, greater the sobering effect on domestic prices.
While this process would have normally happed in a free pricing regime, introduction of trade parity
has achieved the same by administrative means.
16Source: PPAC data
Ministry of Petroleum and Natural Gas Page 156 of 164

8/3/2019 wg11_petro
http://slidepdf.com/reader/full/wg11petro 157/164
Report of the Working Group on Petroleum and Natural Gas for the XI Plan (2007 – 2012)
Enhanced Energy Security
Addition in refining capacity enhances energy security by building greater flexibility in meeting the
energy needs of the country. It is important to have the option to processes crude or import product,
for an energy importing country like India. This is so because crude markets are generally larger,
more stable and retain global government focus in contrast to product markets, which are significantly
smaller, lack depth and therefore more volatile.
Ministry of Petroleum and Natural Gas Page 157 of 164

8/3/2019 wg11_petro
http://slidepdf.com/reader/full/wg11petro 158/164
Report of the Working Group on Petroleum and Natural Gas for the XI Plan (2007 – 2012)
13.14 Annexure XII- Abbreviations
Abbreviations
2D/3D Two/Three Dimensional
ACSE Advisory Committee on Synergy in Energy
AIDA All India Distillers’ Association
ALDS Auto LPG Dispensing Stations
ANSI American National Standards Institute
APL Above Poverty Line
APM Administered Price Mechanism
ASME American Society of Mechanical Engineers
ATF Aviation Turbine Fuel
AQM Air Quality Monitoring
BIS Bureau of Indian Standards
BPL Below Poverty Line
BS-II Bharat Stage II
CARG Compounded Annual Rate of Growth
CBM Coal Bed Methane
CHP Combined Heat and Power
CIS Commonwealth of Independent States
CNG Compressed Natural Gas
CPCB Central Pollution Control Board
CTL Coal to Liquid (Coal to Clean Fuels)
CTSL Catalytic Two Stage Liquefaction
DCL Direct Coal Liquefaction
DG Diesel Generator
DHDS De-Hydro Desulphurisation
DHDT Diesel Hydro Treating
Ministry of Petroleum and Natural Gas Page 158 of 164

8/3/2019 wg11_petro
http://slidepdf.com/reader/full/wg11petro 159/164
Report of the Working Group on Petroleum and Natural Gas for the XI Plan (2007 – 2012)
DVPL Dahej-Vijaipur Pipeline
E&P Exploration and Production
EBP Ethanol Blended Petrol
EOR Enhanced Oil Recovery
FDI Foreign Direct Investment
FO Fuel Oil
FSU Countries Former Soviet Union Countries
FT Fischer Tropsch
FTA Free Trade Agreements
G&G Geological and Geophysical
GDP Gross Domestic Product
GPS Global Positioning System
GST Goods and Services Tax
GTL Gas to Liquid
GTR Global Technical Regulations
HDPE High Density Polyethylene
HHI Herfindahl-Hirschman Index
HR Human Resources
HSD High Speed Diesel
HSE Health Safety and Environment
HVJ Hazira-Vijaipur-Jagdishpur
IEP Integrated Energy Policy
IOR Improved Oil Recovery
ISPRL Indian Strategic Petroleum Reserves Limited
IT Information Technology
K-G Basin Krishna-Godavari Basin
Ministry of Petroleum and Natural Gas Page 159 of 164

8/3/2019 wg11_petro
http://slidepdf.com/reader/full/wg11petro 160/164
Report of the Working Group on Petroleum and Natural Gas for the XI Plan (2007 – 2012)
LDPE Low Density Polyethylene
LLDPE Linear Low Density Polyethylene
LNG Liquefied Natural Gas
LOBS Lube Oil Base Stock
LPG Liquefied Petroleum Gas
LSHS Low Sulphur Heavy Stock
MNCs Multinational Companies
MoEF Ministry of Environment and Forest
MoPNG Ministry of Petroleum and Natural Gas
MS Motor Spirit
NCMP National Common Minimum Programme
NCR National Capital Region
NDR National Data Repository
NEF National Energy Fund
NELP New Exploration Licensing Policy
NGAB National Gas Advisory Board
NGHP National Gas Hydrate Programme
NHAI National Highways Authority of India
NKH National Knowledge Hub
NKP National E&P Knowledge Portal
NOCs National Oil Companies
NPC National G&G Processing Centre
NTC National Training Centre
NVAC National Visualisation and Application Centre
OALP Open Acreage Licensing Policy
OECD Organisation for Economic Co-operation and Development
Ministry of Petroleum and Natural Gas Page 160 of 164

8/3/2019 wg11_petro
http://slidepdf.com/reader/full/wg11petro 161/164
Report of the Working Group on Petroleum and Natural Gas for the XI Plan (2007 – 2012)
OMCs Oil Marketing Companies
ORDA Oil Fields (Regulation and Development) Act
P&NG Petroleum and Natural Gas
PDS Public Distribution System
PNG Piped Natural Gas
PNGRB Act, 2006 Petroleum and Natural Gas Regulatory Board Act, 2006
POL Petroleum Oil and Lubricant
PSC Production Sharing Contract
PSUs Public Sector Undertakings
PUC Pollution Under Control
QHSE Quality, Health, Safety and Environment
R&D Research and Development
ROs Retail Outlets
ROU Right of Usage
RRR Reserve Replacement Ratio
RSRTC Rajasthan State Road Transport Corporation
SEZ Special Economic Zone
SCR Selective Catalytic Reduction
SKO Superior Kerosene Oil
SPV Special Purpose Vehicle
TPDS Targeted Public Distribution System
TNCs Transnational Companies
TV Television
UCG Underground Coal Gasification
UTs Union Territories
VAT Value Added Tax
Ministry of Petroleum and Natural Gas Page 161 of 164

8/3/2019 wg11_petro
http://slidepdf.com/reader/full/wg11petro 162/164

8/3/2019 wg11_petro
http://slidepdf.com/reader/full/wg11petro 163/164
Report of the Working Group on Petroleum and Natural Gas for the XI Plan (2007 – 2012)
C&AG Comptroller and Auditor General
CHT Centre for High Technology
CIL Coal India Limited
CPCL Chennai Petroleum Corporation Limited
CVC Central Vigilance Commission
DGH Directorate General of Hydrocarbons
DOD Department of Ocean Development
EIA Energy Information Administration
FCI Fertilizer Corporation of India
GAIL GAIL (India) Limited
GEECL Great Eastern Energy Corporation Limited
GGSRL Guru Gobind Singh Refinery Limited
GSPC Gujarat State Petroleum Corporation
HFCL Hindustan Fertilizers Corporation Limited
HPC/HPCL Hindustan Petroleum Corporation Limited
IBP Indo-Burma Petroleum
ICMA Indian Chemicals Manufacturers Association
IOC/IOCL Indian Oil Corporation Limited
IIT Indian Institute of Technology
ISMA Indian Sugar Mills Association
ISM Dhanbad Indian School of Mining Dhanbad
ISO International Organisation for Standardisation
KRL Kochi Refineries Limited
MIT Pune Maharashtra Institute of Technology
MRPL Mangalore Refinery and Petrochemicals Limited
NCAER National Council for Applied Economics Research
Ministry of Petroleum and Natural Gas Page 163 of 164

8/3/2019 wg11_petro
http://slidepdf.com/reader/full/wg11petro 164/164
Report of the Working Group on Petroleum and Natural Gas for the XI Plan (2007 – 2012)
NGRI National Geophysical Research Institute
NIO National Institute of Oceanography
NRL Numaligarh Refinery Limited
OIDB Oil Industry Development Board
OIL Oil India Limited
OISD Oil Industry Safety Directorate
ONGC Oil and Natural Gas Corporation
OPEC Organisation of the Petroleum Exporting Countries
OVL ONGC Videsh Limited
PCRA Petroleum Conservation and Research Association
PLL Petronet LNG Limited
PPAC Petroleum Planning and Analysis Cell
RGIPT Rajiv Gandhi Institute of Petroleum Technology
Fi
81.18
27.08
89.25
71.13 61.6956.26
46.1236.08 30.89
99.47 102.06 98.23
92.72
94.91 98.15100.87
68.5757.11
46.6941.05 35.34 30.76 27.87 25.41 23.69
140
160
180
0.16
0.19
0.19
0.19
0.23
0.27
0.3
0.38
0.51
0.21
Former Soviet
Figu