wetstock reconciliation at fuel storage facilities · wetstock reconciliation at fuel storage...
TRANSCRIPT
Cyan 100%Magenta 76%Yellow 0Black 27%
Wetstock Reconciliation at Fuel Storage Facilities
An Operator’s Guide

Acknowledgements & References
Fairbanks Environmental Limited was commissioned by the Health & Safety Authority to prepare this Best Practice guide, which replaces previous H.S.A. Guidelines called “Wetstock Inventory Control for Petrol Stations”, now revoked.
The Authority also wish to acknowledge the APEA / EI guide “Design, construction, modification, maintenance and decommissioning of filling stations, 3rd Edition” , also referred to as ‘The Blue Book’, in the development of the guide.
Valuable advice and assistance was provided by a range of stakeholder technical experts, from the petroleum industry, Government and Local Authority bodies.
Published in January 2013 by the Health & Safety Authority, The Metropolitan Building, James Joyce St., Dublin 1.
2
Our vision: A country where worker safety, health and welfare and the safe management of chemicals are central to successful enterprise

Contents
Acknowledgements & References . . . . . . . . . . . . . . . . . . . . . . . . . . . . . . . . . . . . . . . . . . . . . . . . . . . .2
Chapter 1 Introduction to this guide . . . . . . . . . . . . . . . . . . . . . . . . . . . . . . . . . . . . . . . . . . . . . . .4
Chapter 2 The Basics of Wetstock Management . . . . . . . . . . . . . . . . . . . . . . . . . . . . . . . . . . . . .5
Chapter 3 How to Keep Accurate Data . . . . . . . . . . . . . . . . . . . . . . . . . . . . . . . . . . . . . . . . . . . . . .7
3a) Daily Variance Calculations . . . . . . . . . . . . . . . . . . . . . . . . . . . . . . . . . . . . . . . . . . .7
3b) Cumulative Variance Calculations . . . . . . . . . . . . . . . . . . . . . . . . . . . . . . . . . . . .8
Chapter 4 Establishing your “Normal” Variance Trend. . . . . . . . . . . . . . . . . . . . . . . . . . . . . . . .9
Chapter 5 Detecting a change in Variance (Abnormal Variance Trend) . . . . . . . . . . . . . .13
Chapter 6 Loss investigation . . . . . . . . . . . . . . . . . . . . . . . . . . . . . . . . . . . . . . . . . . . . . . . . . . . . . .15
Chapter 7 Risk Assessment . . . . . . . . . . . . . . . . . . . . . . . . . . . . . . . . . . . . . . . . . . . . . . . . . . . . . . . .17
Chapter 8 Levels of Leak Detection or Containment Systems
(appropriate for the site) risk assessment classification . . . . . . . . . . . . . . . . . . .21
Chapter 9 Summary . . . . . . . . . . . . . . . . . . . . . . . . . . . . . . . . . . . . . . . . . . . . . . . . . . . . . . . . . . . . . .24
Appendices. . . . . . . . . . . . . . . . . . . . . . . . . . . . . . . . . . . . . . . . . . . . . . . . . . . . . . . . . . . . . . . . . . . . . . . .25
1. What Causes Variance? . . . . . . . . . . . . . . . . . . . . . . . . . . . . . . . . . . . . . . . . . . . . . . . . . . . . . . . . . . .25
1a) Variances through Tank Stock Measurement . . . . . . . . . . . . . . . . . . . . . . . . . . . . . .25
1b) Variances through Sales . . . . . . . . . . . . . . . . . . . . . . . . . . . . . . . . . . . . . . . . . . . . . . . . .29
1c) Variances through Deliveries . . . . . . . . . . . . . . . . . . . . . . . . . . . . . . . . . . . . . . . . . . . . .30
1d) Variances through Vapour Recovery Systems (Stage 1b). . . . . . . . . . . . . . . . . . .31
1e) Common Variances and their Solutions. . . . . . . . . . . . . . . . . . . . . . . . . . . . . . . . . . .32
2. Quick guides . . . . . . . . . . . . . . . . . . . . . . . . . . . . . . . . . . . . . . . . . . . . . . . . . . . . . . . . . . . . . . . . . . . . .34
2a) Best Practice. . . . . . . . . . . . . . . . . . . . . . . . . . . . . . . . . . . . . . . . . . . . . . . . . . . . . . . . . . . . .34
2b) Troubleshooting. . . . . . . . . . . . . . . . . . . . . . . . . . . . . . . . . . . . . . . . . . . . . . . . . . . . . . . . .36
3. Glossary of Terms. . . . . . . . . . . . . . . . . . . . . . . . . . . . . . . . . . . . . . . . . . . . . . . . . . . . . . . . . . . . . . . . .38
4. Wetstock Reconciliation Worksheet . . . . . . . . . . . . . . . . . . . . . . . . . . . . . . . . . . . . . . . . . . . . . . .39
3
Wetstock Reconciliation at Fuel Storage FacilitiesAn Operator’s Guide

4 Chapter 1
This Best Practice document in Wetstock Inventory Control replaces the previous HSA Guidance on Wetstock Inventory Control for Petrol Stations and has been updated to include all types of fuel and incorporate current best practice.
The purpose of the guidance is to assist petrol station operators to control fuel losses on their site in order to minimise any adverse impacts on safety, the local community and environment, to ensure compliance with the law, and save costs due to fuel losses, all of which are good for business. Efficient and effective wetstock management control will facilitate operators in complying with a range of legal requirements including Mineral Oil Regulations, and relevant safety and environmental legislation.
Although primarily aimed at petrol inventory control, this guidance can be applied to all types of liquid fuels (including diesel, biofuel and kerosene) being stored and dispensed at retail & private petroleum stores.
Note: The term petrol station used throughout the document can be taken to cover any type of retail fuel storage and dispensing station, petrol station being the most commonly used terminology.
Objectives of this guide are to:
> Help to understand the nature of wetstock and the risks involved
> Outline how to keep accurate data (which is the basis of effective analysis)
> Explain why variances (+/-) exist
> Instruct how to establish your tanks’ “normal” variances
> Instruct how best to accurately detect abnormal variances
> Provide a guide for loss investigation
> Provide guidance to current best practice in controlling risks due to fuel losses on your site, based on a risk assessment
Chapter 1 Introduction to this guide
Wetstock Reconciliation at Fuel Storage Facilities

5Chapter 2
What is Wetstock?
Wetstock is the liquid fuel contained in controlled storage conditions. Wetstock management is important because of the risk presented by liquid fuels in the event of loss of containment. Petroleum spirit (petrol) is a highly volatile and flammable liquid, which means that at room temperatures it gives off flammable vapours which, when mixed with air, will burn with explosive force if ignited. Petrol vapour can find its way into basements of buildings and public drains with serious consequences, should the vapours come into contact with an ignition source.
Petrol is also hazardous to the environment, injurious to aquatic life and presents a particular risk to drinking water supplies. Whenever petrol leaks or escapes from an underground storage tank or pipelines it can travel significant distances dependent on whether there is a high water-table or underground river in the vicinity. Although diesel and kerosene are not as flammable as petrol and therefore do not pose a significant inherent flammability risk, they are hazardous to the environment and any leakages of these fuels could pose a threat in particular to groundwater in the vicinity.
The risks around wetstock storage
As most fuel is stored in underground storage tanks, if there are leaks, it is easier for the fuel to enter the underground water system and pollute the groundwater which in many cases provides drinking water to local communities. Given the significant risks to health & safety of people and the environment, the storage of petrol at retail & private stores is controlled by specific legislation which requires such storage to be licenced (in the case of petroleum spirits only) and such licence conditions generally require all practicable steps to be taken to prevent accident by fire, explosion or escape of petrol.
Similarly the Prevention of Pollution of Groundwater Regulations, S.I. 9 of 2010, prohibits the input of hazardous substances into groundwater. The level of risk from the storage and dispensing of motor fuels increases when petrol stations are located in urban areas, as they are surrounded by private or commercial premises. Therefore the need for consistent and accurate monitoring of petrol delivered, stored and dispensed at any petrol station in order to detect leaks from each underground tank and connected pipeline system, is essential.
These best practice guidelines will provide practical advice and information to help you to develop and maintain an effective Wetstock Inventory Management System for your site(s), and to comply with legislative requirements as all petrol station operators will be required to carry out a risk assessment for their operation and ensure that adequate controls are put in place. All petrol station operators will be expected to meet a minimum standard of wetstock control in order to detect possible leaks, particularly from underground storage tanks. The method of controlling wetstock levels is called “Wetstock Reconciliation”.
An Operator’s Guide
Chapter 2 The Basics of Wetstock Management

6
Wetstock Reconciliation
Wetstock Reconciliation is the management of liquid stock, stored on the site, e.g. petrol, diesel, kerosene etc. It is based on the same theory of any stock control system, that is, measuring the amount of stock delivered into the storage tanks, subtracting the amount sold, and measuring what is left in stock. Any variances from what is expected to be in stock may be due to losses (leaks, evaporation, or theft of fuel). To reduce the risks from petrol leaking from an underground tank or pipeline it must be detected at the earliest possible time and any further escape prevented. For new or recently refurbished petrol stations, automatic detection systems can be incorporated into the installation of the underground tank and pipeline in order to monitor for leaks and raise an alarm.
However, for older petrol stations this is not always feasible and some other method must be adopted to provide a similar level of leak detection. These guidelines are intended to outline a manual system of leak detection suitable for use in older petrol stations as well as outlining alternative systems which may be considered. The more accurate the Wetstock Management System is, the quicker a leak can be detected and action taken to prevent pollution or fire/explosion, as well as saving costs due to fuel losses.
Where the risk of leakage is classed as medium or high then you should give consideration to the use of an approved third party company which uses a SIR (Statistical Reconciliation Inventory) system. Such systems will help you to detect leaks much more quickly and when the leakage rate is much lower, thereby minimising losses/damage to the environment/safety risks, as well as providing a robust means of generating fuel stock data all of which can be used to demonstrate compliance with the law.
Typically you would submit your daily wetstock data to the third party company and their sophisticated, statistics based analysis would detect unusual losses or gains and start an investigation on your behalf.
For the highest level of protection, SIR systems can be enhanced by real time analysis involving the reconciliation of every customer sale transaction. For further information on SIRs please see Chapter 8.
Wetstock Reconciliation at Fuel Storage Facilities
Chapter 2

7
3a) Daily Variance Calculations
This section will show you how to calculate wetstock figures for your site, and more importantly, how to get maximum benefit from them. We recommend you record them on a worksheet (A blank form is provided at the back of this booklet). However, it is advisable to use an electronic spread sheet as this will make calculations easier for you, as well as allowing graphs to be produced. Now here’s where wetstock figures originate from and how they relate to your site and tanks:
An Operator’s Guide
Chapter 3 How to Keep Accurate Data
Delivery Sales
10:00 pm
Openingstock:
TANK: 2 CAPACITY: 33,400 PUMPS: 1,2,3,4 GRADE: Unleaded
Date Day Deliveries Sales OpeningStock
ClosingStock
VarianceLoss(-ve)
MONTH: April YEAR: 2013 DAILY
A
1 Mon 16745 0 810 15935 15927 -8
2 Tue 15927 0 1103 14824 14821 -3
3 Wed 14821 0 956 13865 13861 -4
4 Thu 13861 0 1012 12849 12855 6
5 Fri 12855 0 987 11868 11806 -8
6 Sat 11860 6500 1196 17164 17207 43
7 Sun 17207 0 802 16405 16397 -8
B C D(=A+B-C) (=E-D)
E F
Previousday’s actual
closing
Closingstock:
Measured stocklevel at the end of
the day
10:00 pm
Site Trading Day (24 hour period)
WETSTOCK RECONCILIATION WORKSHEET
cee))) Book Stock
Opening Stock + Deliveries – Sales = Book Stock
12855 + 0 – 987 = 11868
11860 + 6500 – 1196 = 17164
Variance
Closing Stock – Book Stock = Variance
11860 – 11868 = – 8
17207 – 17164 = +43
BookStock
Chapter 3

8
Wetstock Reconciliation at Fuel Storage Facilities
3b) Cumulative Variance Calculations
Daily data calculations are useful for spotting major leaks or data errors. However, there are many issues that can be hard to see in the daily data but that can have a large impact over the long term. This is where cumulative calculations are extremely useful. Adding up the daily data over time can show us a tank’s “trend”.
The Cumulative columns in our worksheet are highlighted in yellow below. These figures are used to provide a Cumulative Percentage Variance which will give a better indication overall of a tank’s variance trend over time.
Deliver Sale
10:00 pm
Openingstock:
TANK: 2 CAPACITY: 33,400 PUMPS: 1,2,3,4 GRADE: Unleaded
Date Day Deliveries Sales OpeningStock
ClosingStock
VarianceLoss(-ve)
MONTH: April YEAR: 2013 DAILY
A
1 Mon 16745 0 810 15935 15927 -8
2 Tue 15927 0 1103 14824 14821 -3
3 Wed 14821 0 956 13865 13861 -4
4 Thu 13861 0 1012 12849 12855 6
5 Fri 12855 0 987 11868 11806 -8
6 Sat 11860 6500 1196 17164 17207 43
7 Sun 17207 0 802 16405 16397 -8
B C D(=A+B-C) (=E-D)
E F
Previous
Closingstock:
Measured stocklevel at the end of
10:00 pm
Site Trading Day (24 hour period)
WETSTOCK RECONCILIATION WORKSHEET
ee) Book Stock
Opening Stock + Deliveries – Sales = Book Stock
12855 + 0 – 987 = 11868
11860 + 6500 – 1196 = 17164
Variance
Closing Stock – Book Stock = Variance
11860 – 11868 = – 8
17207 – 17164 = +43
BookStock
Cumulative Variance = Cumulative Variance from day before + daily variance for that day.
e.g. - 8 + (-3) = -11
Cumulative Sales = Cumulative Sales from day before + daily Sales for that day.
e.g. 4236 + 987 = 5223
Cumulative % Variance =
Cumulative Variance
Cumulative Sales
18
7221
x 100
x 100 = 0.25e.g.
Are you a non-24 hour site? No problem. Take accurate readings when you close and record them.
24 hour Site? Not so easy! Close half your site (e.g. at 10pm) take accurate readings then do the other half.
0A Best Practice Tip: Dipping your tank for closing stock amounts
Chapter 3

9
An Operator’s Guide
Normal variance trend can be the result of many causes such as evaporation, delivery errors, tank calibration etc. some of which can be controlled to reduce loss; others such as evaporation are however, unavoidable (for further details and common variances see appendix 1e). The Daily Variances we calculated in our worksheet will clearly show the losses and gains each day based on your book stock for that particular tank. The Cumulative Percentage Variances we calculated, however, will show losses and gains as a percentage of sales over time, indicating the variance trend of the tank for the period. This will allow us to identify change in variance trend and most importantly potential leaks. Plotting the Cumulative Percentage Variances onto a graph (as shown below) will allow you to see the trend more easily.
Chapter 4 Establishing your “Normal” Variance Trend
A Best Practice Tip:
Dipping your tank for closing
stock amounts
Are you a non-24 hour site? No problem. Take
accurate readings when you close and record them.
24 hour Site? Not so easy! Close half your site (e.g. at 10pm) take accurate readings then do the other half.
A Best Practice Tip
Dipping yourtank for closing
stock amounts
Are you a non-24 housite? No problem. Take
accurate readings when yoclose and record them.
Cumulative Variance = Cumulative Variance from day before + daily variance for that day.
e.g. -8 + (-3) = -11
Cumulative Sales = Cumulative Sales from day before + daily Sales for that day.
Cumulative % Variance =
Cumulative Variance
Cumulative Sales
18
7221
x 100
x 100=e.g.
Cum
ulat
ive
Perc
enta
geVa
rianc
e
Date
0.50
0.00
-0.50
-1.00
-1.50
-2.00
-2.501 2 3 4 5 6 7 8 9 1 0 11 12 13 14 15 16 17 18 19 20
A gradual increase of losses over the 20 days is more visible in the cumulative % column and the trend highlighted easier in the graph below.
The cause for the losses seen in this example was a low level leak from a suction pipe.
Cumulative Percentage Variance for periodUsing a spread sheet to record your Wetstock figures will make it easy to produce charts like the one seen here.
Best Practice Tip: Producing Charts of your data
Chapter 4
0

10
Wetstock Reconciliation at Fuel Storage Facilities
What is the normal wetstock variance of each of your storage tanks?
You need to determine what is normal so that you can detect when an ‘excessive’ or abnormal variance occurs.
Here are some important points to take into account
> The normal variance for each tank is unique to that tank and may be different to other tanks on your site.
> Variance may be significantly different for petrol grades as for diesel grades.
> Variance will change on each tank month by month, winter to summer.
> Variance for each fuel grade should be similar to that of other stations in the same part of the country and supplied from the same terminal or depot.
> Variances on your petrol grades will change if you have Stage 2 vapour recovery activated. By returning petrol vapour into your storage tanks you should notice a reduction in wetstock loss although it is difficult to quantify.
> Variances will change if you install automatic temperature compensation (ATC) on your dispensers. For example in winter when the fuel temperature is colder and below 15 degrees C , you will dispense less fuel for a given quantity shown on the customer display (readout volume corrected to 15 degrees C) than if ATC was not fitted. This will result in a reduction in wetstock loss or may even result in a wetstock gain. However in summer if the fuel temperature in your tanks is warmer than 15 degrees C then you will have the opposite result. Once ATC is installed it should remain activated in both winter and summer.
As well as recording and calculating your daily data, the site owner MUST review the loss/gain trends daily for variances from the usual trend of the tank and for any loss or gain exceeding acceptable levels based on deliveries, sales for that day and seasonality. 0
Best Practice Tip: Interpreting and reviewing your Wetstock data trends
Chapter 4
Without good Wetstock reconciliation procedures the previous leak could have gone undetected for a long time and larger fuel amounts lost, resulting in serious pollution, high clean-up costs and possible legal proceedings.
So could you notice a leakage like this by looking at your current Wetstock records?As little as 10 litres per day will release over 3,600 litres of fuel to ground per year!

11
An Operator’s Guide
The normal variance should be recorded on a monthly basis as well as over a longer length of time up to a 12 month period as shown below.
Table 4.1 Normal monthly Variance % (Figures are for illustration purposes only)
The charts below show the normal monthly % variance and the cumulative % variance trend over one year for all of the 3 tanks above within the same site.
See how the High Octane Unleaded (Super Unleaded) fuel has a higher loss and is more erratic than the higher selling grades. This is because any wetstock variances on a low selling grade will be accentuated e.g. a 5 litre loss on a tank selling 1000 litres per day is a 0.5% loss, whereas on a tank selling 100 litres a day a 5 litre loss is a 5% loss.
Chart 4.2 Normal Monthly % Variance Trend
Cum
ulat
ive
Perc
enta
geVa
rianc
e
Cumulative Percentage Variance for period
Date
Key: Super Diesel Unleaded
0.50
0.00
-0.50
-1.00
-1.50
-2.00
-2.50
0.2
0.1
0
-0.1
-0.2
-0.3
-0.4
-0.5
-0.6
-0.7
-0.8
1 2 3 4 5 6 7 8 9 1 0 11 12 13 14 15 16 17 18 19 20
Jan Feb Mar Apr May Jun Jul Aug Sep Oct Nov DecDate
Normal Trend – Monthly % Variance
Perio
d lo
ss/g
ain
%
Abnormal Trend – Cumulative % Variance
Normal monthly variance %
Cum
ulat
ive
Key: Super Normal Variance Unleaded Abnormal Variance
Jan Feb Mar Apr May Jun Jul Aug Sep Oct Nov Dec
0
-0.05
-0.1
-0.15
-0.2
-0.25
-0.3
-0.35
Jan Feb Mar Apr May Jun Jul Aug Sep Oct Nov Dec
2012 2013
-0.15 -0.16 -0.18 -0.21 -0.23 -0.26 -0.28 -0.29 -0.25 -0.20 -0.17 -0.16
+0.12 +0.12 +0.10 +0.06 +0.02 -0.05 -0.06 -0.09 -0.02 +0.02 +0.08 +0.10
-0.45 -0.57 -0.48 -0.51 -0.49 -0.42 -0.64 -0.60 -0.68 -0.59 -0.56 -0.30
*High Octane Unleaded (Super Unleaded)
Diesel
Unleaded
High Octane Unleaded*
Chapter 4
12
Wetstock Reconciliation at Fuel Storage Facilities
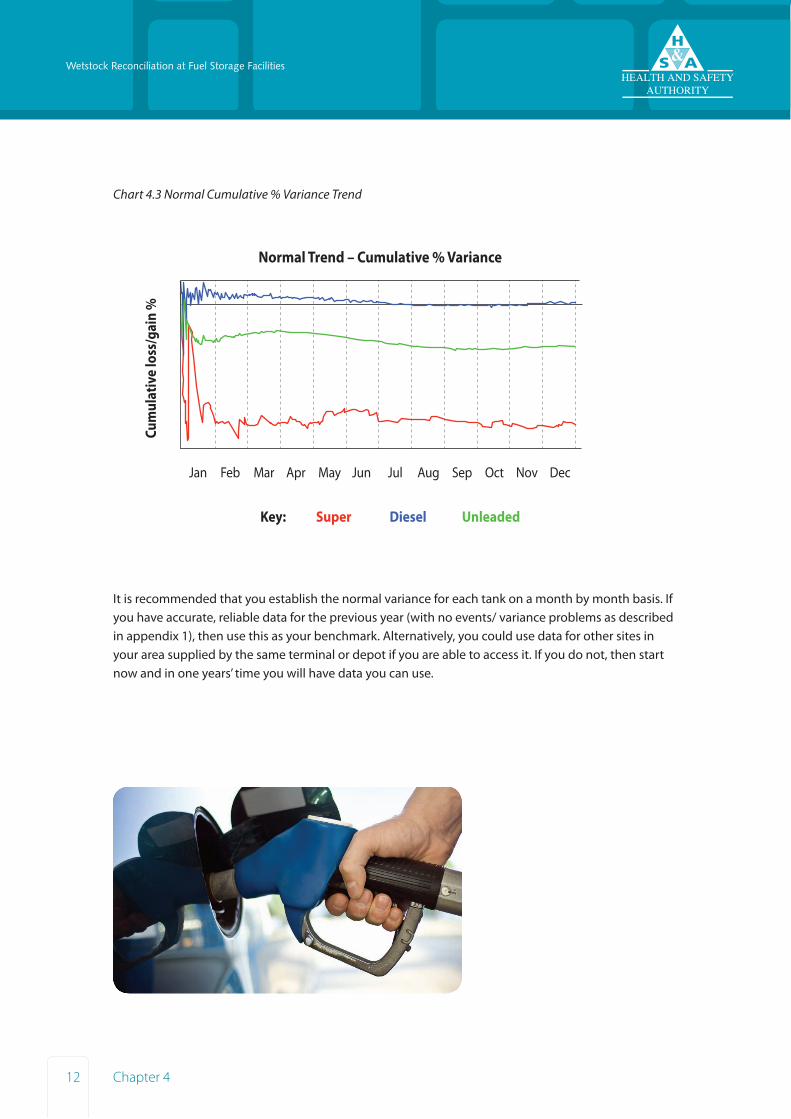
Chart 4.3 Normal Cumulative % Variance Trend
It is recommended that you establish the normal variance for each tank on a month by month basis. If you have accurate, reliable data for the previous year (with no events/ variance problems as described in appendix 1), then use this as your benchmark. Alternatively, you could use data for other sites in your area supplied by the same terminal or depot if you are able to access it. If you do not, then start now and in one years’ time you will have data you can use.
Key: Super Diesel Unleaded
Key: Super Diesel Unleaded
0.2
0.1
0
-0.1
-0.2
-0.3
-0.4
-0.5
-0.6
-0.7
-0.8
Jan Feb Mar Apr May Jun Jul Aug Sep Oct Nov Dec
Normal Trend – Cumulative % Variance
Cum
ulat
ive
loss
/gai
n %
Jan Feb Mar Apr May Jun Jul Aug Sep Oct Nov Dec
Chapter 4

13
An Operator’s Guide
Once you establish a normal variance trend for your tanks, accounting for any seasonal variation, you can quickly see if a tank deviates from its trend. If an abnormal variance is noticed (as below) you should investigate the cause immediately. Staff at the site must be trained to know what to do if an abnormal variance is noticed and records of staff training must be kept at the site as part of the safety management documentation.
Chart 5.1 Abnormal Cumulative % Variance Trend
By comparing the monthly variance with your normal variance benchmark you will be able to detect when a change (an increase in wetstock loss) is significant and is increasing.
Ways to compare
A – When you only have a single tank for that grade on your site then compare this year to last year and check for changes (as shown in Chart 5.2 next).
B – If you have multiple tanks of the same grade or other sites you can compare against them for a change in variance.
Chapter 5 Detecting a change in Variance (Abnormal Variance Trend)
Key: Super Diesel Unleaded
Normal Trend – Cumulative % Variance Abnormal Trend – Cumulative % Variance Trend
Cum
ulat
ive
Cum
ulat
ive
loss
/gai
n %
Jan Feb Mar Apr May Jun Jul Aug Sep Oct Nov Dec
Key: Super Diesel Normal Variance Unleaded Abnormal Variance Unleaded
Jan Feb Mar Apr May Jun Jul Aug Sep Oct Nov Dec
Chapter 5

14
Wetstock Reconciliation at Fuel Storage Facilities
Chart 5.2 Year on Year comparison
Deciding if the change in variance is significant
It is not easy (or safe) to say how much of an increase makes it significant. It is no longer appropriate to use a single quantity (in litres or in %) that can be used by every site for each fuel grade and for each month.
For example: If the normal variance is - 0.20% (loss) and on that month you record a loss of - 0.30% and your average daily sales are 200 litres, this increase is much less than 1 litre per day, which is insignificant. However if your average daily sales is 10,000 litres then the loss is equal to 10 litres per day or 3,650 litres per year, which is very significant.
In the absence of greater experience or expert help you may wish to use this.
A significant change in variance could be:
1. An increase of 0.1% from the monthly normal variance.
2. An increase of 10 litres per day over a month.
3. An increase in monthly loss of more than 300 litres.
Abnormal Trend – Cumulative % Variance
Cum
ulat
ive
Key: Super Diesel Normal Variance Unleaded Abnormal Variance
Jan Feb Mar Apr May Jun Jul Aug Sep Oct Nov Dec
0
-0.05
-0.1
-0.15
-0.2
-0.25
-0.3
-0.35
Jan Feb Mar Apr May Jun Jul Aug Sep Oct Nov Dec
2012 2013
0Best Practice Tip: Deciding on how significant a change is.
Chapter 5

15
An Operator’s Guide
What to do if you detect a significant change in variance.
If you are sure that you have accounted for all of the factors highlighted in appendix 1, there remain two possibilities – the fuel may have been stolen or you may have a leak.
What to do and what appropriate measures to take if a leak is suspected?
If you think that you have a leak, as soon as practicable, you must inform your Petroleum Licensing Authority (Local Authority Fire Department) as that is a condition of your licence, and take any action necessary to minimise the Health & Safety risk. You must also inform the Environment section of your local authority, as they will identify any action necessary to protect the environment.
Your site should have a written procedure detailing what to do in the event of a suspected leak. This is sometimes called an Escalation Procedure. It should contain details of what action you should take and how to carry out the relevant actions. It should contain details of how to:
> Investigate the cause of the loss
> Contact the Local Authority petroleum licencing and environmental sections
> Take any necessary Health & Safety actions
> Prevent any further leakage
> Quantify the volume of product lost
> Identify the leaking tank or pipework
> Repair the leak or decommission the equipment in agreement with your licensing/ environmental officer
> Remediate any pollution caused in agreement with the Local Authority
Important
It is vital that you tell the Local Authority as quickly as possible as they can provide advice on what to do in order to minimise the Health & Safety risks and protect the environment. This advice may include seeking help from specialist wetstock management companies, petrol station contractors, or environmental / oil industry consultants.
Chapter 6 Loss investigation
Chapter 6

16
Wetstock Reconciliation at Fuel Storage Facilities
Leak investigation “What to do” Checklist
This is not an exhaustive list and you should take expert advice as appropriate.
3Carry out a visual inspection of all dispensers and tank manholes for signs of leakage.
3 For single wall tanks carry out a static tank test, either via the automatic tank gauge (ATG) if you have one or by a qualified contractor using a precision test method.
3 For suction pipework systems, check if there have been reports of dispensers losing prime. This is an indication that the pipeline may be leaking. If so, have it tested.
3 For pressurised pipework systems, check that any leak detection device is operational.
3 If any other leak sensors are fitted, have them checked.
0Best Practice Tip: Escalation Procedure
Draw up an escalation procedure for your site and make sure all staff are informed and appropriately trained.
Chapter 6

17
An Operator’s Guide
Good management of your wetstock on your site is important for two reasons:
1. Fuel products can cause serious pollution of local streams and rivers and can contaminate large volumes of groundwater in aquifers and land below a site.
2. Fuel products are flammable and pose significant health and safety risks to both staff and the local community. Site operators have a duty to comply with all Health and Safety legislation that applies to the site.
It is therefore important that any risk is managed. Central to the risk management of health and safety, is the ability to carry out risk assessments i.e. the ability to estimate the likelihood or chance of a loss or an injury occurring due to the hazards identified on the site and hazards that could arise due to work carried out on the site.
By ‘hazard’ we mean anything that has the potential to cause harm, i.e. human injury or ill-health. The risk of the hazard considers the severity (i.e. high, medium, and low) and the chance (how likely it is that an accident may happen).
Carrying out a Risk Assessment is the recommended way to help you decide whether your current methods of leak detection are sufficient or whether you need to increase your level of protection.
Risk assessment is fundamental to good health and safety management. All employers regardless of the size of business are required by law to carry out a risk assessment at their place of work and to keep a written record of that risk assessment.
People are often put off by the idea of Risk Assessment because they think it is over complicated, difficult to complete and unnecessary.
Risk Assessment is simply looking closely at what, in your place of work or about your work activities, could cause harm to your employees and visitors to your workplace (e.g. customers, suppliers, sales representatives etc.) and determining the control measures you can implement to minimise the risk.
Chapter 7 Risk Assessment
Chapter 7

18
Wetstock Reconciliation at Fuel Storage Facilities
There are 3 basic steps to Risk Assessment:
1. Identify the hazards (i.e. anything that has the potential to cause harm, in terms of human injury, ill-health or damage to property). For example; working with petroleum products or dangerous equipment.
2. Identify the level of risk for each hazard (i.e. the chance/likelihood of harm occurring, coupled with how severe the harm or ill health could be). Decide who could be harmed and how, giving consideration to vulnerable groups (e.g. young persons, the elderly, pregnant employees, shift workers etc.).
3. Identify the controls or improvements that need to be put in place to avoid or reduce the risk. Your control measures are the most significant part of the risk assessment, as they set out the steps that must be followed to protect people and the environment. Some control measures may already be in place. You will need to decide if additional measures are needed. Risk assessments will help you prioritise the high risk hazards first. More information on Hazards and Controls, including an explanation of the ‘Hierarchy of Controls’ can be found within the ‘Learn More’ section of BeSMART, the free, easy-to-use, online tool for Risk Assessments and Safety Statements from the HSA. See HSA web site for further details at www.hsa.ie and www.besmart.ie
For a comprehensive guide to risk assessing your petrol station and adopting the appropriate leak protection system, a very good form of reference is the APEA/EI guide “Design, construction, modification, maintenance and decommissioning of filling stations, 3rd Edition” also referred to as ‘The Blue Book’. The guidance offered in this document is generally in agreement with the Blue Book.
Chapter 7

19
An Operator’s Guide
Guide to risk assessing your petrol station
Risk assessment should, firstly, be viewed in terms of the severity of impact or how much damage would be incurred in the event of a leakage; and secondly how likely a leakage is to occur.
Determine the severity of impact and the likelihood of leakage from the tables below
Table 7.1 - Severity of impact of Leakage
Table 7.2 - Likelihood of leakage
Aspect
The presence of a basement, culvert or tunnel
Annual fuel sales in litres
Number of people potentially affected by a fire or explosion (including staff, customers and neighbours
Impact on surface water or groundwater
Impact on protected habitats or species
High
Within or adjacent to the site
More than 5 million
More than 100
Located on a principal aquifer, within 50m of a well or borehole or directly connected to a watercourse
Could have a direct impact on a nationally designated site
Medium
In proximity to the site and connected via drains, cable ducting or highly permeable soil
Between 500,000 and 5 million
Between 10 and 100
Located on a secondary aquifer
Could have an indirect impact on a nationally designated site
Low
No below ground features could be impacted by a leak
Less than 500,000
Less than 10
No impact possible
No possible impact
Aspect
Site known to have had a previous leak incident or an integrity test failure
Tank and pipework construction
Results of a soil survey if carried out
High
With an element or elements of the ‘failed’ system still remaining
Any element is single walled steel
Indicates a high likelihood of ground movement or corrosion of metallic components
Medium
It is not known whether a leak has occurred
The system is non metallic but with some buried joints
Low
There has been no leakage from the current system
The entire system is non metallic with no buried joints
The survey shows no ground movement likely and no corrosion of metallic components likely
Chapter 7

20
Wetstock Reconciliation at Fuel Storage Facilities
Using Table 7.1 and 7.2: In each case the highest category established must be used when determining the classification of the site from Table 7.3, e.g. in Table 7.1, if your site is “low” in four cases and “medium” in one case, you must use “medium” in Table 7.3
Then use the following table to determine whether your site has a classification of
A (High risk), B (Medium risk) or C (Low risk)
Table 7.3 - Site Classification Table
A A
A
A
C
C
BHigh
High
Medium
Medium
Low
Low
B
B
Likelihood
Severity of impactSeverity of impact
Chapter 7

21
An Operator’s Guide
Also refer to the Blue Book tables 11.6 and 11.7 for suggested systems dependent on the types of tanks, pipework and physical leak detection devices existing on your site.
Classification C – Minimum Risk Level
All petrol stations must meet at least this minimum level, which is the accurate daily recording of wetstock and the calculation and analysis of cumulative data (see Chapter 3). This may be achieved by following the guidance provided and by the appropriate use of manual dipstick(s) for each storage tank or compartment and the use of paper records (provided in the appendix back pages) and/ or the use of spread sheets or other 3rd party systems.
It should be noted that meeting this minimum standard can still be challenging for sites with manual systems and procedures which are vulnerable to human error and work practices which are not well controlled. If an excessive loss is suspected, it can still incur considerable time and expense to find the cause of the loss and to stop it. It is therefore worth considering the merits of adopting a higher level of protection such as an SIR system as described under Classification B. The inevitable upfront and on-going running costs incurred in a higher level system should be considered in terms of the real costs incurred with the minimum risk level system, this is primarily your time and effort which, when costed fully, may not be dissimilar to that of some higher level systems.
Classification B – Medium Risk Level
Petrol stations with a medium risk of causing loss and damage should ensure they have adequate measures to control the risk without incurring undue cost of system replacement or upgrade.
Examples of adequate measures include:
1. A remotely monitored ATG system which has certified leak detection capability covering all parts of the tank and pipework system.
2. A Statistical Inventory Reconciliation (SIR) system which has a certified leak detection capability covering all parts of the tank and pipework system.
Chapter 8 Levels of Leak Detection or Containment Systems (appropriate for the site) Risk Assessment Classification
Chapter 8

22
Wetstock Reconciliation at Fuel Storage Facilities
SIR (Statistical Inventory Reconciliation)
This involves analysing your daily reconciliation data to establish a statistical variance (loss or gain) trend for each of your tanks, which takes into account all the cause factors explained earlier. When a leak or other unacceptable variance occurs an alarm condition is raised which is then validated and investigated. Using this service can greatly increase the accuracy of the leak detection because it can compare a single site against many sites using the same supply depot and therefore you can see how your site’s tanks perform with regards to their peers.
Classification A – High Risk Level
Petrol stations with a high risk of a leak, causing extensive loss and damage, should ensure that they have in place adequate measures to minimise the risk.
Examples of adequate measures include:
1. Secondary containment of the storage tanks, the suction or pressure system pipework and the remote or offset fill pipework.
2. Electronic sensors which directly detect fuel loss which is contained underneath dispensers or within tank manhole chambers.
3. Remotely monitored ATG systems which have certified leak detection capability covering all parts of the tank and pipework system.
4. A Statistical Inventory Reconciliation (SIR) system enhanced by real time data analysis which has certified leak detection capability covering all parts of the tank and pipework system.
5. For pressurised pipework systems, a certified electronic line leak detection system which will shut down the pumping system upon detection of a leak (indicated by pressure drop).
Measures 1 and 2 should prevent a leak to ground, whereas measures 3, 4 and 5 will detect a leak to ground, so it is vitally important that the detection time is minimised and therefore, it is recommended that these systems are capable of detecting a leak with a threshold equivalent to 9 litres per day and before 150 litres has been released to the ground.
Chapter 8

23
An Operator’s Guide
Real-Time Analysis
This method involves the detailed reconciliation of fuel sales and the corresponding tank stock level change for every customer sales transaction, which makes it possible to diagnose the cause of a loss much more quickly and sometimes without the need to undertake extensive on-site inspections and tests.
This method can be provided by qualified 3rd party service providers and you can seek advice about such providers and identify them via your petroleum regulatory authorities, trade representative groups, industry consultants or via the petrol station trade media.
Table 8.1 - Wetstock Reconciliation (leak detection) Methods
Risk
High
Med
Low
Classification
A
B
C
Method
SIR with real time analysis
SIR
Daily reconciliation in accordance with this Guide
Requirements
An ATG
An ATG is preferred but manual dipping is acceptable
Can be paper- based but spread sheet-based or other back office system is preferred
Manual dipping is acceptable
Chapter 8

24
Wetstock Reconciliation at Fuel Storage Facilities
Now, with the aid of this guide you are able to measure and track the normal variance of your tanks. Starting with the basic calculations and using them cumulatively to see trends you can spot leaks, faulty equipment, theft and many other issues sooner and more accurately. The guidance notes discussed above will help increase the likelihood of earlier leak detection.
However, small gradual leaks, which are very difficult to identify by visual inspection of your daily records may still be present on your site. For medium or high risk sites to spot these often more damaging leaks you may require a higher level of wetstock reconciliation analysis.
Subject to the result of your risk assessment if your site is deemed to be of medium risk then you should adopt a more advanced approach which is “SIR”. In the case where your site is at a high risk that a leak could occur and cause significant damage then you should adopt an enhanced form of SIR which uses ‘real time’ data analysis.
Chapter 9 Summary
Chapter 9

25
To benefit from carrying out good practice Wetstock Reconciliation, it is important to minimise the recording of incorrect stock readings, sales and delivery amounts and to know how to account for some of the many causes of variances seen.
This section aims to give guidance on minimising inaccurate stock readings, sales and delivery data and provide an understanding of the common causes and effects of variances on Wetstock Reconciliation.
1a) Variances through Tank Stock Measurement
It is advised to take readings at the same time every day using either a dipstick or tank gauge.
If using a dipstick, slowly and gently lower the dipstick until it touches the bottom of the tank (i.e. protective plate), quickly raise the dipstick and read the fuel level in litres. If your dipstick is in gallons you will need to use a gallon to litre table to convert your measurements to litres. Fuel finding paste can make it easier to read the dipstick.
Safety note; for tanks which are ‘direct fill’ (the tanker delivery hose is connected directly to the tank top fill pipe), the dipstick should be stored and used within the fill pipe. Where the dipstick is stored in a separate dipping tube, there is a significant risk of spillage during a delivery if the dip cap has not been secured. It is therefore highly recommended that a separate dip tube is not used.
In the case of tanks which are offset (remote) filled, manual dipping is not permitted and a tank contents gauge system should be installed.
Appendix 1 What Causes Variance?
An Operator’s Guide
Appendix 1

26
Wetstock Reconciliation at Fuel Storage Facilities
1a) i. Dipstick measuring
100 litres
200 litres
200 litres100 litres
Short dipstick
Tank iswider in the
middle
6000
5000
4000
3000
20001000
18000
17000
16000
1500014000130001200011000
10000
ProtectivePlate
Dipstickmiddleof tank
Dipstickbottomof tank
Volume increments
narrow in the middle of the
dipstick
Short dipstick: The correct dipstick on the left reads the fuel level as 100 litres
whereas the short dipstick wrongly reads 200 litres.
Wetstock Reconciliation at Fuel Storage Facilities
Appendix 1

27
An Operator’s Guide
Scenario: short dipstick example
> The bottom 5cm of the dipstick is missing, therefore the dipstick sits 5cm lower in the tank than it should.
> At the bottom of the tank our 5cm scale is equivalent to 1 division on the dipstick.
> 1 division represents 1 unit of volume; so here, 1 division is equal to 100 litres.
> Now instead of reading the first 100 litres, the dipstick would read 200 litres because the short dipstick is actually starting its reading from the first division rather than at zero.
> The matter gets worse when measuring at the middle of the tank because 5cm is now equivalent to 5 divisions and therefore measure 5 units of fuel more (i.e. 500 litres more).
> Wetstock records will have incorrect readings because the amount of fuel will be overestimated, by varying amounts, depending on the volume in the tank.
0Best Practice Tips & Important points - Using your Dipsticks:
> Ensure your dipstick measurements start at the bottom, from zero.
> Check there are no signs of wear on the dipstick.
> Tanks using dipsticks must have a protective plate above the base of the tank to prevent damage to the tank from the dipstick.
> Each division on the dipstick represents a volume of fuel.
> Divisions at the middle of the tank are smaller than those at the bottom or top (as shown previously).
> Each dipstick is specific to the dimensions of an individual tank; check you have the correct dipstick.
> Ensure the dipstick sits in the middle of the tank.
> Dipstick readings can be affected by Vapour Recovery Systems (see section 1d).
An Operator’s Guide
Appendix 1

28
Wetstock Reconciliation at Fuel Storage Facilities
1a) ii. Tank Contents Gauges
Hydrostatic Tank Gauges
Description
Hydrostatic Gauges based on pressure can have a similar accuracy as a dipstick. The pressure applied to the fuel in the tank to read the measurement is dependent on the volume of fuel i.e. the deeper the fuel the more pressure applied.
Problems
> The gauges can become unbalanced and give incorrect readings
> As with dipsticks this system has problems accounting for the effects of Vapour Recovery due to the increased and decreased pressure from Vapour (Section 1d)
Digital Gauges – Magnetostrictive probes
Description
These probes come in different sizes and use 2 magnetic floats to take readings. The top float will measure fuel, the other water, and will rise and fall when stock levels change.
Problems
> A build-up of deposit and the float sticking
> Float can get jammed following an overfill
> Inaccurate calibration or failure to recalibrate the probe following a fuel grade change
Digital Gauges – Capacitance probes
Description
The Capacitance probe comprises a series of capacitor segments which detect the liquid level in a vessel.
Problems
> Poor initial Calibration
> Probe can become contaminated
> Electronic drift during life of probe
Wetstock Reconciliation at Fuel Storage Facilities
Appendix 1

29
An Operator’s Guide
1a) iii. Water
> It is important to check for water in each tank and record the results weekly or, ideally, on a daily basis.
> To check for water, water-finding paste may be used, the paste changes colour when it comes into contact with water. The results should be recorded on your Weekly Loss / Gain Sheet.
> Gaining variances in your Wetstock Reconciliation Data can indicate a possible water ingress problem and therefore it is good practice to check for water in the tank if gains are seen.
1b) Variances through Sales
> It is important to record accurate sales amounts in your Wetstock Reconciliation Worksheet to allow you to identify any lost fuel that may not be accounted for in the sales record. Variances can occur if amounts are incorrect or simply missing from the records.
> How accurately your fuel pump meters are performing will have an impact on the fuel dispensed and sold. It is possible that you could be giving fuel away on each sale made and, depending on how poor the meter readings are, it is possible you could be working outside legal tolerances. So it is recommended to get meters checked annually and reset to strike (zero) if required.
See part 1e: Common variances and their solutions.
An Operator’s Guide
Appendix 1

30
Wetstock Reconciliation at Fuel Storage Facilities Wetstock Reconciliation at Fuel Storage Facilities
1c) Variances through Deliveries
> It is important to record accurate delivery amounts on your Wetstock Reconciliation Worksheet following fuel delivery to allow you to identify any lost fuel.
> It is important that you check all fuel deliveries have gone into the correct tank.
> Fuel which is warmer on delivery than the ambient in-tank temperature will shrink; likewise, fuel which is cooler on delivery than the ambient in-tank temperature will expand. This will help to explain why you may have losses or gains.
> You MUST use the ticketed fuel amount (i.e. the fuel amount on the bill of loading /invoice – i.e. whichever you pay for). This may be volume measured at either ambient temperature or converted to the volume of the fuel if it were at standard 15 degrees (standard temperature accounting). You should note on your records which measurement method is used.
> As a check, it is good practice to take readings before and after the delivery (allow 5 minutes to settle) to calculate that the delivery amount matches roughly to the ticketed amount.
> If you identify an excessive variance as a result of a delivery then you should firstly check this is not normally the case on all deliveries. Then contact your supplier to check if the correct quantity was delivered. If all the recommended checks have not resolved the discrepancy and your tanks are offset filled, you should consider the possibility of a leak in the offset fill pipework and have it tested.
See part 1e: Common variances and their solutions.
Motor spirits: with every 1°C increase in temperature there is an approx. 0.11% increase in volume and vice versa
Appendix 1

31
An Operator’s GuideAn Operator’s Guide
1d) Variances through Vapour Recovery Systems (Stage 1b)
Vapour recovery systems introduce pressure differences inside your tank, the increase and decrease of pressures in the tanks’ ullage space has an adverse effect on dipstick measurements and pressure based unmodified tank gauges (Hydrostatic/Analogue) effecting the readings of the tanks stock levels.
Following Delivery:● Pressure builds in the tank● Compressed vapour in the tank forces the fuel to rise up the ll pipe.● Any Tank Gauge or Dipstick located in the ll pipe will over- estimate the amount of fuel in the tank.
Vapour recovery stage 1b – the basics● Tanker delivers fuel into tank.● Vapour extracted from ullage space in the tank and taken through the vapour recovery system.● Vapour deposited into tanker.
A Pressure Relief Valve as shown can be installed on dipstick or unmodied hydrostatic systems. This will help to take more accurate readings. The valve is opened before taking a dip and before deliveries to balance the pressure. The handle is pulled down on the valve to allow pressure in the tank to equalize by allowing vapour to be vented.
As Fuel is sold:● The pressure drops and a partial vacuum can be created causing the fuel level in the ll pipe to drop.● Any Tank Gauge or Dipstick located in the ll pipe will under- estimate the amount of fuel in the tank.
Potential over�ll danger when contents under-estimated.
Appendix 1

32
1e) Common Variances and their Solutions
Variance Problem
Delivery during day end routine
Delivery recorded in wrong tank
Delivery recorded as wrong quantity
Split pots delivery
Missing Sales
Pump calibration
Definition
Delivery is partially complete when the day end is run
Common problem on sites with two tanks of the same grade, a delivery may be recorded in the wrong tank
Delivery as recorded in paper work does not match volume delivered
Fuel from a single tanker delivery pot (compartment) is split between two tanks.
Sales are not transferred correctly from pump to point of sale
Pump meters may be over or under dispensing
Effect on data
A large loss on the day’s delivery is recorded. This is balanced the next day by an equivalent gain, or vice versa, depending on which day the delivery is recorded
A large gain in the tank which has physically received delivery. Equivalent loss in tank which had the delivery recorded in the paper work but has not physically received the delivery
Loss shown on delivery day when the volume delivered is less than the volume recorded. Gain shown when the volume delivered is greater than the volume recorded
Large wetstock variances occur on the two tanks that the delivery was split between. The sum of the two variances will roughly balance
Increase in losses on tank concurrent with a reduction in sales for the tank
Over dispensing pumps increase the cumulative percentage loss from a site. Under dispensing pumps decrease the losses from a site. The legal tolerance on inspection ranges from +1% to -0.5%
Solution
Either run the day end routine before the delivery starts, delay the day end routine until the delivery has been completed, or use a tank dip reading taken immediately prior to delivery as the closing stock for the day
Check paper work on delivery days and ensure that deliveries are accurately recorded in the correct tank
Check your delivery documentation when recording delivery quantities in paper work. Do not assume that the volume ordered has been delivered
Try to avoid splitting pots on delivery. It will introduce errors into the wetstock data which can be difficult to account for
Compare sales as recorded through pump totalisers and through till on a regular basis
Pump meter inaccuracy has a significant effect on your data. In the event of a change in cumulative variance, check pumps for a change in calibration. Note any pump which is outside the legal tolerance must not be used until it has been reset and approved by the NSAI Legal Metrology Services (LMS)
Wetstock Reconciliation at Fuel Storage Facilities
Appendix 1

33
Variance Problem
Unsynchronised day end routine
Administration errors
Tank gauge (ATG) calibration
Short/Incorrect size dipstick
Vapour recovery with dipsticks or unbalanced hydrostatic tank gauges
Evaporation
Definition
Fuel sales are not totalled at the same time as the closing tank stock is recorded
Data incorrectly entered in wetstock records
Tank Gauge is inaccurately calibrated for the tank
Dipstick is not the correct length for the tank
Vapour recovery creates pressure differences in the tank. This has an adverse effect on tank stock readings
Fuel is a volatile product which evaporates
Effect on data
Loss on the day is approximately equal to the volume of fuel sold during day end which is counter balanced the next day
Large variances
Inaccurate tank gauge readings
Large wetstock variances recorded
Changes in tank pressure affect tank stock readings
Evaporation results in increased losses. There is much less evaporation from Diesel, which typically shows lower losses than motor spirit grades
Solution
Take closing stock reading at the same time as day end routine is run
Check data especially on delivery days or after pump tests
Arrange for tank gauge recalibration and, in the meantime, account for stock level in tank when examining wetstock data
Replace dipstick
Fit a pressure relief valve (dump valve) where possible
Evaporation will be highest in summer months. The effects of evaporation are particularly marked on low selling grades such as SUL. Vapour saving devices are available which could help to reduce loss through evaporation
An Operator’s Guide
Appendix 1

34
2a) Best Practice
By using the best practice set out within this guide, you can reduce the risk of your site having any harmful impact on the local community and the local environment.
If you work through the wetstock calculations and introduce the use of cumulative percentage variance onto your site, you could improve the quality of your wetstock management dramatically. This will allow you to effectively and efficiently detect leaks or any other wetstock problems on your site.
This will, in turn, protect the local community, protect the environment and maximise your profits on your site.
Appendix 2 Quick guides
Item
Using a dipstick to take readings
Dipstick proper use and care.
Best Practice
Ensure your dipstick measurements start at the bottom from zero.
Each division on the dipstick represents a volume of fuel with divisions at the middle of the tank smaller than those at the bottom or top; ensure you are aware of the scale.
Non-24 hour site -Take accurate readings and record them immediately when upon closing the site.
24 hour site - Close half your site (for example at 10pm), take accurate readings and record them, then do the other half.
Slowly and gently lower the dipstick until it touches the protective plate then quickly raise the dipstick and read the fuel level in litres.
Check there are no signs of wear on the dipstick.
Tanks using dipsticks must have a protective plate above the base of the tank to prevent damage to the tank from the dipstick.
Each dipstick is specific to the dimensions of an individual tank; check you have the correct one.
Ensure the dipstick sits in the middle of the tank.
Dipstick readings can be affected by Vapour Recovery Systems (see section 1d).
Wetstock Reconciliation at Fuel Storage Facilities
Appendix 2

35
Item
Recording Wetstock Reconciliation
Acting on Variances
Using Cumulative Variances
Vapour Recovery with dipsticks or hydrostatic gauges.
Checking delivery amounts
Selling the correct amount of fuel?
Deviations from normal tank trend?
How do I take water measures and how often?
Dealing with Health and Safety Risks
SIR (Statistical Inventory Reconciliation)
Best Practice
Ensure you use the ticketed delivery amounts in your data. Using a spread sheet to record data will make it easier to keep track of data and allow you to produce charts easily.
Variances can be gains as well as losses. Check all unusual variances to understand why they have occurred and ensure any further investigations are carried out.
As well as daily variances, calculating Cumulative Percentage Variances will give a better indication of your tanks overall variance trend over time. You can use this to identify a deviation from your tanks normal variance trend.
Installing a Pressure Relief Valve (Dump Valve) on dipstick or unmodified hydrostatic systems will help to take more accurate readings.
Always use the ticked delivery amount. As a check, take note of the temperature and take fuel stock level readings before and after the delivery allowing 5 minutes to settle. Ensure deliveries are dropped into the correct tanks.
Get meters checked annually and, if required, get them reset to strike (zero) to ensure you are not giving fuel away, and also to ensure you are not working outside legal tolerances.
Ensure you investigate the reason for the change and carry out action to solve the issue. Ensure you and your staff have an escalation procedure in place to deal with deviations.
Take regular weekly (or ideally daily) water measures for each tank. Use water finding paste, this will change colour to identify water if any exists in your tank.
If you suspect a leak, it is vital to tell the Local Authority Fire Brigade and Environmental Section as quickly as possible for advice in order to minimise health and safety risks and to protect the environment.
Use SIR for advanced Leak Detection to detect earlier and smaller leaks preventing significant safety / pollution incidents.
An Operator’s Guide
Appendix 2
36
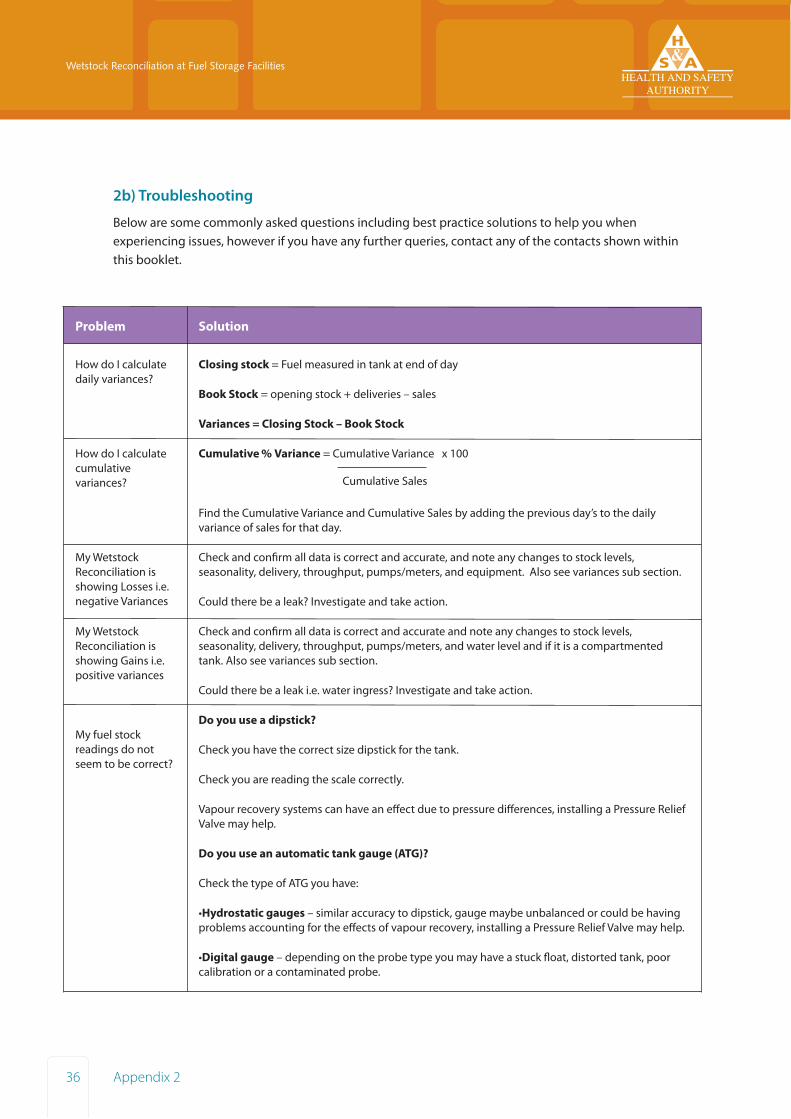
2b) Troubleshooting
Below are some commonly asked questions including best practice solutions to help you when experiencing issues, however if you have any further queries, contact any of the contacts shown within this booklet.
Problem
How do I calculate daily variances?
How do I calculate cumulative variances?
My Wetstock Reconciliation is showing Losses i.e. negative Variances
My Wetstock Reconciliation is showing Gains i.e. positive variances
My fuel stock readings do not seem to be correct?
Solution
Closing stock = Fuel measured in tank at end of day
Book Stock = opening stock + deliveries – sales
Variances = Closing Stock – Book Stock
Cumulative % Variance = Cumulative Variance x 100
Find the Cumulative Variance and Cumulative Sales by adding the previous day’s to the daily variance of sales for that day.
Check and confirm all data is correct and accurate, and note any changes to stock levels, seasonality, delivery, throughput, pumps/meters, and equipment. Also see variances sub section.
Could there be a leak? Investigate and take action.
Check and confirm all data is correct and accurate and note any changes to stock levels, seasonality, delivery, throughput, pumps/meters, and water level and if it is a compartmented tank. Also see variances sub section.
Could there be a leak i.e. water ingress? Investigate and take action.
Do you use a dipstick?
Check you have the correct size dipstick for the tank.
Check you are reading the scale correctly.
Vapour recovery systems can have an effect due to pressure differences, installing a Pressure Relief Valve may help.
Do you use an automatic tank gauge (ATG)?
Check the type of ATG you have:
• Hydrostatic gauges – similar accuracy to dipstick, gauge maybe unbalanced or could be having problems accounting for the effects of vapour recovery, installing a Pressure Relief Valve may help.
•Digital gauge – depending on the probe type you may have a stuck float, distorted tank, poor calibration or a contaminated probe.
Cumulative Sales
Wetstock Reconciliation at Fuel Storage Facilities
Appendix 2

37
Problem
I seem to be losing fuel on a day when I have had a delivery.
I seem to be losing fuel on sales.
Could temperature cause an increase in losses?
My Super fuel variances are very erratic compared to other fuels on my site why?
I am only finding leaks when they are larger losses, how can I find them sooner before they become a bigger problem?
I have checked all my data in my Wetstock Reconciliation is correct and I’m still seeing losses.
I think I have a leak what should I do?
Solution
Check delivery amount is accurate and has been taken into the correct tank. Possible issue with fill point. Also check variances sub-section.
You may have a leak or you may have meter issues, investigate.
Yes, There are generally increases in losses during warmer summer months and increased gains in winter months due to the fuel contracting or expanding. Although you should still check that you don’t have a leak.
Variances on low selling fuels will be accentuated as the percentage loss on the tank is calculated based on sales.
Using statistical methods to detect earlier and smaller leaks will help. You may wish to speak to a company who can offer this support for you.
Have you changed your delivery supplier? If not you may have a leak so you will need to escalate and investigate or you may have had a theft.
Inform your Local Authority, Fire Officer and Environmental section and take any action to minimise the health and safety risks.
An Operator’s Guide
Appendix 2
38
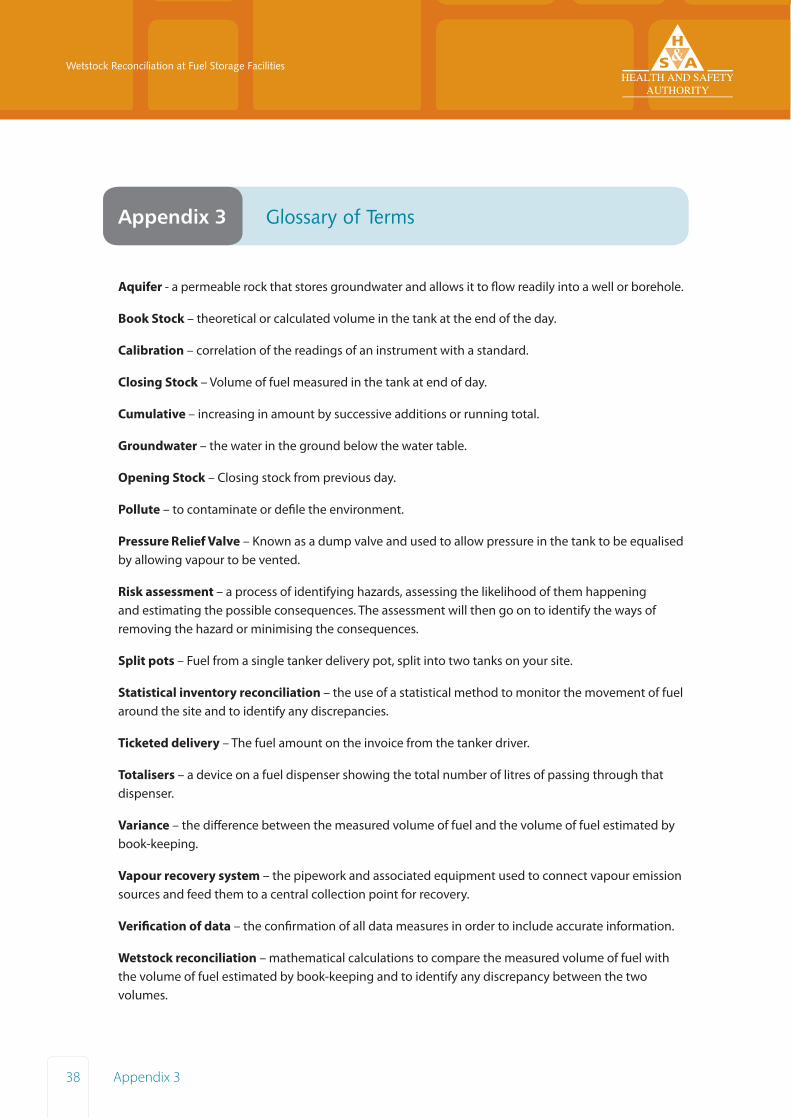
Aquifer - a permeable rock that stores groundwater and allows it to flow readily into a well or borehole.
Book Stock – theoretical or calculated volume in the tank at the end of the day.
Calibration – correlation of the readings of an instrument with a standard.
Closing Stock – Volume of fuel measured in the tank at end of day.
Cumulative – increasing in amount by successive additions or running total.
Groundwater – the water in the ground below the water table.
Opening Stock – Closing stock from previous day.
Pollute – to contaminate or defile the environment.
Pressure Relief Valve – Known as a dump valve and used to allow pressure in the tank to be equalised by allowing vapour to be vented.
Risk assessment – a process of identifying hazards, assessing the likelihood of them happening and estimating the possible consequences. The assessment will then go on to identify the ways of removing the hazard or minimising the consequences.
Split pots – Fuel from a single tanker delivery pot, split into two tanks on your site.
Statistical inventory reconciliation – the use of a statistical method to monitor the movement of fuel around the site and to identify any discrepancies.
Ticketed delivery – The fuel amount on the invoice from the tanker driver.
Totalisers – a device on a fuel dispenser showing the total number of litres of passing through that dispenser.
Variance – the difference between the measured volume of fuel and the volume of fuel estimated by book-keeping.
Vapour recovery system – the pipework and associated equipment used to connect vapour emission sources and feed them to a central collection point for recovery.
Verification of data – the confirmation of all data measures in order to include accurate information.
Wetstock reconciliation – mathematical calculations to compare the measured volume of fuel with the volume of fuel estimated by book-keeping and to identify any discrepancy between the two volumes.
Appendix 3 Glossary of Terms
Wetstock Reconciliation at Fuel Storage Facilities
Appendix 3

39
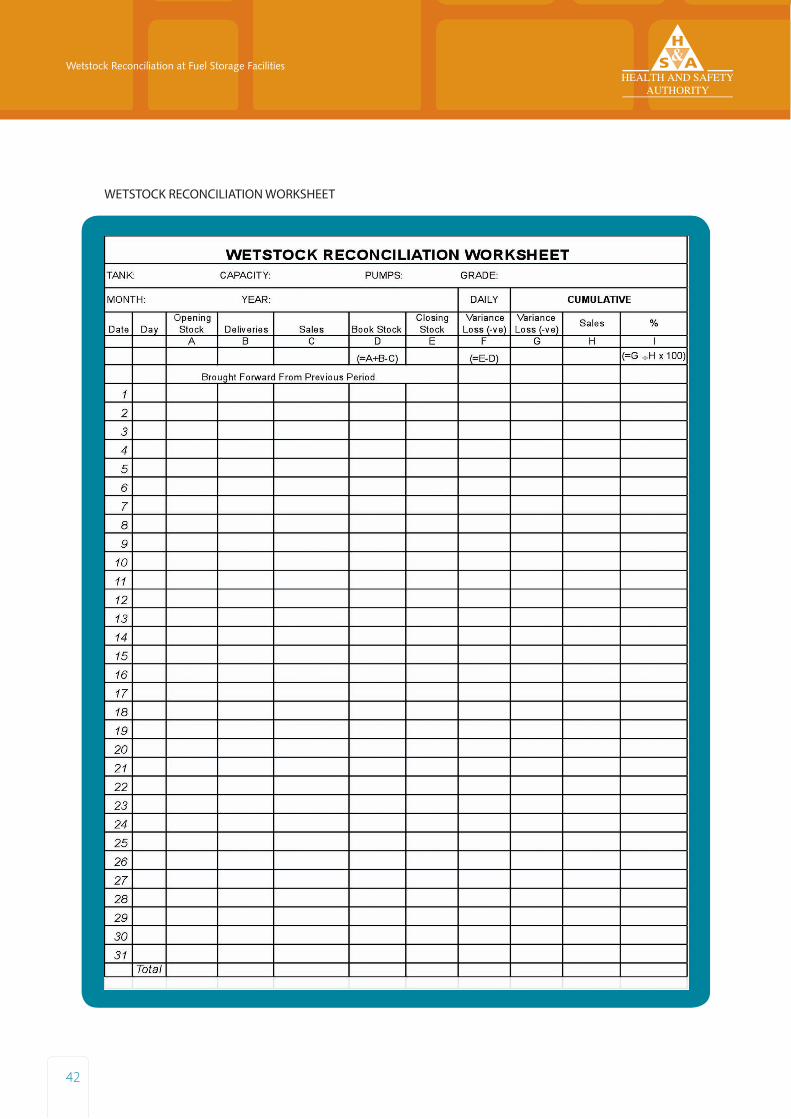
The following two tables (for month 1 and month 2) illustrate how to record wetstock data, monthly variance trend (totals and cumulative percentage variance) and a running cumulative percentage variance. Your cumulative data can be carried forward from month to month using the three right hand columns.
Station Name: EXAMPLE
Appendix 4 Wetstock Reconciliation Worksheet
An Operator’s Guide
Appendix 4

40
Station Name: EXAMPLE
Wetstock Reconciliation at Fuel Storage Facilities
Appendix 4

41
WETSTOCK RECONCILIATION WORKSHEET
An Operator’s Guide
Appendix 4
42
Wetstock Reconciliation at Fuel Storage Facilities
WETSTOCK RECONCILIATION WORKSHEET


Cyan 100%Magenta 76%Yellow 0Black 27%
A country where worker safety, health
and welfare and the safe management
of chemicals are central to successful
enterprise
ISBN No: 978-1-84496-193-1 HSA0417