wetlands mapping using lidar
TRANSCRIPT
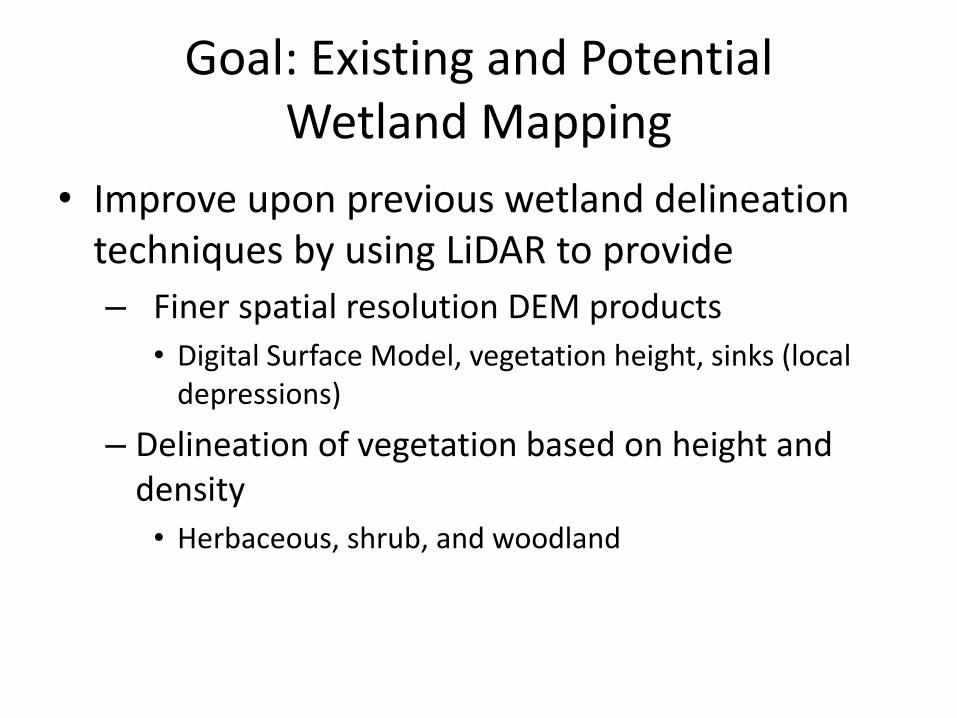
Goal: Existing and Potential Wetland Mapping
• Improve upon previous wetland delineation techniques by using LiDAR to provide
– Finer spatial resolution DEM products
• Digital Surface Model, vegetation height, sinks (local depressions)
– Delineation of vegetation based on height and density
• Herbaceous, shrub, and woodland
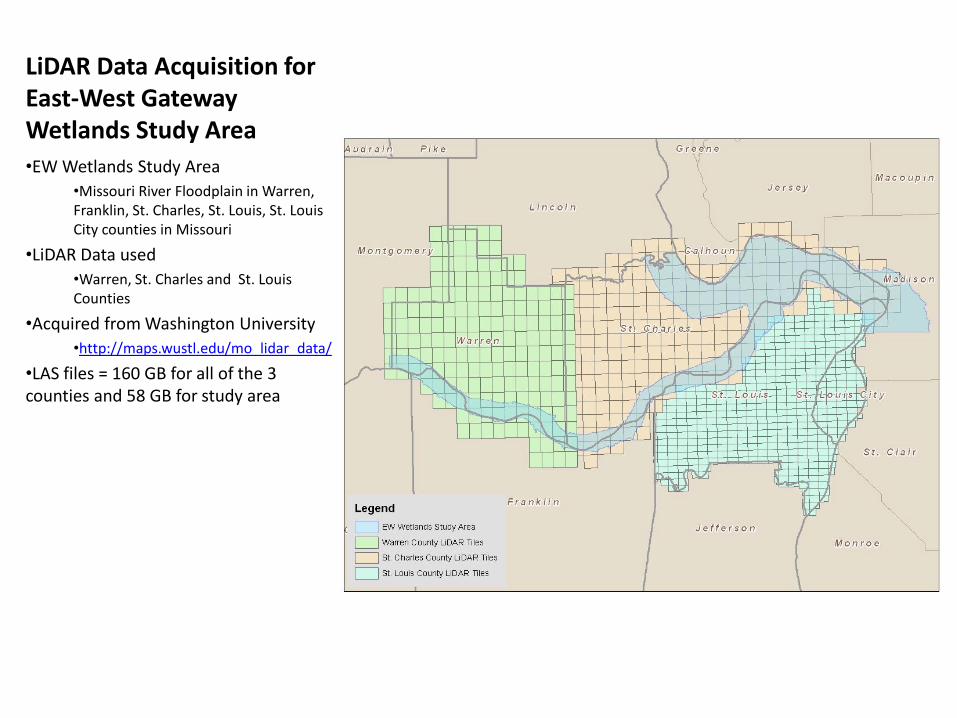
LiDAR Data Acquisition for East-West Gateway Wetlands Study Area
•EW Wetlands Study Area
•Missouri River Floodplain in Warren, Franklin, St. Charles, St. Louis, St. Louis City counties in Missouri
•LiDAR Data used
•Warren, St. Charles and St. Louis Counties
•Acquired from Washington University
•http://maps.wustl.edu/mo_lidar_data/
•LAS files = 160 GB for all of the 3 counties and 58 GB for study area
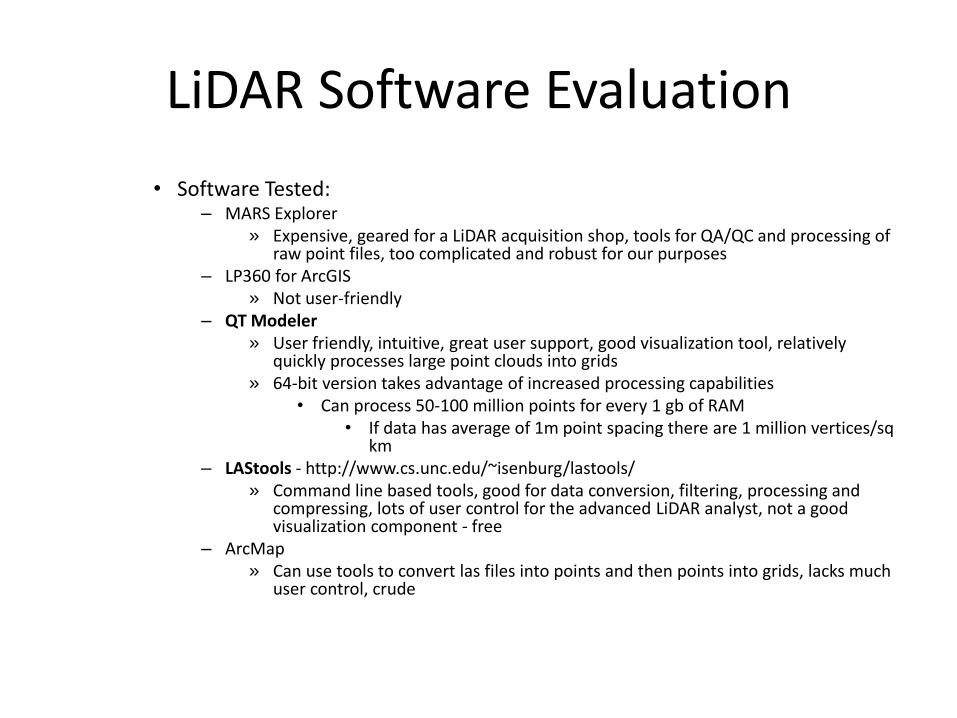
LiDAR Software Evaluation
• Software Tested: – MARS Explorer
» Expensive, geared for a LiDAR acquisition shop, tools for QA/QC and processing of raw point files, too complicated and robust for our purposes
– LP360 for ArcGIS » Not user-friendly
– QT Modeler » User friendly, intuitive, great user support, good visualization tool, relatively
quickly processes large point clouds into grids » 64-bit version takes advantage of increased processing capabilities
• Can process 50-100 million points for every 1 gb of RAM • If data has average of 1m point spacing there are 1 million vertices/sq
km – LAStools - http://www.cs.unc.edu/~isenburg/lastools/
» Command line based tools, good for data conversion, filtering, processing and compressing, lots of user control for the advanced LiDAR analyst, not a good visualization component - free
– ArcMap » Can use tools to convert las files into points and then points into grids, lacks much
user control, crude
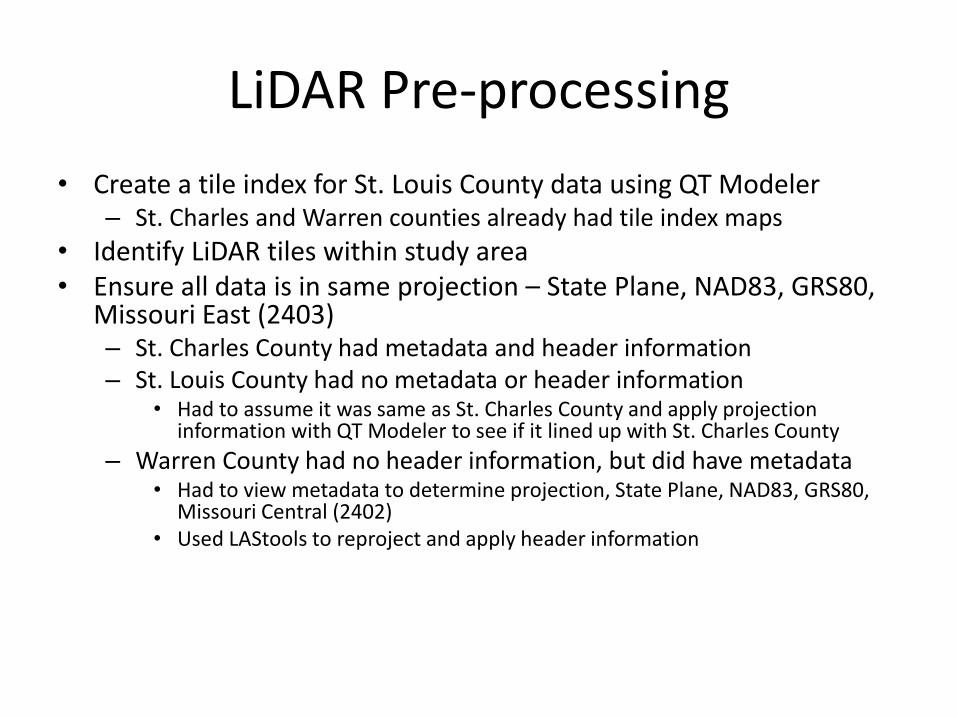
LiDAR Pre-processing
• Create a tile index for St. Louis County data using QT Modeler – St. Charles and Warren counties already had tile index maps
• Identify LiDAR tiles within study area • Ensure all data is in same projection – State Plane, NAD83, GRS80,
Missouri East (2403) – St. Charles County had metadata and header information – St. Louis County had no metadata or header information
• Had to assume it was same as St. Charles County and apply projection information with QT Modeler to see if it lined up with St. Charles County
– Warren County had no header information, but did have metadata • Had to view metadata to determine projection, State Plane, NAD83, GRS80,
Missouri Central (2402) • Used LAStools to reproject and apply header information
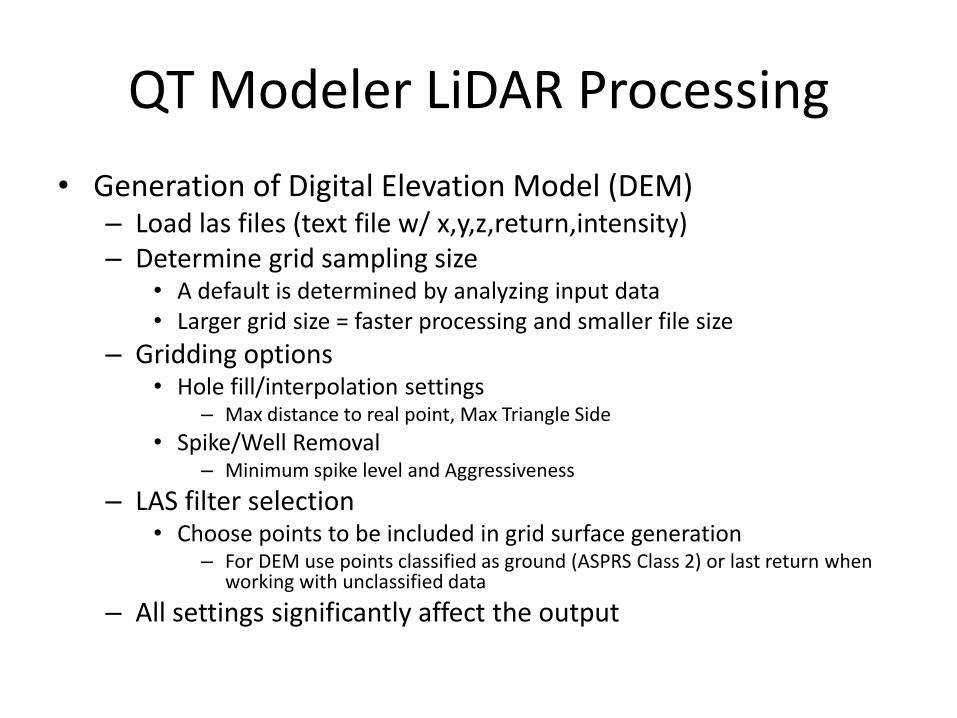
QT Modeler LiDAR Processing
• Generation of Digital Elevation Model (DEM) – Load las files (text file w/ x,y,z,return,intensity) – Determine grid sampling size
• A default is determined by analyzing input data • Larger grid size = faster processing and smaller file size
– Gridding options • Hole fill/interpolation settings
– Max distance to real point, Max Triangle Side
• Spike/Well Removal – Minimum spike level and Aggressiveness
– LAS filter selection • Choose points to be included in grid surface generation
– For DEM use points classified as ground (ASPRS Class 2) or last return when working with unclassified data
– All settings significantly affect the output
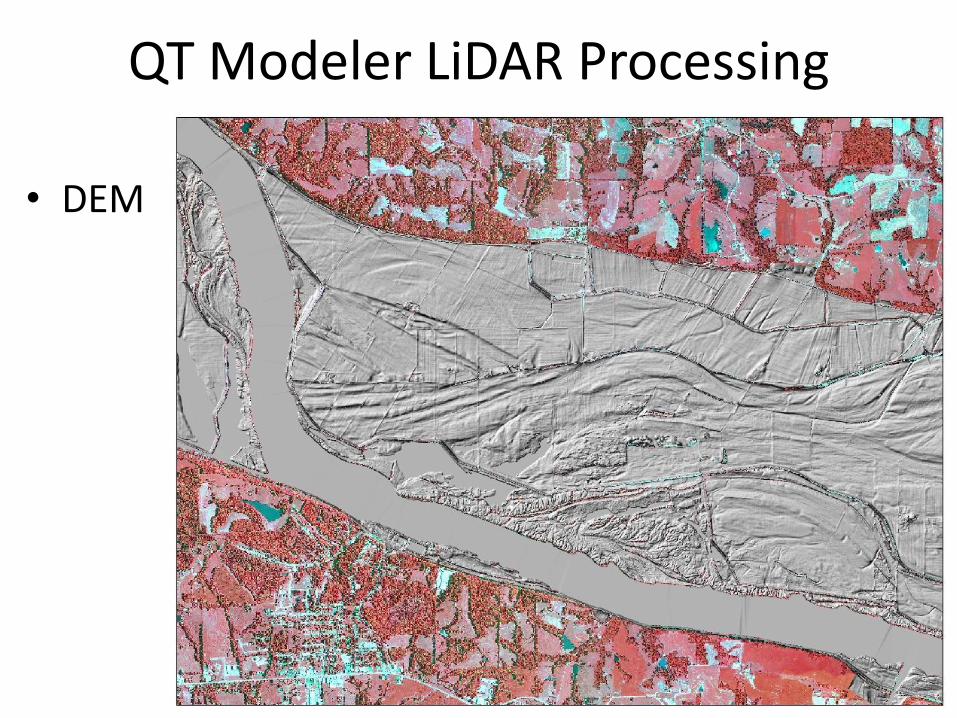
QT Modeler LiDAR Processing
• DEM
QT Modeler LiDAR Processing
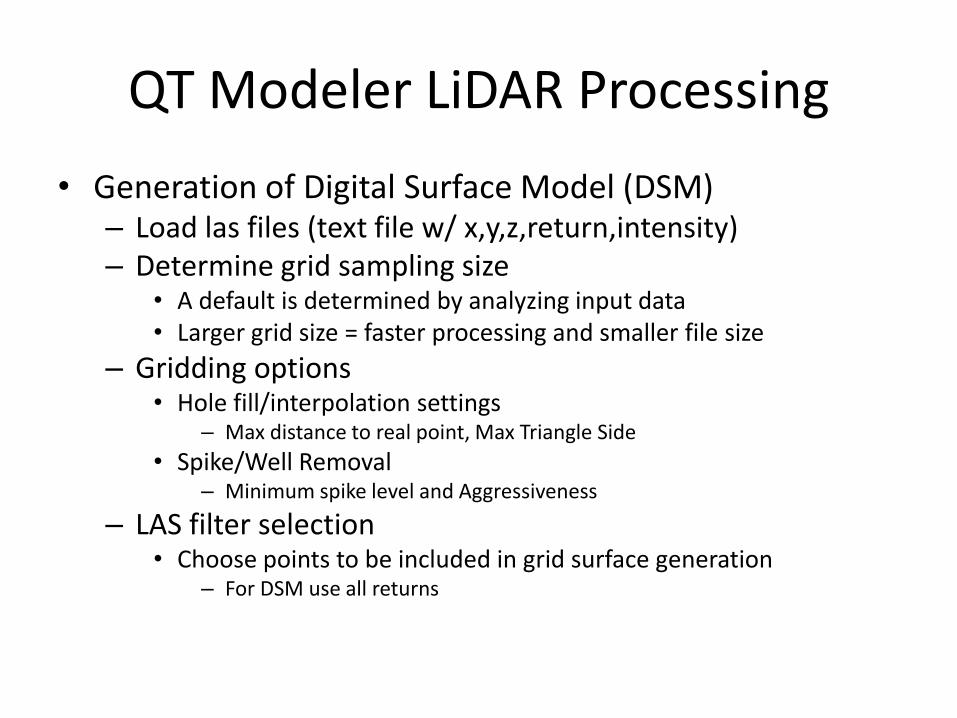
• Generation of Digital Surface Model (DSM) – Load las files (text file w/ x,y,z,return,intensity) – Determine grid sampling size
• A default is determined by analyzing input data • Larger grid size = faster processing and smaller file size
– Gridding options • Hole fill/interpolation settings
– Max distance to real point, Max Triangle Side
• Spike/Well Removal – Minimum spike level and Aggressiveness
– LAS filter selection • Choose points to be included in grid surface generation
– For DSM use all returns
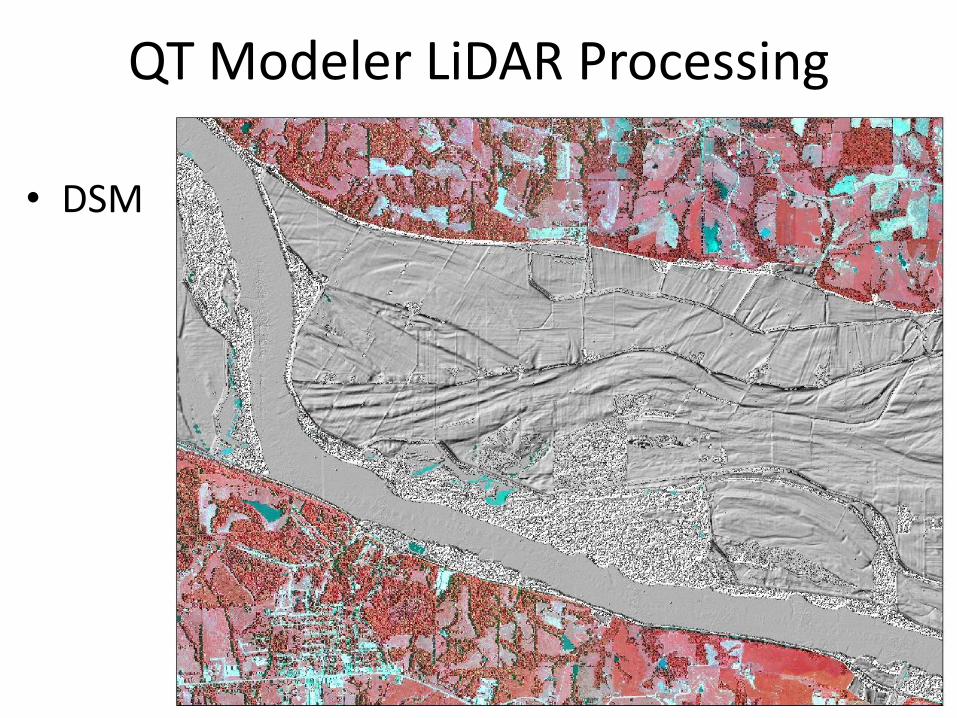
QT Modeler LiDAR Processing
• DSM

Quick Terrain Modeler Image
LiDAR DSM Grid
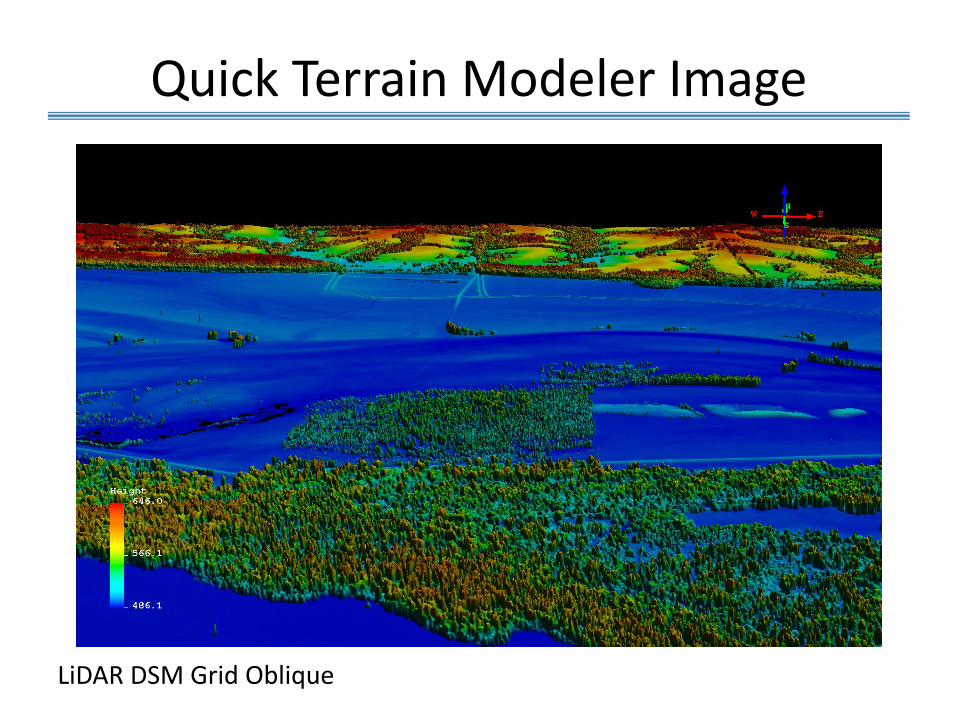
Quick Terrain Modeler Image
LiDAR DSM Grid Oblique
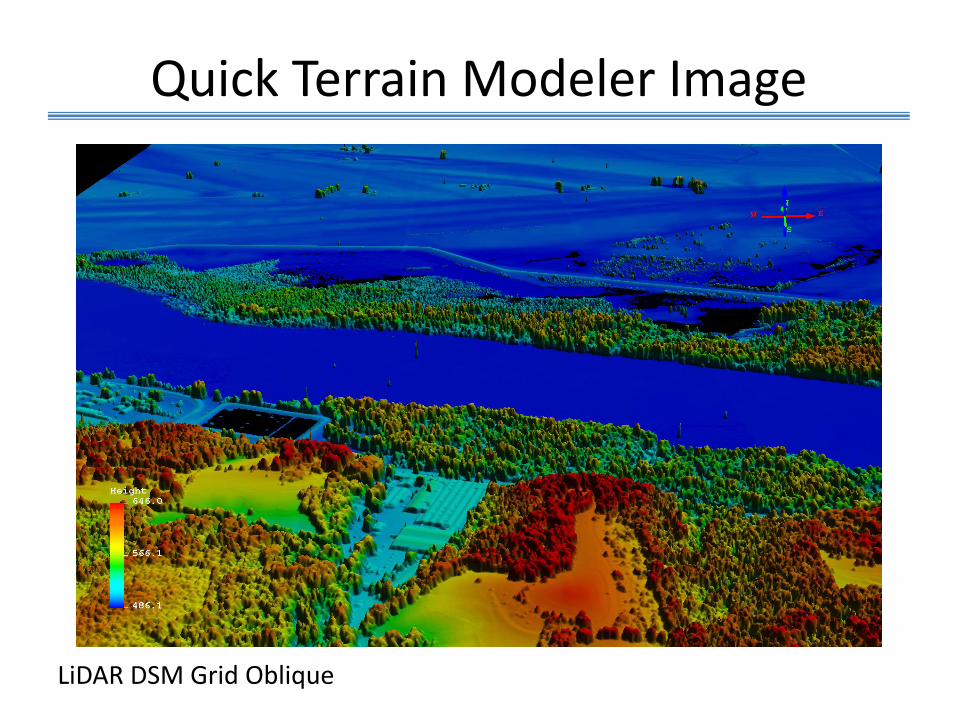
Quick Terrain Modeler Image
LiDAR DSM Grid Oblique
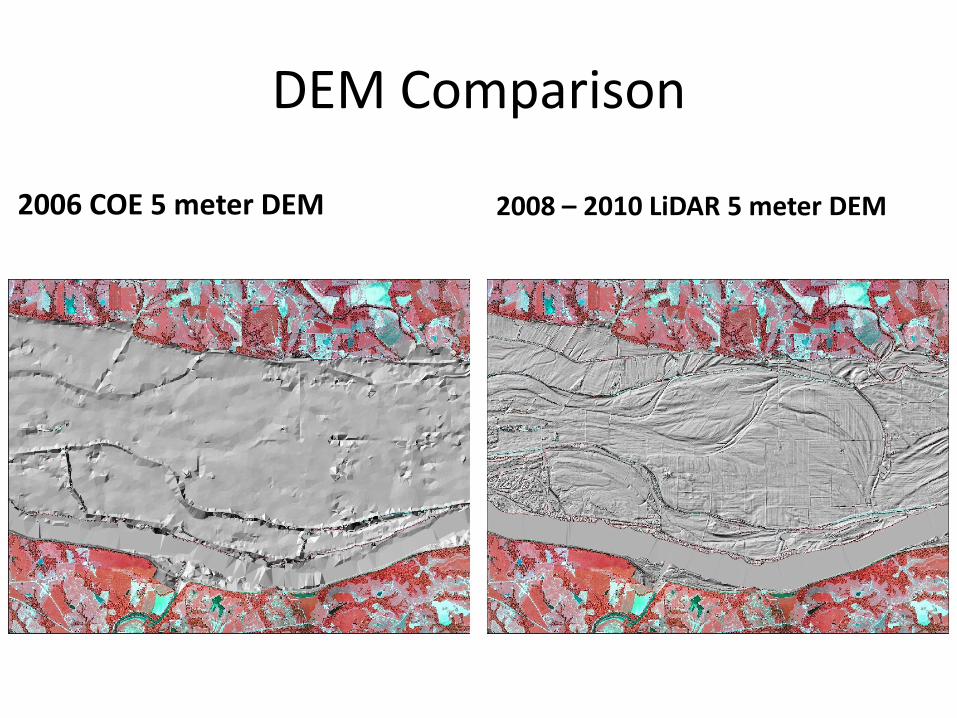
DEM Comparison
2006 COE 5 meter DEM 2008 – 2010 LiDAR 5 meter DEM
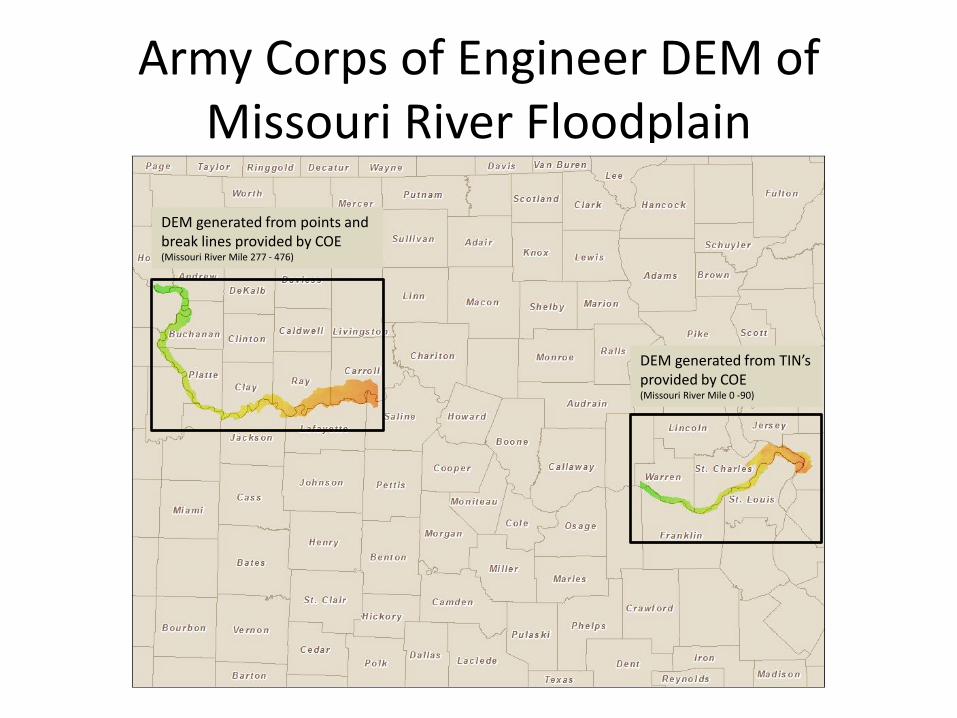
Army Corps of Engineer DEM of Missouri River Floodplain
DEM generated from points and break lines provided by COE (Missouri River Mile 277 - 476)
DEM generated from TIN’s provided by COE (Missouri River Mile 0 -90)
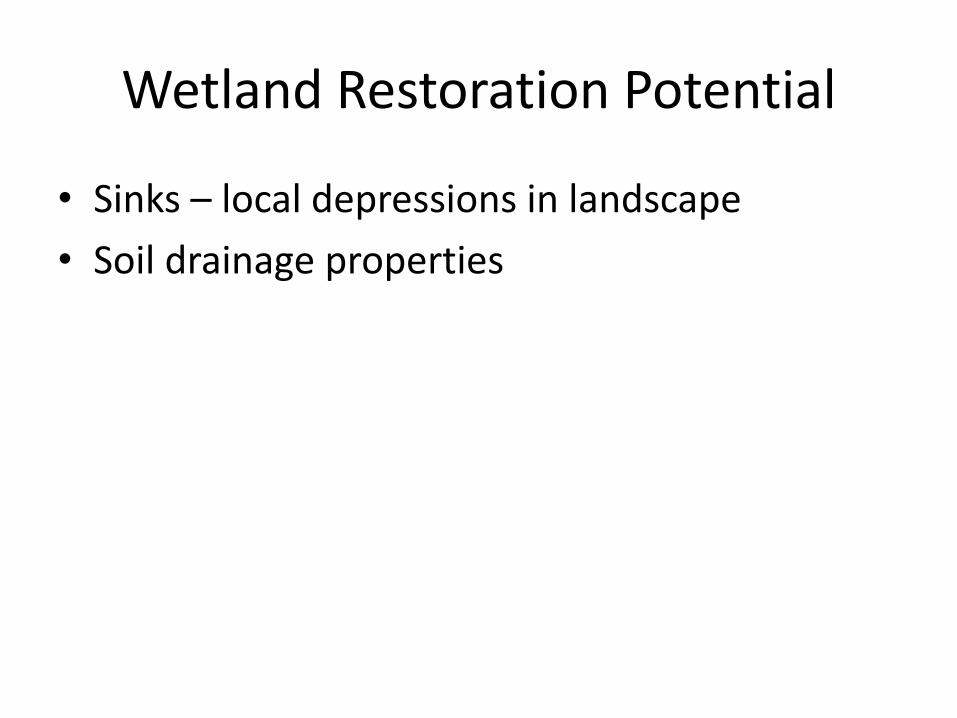
Wetland Restoration Potential
• Sinks – local depressions in landscape
• Soil drainage properties
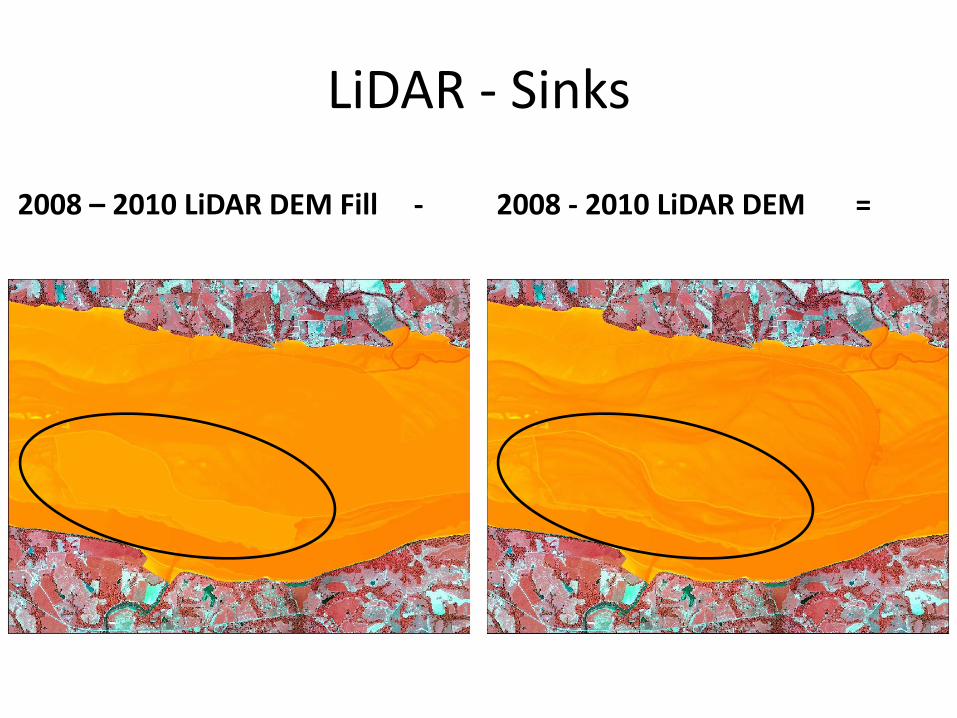
LiDAR - Sinks
2008 - 2010 LiDAR DEM = 2008 – 2010 LiDAR DEM Fill -
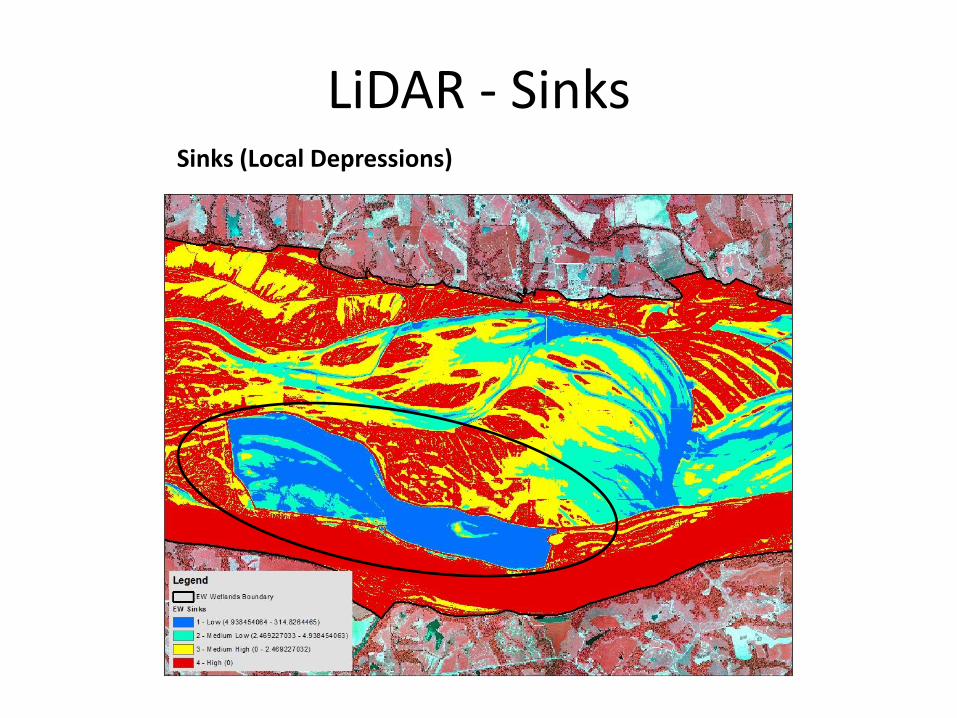
LiDAR - Sinks Sinks (Local Depressions)

LiDAR vs. COE DEM Sinks Comparison
COE 5 m Sinks LiDAR 5 m Sinks
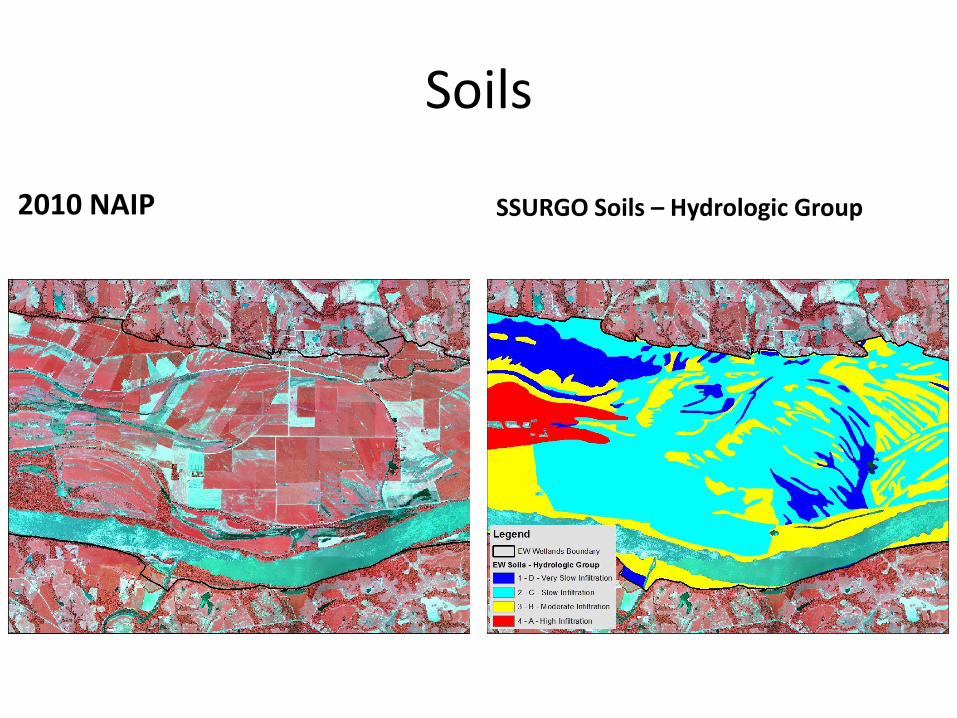
Soils
2010 NAIP SSURGO Soils – Hydrologic Group

Soils
2010 NAIP SSURGO Soils – Drainage Class
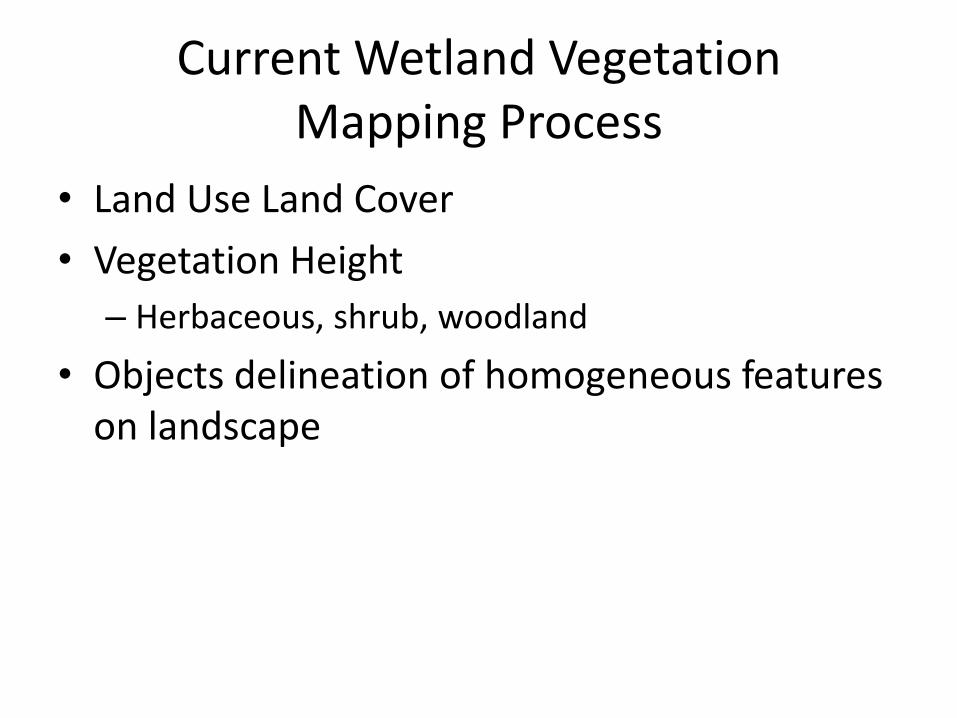
Current Wetland Vegetation Mapping Process
• Land Use Land Cover
• Vegetation Height
– Herbaceous, shrub, woodland
• Objects delineation of homogeneous features on landscape
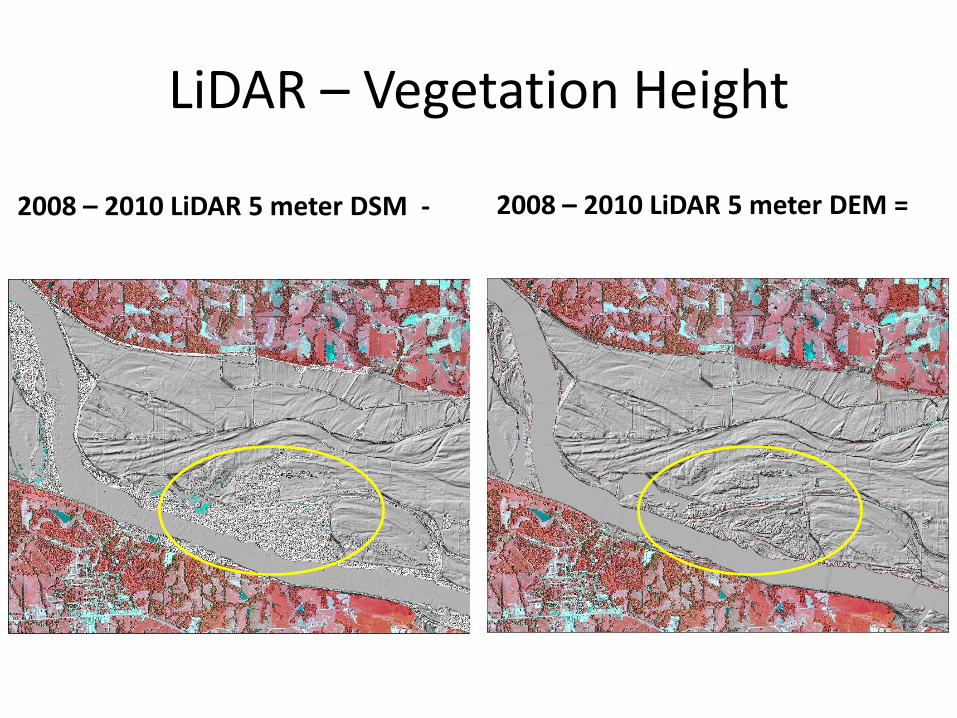
LiDAR – Vegetation Height
2008 – 2010 LiDAR 5 meter DEM = 2008 – 2010 LiDAR 5 meter DSM -

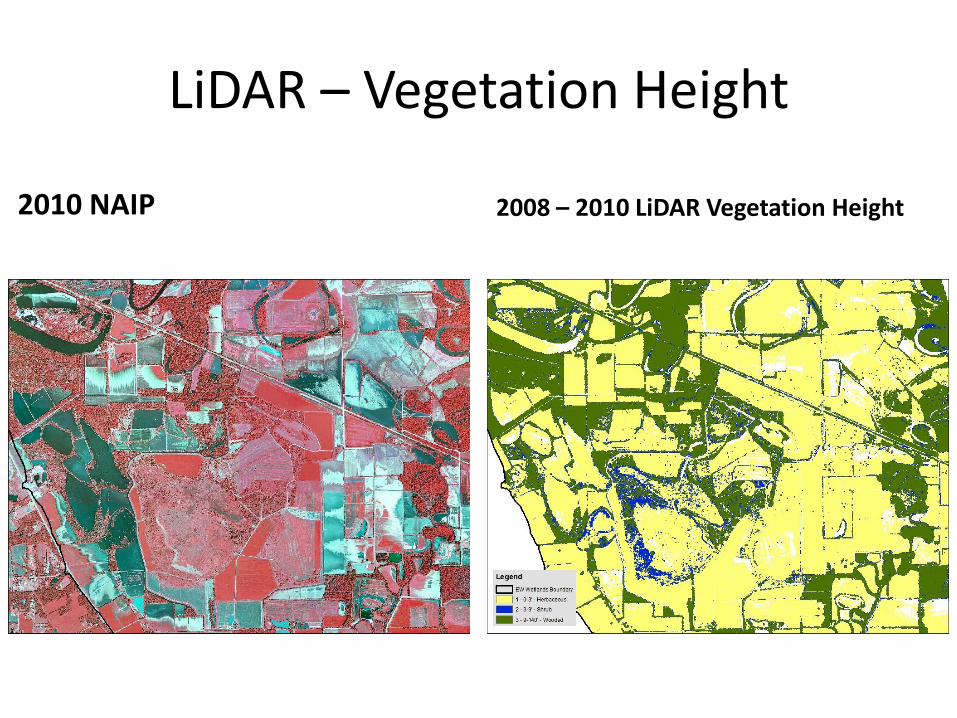
LiDAR – Vegetation Height
2010 NAIP 2008 – 2010 LiDAR Vegetation Height
LiDAR – Vegetation Height
2010 NAIP 2008 – 2010 LiDAR Vegetation Height
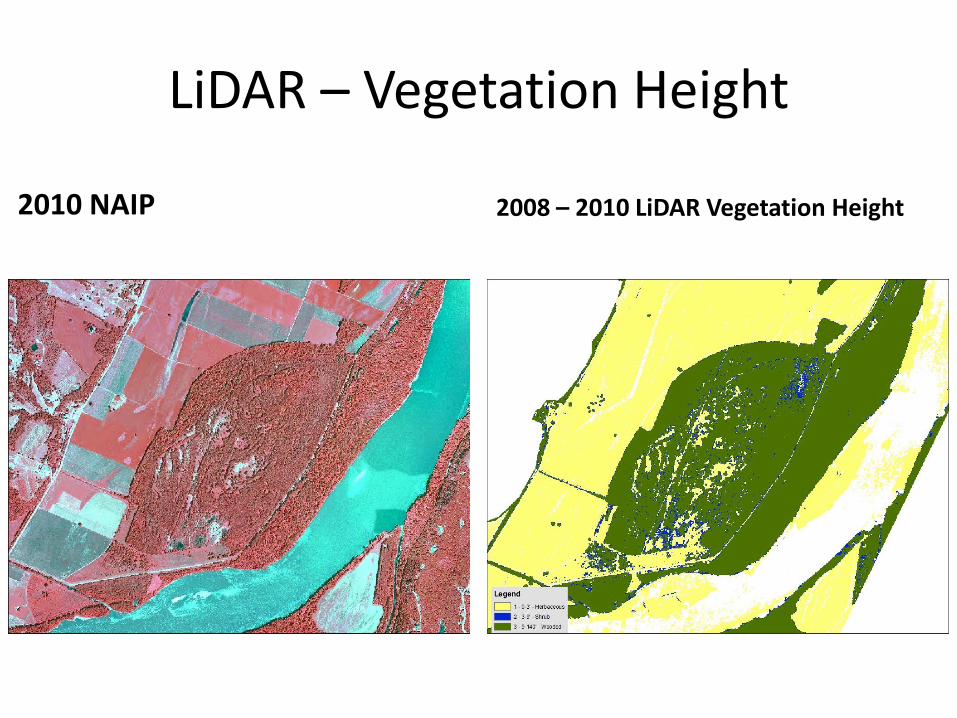
LiDAR – Vegetation Height
2010 NAIP 2008 – 2010 LiDAR Vegetation Height
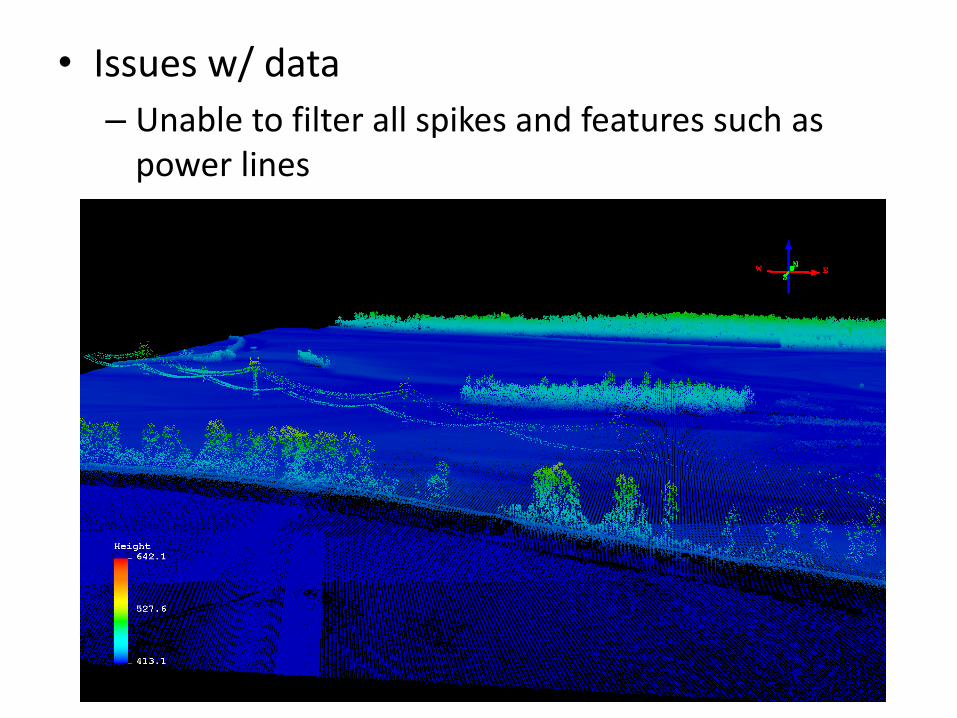
• Issues w/ data
– Unable to filter all spikes and features such as power lines
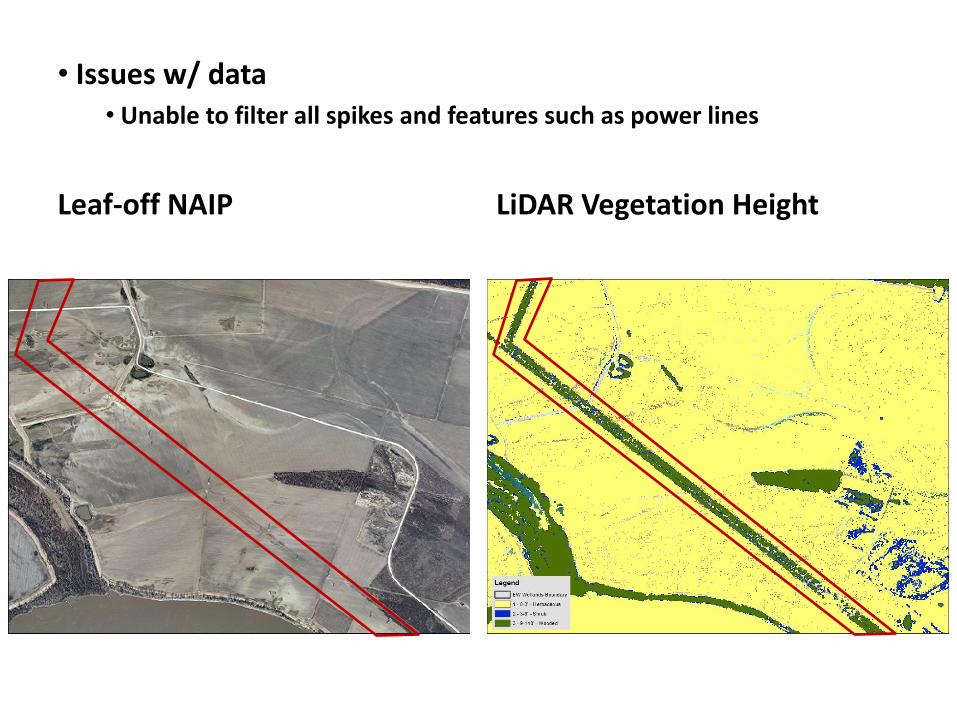
Leaf-off NAIP LiDAR Vegetation Height
• Issues w/ data • Unable to filter all spikes and features such as power lines
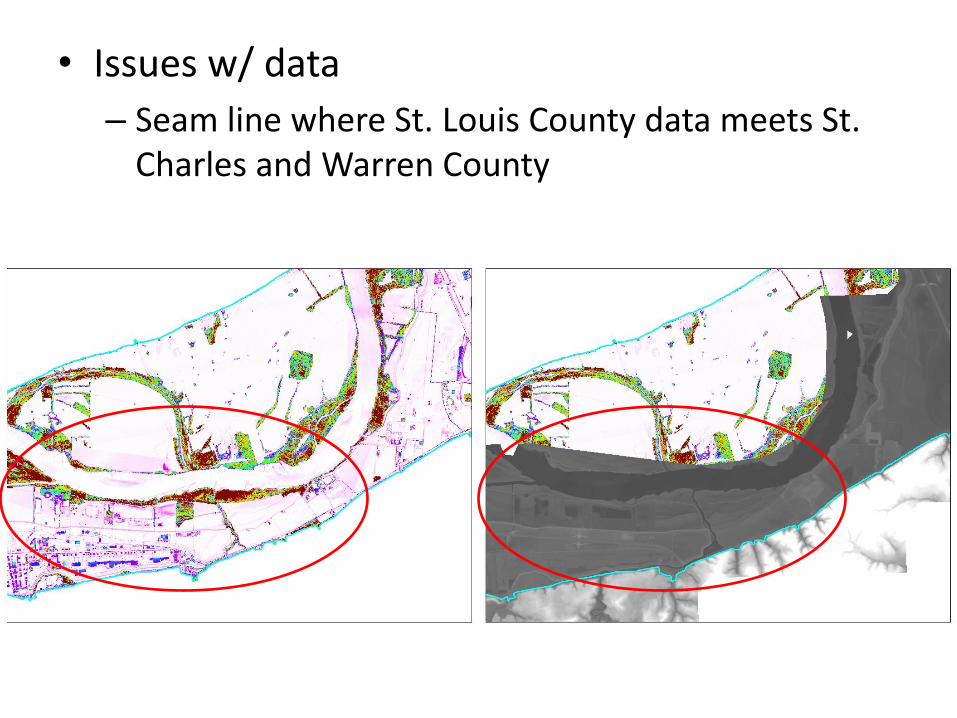
• Issues w/ data
– Seam line where St. Louis County data meets St. Charles and Warren County
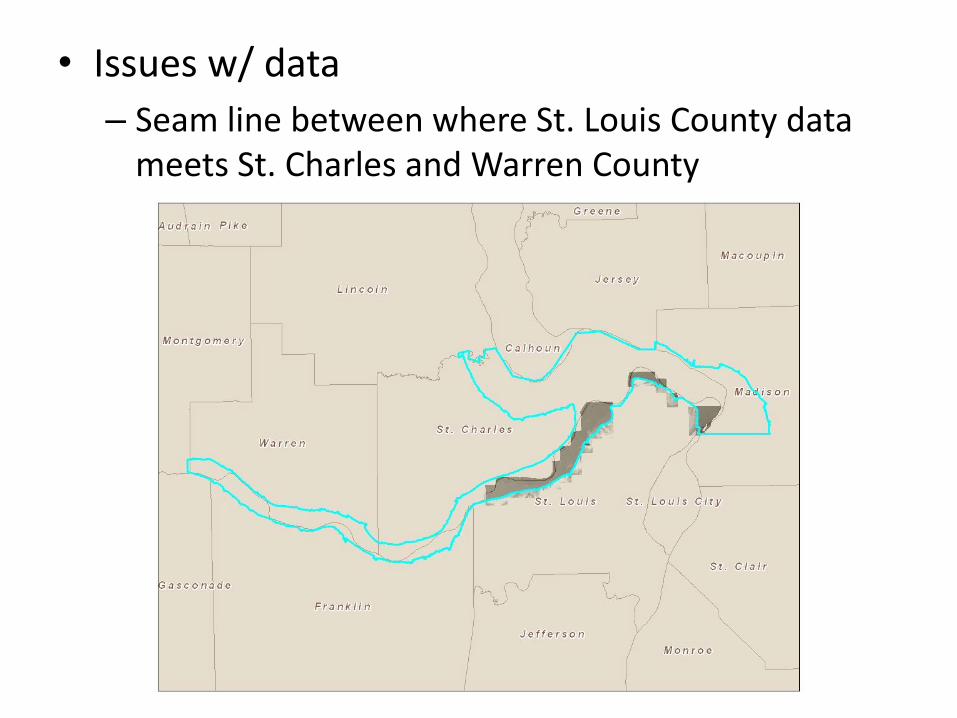
• Issues w/ data
– Seam line between where St. Louis County data meets St. Charles and Warren County