lidar for wetland mapping - association of state wetland ... · case study – lidar for wetland...
TRANSCRIPT
Case Study – LiDAR for wetland mapping?
• What information do LiDAR data provide to delineate wetland vegetation communities?
• Do LiDAR waveforms provide any additional information that can be useful in wetland vegetation classification?
• Can we determine invasive species such as “Phragmites” by fusing LiDAR and multispectral imagery?
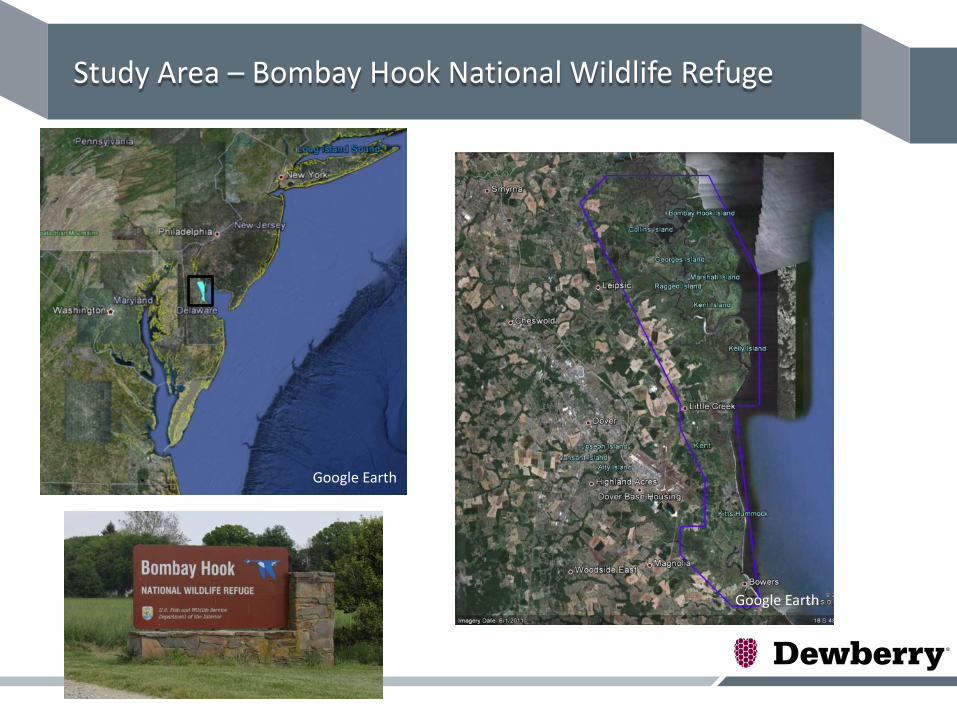
Study Area – Bombay Hook National Wildlife Refuge
Google Earth
Google Earth
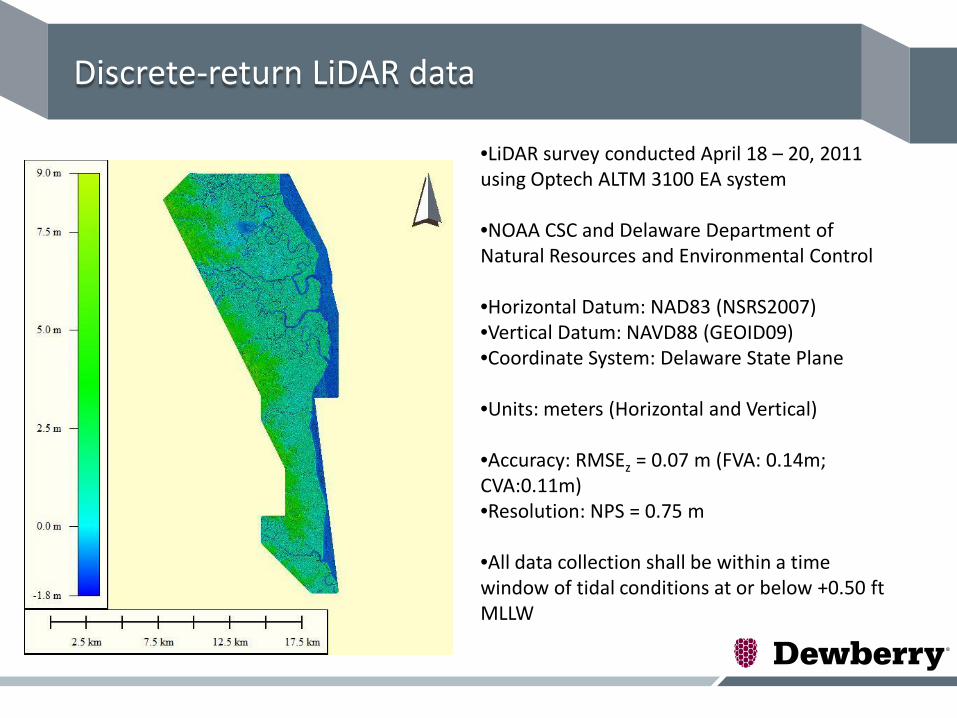
Discrete-return LiDAR data
•LiDAR survey conducted April 18 – 20, 2011 using Optech ALTM 3100 EA system •NOAA CSC and Delaware Department of Natural Resources and Environmental Control •Horizontal Datum: NAD83 (NSRS2007) •Vertical Datum: NAVD88 (GEOID09) •Coordinate System: Delaware State Plane •Units: meters (Horizontal and Vertical)
•Accuracy: RMSEz = 0.07 m (FVA: 0.14m; CVA:0.11m) •Resolution: NPS = 0.75 m
•All data collection shall be within a time window of tidal conditions at or below +0.50 ft MLLW
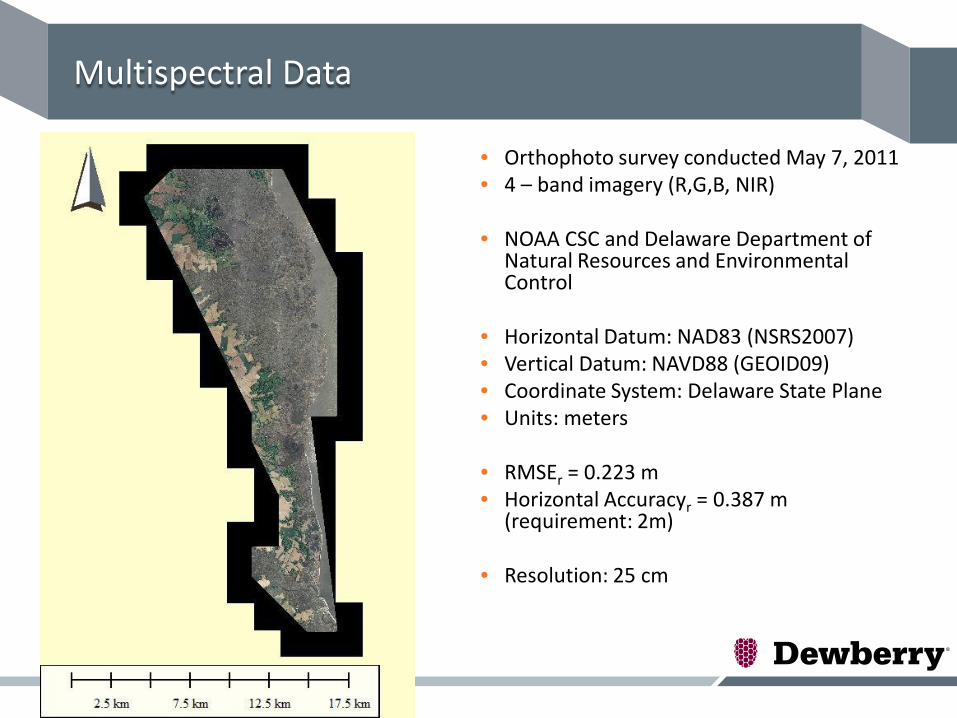
Multispectral Data
• Orthophoto survey conducted May 7, 2011 • 4 – band imagery (R,G,B, NIR) • NOAA CSC and Delaware Department of
Natural Resources and Environmental Control
• Horizontal Datum: NAD83 (NSRS2007) • Vertical Datum: NAVD88 (GEOID09) • Coordinate System: Delaware State Plane • Units: meters
• RMSEr = 0.223 m • Horizontal Accuracyr = 0.387 m
(requirement: 2m)
• Resolution: 25 cm
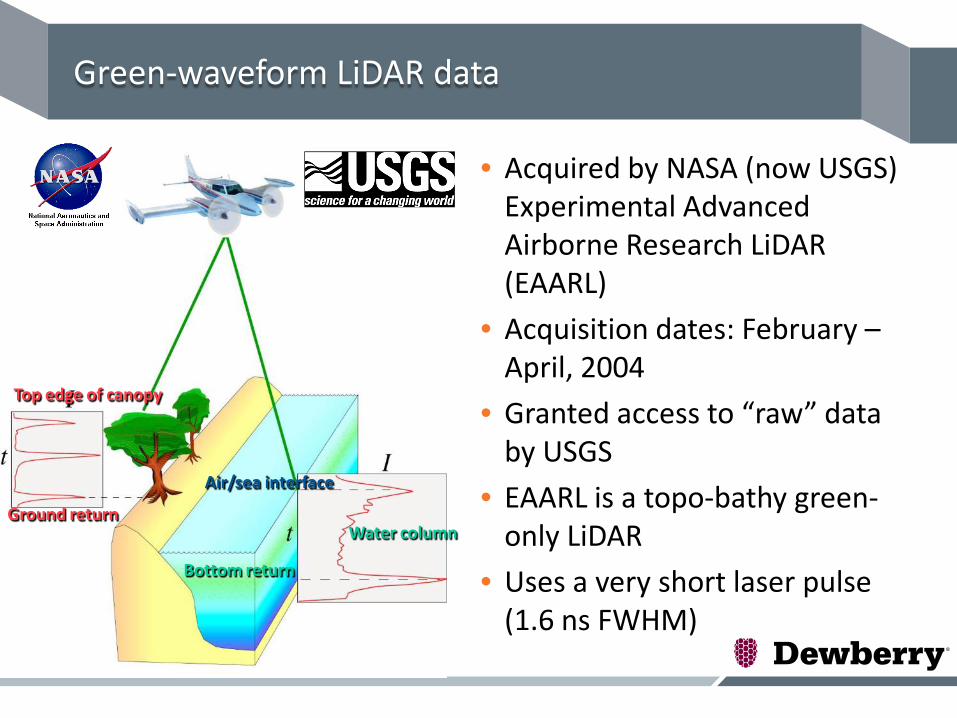
Green-waveform LiDAR data
• Acquired by NASA (now USGS) Experimental Advanced Airborne Research LiDAR (EAARL)
• Acquisition dates: February – April, 2004
• Granted access to “raw” data by USGS
• EAARL is a topo-bathy green-only LiDAR
• Uses a very short laser pulse (1.6 ns FWHM)
Top edge of canopy
Ground return
Air/sea interface
Water column
Bottom return

Ancillary Data
• USGS – National Vegetation Classification System (NVCS) statewide classification map (courtesy Robert Coxe – Ecologist at Delaware Natural Heritage and Endangered Species Program)
• Based on 2002 ortho imagery
• National Wetlands Inventory (available online)
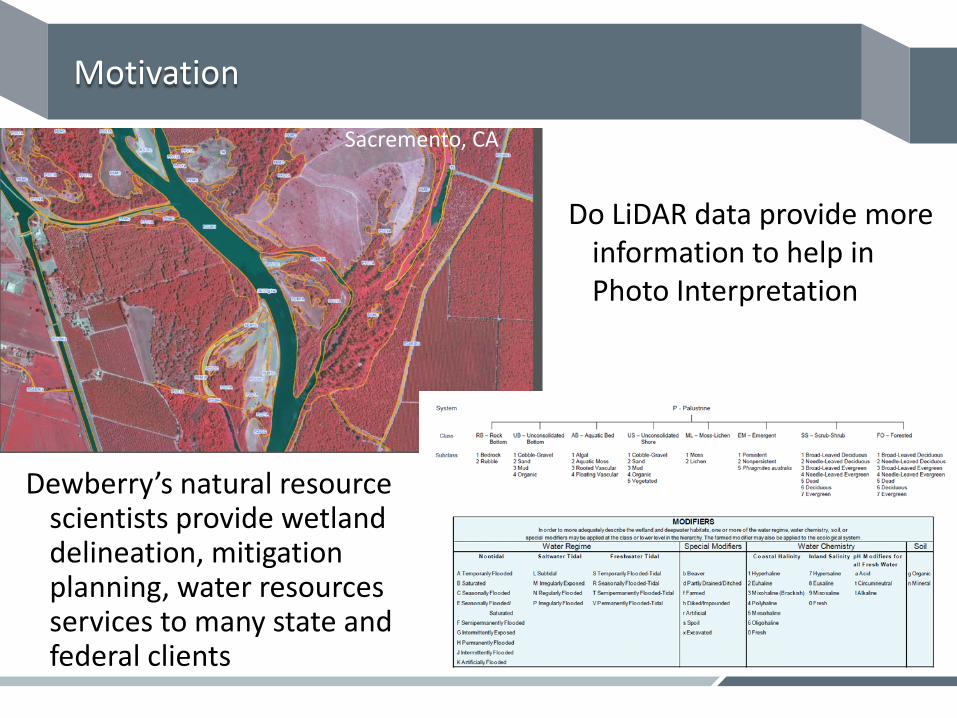
Motivation
Do LiDAR data provide more information to help in Photo Interpretation
Dewberry’s natural resource scientists provide wetland delineation, mitigation planning, water resources services to many state and federal clients
Sacremento, CA

Focus Area 1 – Bombay Hook National Wildlife Refuge
Google Earth
Google Earth
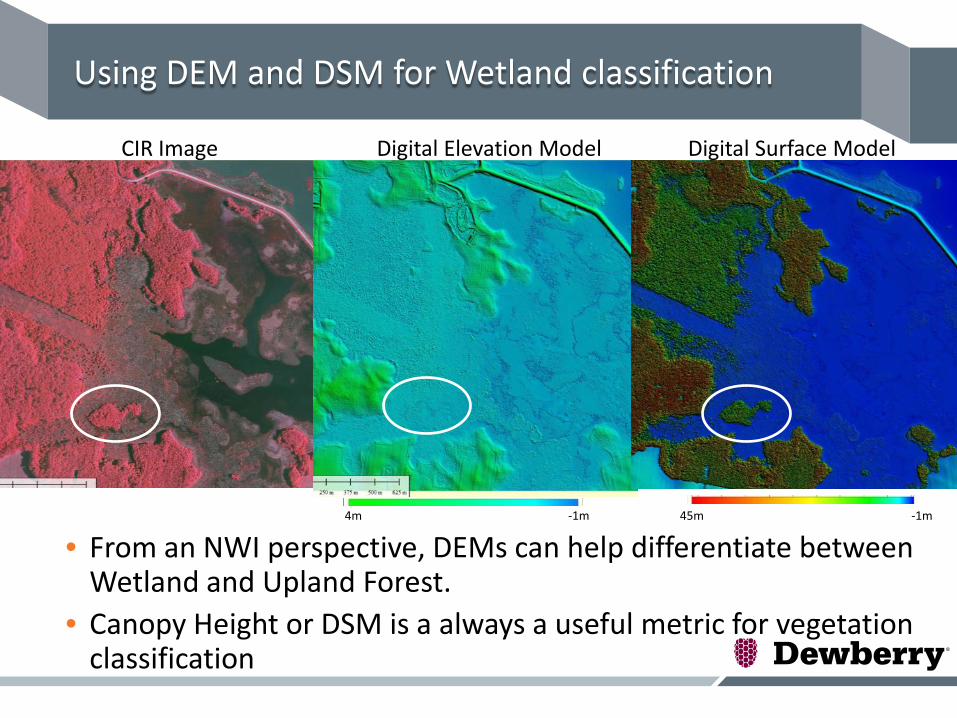
Using DEM and DSM for Wetland classification
• From an NWI perspective, DEMs can help differentiate between Wetland and Upland Forest.
• Canopy Height or DSM is a always a useful metric for vegetation classification
CIR Image Digital Surface Model Digital Elevation Model
-1m 45m -1m 4m

Digital Surface Model
Using LiDAR Intensity Images for wetland classification
Bare-Earth Intensity Image Bare-Earth DEM
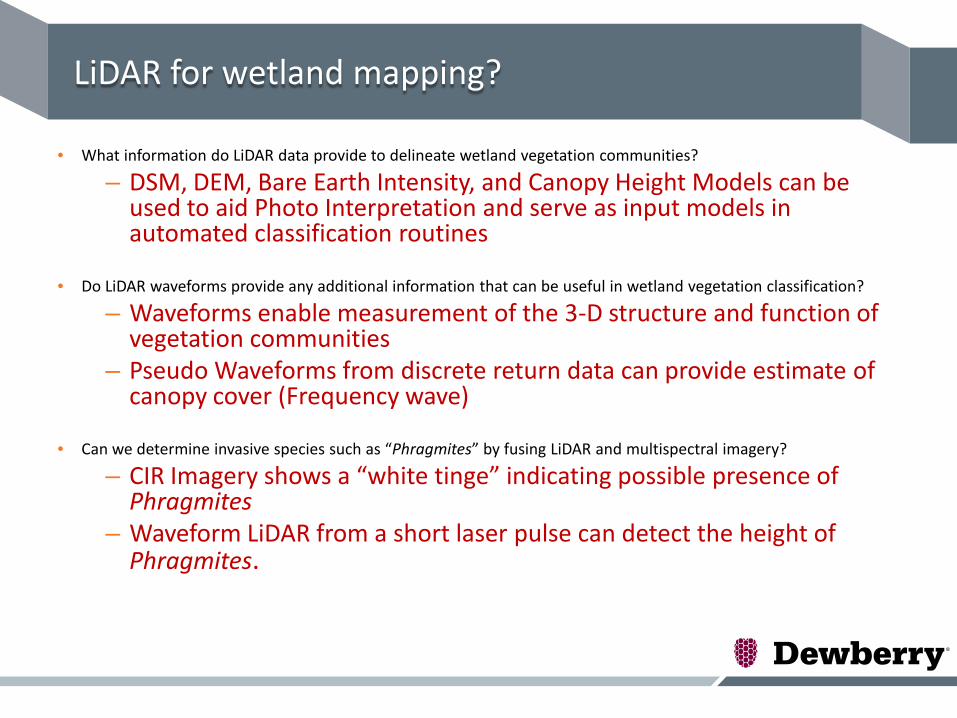
LiDAR for wetland mapping?
• What information do LiDAR data provide to delineate wetland vegetation communities?
• Do LiDAR waveforms provide any additional information that can be useful in wetland vegetation classification?
• Can we determine invasive species such as “Phragmites” by fusing LiDAR and multispectral imagery?
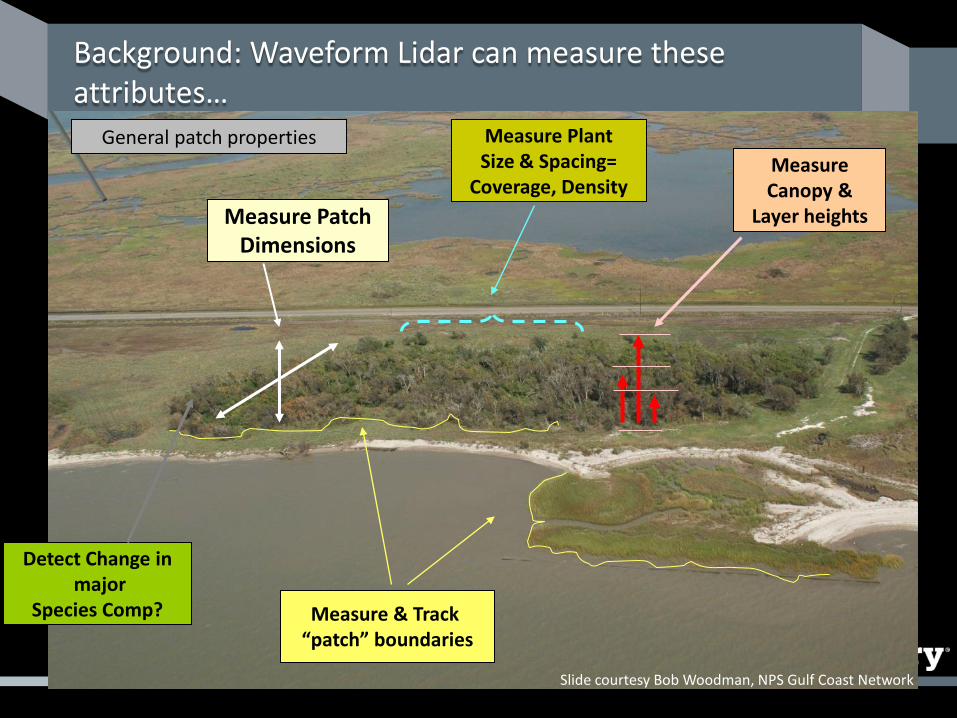
Background: Waveform Lidar can measure these attributes…
General patch properties
Measure & Track “patch” boundaries
Measure Patch Dimensions
Measure Canopy &
Layer heights
Measure Plant Size & Spacing=
Coverage, Density
Detect Change in major
Species Comp?
Slide courtesy Bob Woodman, NPS Gulf Coast Network
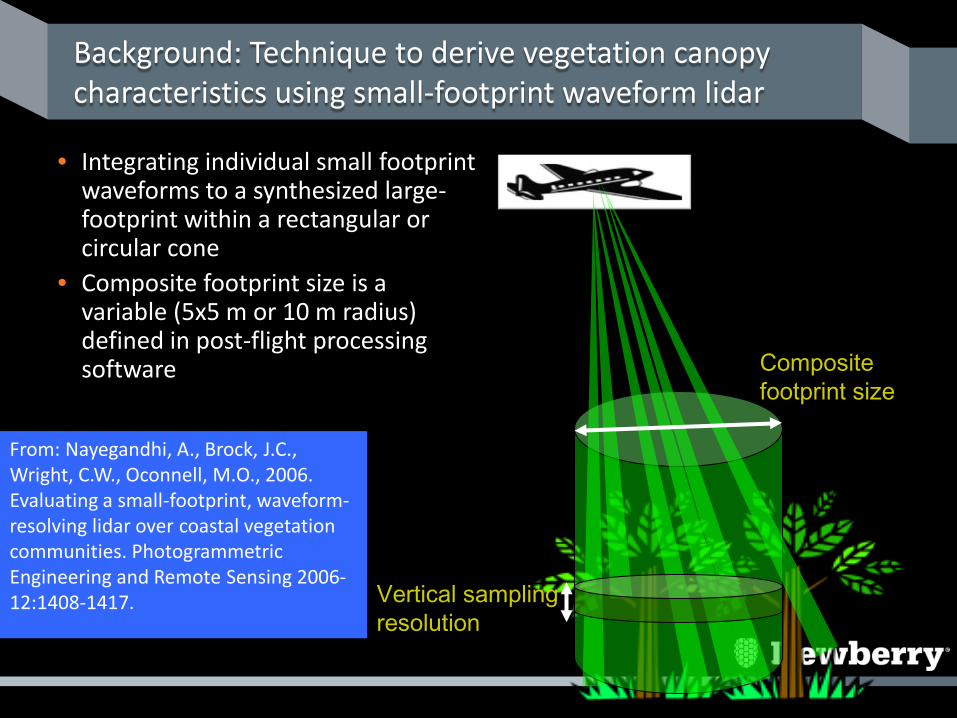
Background: Technique to derive vegetation canopy characteristics using small-footprint waveform lidar
• Integrating individual small footprint waveforms to a synthesized large-footprint within a rectangular or circular cone
• Composite footprint size is a variable (5x5 m or 10 m radius) defined in post-flight processing software
Composite footprint size
Vertical sampling resolution
From: Nayegandhi, A., Brock, J.C., Wright, C.W., Oconnell, M.O., 2006. Evaluating a small-footprint, waveform-resolving lidar over coastal vegetation communities. Photogrammetric Engineering and Remote Sensing 2006-12:1408-1417.
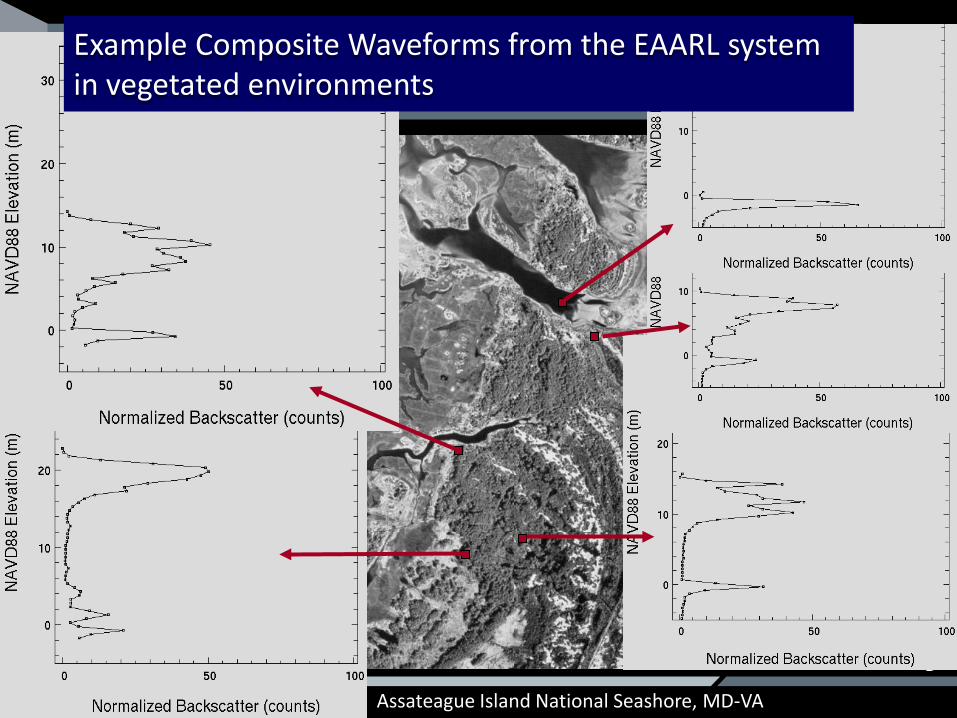
Example Composite Waveforms from the EAARL system in vegetated environments
Assateague Island National Seashore, MD-VA

Vegetation metrics derived from waveform LiDAR
• BE = Bare Earth - is derived from individual small footprints;
• CH = Canopy heights - is the distance from the first return to the ground
• CRR = Relative Canopy Cover - is the sum of the waveform returns reflected off the canopy (CR) divided by the sum of all returns (CR and the ground GR). CRR is a relative measure of canopy closure.
• HOME = The height of median energy - is the median height of the entire signal. HOME is predicted to be sensitive to changes in both the vertical arrangements of the canopy and the degree of canopy openness. HOME has been found to be a good predictor of biomass and structural attributes in tropical forests (Drake et. al 2002).
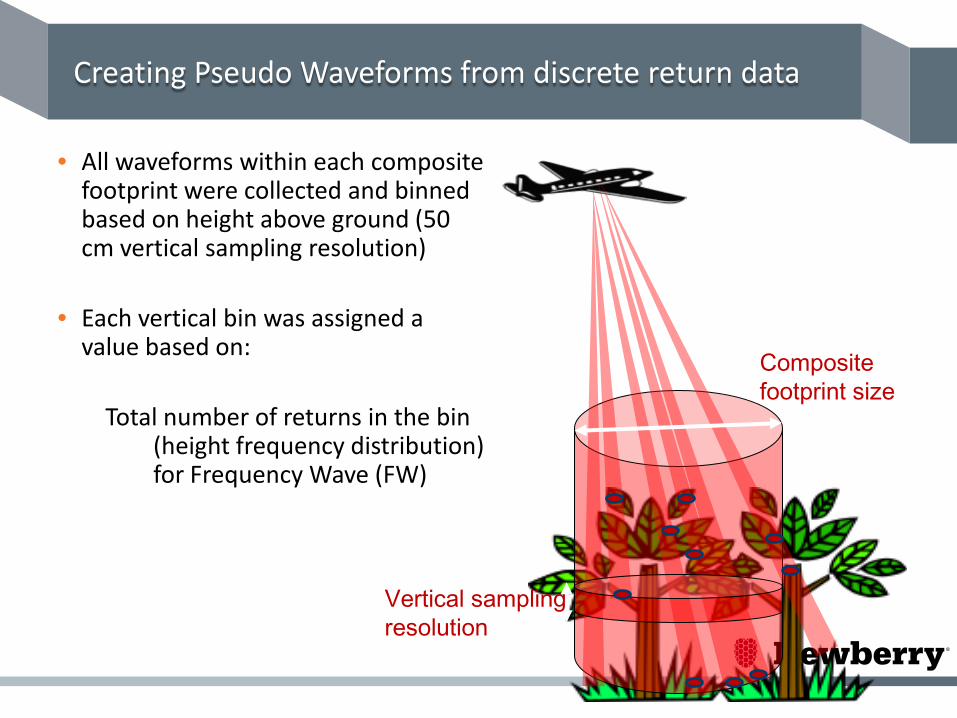
Creating Pseudo Waveforms from discrete return data
• All waveforms within each composite footprint were collected and binned based on height above ground (50 cm vertical sampling resolution)
• Each vertical bin was assigned a
value based on: Total number of returns in the bin
(height frequency distribution) for Frequency Wave (FW)
Composite footprint size
Vertical sampling resolution

Pseudo composite waveforms –Frequency Wave (FW)
• blah Tall, dense understory
Bare Earth Medium height, dense understory
Tall , open canopy
Medium height, light understory
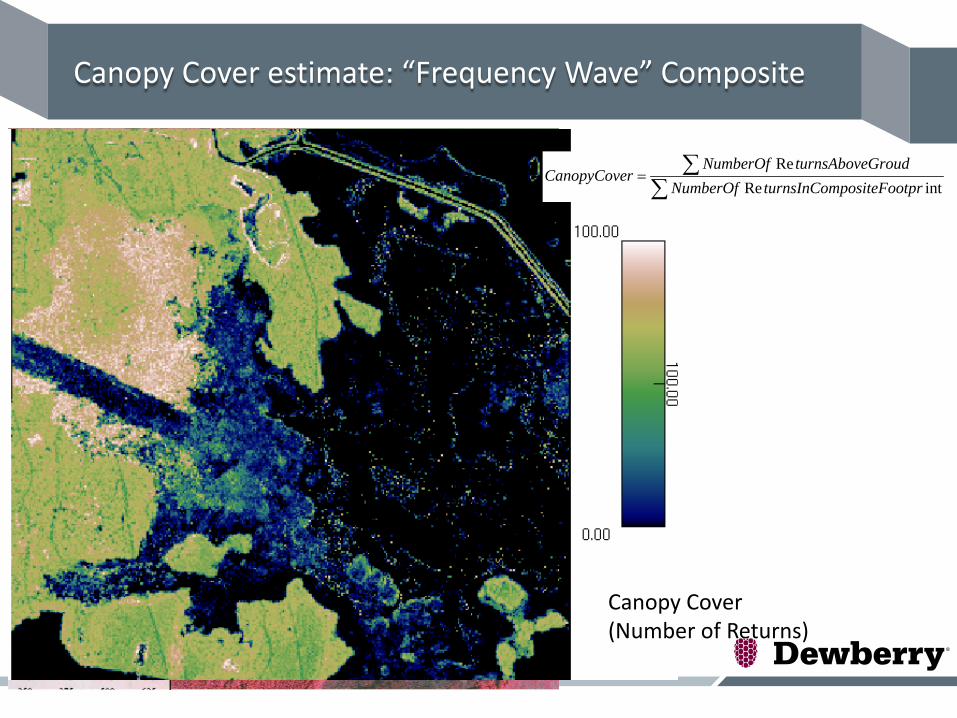
Canopy Cover estimate: “Frequency Wave” Composite
Canopy Cover (Number of Returns)
∑∑=
intReRe
prpositeFootturnsInComNumberOfGroudturnsAboveNumberOf
rCanopyCove

Using LiDAR and multispectral imagery for classifying wetland communities
• Principle Component Analysis
• (3 bands)
RGB (3 bands) NIR (1 band) DEM (stretched) Canopy Height (stretched)

Unsupervised Classification (isodata)
5 classes LiDAR – Multispectral “fused” classification
CIR Image
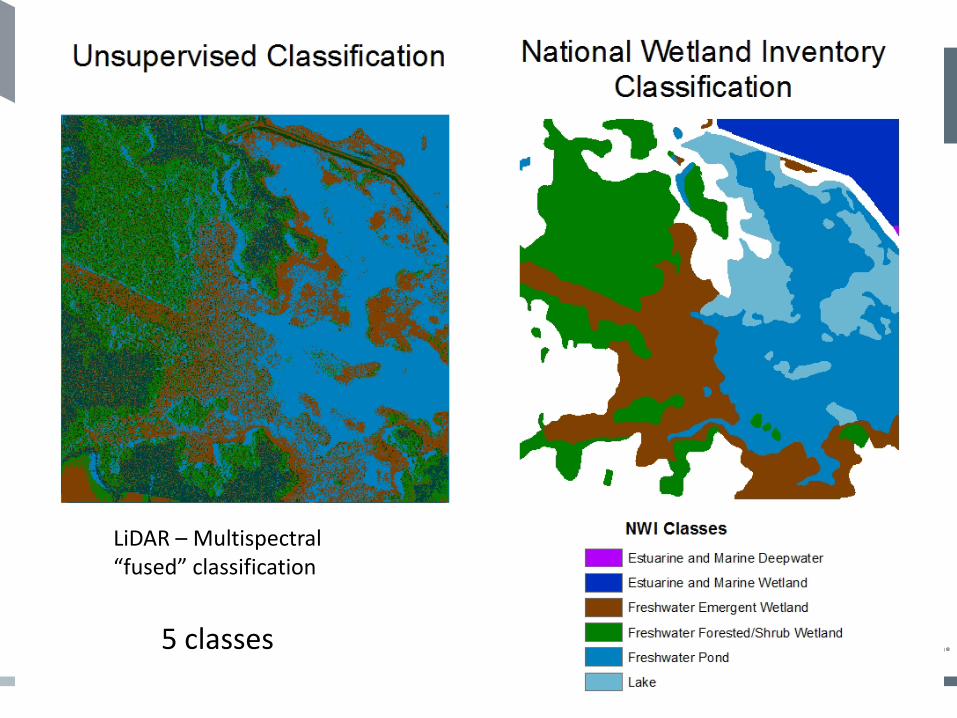
5 classes
LiDAR – Multispectral “fused” classification
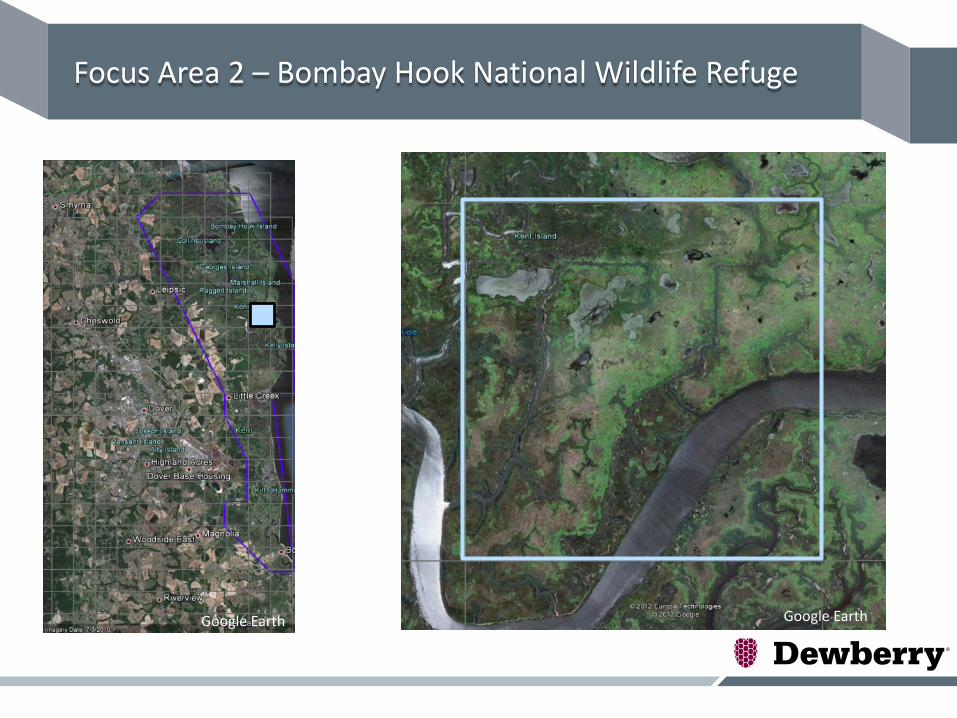
Focus Area 2 – Bombay Hook National Wildlife Refuge
Google Earth Google Earth
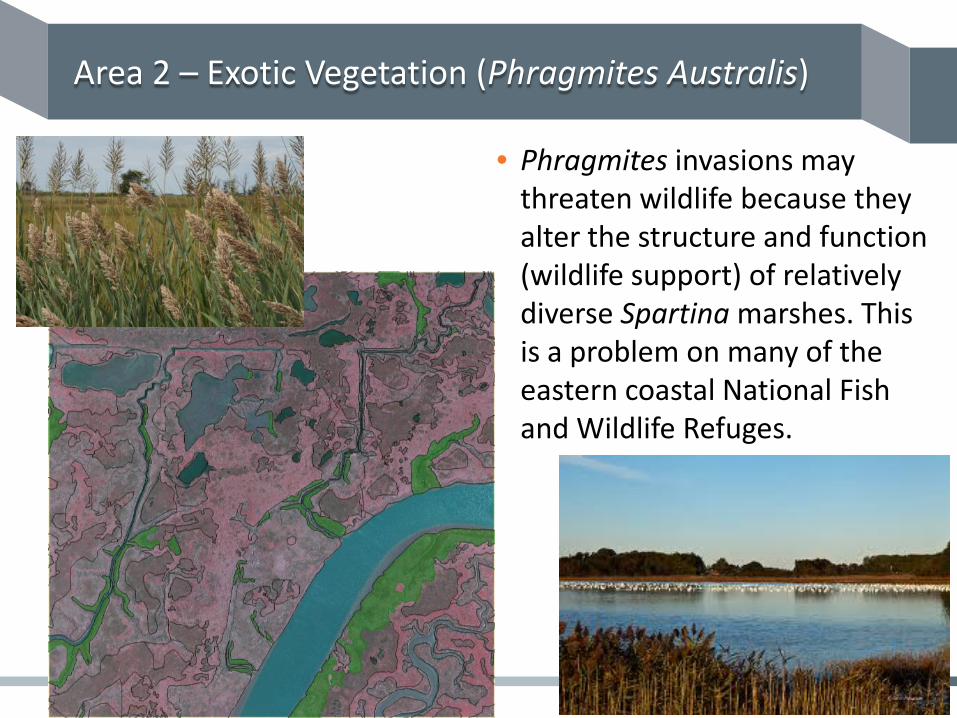
Area 2 – Exotic Vegetation (Phragmites Australis)
• Phragmites invasions may threaten wildlife because they alter the structure and function (wildlife support) of relatively diverse Spartina marshes. This is a problem on many of the eastern coastal National Fish and Wildlife Refuges.
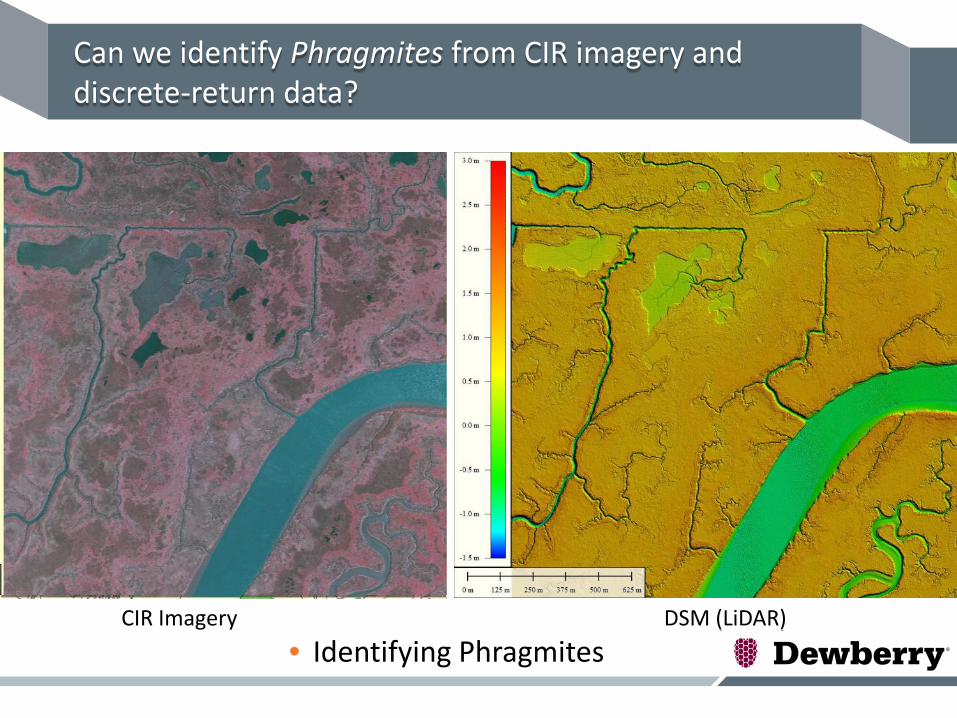
Can we identify Phragmites from CIR imagery and discrete-return data?
• Identifying Phragmites
CIR Imagery DEM (LiDAR) DSM (LiDAR)
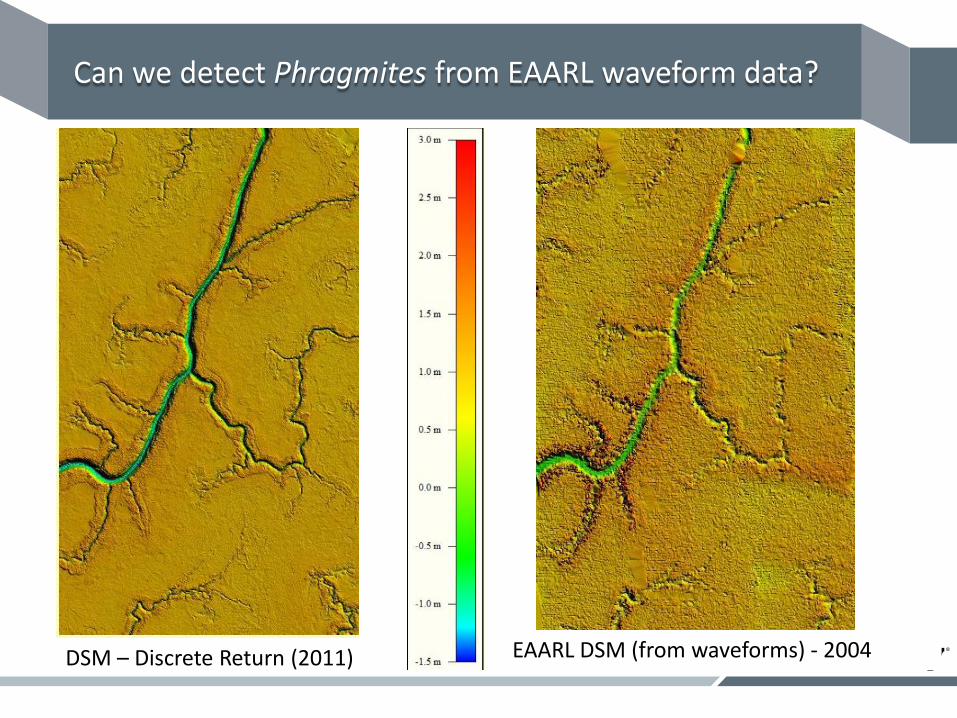
Can we detect Phragmites from EAARL waveform data?
DSM – Discrete Return (2011) EAARL DSM (from waveforms) - 2004
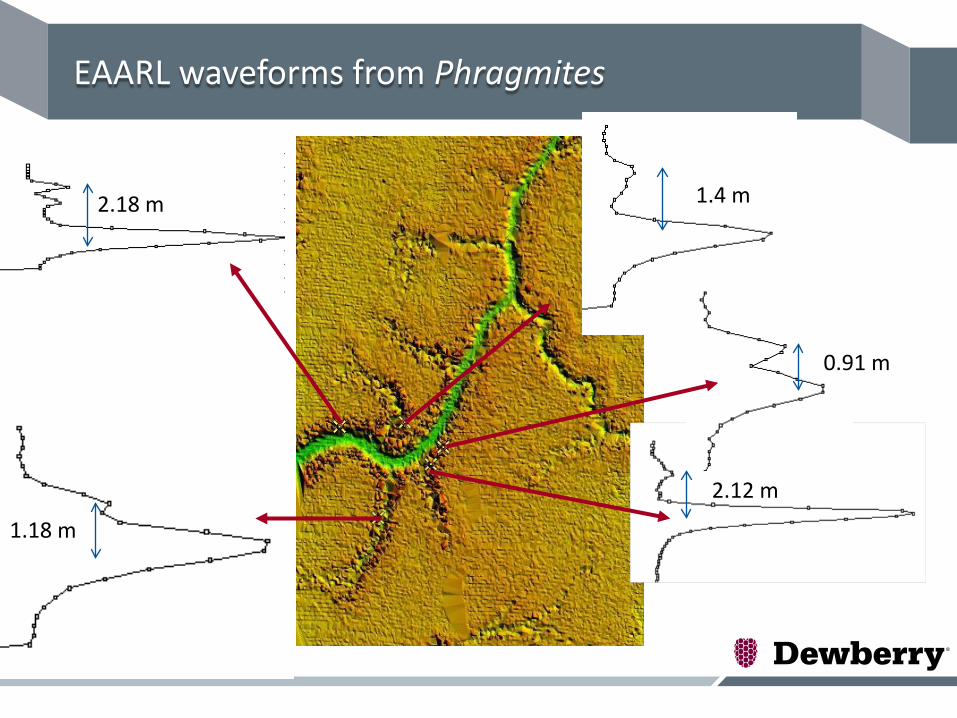
EAARL waveforms from Phragmites
2.18 m
1.18 m
2.12 m
0.91 m
1.4 m
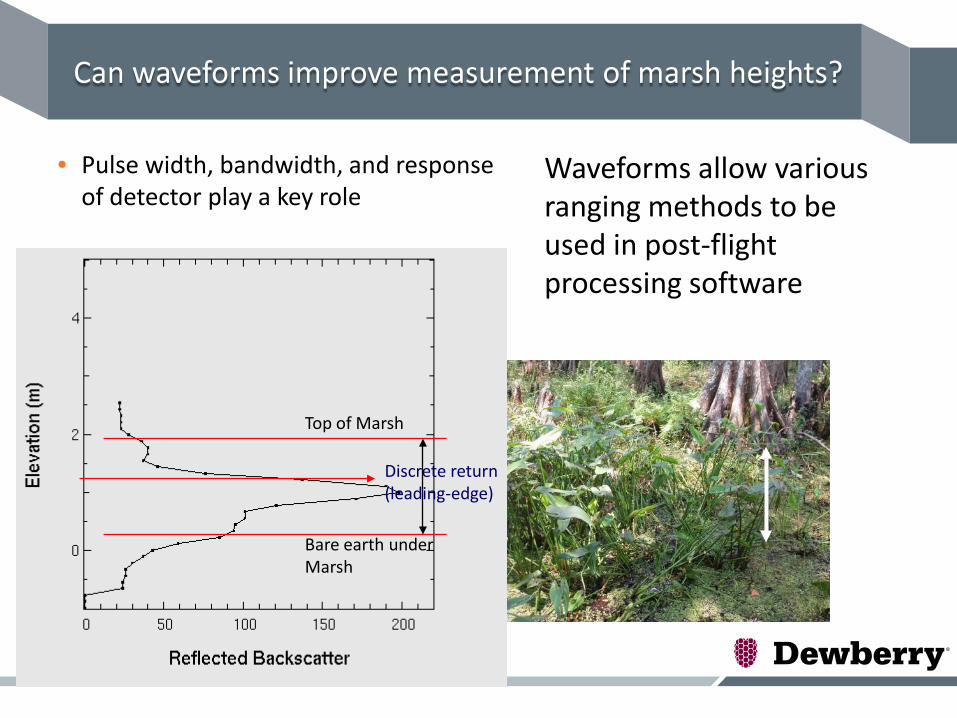
Can waveforms improve measurement of marsh heights?
• Pulse width, bandwidth, and response of detector play a key role
Discrete return (leading-edge)
Top of Marsh
Bare earth under Marsh
Waveforms allow various ranging methods to be used in post-flight processing software
LiDAR for wetland mapping?
• What information do LiDAR data provide to delineate wetland vegetation communities?
– DSM, DEM, Bare Earth Intensity, and Canopy Height Models can be used to aid Photo Interpretation and serve as input models in automated classification routines
• Do LiDAR waveforms provide any additional information that can be useful in wetland vegetation classification?
– Waveforms enable measurement of the 3-D structure and function of vegetation communities
– Pseudo Waveforms from discrete return data can provide estimate of canopy cover (Frequency wave)
• Can we determine invasive species such as “Phragmites” by fusing LiDAR and multispectral imagery?
– CIR Imagery shows a “white tinge” indicating possible presence of Phragmites
– Waveform LiDAR from a short laser pulse can detect the height of Phragmites.
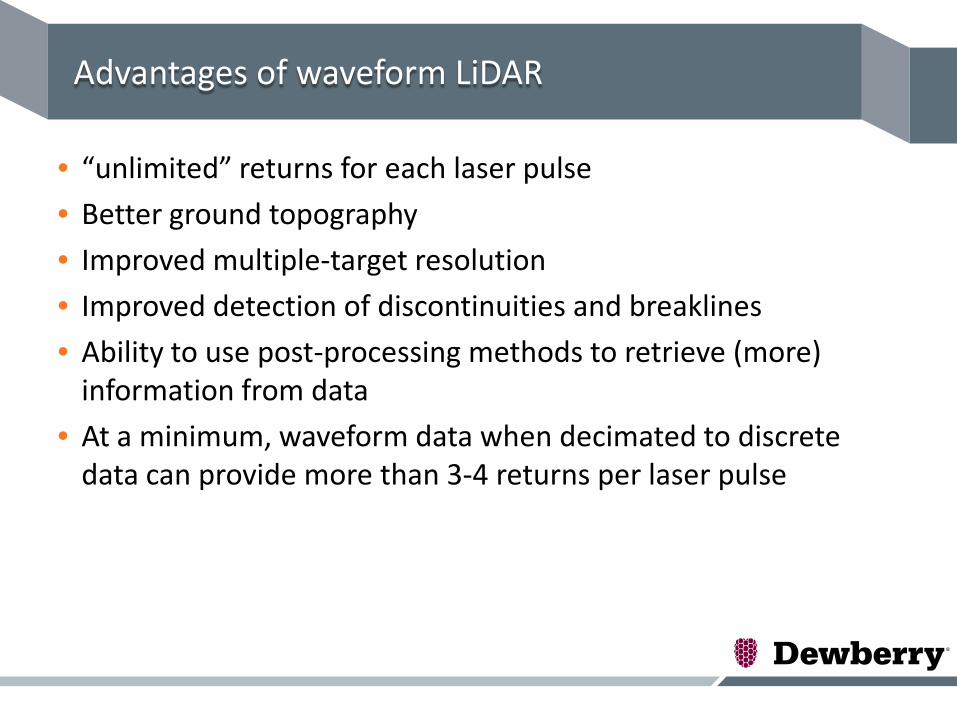
Advantages of waveform LiDAR
• “unlimited” returns for each laser pulse
• Better ground topography
• Improved multiple-target resolution
• Improved detection of discontinuities and breaklines
• Ability to use post-processing methods to retrieve (more) information from data
• At a minimum, waveform data when decimated to discrete data can provide more than 3-4 returns per laser pulse

Use of LiDAR in wetland mapping
• Wetlands develop in areas of low topographic relief – Accurate topography from LiDAR (esp. waveform LiDAR)
• Hydrology and Hydraulic Modeling – Delineate drainages and water levels – Understand water flow paths
• Habitat mapping – Topography may be an important factor in soil type, soil moisture content,
water salinity – LiDAR is very useful tool for vegetation monitoring / habitat assessment
• LiDAR can provide a synoptic/comprehensive view of the geomorphology and its relationship to land use, land cover, and cultural features.
• Use of topo-bathymetric LiDAR may provide seamless topography across land/water interface.
Thank you.
Questions?
Amar Nayegandhi
Manager of Elevation Technologies
Dewberry
Ph: 813.421.8642
Cell: 727.967.5005