wet and dry deposition of atmospheric nitrogen at ten sites in
TRANSCRIPT

Atmos. Chem. Phys., 12, 6515–6535, 2012www.atmos-chem-phys.net/12/6515/2012/doi:10.5194/acp-12-6515-2012© Author(s) 2012. CC Attribution 3.0 License.
AtmosphericChemistry
and Physics
Wet and dry deposition of atmospheric nitrogen at ten sites inNorthern China
Y. P. Pan, Y. S. Wang, G. Q. Tang, and D. Wu
State Key Laboratory of Atmospheric Boundary Layer Physics and Atmospheric Chemistry (LAPC),Institute of Atmospheric Physics, Chinese Academy of Sciences, Beijing 100029, China
Correspondence to:Y. S. Wang ([email protected])
Received: 9 October 2011 – Published in Atmos. Chem. Phys. Discuss.: 10 January 2012Revised: 15 May 2012 – Accepted: 21 June 2012 – Published: 25 July 2012
Abstract. Emissions of reactive nitrogen (N) species canaffect surrounding ecosystems via atmospheric deposition.However, few long-term and multi-site measurements havefocused on both the wet and the dry deposition of individualN species in large areas of Northern China. Thus, the magni-tude of atmospheric deposition of various N species in North-ern China remains uncertain. In this study, the wet and dry at-mospheric deposition of different N species was investigatedduring a three-year observation campaign at ten selected sitesin Northern China. The results indicate that N depositionlevels in Northern China were high with a ten-site, three-year average of 60.6 kg N ha−1 yr−1. The deposition levelsshowed spatial and temporal variation in the range of 28.5–100.4 kg N ha−1 yr−1. Of the annual total deposition, 40 %was deposited via precipitation, and the remaining 60 % wascomprised of dry-deposited forms. Compared with gaseousN species, particulate N species were not the major contribu-tor of dry-deposited N; they contributed approximately 10 %to the total flux. On an annual basis, oxidized species ac-counted for 21 % of total N deposition, thereby implying thatother forms of gaseous N, such as NH3, comprised a domi-nant portion of the total flux. The contribution of NO−
3 to Ndeposition was enhanced in certain urban and industrial ar-eas, possibly due to the fossil fuse combustion. As expected,the total N deposition in Northern China was significantlylarger than the values reported by national scale monitoringnetworks in Europe, North America and East Asia becauseof high rates of wet deposition and gaseous NH3 dry deposi-tion. Taken together, these findings show that NH3 emissionsshould be abated to mitigate high N deposition and associ-ated potential impacts on ecosystems in Northern China. Thepresent results improve our understanding of spatio-temporal
variations of magnitudes, pathways and species of depositedN in the target areas, and are important not only to informconservation and regulatory bodies but also to initiate furtherdetailed studies. Uncertainties among current observationsunderscore the need to quantify the impact of vegetation ondry deposition and to refine the simulation of dry depositionvelocity.
1 Introduction
During the 20th century, humans began to significantly af-fect the global cycle of nitrogen (N) by fixing N2, both de-liberately for fertilizer production and inadvertently duringfossil fuel combustion (Vitousek et al., 1997). The globalrate of reactive N production increased from approximately15 Tg N yr−1 in 1860 to 187 Tg N yr−1 in 2005; more thanhalf of this recent total was deposited onto the ground (Gru-ber and Galloway, 2008). Compared with biologically fixedN produced on the continents, atmospherically deposited N isbecoming a proportionately larger source of N for terrestrialand aquatic ecosystems worldwide (Galloway et al., 1995).In recent decades, high rates of atmospheric N depositionhave been widely documented in Europe (Dise and Wright,1995), North America (Fenn et al., 1998) and East Asia(Endo et al., 2010). Although elevated N deposition can stim-ulate plant growth in N-limited regions and cause substantialCO2 uptake in terrestrial ecosystems (Townsend et al., 1996),there are concerns regarding the negative ecosystem healthimpacts of excess atmospheric N deposition, such as a loss ofbiodiversity, eutrophication, N saturation, soil acidification
Published by Copernicus Publications on behalf of the European Geosciences Union.

6516 Y. P. Pan et al.: Wet and dry deposition of atmospheric nitrogen in Northern China
and increased susceptibility to secondary stresses (Liu etal., 2010).
Atmospheric N is deposited via precipitation (wet deposi-tion) and as gases and particles (dry deposition) (Clark andKremer, 2005). Therefore, it is important to quantify boththe wet and the dry deposition of N; otherwise, an extrapola-tion of the total N deposition flux could yield highly uncer-tain estimates of potential ecological impacts. Wet depositionis readily estimated by analyzing N species in precipitation(Barile and Lapointe, 2005; Park and Lee, 2002; Xie et al.,2008; Larssen et al., 2006). However, the dry deposition of Nis often omitted from observation-based flux studies becauseof the difficulties inherent in directly quantifying the ambientconcentrations and deposition velocities of highly reactive Ngases and speciated particles (Pryor et al., 1999). Because drydeposition can substantially contribute to total N deposition,neglecting dry deposition will result in an underestimationof the total deposition of N onto surfaces (Hill et al., 2005).Alternatively, inferential modeling has been used extensivelyas an operational tool to compensate for the absence of mea-sured dry deposition data at regional scales (Flechard et al.,2011). With estimates of dry deposition and the use of mon-itoring networks in Europe (EMEP), North America (CAST-NET) and East Asia (EANET), the total deposition flux of Nat the national scale can be calculated.
According to the long-term trends observed by these net-works, N deposition has leveled off or stabilized in theUS and Europe since the late 1980s or early 1990s be-cause of the implementation of stricter legislation to re-duce emissions. In contrast, the concentrations of atmo-spheric reactive N in East Asia have continued to increaseevery year for the past three decades, mainly because ofthe increased emissions of NOx from combustion processes,NH3 from agricultural production and particulate N fromhuman activities (Zheng et al., 2002). This increase is re-flected in the recent finding that the total N depositionflux observed by EANET (10.6 kg N ha−1 yr−1) is largerthan those reported by CASTNET (5.3 kg N ha−1 yr−1) andEMEP (8.7 kg N ha−1 yr−1) (Endo et al., 2010), and is sup-ported by peak estimates of N deposition over Central SouthChina with maximum values of 63.5 kg N ha−1 yr−1 and anaverage value of 12.9 kg N ha−1 yr−1 (Lu and Tian, 2007).If current policies in China are fully implemented, the na-tional emissions of NOx and NH3 are estimated to increaseby 30 % and 57 %, respectively, from 2005 to 2020 (Zhao,Y. et al., 2009). Furthermore, increasing emissions of reac-tive N species are expected to cause increased levels of at-mospheric N deposition across most of China, and N depo-sition is expected to increase by more than 40 % in certainprovinces of Central South and Eastern China (Zhao, Y. etal., 2009). As one of the most rapidly developing regions inEast Asia, Northern China is particularly susceptible to airpollution from increased emissions of reactive N species.
Despite this predicted increase in N deposition, the mag-nitude and potential impacts of atmospheric N deposition
in Northern China remain uncertain because of a paucityof measurements and quantitative knowledge (Lu and Tian,2007; He et al., 2007). Previous studies of N deposition inNorthern China have considered the wet deposition and thedry deposition of N species separately (Shen et al., 2009;Zhang et al., 2008a). Furthermore, the large-scale spatialvariability was not considered in previous studies, whichassessed several locations in agricultural areas (Liu et al.,2006). Although N species in gaseous, particulate and rainphases have been measured in various locations in North-ern China, relatively few studies have primarily focused onN deposition measurement (Meng et al., 2011; Zhang et al.,2007; Tang et al., 2005). Additionally, past work has mainlyincluded short-term studies and has been limited to urbanareas. In the absence of long-term and multi-site measure-ments, the effects of increasing emissions on N deposition invast regions of China cannot be determined. An assessmentthat extends beyond a period of three years would contributeto a better understanding of regional atmospheric N deposi-tion and help to identify effective strategies for mitigating Ndeposition in the future.
The objective of this study was to investigate spatio-temporal variations in the total atmospheric N deposition fluxand thereby establish baseline information for future studiesin various areas of Northern China. The atmospheric depo-sition of N species via particles, precipitation and gaseousprocesses was examined over a three-year sampling periodat ten selected sites with varying urban geographies, energystructures and ecosystem types.
2 Materials and methods
2.1 Site descriptions
The study was conducted between December 2007 andNovember 2010 across Northern China, which is an area ofgrowing concern regarding the effects of increased N emis-sions on receiving terrestrial and aquatic ecosystems. The tensites were selected to provide regional information on N de-position and thereby advance our current understanding ofthe effects on different environments. The sites included thetwo mega cities of Beijing (BJ) and Tianjin (TJ), the two sub-urban areas of Cangzhou (CZ) and Yangfang (YF), the threeindustrial sites of Baoding (BD), Tanggu (TG) and Tang-shan (TS), the two agricultural areas of Luancheng (LC) andYucheng (YC) and a rural site at Xinglong (XL). The gen-eral location of each site is shown in Fig. 1. The longitudesranged from 114.69◦ E to 118.20◦ E, and the latitudes rangedfrom 36.85◦ N to 40.38◦ N. The annual mean precipitationranged from 404 to 610 mm, and the air temperature from8.8 to 13.4◦ C. The measurement height and other availableinformation on the monitoring sites, such as the main landuse type, possible emissions and density of population, arelisted in detail in Table 1.
Atmos. Chem. Phys., 12, 6515–6535, 2012 www.atmos-chem-phys.net/12/6515/2012/

Y. P. Pan et al.: Wet and dry deposition of atmospheric nitrogen in Northern China 6517
150° E
135° E
135° E
120° E
120° E
105° E
105° E
90° E
90° E75° E60° E50° N
40° N 40° N
30° N 30° N
20° N 20° N
10° N 10° N
China
Russia
Japan
India
Mongolia
Korea
Kazakhstan
Yellow Sea
EastChinaSea
SouthChinaSea
StudyArea
(a)
P
P
P
P
P
P
P
P
P
PTG
YF
TS
CZ
BD
XL
LC
YC
TJ
BJ
119° E
119° E
118° E
118° E
117° E
117° E
116° E
116° E
115° E
115° E
114° E
114° E
41° N 41° N
40° N 40° N
39° N 39° N
38° N 38° N
37° N 37° N
0 50 km
±Bohai BayP Sites
Shandong Province
Hebei Province
Beijing CityTianjin City
(b)
Mt. Taihang
Mt. Yan
Fig. 1. Locations of the study area and the sampling sites in North-ern China. Of the ten selected sites, two mega city sites are lo-cated in the Beijing (BJ, 39.96◦ N, 116.36◦ E) and Tianjin (TJ,39.08◦ N, 117.21◦ E) downtown areas; two suburban sites 2 kmsoutheast of Cangzhou city (CZ, 38.30◦ N, 116.87◦ E) and at Yang-fang (YF, 40.15◦ N, 116.10◦ E), which is 40 km northwest of Bei-jing city; three industrial city sites in the center of Baoding city(BD, 38.85◦ N, 115.50◦ E), south of Tangshan city (TS, 39.60◦ N,118.20◦ E) and in the coastal Tanggu (TG, 39.04◦ N, 117.72◦ E)area, which is 30 km east of Tianjin city; two agricultural sites6 km southwest of Yucheng city (YC, 36.85◦ N, 116.55◦ E) and atLuancheng (LC, 37.89◦ N, 114.69◦ E), which is 4 km southeast ofShijiazhuang city; and one rural site at Xinglong (XL, 40.38◦ N,117.57◦ E) on Mt. Yan, with an elevation of 960 m a.s.l.
In order to understand the geographical patterns of the ob-served N depositions, emission distributions of the precur-sors have to be known. Emissions of NOx and NH3 in theyear 2008 have been aggregated into model grids at a res-olution of 9× 9 km2 and are shown in Sect. 3.4.4 (Fig. 6).The NH3 emission data include human and livestock excre-ment, agricultural applications and sewage treatment plants,whereas the NOx data consist of vehicles, power plants and
industrial and residential sources (Tang, 2010). A detaileddiscussion of the emission inventory is underway and will bepublished elsewhere in the near future.
2.2 Wet deposition measurements
Daily rainwater and monthly particulate dry deposition sam-ples were collected using a custom wet-dry automatic col-lector (APS-2B, Xianglan Scientific Instruments Co., Ltd.,Changsha, China). The wet-dry samplers were equipped witha 707 cm2 aperture and a 177 cm2 glass bucket to sample wetand particulate dry deposition, respectively. The precipita-tion sensor opens the collection funnel of the cover devicewhen rainfall begins, and rainwater flows from the funnelinto a 15 l plastic bottle. The funnel lid closes automaticallywhen the precipitation ceases and the rainwater has evap-orated from the sensor surface. This feature of the collec-tor is highly useful for simultaneously collecting samples ofrainwater and deposited particles with minor mixing of thetwo. After sampling, the collection system is systematicallycleaned with distilled water. Snow samples were collectedusing a clean plastic bucket with an inner diameter of 22 cmas soon as possible after the snowfall events. The top 3–5 cmof snow was collected and melted in a 500 ml glass beakerat room temperature. In addition, another plastic bucket wasalso used to collect snow samples synchronously, which wereused for measuring the water equivalent depths of snowfall.The rainwater and melted snow samples were frozen in a re-frigerator at−20◦C at each site immediately after collectionand were delivered in iceboxes to analytical laboratories inthe State Key Laboratory of Atmospheric Boundary LayerPhysics and Atmospheric Chemistry (LAPC, in Beijing) byroutine monthly site-maintenance visits. Each sample was fil-tered with a syringe (Minisart SRP 25 of diameter 0.45 µm,Sartorius, Germany), and 15 ml filtrates were then frozen andstored in plastic bottles until chemical analysis. Though thepre-treatment of precipitation (rainwater and snow) sampleshas been described in previous studies (Pan et al., 2010a), itis repeated here for the reader’s convenience.
The species and amounts of inorganic N (IN), includingNH+
4 , NO−
3 and NO−
2 , in the precipitation samples were de-termined using an ion chromatography system (Model ICS-90, Dionex Corporation, Sunnyvale, CA, USA) and the stan-dard laboratory procedure of LAPC (Wang et al., 2012). Thedetection limit (DL) of N for this instrument was 5 µg l−1.The average concentrations of the N species in the fieldblanks were well below the DL, thereby indicating that nosignificant contamination of the rain samples occurred dur-ing the sampling, handling, filtration or measurement steps.The monthly wet deposition flux of IN (wIN) was obtainedby multiplying the volume-weighted concentrations of IN inthe precipitation and the amount of precipitation measured bya standard rain gauge at each site during the correspondingperiod. Though unstable NO−2 is readily converted to NO−3and cannot be well kept prior to analysis, the concentration
www.atmos-chem-phys.net/12/6515/2012/ Atmos. Chem. Phys., 12, 6515–6535, 2012

6518 Y. P. Pan et al.: Wet and dry deposition of atmospheric nitrogen in Northern China
Table 1.Descriptions of the ten sampling sites in Northern China.
Site Coordinates Classification
Measurement height (m)
Surrounding environment and Population densitydand underlying surfacea Meteorological parametersb
possible emission sourcesc (persons km−2)Rain Gases Surface
Rainfall Wind speed T RH(mm) (m s−1) (◦C) (%)
BJ 39.96◦ N, Urban 8 8 Roof 572 2.5 12.3 57 Densely occupied residences 5479116.36◦ E and traffic roads
TJ 39.08◦ N, Urban 1.5 6 Lawn 544 2.5 12.7 62 Densely occupied residences, 24606117.21◦ E industry and traffic roads
BD 38.85◦ N, Industrial 10.5 11 Roof 513 2.1 12.9 62 Densely occupied residences, 2871115.50◦ E traffic roads and industry
TG 39.04◦ N, Industrial 1.5 2 Lawn 566 4.3 12.6 64 Light industry and traffic roads 865117.72◦ E
TS 39.60◦ N, Industrial 13.5 14 Roof 610 2.4 11.5 62 Densely occupied residences, 2648118.20◦ E traffic roads and industry
YF 40.15◦ N, Suburban 1.5 2 Grass 404 2.5 8.8 47 Occupied residences 470116.10◦ E and traffic roads
CZ 38.30◦ N, Suburban 5.5 6 Roof 605 3 12.9 61 Small villages and highways 2314116.87◦ E
LC 37.89◦ N, Agricultural 1.5 2 Lawn 517 1.8 13.4 62 Small villages and cropland 958114.69◦ E
YC 36.85◦ N, Agricultural 1.5 1.5 Lawn 566 2.3 13.2 63 Small villages and cropland 521116.55◦ E
XL 40.38◦ N, Rural 1.5 8 Grass 512 1.1 9.1 55 Forest and few villages 98117.57◦ E
a The automatic wet-dry collector (height, 1.5 m) was installed on the ground if the underlying surface of the site was grass or lawn. When the underlying surface was baredsoil or concrete road, it was installed on the roof of a building available at the station to avoid local emissions such as re-suspended particles. Therefore, the rainfall wascollected at the height of 1.5–13.5 m above the ground. The passive sampler to measure the ambient concentrations of gaseous N species was installed at a similar height to or0.5 m higher than that of the automatic wet-dry collector at most of the sites, whereas at the XL and TJ sites, the passive sampler was installed on the rooftop and the towerwith a measurement height of 8 m and 6 m above the ground, respectively.b There were no mean annual meteorological data for the ten monitoring sites; the surface climate parameters presented (1971–2000) were obtained from the nearestmeteorological observation stations available on the China Meteorological Data Sharing Services System website (http://cdc.cma.gov.cn/).c The main soil type in the North China Plain is silty loam alluvial soil (FAO system) with an average bulk density of 1.5 g cm−3. The dominant cropping system in the regionis a winter wheat-summer maize rotation system (two crops a year). Farmers typically apply about 500 kg N ha−1 yr−1 as N fertilizer in March–April, June–August andOctober to achieve high yields of maize and wheat. During the observation period, the annual N fertilizer input at the YC site was ca. 500, 280 and 520 kg N ha−1 yr−1 in2008, 2009 and 2010 (Z. Ouyang, personal communication, 2012), whereas that at the LC site was ca. 610, 460 and 500 kg N ha−1 yr−1 in 2008, 2009 and 2010 (Y. Cheng,personal communication, 2012), respectively.d The population density was estimated by dividing population by area of the town/district/county in which the monitoring site is located. Population data were retrieved fromthe fifth census of China in 2000 and can be accessed online (http://www.stats.gov.cn).
of NO−
2 was determined here to investigate the N pool inprecipitation and dry-deposited particles. The results showedthat NO−
2 is an insignificant fraction of the atmospheric Nbudget.
2.3 Particulate dry deposition measurements
Although the amount of wet deposition can be determineddirectly from precipitation samples, dry deposition measure-ments are much more challenging (Wesely and Hicks, 2000).In this study, a polyurethane foam (PUF) filter (7.5 cm diam-eter and 1.35 cm thickness with a density of 0.021 g cm−3),used as a surrogate surface, was placed in the glass bucket(7.5 cm inner diameter and 30 cm depth) to collect the dry-deposited airborne particles for chemical analysis (Pan et al.,2010b). During a rain event, the glass bucket for collectingthe dry deposition was covered with a lid. After the precipi-tation ceased, the lid was lifted and rotated to cover the aper-ture that collected the rainwater; this simultaneously openedthe glass bucket to collect dry-deposited particles.
After collection, the PUF filters were sealed in aluminumfoil and frozen in a refrigerator at each site until delivery
in iceboxes to LAPC by routine monthly site-maintenancevisits. In analytical laboratories, the PUF filters were condi-tioned in a dry box at 40 % relative humidity and 25◦C for24 h to measure the pre- and post-sampling weights and todetermine the mass collected on the filters. The monthly drydeposition flux of particulate matter was calculated by divid-ing the mass by the surrogate surface area during the sam-pling period. To determine the content of extractable IN inthe deposited particles, the PUF filters were cut into ten totwenty equal portions. The water-soluble species were thenextracted from three duplicate portions by adding 50 ml ofultrapure water, ultrasonicating for 30–60 min and filteringthrough a 0.45 µm membrane. Ion chromatography was ei-ther performed immediately or the sample was stored in a re-frigerator at 4◦C until the analysis. The results from the trip-licate samples were averaged after subtraction of the blankand were used to estimate the particulate dry deposition fluxof IN (pIN). The field blanks did not significantly influencethe observed data.
Atmos. Chem. Phys., 12, 6515–6535, 2012 www.atmos-chem-phys.net/12/6515/2012/

Y. P. Pan et al.: Wet and dry deposition of atmospheric nitrogen in Northern China 6519
2.4 Gaseous dry deposition measurements
The inferential technique, which combines measured con-centrations and modeled dry deposition velocities (Vd), wasused to estimate the gaseous dry deposition flux of N species(Schwede et al., 2011). The ambient NO2, NOx and NH3concentrations were estimated according to the NO−
2 andNH+
4 levels measured in the extracts of diffusive samplers(Analyst, CNR-Institute of Atmospheric Pollution, Roma,Italy) by considering the local temperature and humidity con-ditions of the site, in accordance with the Analyst practi-cal guide (Perrino and Catrambone, 2004; Costabile et al.,2006). Because the NO2 and NOx samplers were exposed si-multaneously over a period of a month, monthly concentra-tion of NO could be calculated as the difference between thetwo values. Previous comparisons between passive samplersand in situ continuous active analyzers for these reactive Nspecies indicated that the Analyst passive sampler is reliablefor such a study (Wu et al., 2010).
The hourlyVd of gaseous NO, NO2 and NH3 were simu-lated using the Models-3/Community Multiscale Air Quality(CMAQ v4.6) system (Byun and Ching, 1999). This modelhas proven to be suitable for regional and urban atmosphericpollution and deposition simulations in China (Zhao, Y. etal., 2009). The driving meteorological inputs were providedby the fifth-generation NCAR/Penn State Mesoscale Model(MM5 v3.7). The monthly-averageVd of NO2, NO and NH3were multiplied with their ambient concentrations measuredby passive samplers during the corresponding period to ob-tain the gaseous dry deposition flux of IN (gIN).
The defaultVd implemented by CMAQ v4.6 in its seconddry deposition scheme (M3Dry) is parameterized followingthe well-known resistance approach (Wesely, 1989). Threeresistances are considered in this theory: aerodynamic re-sistance (Ra), quasi-laminar resistance (Rb), and surface orcanopy resistance (Rc), among which theRc is the most dif-ficult one to simulate (Zhang et al., 2008b). TheVd is ex-pressed as
Vd = (Ra+ Rb + Rc)−1. (1)
Vd here was taken from a height of 38 m above ground, whichis the center of the lowest layer in the CMAQ model. Al-thoughVd is calculated not according to the measurementheight at each site, it results in insignificant errors in flux es-timates, because the differences ofVd between 10 and 50 mwere estimated in previous reports to be only a few percentunder neutral and unstable atmospheric conditions (Zhang etal., 2005). On the other hand, during the night when the con-ditions are stable,Vd was much lower due to the limited ver-tical dispersion of pollutants (Zhou et al., 2010).
Different from most gases that are consistently deposited,the surface–atmosphere exchange of NH3 is bi-directional,but in CMAQ v4.6 it is treated as dry deposition only (Byunand Ching, 1999). Bi-directional exchange of NH3 was de-veloped in the latest version of CMAQ v5.0, but cannot be
applied in the present study due to the lack of input parame-ters. Since the principle of bi-directional NH3 exchange wasnot involved in the present study, the flux calculated here rep-resents a rather non-conservative N deposition estimate (up-per boundary). The overestimation may be significant overmanaged agricultural ecosystems, because the canopy com-pensation point is generally larger over agricultural crops andfertilized vegetation (Zhang et al., 2010; Marner and Harri-son, 2004). Therefore, the effects of the stomatal compen-sation point on NH3 deposition in agricultural sites due tothe counterbalance between deposition and emission are dis-cussed in Sect. 3.5.4.
2.5 Statistics
A one-way analysis of variance (ANOVA) and nonparamet-ric tests were conducted to examine the significance of differ-ences in the annual wet and dry deposition flux of N speciesfor all ten sites over the three years of the study. A pairedT-test was not applied in this study, because the atmosphericdeposition flux of N species was not always normally dis-tributed, neither among the ten sites nor in different seasons.A linear regression analysis was used to investigate relation-ships between precipitation and the wet deposition of INor relationships between measured species (e.g., SO2−
4 vs.NO−
3 ). All statistical analyses were performed using the soft-ware Origin 8.0 (Origin Lab Corporation, Northampton, MA,USA) and SPSS 11.5 (SPSS Inc., Chicago, IL, USA).
3 Results and discussion
3.1 Wet deposition flux of N species
3.1.1 Spatial variations ofwIN
The mean annualwIN at the ten sites during the period from2008 to 2010 ranged from 16.3 to 28.2 kg N ha−1 yr−1, with63 % to 78 % in the reduced NH+4 form (Fig. 2a). The con-tribution of NO−
3 to the wIN (21–36 %) was less than thatof NH+
4 , whereas NO−2 played a minor or insignificant role.The wet deposition flux of NH+4 (wNH+
4 ) was, on average,2.7-times greater than that of NO−
3 (wNO−
3 ). This differ-ence was more pronounced in the agricultural sites (LC andYC), thereby indicating thatwNH+
4 had a greater contribu-tion to wIN in agricultural areas than in urban and industrialareas. The estimatedwIN varied among the sites; the high-est values occurred at the TG site (28.2 kg N ha−1 yr−1) fol-lowed by the BJ and YC sites (27.9 and 24.8 kg N ha−1 yr−1).The wIN results were similar for the BD, CZ, LC, TS, YFand TJ sites, with values of 23.1, 22.6, 22.2, 21.6, 20.7 and18.1 kg N ha−1 yr−1, respectively. As expected, the lowestflux was observed at the rural XL site, with a three-year meanvalue of 16.3 kg N ha−1 yr−1, 10–42 % lower than that ofthe other sites. However, the differences were not significant
www.atmos-chem-phys.net/12/6515/2012/ Atmos. Chem. Phys., 12, 6515–6535, 2012

6520 Y. P. Pan et al.: Wet and dry deposition of atmospheric nitrogen in Northern China
B J T J B D T G T S Y F C Z L C Y C X L
0
1
2
3
4
B J T J B D T G T S Y F C Z L C Y C X L0
1 0
2 0
3 0
4 0
M C R SA RS UI A
Molar
ratio
of NH
4+ /NO3−
Wet d
epos
ition o
f N sp
ecies
(kg N
ha−1
yr−1)
N O 3
− N O 2− N H 4
+( a ) N H 4+ / N O 3
−
B J T J B D T G T S Y F C Z L C Y C X L
0
1
2
3
4
B J T J B D T G T S Y F C Z L C Y C X L0
2
4
6
8
1 0
M C R SA RS UI A
Molar
ratio
of NH
4+ /NO3−
Dry d
epos
ition o
f part
iculat
e N sp
ecies
(kg N
ha−1
yr−1)
N O 3
− N O 2− N H 4
+( b ) N H 4+ / N O 3
−
B J T J B D T G T S Y F C Z L C Y C X L
0
1
2
3
4
B J T J B D T G T S Y F C Z L C Y C X L0
2 0
4 0
6 0
8 0( c )
M C R SA RS UI A
Molar
ratio
of NH
3/NO2
Dry d
epos
ition o
f gas
eous
N sp
ecies
(kg N
ha−1
yr−1)
N O 2 N O N H 3 N H 3 / N O 2
S u m m e r W i n t e r S u m m e r W i n t e r S u m m e r W i n t e r S u m m e r W i n t e r S u m m e r W i n t e r
0
1
2
3
4
S u m m e r W i n t e r S u m m e r W i n t e r S u m m e r W i n t e r S u m m e r W i n t e r S u m m e r W i n t e r0
1
2
3
4
5
Molar
ratio
of NH
4+ /NO3−
N spe
cies in
coars
e part
icles (
µg N
m−3)
N H 4
+ N O 3-
B D B J T J T S X L
( d ) N H 4+ / N O 3
-
Fig. 2. Atmospheric deposition flux of nitrogen species at the ten selected sites in Northern China. The data shown are means of three-yearobservations, with the error bars denoting standard deviation. MC, IA, SU, AR and RS denote urban, industrial, suburban, agricultural andrural sites, respectively. The definition of the site codes is found in the caption of Fig. 1. The molar ratios of NH+
4 to NO−
3 in precipitation(a) and dry-deposited particles(b) were calculated using flux data, whereas the molar ratio of gaseous NH3 to NO2 was calculated usingconcentration data(c). The concentrations of NH+4 and NO−
3 in coarse particles with a diameter larger than 2.1 µm(d) are derived from ourprevious size-resolved compositional analysis performed for particles between 0.1 and 100 µm diameter over bi-weekly intervals during thewinter (from December 2009 to February 2010) and summer (from June to August 2010) at the five sites simultaneously (Sun, 2011). Thedaily aerosol samples were collected on Teflon filters with an 81 mm diameter using a nine-stage cascade impactor (Anderson Series 20-800,USA) at a flow rate of 28.3 l min−1. Therefore, in total, during the period of study, 12 sampling campaigns were carried out at each site. Thepre-treatment and analysis of the samples were similar to the PUF filters described in Sect. 2.3.
(p > 0.05) between the sites or the different years, thus indi-cating the absence of a geographic trend in the spatial distri-bution of wet deposition.
3.1.2 Seasonal variations ofwIN
The mean monthly wet deposition flux of N speciesmonitored for the three years ranged from 0 to12.4 kg N ha−1 month−1 for NH+
4 and from 0 to3.9 kg N ha−1 month−1 for NO−
3 (Fig. 3a, b). The sea-sonal variations of these two N species were similar at eachsite: they were higher during the summer than in the spring,autumn or winter, which corresponded with the seasonaldistribution of precipitation levels in Northern China. Forexample, the totalwNH+
4 andwNO−
3 throughout the summer
(June to August) were, on average, 10.7 and 3.5 kg N ha−1,respectively, for the ten sites during the three-year period;wNH+
4 and wNO−
3 accounted for 66 % and 57 % of theannualwIN, respectively. Correspondingly, the study areareceived 364 mm of rain during the summer, accounting for66 % of the total annual precipitation. On the other hand,the minimumwIN level that occurred in the winter seasonwas attributable to a decrease in precipitation. In general, apositive relationship between the monthly deposition of Nspecies (NH+4 and NO−
3 ) and precipitation was observed ateach site (0.57< r2 < 0.88, p < 0.001), thereby indicatingthat the rainfall amount was an important controllinginfluence on the seasonal trends of N wet deposition.
The above-mentioned positive relationship is similar tothat observed between dissolved organic carbon and the
Atmos. Chem. Phys., 12, 6515–6535, 2012 www.atmos-chem-phys.net/12/6515/2012/

Y. P. Pan et al.: Wet and dry deposition of atmospheric nitrogen in Northern China 6521
D e c J a n F e b M a r A p r M a y J u n J u l A u g S e p O c t N o v0
3
6
9
1 2
B J T J B D T G T S Y F C Z L C Y C X L
Wet d
epos
ition o
f NH 4+ (k
g N ha
−1) S p r i n gW i n t e r S u m m e r A u t u m n( a )
D e c J a n F e b M a r A p r M a y J u n J u l A u g S e p O c t N o v0
1
2
3
4
B J T J B D T G T S Y F C Z L C Y C X L
( b )
Wet d
epos
ition o
f NO 3− (k
g N ha
−1 ) S p r i n gW i n t e r S u m m e r A u t u m n
D e c J a n F e b M a r A p r M a y J u n J u l A u g S e p O c t N o v0 . 0
0 . 5
1 . 0
1 . 5
2 . 0
2 . 5
3 . 0 B J T J B D T G T S Y F C Z L C Y C X L
Dry d
epos
ition o
f part
iculat
e NH 4+ (k
g N ha
− 1)
S p r i n gW i n t e r S u m m e r A u t u m n( c )
D e c J a n F e b M a r A p r M a y J u n J u l A u g S e p O c t N o v0 . 0
0 . 5
1 . 0
1 . 5
2 . 0
2 . 5
3 . 0
A u t u m nS u m m e rS p r i n gW i n t e r( d )
Dry d
epos
ition o
f part
iculat
e NO 3− (k
g N ha
− 1)
B J T J B D T G T S Y F C Z L C Y C X L
D e c J a n F e b M a r A p r M a y J u n J u l A u g S e p O c t N o v0
5
1 0
1 5
2 0
2 5 B J T J B D T G T S Y F C Z L C Y C X L
( e )
Dry d
epos
ition o
f gas
eous
NH3 (k
g N ha
−1)
S p r i n gW i n t e r S u m m e r A u t u m n
D e c J a n F e b M a r A p r M a y J u n J u l A u g S e p O c t N o v0 . 0
0 . 2
0 . 4
0 . 6
0 . 8
1 . 0
1 . 2 ( f ) B J T J B D T G T S Y F C Z L C Y C X L
Dry d
epos
ition o
f gas
eous
NO2 (k
g N ha
−1)
S p r i n gW i n t e r S u m m e r A u t u m n
Fig. 3.Seasonal variations of the atmospheric deposition flux of nitrogen species at the ten selected sites in Northern China. The data shownare the monthly mean± standard deviations of three-year observations (from December 2007 to November 2010). The definition of the sitecodes is found in the caption of Fig. 1.
amount of precipitation in the target areas (Pan et al., 2010a).Previous studies have also reported consistent precipitationeffects on the wet deposition of N and other soluble species(Zhao, X. et al., 2009; Zhang et al., 2008a; Guo et al., 2008),thus suggesting that the amount of rainfall influences theseasonal trends of wet deposition at a given site. However,the wet deposition of N species in June through Septemberfluctuated dramatically between the sites (Fig. 3a, b), anddifferences between the precipitation and deposition trendswere observed (Fig. 4a). These monthly fluctuations could bepartially explained by the variable amounts of precipitation.However, differences in the precursor atmospheric concen-trations of N species are also contributing factors.
3.1.3 Effects of the precipitation amount on annualwIN
Factors influencing the regional variations of annual wet de-position were investigated on the basis of the scavengingratios following previous studies (Sakata et al., 2006). Theconcept of the scavenging ratio is based on the simplifiedassumption that the concentration of a component in precip-itation (Cp) is related to the concentration of the respectivecompound in the air (Ca). Thus, the scavenging ratio can becalculated on a mass basis
W = Cp/Ca. (2)
www.atmos-chem-phys.net/12/6515/2012/ Atmos. Chem. Phys., 12, 6515–6535, 2012

6522 Y. P. Pan et al.: Wet and dry deposition of atmospheric nitrogen in Northern China
When the precipitation amount is expressed asP , the wetdeposition flux of the constituents (F ) depends onW , Ca andP by
F = WCaP. (3)
Therefore, if the scavenging ratio and atmospheric concen-trations are constant in the region, the wet deposition fluxincreases in proportion to the precipitation amount. How-ever, for the sites with higher concentrations of pollutants,the wet deposition flux was greater than expected from theamount of precipitation based on the above premise (i.e.,WCa = constant). This allows us to evaluate the degree in-fluenced by anthropogenic emissions at each site, using therelationship between the wet deposition of N species and theprecipitation amount.
The statistical analysis of data from the three-year periodrevealed a positive relationship between the annualwIN, par-ticularly between thewNH+
4 and the corresponding precip-itation amounts (p < 0.001) (Fig. 4b). However, only 35 %and 44 % of the variance of thewIN (r2
= 0.35) andwNH+
4(r2
= 0.44), respectively, were explained by the amount ofprecipitation. The results suggest marked differences in thescavenging ratio and the atmospheric concentrations of Ncompounds across Northern China. Specifically, thewNH+
4values at the BJ, LC and TS sites in certain years tended tobe much higher than those expected from the precipitationamount, thereby indicating a large contribution of anthro-pogenic emissions. However, the relatively lowwNH+
4 valuesat the XL site compared with those expected from the pre-cipitation amount may be due to the lower number of anthro-pogenic sources in the rural areas. In contrast to the trendsof wIN and wNH+
4 , the annualwNO−
3 values were not sig-nificantly correlated with the precipitation amount (Fig. 4b),likely because the annualwNO−
3 values were strongly depen-dent on local anthropogenic sources.
3.1.4 Source information of N species in precipitation
To obtain additional source information on the wet deposi-tion at the local scale, the molar ratio of NH+
4 /NO−
3 wascalculated and is presented in Fig. 2a. The molar ratio ofNH+
4 /NO−
3 varied between 1.8 (YF) and 3.3 (LC), and theaverage was 2.7. The results indicate that NH3 from agri-culture and human and animal excrement remains the majorcontributor to wet N deposition in the target areas, comparedwith the NO−
3 from fossil fuel combustion in industry andtransportation (Fahey et al., 1999). This fact was more pro-nounced at the agricultural sites, YC and LC, than at certainindustrial and urban sites such as BD, TJ and TS. However,for the wet N deposition, the contribution from NO−
3 was rel-atively more important at the BJ, XL and YF sites, consider-ing that the ratio of NH+4 /NO−
3 at these sites was much lowerthan the values at the other sites. Of note is thatwNO−
3 in cer-tain months at the mega city BJ site (April, June–September)
D e c J a n F e b M a r A p r M a y J u n J u l A u g S e p O c t N o v0
5 0
1 0 0
1 5 0
2 0 0
2 5 0
3 0 0
3 5 0
4 0 0
B J T J B D T G T S Y F C Z L C Y C X L
Precip
itatio
n (mm
)
S p r i n gW i n t e r S u m m e r A u t u m n( a )
0 2 0 0 4 0 0 6 0 0 8 0 0 1 0 0 00
1 0
2 0
3 0
4 0
N O 3
−+ N H 4+ ( y = 1 0 . 5 + 0 . 0 2 2 x , r 2 = 0 . 3 5 , p < 0 . 0 0 0 1 )
N H 4+ ( y = 5 . 9 0 + 0 . 0 1 9 x , r 2 = 0 . 4 4 , p < 0 . 0 0 0 1 )
N O 3− ( y = 4 . 5 9 + 0 . 0 0 3 x , r 2 = 0 . 0 5 2 , p > 0 . 0 5 )
Wet d
epos
ition o
f N sp
ecies
(kg N
ha-1 yr
-1 )
P r e c i p i t a t i o n ( m m )
( b )
Fig. 4. Seasonal variations of precipitation at the ten selected sites(a)and the annual precipitation against wet deposition of nitrogen inNorthern China(b). The seasonal precipitation data are the monthlymean± standard deviations of three-year observations (from De-cember 2007 to November 2010). The definition of the site codesis found in the caption of Fig. 1.
and its suburban YF site (May and June) had high values rel-ative to most sites (Fig. 3b). This result further reflects theeffects of NOx emissions from industry and transportationin urban areas. However, when compared with values at theother sites, thewNH+
4 andwNO−
3 values were especially el-evated in June at the TG site, which was likely the result oflocal anthropogenic sources.
3.1.5 Anthropogenic influence on NO−3 in precipitation
To determine the sources of NO−
3 in precipitation, we per-formed a preliminary inspection of scatter plots of NO−
3 vs.SO2−
4 , which are major contributors to precipitation acidity(Wang et al., 2012). The results revealed that their relation-ships were reasonably explained by linear models at each site(0.56< r2 < 0.94, p < 0.001), indicating some similarities
Atmos. Chem. Phys., 12, 6515–6535, 2012 www.atmos-chem-phys.net/12/6515/2012/

Y. P. Pan et al.: Wet and dry deposition of atmospheric nitrogen in Northern China 6523
in the sources and sinks of these species (Arimoto et al.,1996). This can be due to the fact that in China a large part ofNO−
3 comes from coal combustion, which is the major sourceof SO2−
4 (Zhang, Q. et al., 2009). However, the sources foratmospheric NO−3 are considerably more diverse than SO2−
4 ,especially in urban areas where the contribution from vehi-cle emission cannot be ignored (Huebert et al., 1988). Fol-lowing previous studies (Huebert et al., 1988; Arimoto etal., 1996; Yao et al., 2002), the mass ratio of NO−
3 to SO2−
4(NO−
3 /SO2−
4 ) was used as an indicator to investigate the rel-ative importance of stationary vs. mobile sources of sulfur(S) and N in wet deposition, and two interesting results werefound. One was that the annual NO−
3 /SO2−
4 ratio was lowerthan 1 among all of the sites, revealing that stationary sourceemissions are still the important contributor to these com-pounds in precipitation in Northern China (Yao et al., 2002).Of note is also the fact that the average annual NO−
3 /SO2−
4ratio varied from 0.36 to 0.58 among sites possibly causedby differences in emissions. The ratio was highest at the BJ,YF and XL sites, suggesting these sites received relativelymore emissions from vehicles than other sites. In contrast,lower ratio was recorded at TS, YC, LC and CZ sites due topredominant SO2 emissions from coal-based power plants,industry and residential heating. However, the NO−
3 /SO2−
4ratio may increase in the near future, because the trend ofSO2 emissions would be stable and NOx emissions fromthe transport sector, especially in mega cites, will keep onrising (Zhao, Y. et al., 2009). In Beijing, for example, theNO−
3 /SO2−
4 ratio increased rapidly from 0.24 to 0.58 during1981–2010 (Wang et al., 2012). If this trend continues, it canbe expected that the contribution of mobile sources to NO−
3in precipitation will be enhanced in the coming decades.
3.2 Dry deposition flux of particulate N species
3.2.1 Spatial variations ofpIN
The largest mean annualpIN during the period from 2008to 2010 was observed at the LC site (7.1 kg N ha−1 yr−1)
followed by the BD, TS, YC and CZ sites, with values of6.7, 6.6, 6.5 and 6.5 kg N ha−1 yr−1, respectively (Fig. 2b).However, differences in the monthly mean values at thesesites were not significant (p > 0.05). ThepIN was compa-rable for the BJ, TG, TJ and YF sites, with values of 5.6,5.4, 5.2 and 5.1 kg N ha−1 yr−1, respectively; the monthlymean values at these sites were also not significantly different(p > 0.05). The lowest annual mean flux was observed at theXL site (4.2 kg N ha−1 yr−1), and this result was attributedto the site’s rural characteristics. The monthly mean valuesat this site differed significantly from those at the other sites(p < 0.05) with the exception of YF. In general, NH+
4 (29–72 % of pIN) and NO−
3 (27–70 % ofpIN) were the predom-inant species in thepIN, whereas the contribution of NO−2
was negligible (less than 11 % ofpIN). NH+
4 was the primaryspecies at most of the sites with the exception of BJ, TJ, TSand YF (Fig. 2b).
3.2.2 Seasonal variations ofpIN
During the three-year period, the monthly mean drydeposition flux of particulate N species ranged from0 to 1.1 kg N ha−1 month−1 for NH+
4 and from 0 to1.8 kg N ha−1 month−1 for NO−
3 (Fig. 3c, d). For most sites,the particulate dry deposition flux of NH+4 (pNH+
4 ) washigher in the winter than in the other seasons, which corre-sponded to the period of dry season with lower precipitationin the target areas. ThepNH+
4 was lower in August than inthe other months, probably as a result of efficient wet depo-sition. Compared withpNH+
4 , the particulate dry depositionflux of NO−
3 (pNO−
3 ) showed a different seasonal variationwith a lower flux in the winter than in the other seasons. ThepNO−
3 was notably higher in July, August and September atthe BJ site. This pattern was different from that observed atthe TS site, where thepNO−
3 peaked in September, Octo-ber and November, at the TJ, TG, YC and YF sites, where ahigherpNO−
3 was observed during April and June, and at theXL and CZ sites, where the highestpNO−
3 occurred in Oc-tober. ThepNO−
3 was elevated in June at the TG site, whichwas similar to the wet deposition trend.
3.2.3 Seasonal variations ofpNO−3 vs. NO−
3concentrations in coarse particles
From the above analysis, it can be seen that thepNO−
3 tendto be lower during the winter and higher in other seasons.Compared withpNO−
3 , however, the ambient concentrationsof NO−
3 in PM2.5 and PM10 in the target areas presented adifferent seasonal change pattern peaking in winter (Zhanget al., 2012; Wang et al., 2005). This difference is not sur-prising, because the majority of the dry-deposited NO−
3 re-sults from coarse particles (Holsen and Noll, 1992; Lestari etal., 2003). Therefore, the seasonal variation ofpNO−
3 is ex-pected to be highly correlated to the concentration of NO−
3in coarse particulate matter, considering the fact that the sea-sonal cycle ofVd of coarse particles was not evident (Nho-Kim et al., 2004). This hypothesis is confirmed by our pre-vious size-resolved compositional analysis shown in Fig. 2d,which illustrates that the concentration of NO−
3 in coarse par-ticles with a diameter larger than 2.1 µm was higher in sum-mer than in winter (Sun, 2011). The size distribution of NO−
3in particles was greatly affected by temperature and relativehumidity (Guo et al., 2010), which may favor the formationof coarse mode NO−3 in warm months, and thus the highervalues ofpNO−
3 in summer and fall. Although some inter-pretations for the seasonal variations of dry-deposited NO−
3have been given, more evidence is needed to prove this.
www.atmos-chem-phys.net/12/6515/2012/ Atmos. Chem. Phys., 12, 6515–6535, 2012

6524 Y. P. Pan et al.: Wet and dry deposition of atmospheric nitrogen in Northern China
3.2.4 Partition of particulate dry-deposited N sources
The molar NH+
4 /NO−
3 ratio was also calculated to investi-gate the relative contribution of agriculture vs. industry andtransportation contributions to the dry deposition of particu-late N species (Fig. 2b). Relative to wet deposition, industryand transportation emissions appeared to have a greater im-pact on the composition of dry-deposited particulate N. Sev-eral points may support the view. First, the spatial variationsof pNH+
4 and pNO−
3 differed, thereby indicating differentsources. Second, the NH+
4 /NO−
3 ratio at each site was lowerthan that of wet deposition. Third, NO−3 played a greaterrole than NH+4 in pIN at the BJ, TJ, TS and YF sites, wherethe NH+
4 /NO−
3 was less than 1. This result is not surprising,because these sites are strongly affected by NOx emissionsfrom industry and transportation. The chemical compositionof dry-deposited particulate N was different from the wet-deposited form at these sites, thus reflecting the intense per-turbation of the atmospheric N cycle by anthropogenic activi-ties. However, the ratio was greater than 1 at the BD, LC, CZ,YC, TG and XL sites, which indicates that particulate NH+
4from agriculture and human and animal excrement was themajor contributor topIN. The NH+
4 /NO−
3 ratio at the YC andLC sites reached 2.6, which is twice that of the remainingfour sites and implies that thepIN value in the agriculturalregions was mainly dominated by NH3 from agricultural ac-tivities and not by NOx from industrial activities. This find-ing agrees with the wet deposition results for agricultural re-gions.
3.2.5 Particulate dry-deposited N species vs.composition of particulate matter
It has been found in previous studies that the contribution ofNO−
3 to PM2.5 and PM10 is larger than that of NH+4 , whereasin terms of N, the concentration of NH+4 -N is larger thanNO−
3 -N in both PM2.5 and PM10 (Wang et al., 2005; Heet al., 2001). However, the components of dry-deposited Nat the BJ, TJ, TS and YF sites do not coincide with thesestudies. This inconsistency is not surprising, because largeparticles play a significant role in dry deposition flux due totheir Vd. For example, it was found that the majority of thetotal flux for particulate mass and both SO2−
4 and NO−
3 isdue to coarse particles (Holsen and Noll, 1992; Lestari et al.,2003). Therefore, the composition of dry-deposited particlesis expected to be in agreement with the coarse particulatematter. In our previous size-resolved compositional analysis(Sun, 2011), the concentration of NH+
4 -N is observed to belower than NO−3 -N in coarse particles with a diameter largerthan 2.1 µm at the BJ, TJ and TS sites; however, at the BDsite in winter, the reverse is true (Fig. 2d).This finding coin-cides with the present studies at these sites on dry-depositedN components. To improve current understanding of the re-lationship between coarse particles and deposited N species,
more observation of size-resolved chemical analysis of par-ticulate matter alongside with dry depositions in NorthernChina is necessary.
It should be noted that NH+4 played a greater role thanNO−
3 in pIN at most of the sites with the exception of BJ,TJ, TS and YF (Fig. 2b). At these four sites the contribu-tion of NH+
4 -N is lower than NO−3 -N in particulate N drydeposition. This cannot be attributed simply to NH3 evapo-ration during the sampling period, because the volatilizationof NH+
4 in this study could be a systematic error for all theten sites and not limited to a few sites. As discussed above,we suggest that the relatively high molar ratio of NH+
4 /NO−
3at these four sites was attributed to the enhanced contributionof NO−
3 . This conclusion is reasonable, since these industrialand urban sites are strongly affected by NOx emissions fromconsumption of fossil fuel. This can be further supported bythe measurements that NO−
3 in particles had a larger coarsemode in polluted urban areas of Beijing than its upwind ruralsite (Guo et al., 2010).
3.3 Dry deposition flux of gaseous N species
3.3.1 Spatial variations ofgIN
The spatial variations of the mean annualgIN between 2008and 2010 are presented in Fig. 2c. The results show rela-tively high gIN at the coastal TG site (66.8 kg N ha−1 yr−1)
and the two agricultural sites, YC and LC (39.3 and46.3 kg N ha−1 yr−1, respectively); relatively low valueswere observed at the suburban YF site and the rural XLsite (16.7 and 8.1 kg N ha−1 yr−1, respectively). However,the gIN was approximately equal at the BD, BJ, CZ, TJand TS sites, with values of 28.5, 25.7, 29.8, 28.9 and31.7 kg N ha−1 yr−1, respectively. In general, the annualmeangIN values at the TG and LC sites were significantlyhigher than those at the other eight sites (p < 0.05). In con-trast, the annual meangIN values were significantly lower atthe rural XL and suburban YF sites than those at the othereight sites (p < 0.05), which is indicative of fewer sourcesof emissions.
The year-to-year variations in the annual averagegIN werecomparatively small at each site with the exception of XL,which showed significantly lower values in 2008 than in2009 or 2010 (p < 0.05). Although differences between thethree years are not significant at the 0.05 level at most of thesites, it is important to point out thatgNO2 appears to slightlyincrease year by year except for TJ and TS. The overall av-eragegNO2 at the ten sites was 22 % higher in 2010 than2008. On the other hand, the inter-annual trend ofgNH3 ismore ambiguous than that ofgNO2 at most of the sites, yetthe overall averagegNH3 was 8 % higher in 2010 than 2008.Our finding is consistent with the increasing trend of NOxand NH3 emissions in recent years due to increasing fos-sil fuel combustion and agricultural activities, respectively(Zhao et al., 2008). However, interpreting the relationship
Atmos. Chem. Phys., 12, 6515–6535, 2012 www.atmos-chem-phys.net/12/6515/2012/

Y. P. Pan et al.: Wet and dry deposition of atmospheric nitrogen in Northern China 6525
between emissions and deposition of N without long-termmeasurements is challenging.
Overall, the average gaseous dry deposition of Nspecies in Northern China based on the ten sites was32.2 kg N ha−1 yr−1 during the period from 2008 to 2010.More than 91 % (84–97 %) of this total was attributed toNH3, thereby indicating that NH3 played a more significantrole than NOx in the gIN for agricultural, rural, suburbanand even urban sites. For example, the gaseous dry depo-sition flux of NH3 (gNH3) at the LC and YC sites was 2–3 times higher than that at the urban and industrial sites (BD,TJ, BJ and TS), whereas the gaseous dry deposition flux ofNO2 (gNO2) at these two agricultural sites was compara-ble to or lower than at the other sites. The relatively highgNH3 at the LC and YC sites mainly resulted from localemissions during agricultural activities. Farmers typically ap-ply about 500 kg N ha−1 yr−1 as N fertilizer to achieve highyields of maize and wheat in this region. Of the applied Nfertilizer, however, less than 30 % will be absorbed by thecrops and more than 20 % (ca. 100 kg N ha−1 yr−1) is lost byNH3 emission (Shen et al., 2009). This makes a significantcontribution to highgNH3 in agricultural regions.
3.3.2 Seasonal variations ofgIN
The monthly mean dry deposition flux of gaseous Nspecies during the three-year period ranged from 0.06to 10.4 kg N ha−1 month−1 for NH3 and from 0.02 to0.57 kg N ha−1 month−1 for NO2 (Fig. 3e, f). The seasonalvariations ofgNO2 were similar at most sites, with highervalues observed between May and October, relating to thevariations ofVd (Fig. 5d, discussed below). At the XL site,however, the seasonal distribution ofgNO2 was not distinct,because its concentration was constant throughout the entireyear (Fig. 5c, discussed below). As presented in Fig. 3e, theseasonal trends ofgNH3 at most sites, with the exceptionof TG, did not significantly differ. All sites showed notablepeaks in the summer months (July or August) and lower val-ues in the spring, autumn and winter.
The gNH3 for the TG site in the winter, spring and au-tumn were significantly elevated relative to the summer val-ues. This finding is different from the other locations, in-cluding the urban TJ site. Although the model-estimatedVdfrom the TJ and TG sites were comparable, the flux esti-mates were significantly different because of differences inthe concentration measurements. This result is supported bythe mean NH3 concentrations at the TG site, which were3.3-, 2.4-, 1.6- and 2.9-times higher than those at the TJ siteduring the winter, spring, summer and autumn, respectively(Fig. 5a, discussed below). These high NH3 values at the TGsite throughout the year are indicative of complex local emis-sions from industry, agriculture and other human activities.The difference in NH3 concentrations between the TG andTJ sites was smaller in the summer than in other seasons, be-cause NH3 at the TG site can be readily converted to NH+
4 in
the summer as a result of the higher relative humidity of thecoastal area and wet deposition near the source (Fig. 2a).
3.3.3 Seasonal variations ofVd for gaseous N species
Although NH3 played a greater role than NOx in gIN inNorthern China (Fig. 2c), the mean annual molar ratio ofgaseous concentrations of NH3 to NO2 was lower than 1 atmost sites with the exception of YC and LC, thereby indi-cating that fossil fuel combustion was a dominant factor in-fluencing the concentrations of gaseous N in the air. How-ever, the gas dry deposition flux was determined by both theconcentrations andVd. Even the measured concentrations ofNH3 and NO2 were comparable; the flux estimates can besignificantly different because of differences in the model-estimatedVd.
To give a detailed interpretation for the variations ofgIN,Vd and concentrations of N species are presented in Fig. 5.It can be seen that the mean monthlyVd of NH3 and NO2modeled for the three years fall in the range of 3.9–19.8 and0.2–1.7 mm s−1, respectively. Note that NO was negligible inthegIN (Fig. 2c), since NO is largely an emitted species andits Vd is in the range of 0.2–0.6 mm s−1. The presentVd datacompare well with those from a number of previous studies(Marner and Harrison, 2004; Endo et al., 2010; Yang et al.,2010; Zhang, L. et al., 2009; Hanson and Lindberg, 1991),and provide enhanced spatial and temporal resolution for thisarea (Fig. 5b, d).
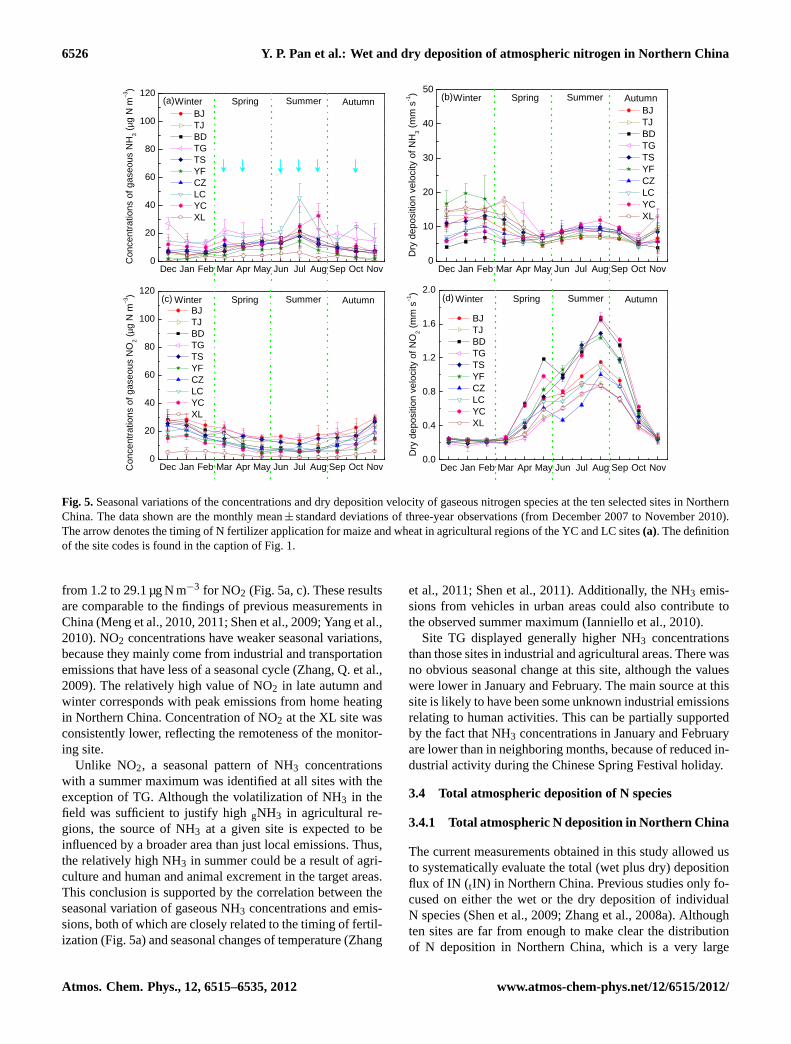
The seasonal variations ofVd for NO2 were similar at eachsite, with higher values simulated in summer. Consideringthe weaker seasonal variations of NO2 concentrations, theseasonality ofgNO2 is a function ofVd. Compared withRaand Rb, Rc is a significant factor determiningVd of NO2(Wesely and Hicks, 2000). The canopy or surface resistancedescribes the uptake process at the surface and in turn is de-pendent on the vegetative characteristics of the underlyingsurface, with smallerRc for surfaces with stronger uptake(Mathur and Dennis, 2003). Therefore, the seasonal varia-tion of Vd for NO2 was primarily caused by differences insurface conditions. Compared to NO2, the dry deposition ofNH3 to most surfaces is a relatively efficient removal process(Sutton et al., 1994); the canopy resistance to NH3 uptake ismuch lower thanRa andRb. Thus,Ra andRb, parameter-ized mainly by the wind speed, are dominant factors. The en-hancedVd of NH3 in winter and early spring may result fromdecreasedRa at high wind speeds in cold seasons, which ismore pronounced in sites nearest mountainous and coastalareas, such as XL, YF, TJ, and TG. However, seasonal varia-tions ofVd for NH3 did not coincide withgNH3, suggestingambient concentration was the determinant ofgNH3.
3.3.4 Seasonal variations of gaseous N concentrations
The mean monthly concentrations of N species measured forthe three years ranged from 0.2 to 45.2 µg N m−3 for NH3 and
www.atmos-chem-phys.net/12/6515/2012/ Atmos. Chem. Phys., 12, 6515–6535, 2012
6526 Y. P. Pan et al.: Wet and dry deposition of atmospheric nitrogen in Northern China
D e c J a n F e b M a r A p r M a y J u n J u l A u g S e p O c t N o v0
2 0
4 0
6 0
8 0
1 0 0
1 2 0 B J T J B D T G T S Y F C Z L C Y C X L
( a )
Conc
entra
tions
of ga
seou
s NH 3 (µ
g N m
−3)
S p r i n gW i n t e r S u m m e r A u t u m n
D e c J a n F e b M a r A p r M a y J u n J u l A u g S e p O c t N o v0
1 0
2 0
3 0
4 0
5 0 B J T J B D T G T S Y F C Z L C Y C X L
( b )
Dry d
epos
ition v
elocity
of NH
3 (mm
s-1 ) S p r i n gW i n t e r S u m m e r A u t u m n
D e c J a n F e b M a r A p r M a y J u n J u l A u g S e p O c t N o v0
2 0
4 0
6 0
8 0
1 0 0
1 2 0 ( c ) B J T J B D T G T S Y F C Z L C Y C X L
Conc
entra
tions
of ga
seou
s NO 2 (µ
g N m
−3) S p r i n gW i n t e r S u m m e r A u t u m n
D e c J a n F e b M a r A p r M a y J u n J u l A u g S e p O c t N o v0 . 0
0 . 4
0 . 8
1 . 2
1 . 6
2 . 0 ( d ) B J T J B D T G T S Y F C Z L C Y C X L
Dry d
epos
ition v
elocity
of NO
2 (mm
s−1) S p r i n gW i n t e r S u m m e r A u t u m n
Fig. 5. Seasonal variations of the concentrations and dry deposition velocity of gaseous nitrogen species at the ten selected sites in NorthernChina. The data shown are the monthly mean± standard deviations of three-year observations (from December 2007 to November 2010).The arrow denotes the timing of N fertilizer application for maize and wheat in agricultural regions of the YC and LC sites(a). The definitionof the site codes is found in the caption of Fig. 1.
from 1.2 to 29.1 µg N m−3 for NO2 (Fig. 5a, c). These resultsare comparable to the findings of previous measurements inChina (Meng et al., 2010, 2011; Shen et al., 2009; Yang et al.,2010). NO2 concentrations have weaker seasonal variations,because they mainly come from industrial and transportationemissions that have less of a seasonal cycle (Zhang, Q. et al.,2009). The relatively high value of NO2 in late autumn andwinter corresponds with peak emissions from home heatingin Northern China. Concentration of NO2 at the XL site wasconsistently lower, reflecting the remoteness of the monitor-ing site.
Unlike NO2, a seasonal pattern of NH3 concentrationswith a summer maximum was identified at all sites with theexception of TG. Although the volatilization of NH3 in thefield was sufficient to justify highgNH3 in agricultural re-gions, the source of NH3 at a given site is expected to beinfluenced by a broader area than just local emissions. Thus,the relatively high NH3 in summer could be a result of agri-culture and human and animal excrement in the target areas.This conclusion is supported by the correlation between theseasonal variation of gaseous NH3 concentrations and emis-sions, both of which are closely related to the timing of fertil-ization (Fig. 5a) and seasonal changes of temperature (Zhang
et al., 2011; Shen et al., 2011). Additionally, the NH3 emis-sions from vehicles in urban areas could also contribute tothe observed summer maximum (Ianniello et al., 2010).
Site TG displayed generally higher NH3 concentrationsthan those sites in industrial and agricultural areas. There wasno obvious seasonal change at this site, although the valueswere lower in January and February. The main source at thissite is likely to have been some unknown industrial emissionsrelating to human activities. This can be partially supportedby the fact that NH3 concentrations in January and Februaryare lower than in neighboring months, because of reduced in-dustrial activity during the Chinese Spring Festival holiday.
3.4 Total atmospheric deposition of N species
3.4.1 Total atmospheric N deposition in Northern China
The current measurements obtained in this study allowed usto systematically evaluate the total (wet plus dry) depositionflux of IN (tIN) in Northern China. Previous studies only fo-cused on either the wet or the dry deposition of individualN species (Shen et al., 2009; Zhang et al., 2008a). Althoughten sites are far from enough to make clear the distributionof N deposition in Northern China, which is a very large
Atmos. Chem. Phys., 12, 6515–6535, 2012 www.atmos-chem-phys.net/12/6515/2012/

Y. P. Pan et al.: Wet and dry deposition of atmospheric nitrogen in Northern China 6527
area, the monitoring has been the most comprehensive onein China till now, especially including dry deposition. Themean annualtIN ranged from 28.5 to 100.4 kg N ha−1 yr−1
over the three-year sampling period at the ten sites (Table 2).The spatial variation oftIN was similar to that of gaseous de-position; the values at the BJ, TJ, BD, TS and CZ sites werehigher than those at the XL and YF sites and lower than thoseat the YC, LC and TG sites. The seasonal variations oftINwere also similar to those of the gaseous deposition; highervalues were observed in the summer (not shown). As statedpreviously, thegIN was different from year to year at eachsite, and there was a slight increasing trend for dry deposi-tion from 2008 to 2010. Yet, as the year-to-year variations ofwIN showed no consistent trend, the inter-annual variationsof tIN were more ambiguous.
The overall meantIN in Northern China was 60.6±
19.6 kg N ha−1 yr−1 during the three-year period. This valuewas significantly higher than previous estimates of the to-tal N deposition in the target area, which ranged from 13to 20 kg N ha−1 yr−1 (Lu and Tian, 2007). This discrepancywas attributed to their omission of certain species, such asNH3, from the synthesis of the observational data. Arithmeticaverage values for the whole region are not good enough,since the sites represent different areas. However, the results,which show extremely high values, are of great importance.When arranged by land use types, the highesttIN in thisstudy was found at the agricultural sites, with an average of73.1 kg N ha−1 yr−1. This value was lower than the total air-borne N input into the agro-ecosystems in the North ChinaPlain, which was estimated to be 83.3 kg N ha−1 yr−1 usingthe integrated total N input (ITNI) system (He et al., 2007).The relatively high values estimated by the ITNI systemare not surprising, because the N deposition estimates fromthis system vary with both the plant development phase andspecies of crops (Russow and Bohme, 2005). In addition, thetIN in this study was likely underestimated, because certaincomponents, such as HNO3, were not measured. However,their inclusion is not expected to significantly increase thetotal deposition because of their limited contribution (Shenet al., 2009).
The overall mean tIN in industrial sites was72.9 kg N ha−1 yr−1 during the three-year period, sec-ond only to agricultural sites and followed by urban,suburban and rural sites, with average values of 55.7, 50.6and 28.5 kg N ha−1 yr−1, respectively. Although it is difficultto compare with other studies type by type, due to the factthat the measurement data in Northern China are lacking,the relatively high values in other land use types than ruralareas are possibly a result of increased N emissions. Sincethere are no serious local emissions within 100 km, the XLsite was usually considered as a background station to un-derstand the regional air pollution in Northern China (Xin etal., 2010). Similarly, the estimatedtIN in the XL site can beused as a reference to characterize the current N depositionin Northern China. Considering that the estimated value
of the XL site was several times higher than that observedby CASTNET, EMEP and EANET (Endo et al., 2010), Ndeposition in the target areas was extremely high. Becausenation-wide emissions of reactive N will continue to rise,Northern China was estimated to receive the maximum Ndeposition values by the CMAQ simulations (Zhao, Y. et al.,2009). Therefore, it is important to evaluate the effects ofincreasing N deposition on different ecosystems in NorthernChina.
3.4.2 Potential effects of N deposition inNorthern China
The effects of N, such as acidification and eutrophication,are mainly related to natural ecosystems and can be evalu-ated using critical loads. For forest and grassland in this areawhere the N deposition may be relatively low, comparisonof critical loads to deposition derived from urban and agri-cultural areas may overestimate the effects of N. To primar-ily evaluate the potential risk of N deposition in NorthernChina, we compared the critical loads for temperate foreststo N deposition levels derived from the XL site, which is lo-cated in a forest area and surrounded by few villages. Al-though thetIN at the XL site (28.5 kg N ha−1 yr−1) are withinthe range of empirical critical loads (10–60 kg N ha−1 yr−1)
for certain temperate forests in the northern part of China(Liu et al., 2010), they reach the highest critical loads cal-culated from the steady state mass balance in the target areas(15–30 kg N ha−1 yr−1) (Duan et al., 2001). This result raisesconcerns regarding the harmful biological and chemical ef-fects on ecosystems, including physiological variations, re-duced biodiversity, elevated nitrate leaching, and changes insoil microorganisms (Liu et al., 2010).
Besides natural ecosystems, the detrimental effects of Ndeposition in many other types, such as agricultural ecosys-tems and water bodies, should be taken into account. Al-though N deposition is an important nutrient resource inthe agricultural areas (He et al., 2007), it may also resultin the enhanced emissions of nitrous oxide (N2O) (Zhanget al., 2011), which is an important greenhouse gas. More-over, coastal waters near industrial regions, such as BohaiBay, may receive greater N loads from atmospheric depo-sition and are susceptible to eutrophication (Barile and La-pointe, 2005; He et al., 2011); e.g., thetIN at the coastalindustrial TG site reached 100.4 kg N ha−1 yr−1. Thus, thepotential risks of heavy N deposition on sensitive terrestrialand aquatic ecosystems should be controlled to within ac-ceptable levels by substantially reducing the amount of reac-tive N emitted into the atmosphere.
Numerical models are useful tools to address these con-cerns, but a major problem of using this approach is that ob-served data to validate the models are often lacking, therebyhampering accurate estimation of N deposition in the targetarea. Northern China is considered to be one of the main“hot reference spots” of atmospheric pollution in East Asia
www.atmos-chem-phys.net/12/6515/2012/ Atmos. Chem. Phys., 12, 6515–6535, 2012

6528 Y. P. Pan et al.: Wet and dry deposition of atmospheric nitrogen in Northern China
Table 2.Contribution of different pathways and species to the estimated total N deposition (kg N ha−1 yr−1) in Northern China.
Location Site Total N deposition WetDry
Reduced N Oxidized NParticle Gas
Urban BJ 59.2 (5.7)b 47.1 % 9.5 % 43.4 % 72.1 % 27.9 %TJ 52.2 (5.6)b 34.7 % 9.9 % 55.4 % 78.4 % 21.6 %
Industrial BD 58.3 (2.8)b 39.6 % 11.5 % 48.9 % 79.0 % 21.0 %TG 100.4 (14.4)a 28.1 % 5.4 % 66.5 % 86.7 % 13.3 %TS 59.9 (3.7)b 36.0 % 11.1 % 52.9 % 77.9 % 22.1 %
Suburban YF 42.4 (7.0)c 48.8 % 11.9 % 39.3 % 70.6 % 29.4 %CZ 58.8 (6.0)b 38.3 % 11.0 % 50.7 % 82.1 % 17.9 %
Agricultural LC 75.5 (6.1)a 29.3 % 9.4 % 61.3 % 87.5 % 12.5 %YC 70.7 (12.0)b 35.1 % 9.2 % 55.7 % 86.7 % 13.3 %
Rural XL 28.5 (3.5)c 57.0 % 14.8 % 28.2 % 72.2 % 27.8 %10-site average 60.6 (19.6) 39.4 % 10.4 % 50.2 % 79.3 % 20.7 %
Standard deviations are in parentheses. Different letters in the “Total N deposition” column indicate significant differences between thesites atp < 0.05. The definition of the site codes is found in the caption of Fig. 1.
due to the rapid development. Therefore, ten monitoring siteswere chosen with varying urban geographies, energy struc-tures and ecosystem types to provide regional informationon N deposition in this region. Although the present investi-gation is far from clearing up all aspects of N deposition inNorthern China, it adds substantially to the existing knowl-edge about the character and amount of the atmospheric Ndeposition to the surrounding environment. Most important,the present observations are very useful to better constrainthe emission inventory and atmospheric chemistry models inthis part of the world. In future research, we will use models(e.g., CMAQ) to address the variations of N deposition andits impact on various areas, not only on urban, rural and agri-cultural regions but also on forests, grasslands and coastalwater bodies in China. We believe the land use area weightedvalue is better than the arithmetic average flux of N deposi-tion for the whole region. Except for the land surfaces, how-ever, the spatio-temporal variations of N deposition in North-ern China are also dependent on the changing emissions andmeteorology conditions. All of these factors will be consid-ered in future modeling work.
3.4.3 Contribution of different pathways to totalN deposition
The dry deposition of gaseous N species was the primarycontributor totIN at most sites, and the contribution rangedfrom 28 % (XL) to 67 % (TG), averaging 50 %. The meanannualgIN ranged from 8.1 to 66.8 kg N ha−1 yr−1, with amean of 32.6 kg N ha−1 yr−1 during the three-year period.The gIN was higher at the agricultural sites, YC and LC,and the industrial site, TG. Given the influence of local NH3emissions from intensive fertilization (Table 1), it is notsurprising that thegIN at the agricultural LC site reached44.5 kg N ha−1 yr−1. However, the significantly highergINat the coastal TG site could be attributable to the influence
of reactive N emissions from anthropogenic sources (seeabove). The influence of fertilization could also explain whythe agricultural YC site had a highergIN than the otherindustrial locations, including BD, TJ and TS; regardlessthe difference was not significant (p > 0.05). The averagevalue of gIN at the two agricultural sites LC and YC was42.8 kg N ha−1 yr−1. This value agrees with the sum of theannualgNH3 and gNO2 (approximately 40 kg N ha−1 yr−1)
that was previously estimated for agricultural regions inChina, but it is significantly higher than values from otheragricultural areas in the world (Shen et al., 2009; Hu et al.,2007). With the exception of the TG, LC, YF and XL sites, noclear differences were found among the other six sites wherethe averagegIN was 30.5 kg N ha−1 yr−1, which is approxi-mately 7-times higher than the values reported by EMEP andEANET (Endo et al., 2010).
The wet deposition contributed 28–57 % to thetIN with amean of 40 %, which was 10 % lower thangIN. The averagewIN at ten sites in Northern China was 22.6 kg N ha−1 yr−1
between 2008 and 2010. This is approximately 5-timesgreater than the values reported by CASTNET, EMEP andEANET (Endo et al., 2010). The estimatedwIN values arealso greater than those reported for most areas of Chinaexcept for the Yangtze River Basin, where the average is27 kg N ha−1 yr−1 (Xie et al., 2008; Zhao, X. et al., 2009).
Compared withwIN and gIN, the proportion ofpIN tothe tIN was relatively small, ranging from 5 % to 15 % andaveraging 10 %. The mean annualpIN ranged from 4.2 to7.1 kg N ha−1 yr−1, with a mean of 5.9 kg N ha−1 yr−1 dur-ing the three-year period. This result is comparable to val-ues from the North China Plain (1.3–9.6 kg N ha−1 yr−1),obtained as the difference between the bulk and wet-onlydeposition (Zhang et al., 2008a), values from SoutheastChina (3.4–7.6 kg N ha−1 yr−1), which were estimated us-ing a water-surrogate surface (Chen et al., 2006), and
Atmos. Chem. Phys., 12, 6515–6535, 2012 www.atmos-chem-phys.net/12/6515/2012/

Y. P. Pan et al.: Wet and dry deposition of atmospheric nitrogen in Northern China 6529
values from other areas around the world, such as Singa-pore (5.9 kg N ha−1 yr−1) (He et al., 2011) and Japan (∼
5 kg N ha−1 yr−1) (Endo et al., 2010), which were estimatedusing the inferential method.
Precipitation, particulate and gas dry deposition of N ac-counted for 40 %, 10 % and 50 % of the total N depositionin Northern China, respectively. To our knowledge, the onlyother simultaneous determination of these three pathways inChina showed that the largest sources of atmospheric N to theforest ecosystem in South China were gases (64 %), followedby rainwater (25 %) and particles (11 %) (Hu et al., 2007).The results from this study suggest that wet deposition can-not be used alone to determine the total deposition, becausethe total flux may be underestimated if the dry deposition ofcertain species or pathways is not considered. Because drydeposition in both the particulate and gaseous phase is an im-portant contribution to total N deposition, additional researchis needed to refine the quantities of dry deposition flux. Thispresent study is a significant step in this direction.
3.4.4 Comparison with emission estimates ofNHx and NOy
Compared with thepIN, bothwIN andgIN are major contrib-utors to thetIN at most sites. Because thegIN and wIN aredominated by NH3 and NH+
4 , the reduced N species (NHx)
was found to contribute 71–88 % of thetIN, whereas the ox-idized species (NOy) constituted only 12–29 % (Table 2).This finding indicates that N deposition is dependent not onlyon the pathway but also on the chemical form, thereby fur-ther highlighting the need to better resolve the relative con-tribution of oxidized and reduced forms of N in regulationstrategies.
Importantly, the field-based evidence from this study canbe used to validate the emission data and has significant im-plications for policy-makers that are attempting to controlatmospheric pollution in Northern China. The mean annualdeposition flux of NHx and NOy during the three-year pe-riod was categorized into five grades and plotted on the mapsshowing the spatial distribution of emissions for the corre-sponding gases (Fig. 6a, c).
NHx deposition at the rural XL site was the lowest(20.6 kg N ha−1 yr−1) of all the sites, which is consistent withthe regional background characteristics of the site (Fig. 6a).The emission data shown in Fig. 6a reveal a little amountof NH3 emissions over the vast mountainous areas to thenorth and west of Beijing. The NHx deposition values atthe suburban YF site (30.0 kg N ha−1 yr−1) were higher thanthose at the XL site, which was possibly a result of hu-man activities. In contrast, the highest NHx deposition flux(87.0 kg N ha−1 yr−1) was found at the TG site, which is notsurrounded by large NH3 emission sources (Fig. 6a), thusindicating that the inventory did not adequately account forNH3 emissions from some unknown industrial sources. Thesecond highest NHx deposition values were observed at the
LC site (66.1 kg N ha−1 yr−1), followed by the YC, CZ, TS,BD, BJ and TJ sites, with values of 61.3, 48.3, 46.7, 46.1,42.7 and 40.9 kg N ha−1 yr−1, respectively. Overall, the spa-tial pattern of NHx deposition reflected changes in NH3 emis-sion sources (Fig. 6b).
The extent of spatial variability of NOy deposition(Fig. 6c) was not as large as that of NHx (Fig. 6a), possi-bly because NOx has fewer natural emission sources thanNH3. Similar to NHx, the lowest NOy deposition values(7.9 kg N ha−1 yr−1) were also observed at the rural XL site,as a result of fewer anthropogenic emissions. This differencein sources could also explain why the agricultural sites YCand LC had relatively low NOy deposition levels comparedwith the suburban sites CZ and YF. However, NOy depositionwas much higher in the urban and industrial areas, includingBJ, BD, TG and TS, where power plant, industry and trans-portation emissions of NOx were also larger than in the sur-rounding regions, as shown in Fig. 6c. NOy deposition wassignificantly higher at the site of BJ than TJ, whereas NOxemissions were lower at BJ than TJ (Fig. 6d). Because theBJ site is close to roads, vehicle emissions may be the majorsource of NOx, and these emissions may be underestimatedin existing gridded inventories.
The spatial patterns of observed NHx and NOy depositioncompare well with NH3 and NOx emissions, respectively.It has been noted elsewhere (Zhao et al., 2008) that NOxand NH3 tend to increase in relation to human activity, andsuch a pattern was identified here. Additionally, NH3 emis-sions were greater than those of NOx in large areas (Fig. 6a,c), which agrees with the field-based evidence mentionedabove. Although the magnitudes of the emissions were notnecessarily proportional to the measurements of deposition(Fig. 6b, d), the applicability of the emissions data cannot bediscounted. If combined with deposition data, emissions in-ventory can be used to distinguish approximate regional dif-ferences in reactive N pollution and help policy-makers im-plement source control decisions. To mitigate atmospheric Ndeposition in Northern China and its potential ecological im-pacts, reactive N emissions, especially NH3 surrounding theBJ, TS and LC sites, must be abated.
3.5 Uncertainty analysis and future research needs
3.5.1 Uncertainties in estimation ofwIN
Since wet deposition was measured directly and gaseous drydeposition was estimated based on modeledVd, the reportedwIN is more accurate than thegIN. However, some light rainevents were not sampled due to malfunctions of the rainfallsampler lid. Of the total number of precipitation samples,16 % were discarded from final analysis due to low volumes(< 20 ml) that did not permit a complete chemical analysis.Thus, these missed samples may result in an underestimationof wIN during the observation period. Clearly, if all of the
www.atmos-chem-phys.net/12/6515/2012/ Atmos. Chem. Phys., 12, 6515–6535, 2012

6530 Y. P. Pan et al.: Wet and dry deposition of atmospheric nitrogen in Northern China
YF
YC
XL
TS
TJ TG
LC
CZ
BJ
BD
118° E117° E116° E115° E114° E
40° N
39° N
38° N
37° N
NH3 emission(kg N/ha per yr)
<2020-5050-9090-160>160
NHx deposition(kg N/ha per yr)
20-4040-5050-6060-7070-90
±
0 50 10025 km
(a)
0 2 5 5 0 7 5 1 0 0 1 2 50
5 0
1 0 0
1 5 0
2 0 0
2 5 0
X L
Y FT J
B J
B D
T S
C Z Y C
L C
T G
NH3 em
ission
(kg N
ha-1 yr
-1 )
N H x d e p o s i t i o n ( k g N h a - 1 y r - 1 )
1 : 1
( b )
YF
YC
XL
TS
TJ TG
LC
CZ
BJ
BD
118° E117° E116° E115° E114° E
40° N
39° N
38° N
37° N
NOx emission(kg N/ha per yr)
<5050-150150-450450-1350>1350
NOy deposition(kg N/ha per yr)
<88-1010-1212-14>14
±
0 50 10025 km
(c)
0 5 1 0 1 5 2 00
1 0 0
2 0 0
3 0 0
4 0 0
5 0 0
6 0 0
X L Y CL C
C Z
T JB D
Y F
T S
T G B J
NO
x emiss
ion (k
g N ha
-1 yr-1 )
N O y d e p o s i t i o n ( k g N h a - 1 y r - 1 )
1 : 1
( d )
Fig. 6. Spatial variations of the atmospheric nitrogen deposition flux with emissions distribution in Northern China. The deposition data ofNOy (oxidized nitrogen) and NHx (reduced nitrogen) are the annual means of three-year observations (from December 2007 to Novem-ber 2010). The emission data of NOx and NH3 are from 2008, with a resolution of 9×9 km2. The definition of the site codes is found in thecaption of Fig. 1.
samples were included in the dataset, then the assessment ofwIN could be more precise.
3.5.2 Uncertainties in estimation ofpIN
To date, there is still no generally acceptable technology forsampling and analyzing particulate dry depositions. There-fore, there have been insufficient data to reliably estimateand understandpIN. The throughfall method was usually ap-plied to provide an estimate of the total deposition to forestsoils, including dry deposition, by measuring the amount andcomposition of rain water passing through a forest canopy.However, several problems were also related to this approach
as summarized by previous work (Draaijers et al., 1996;Balestrini et al., 2007). Additionally, this method was con-fined to ecosystems with vegetation (e.g., forest and grass)and not suitable for urban surfaces and water bodies wherevegetation is lacking. Previous studies have found that abucket collected more dry-deposited material than Teflon,foil or coated foil surfaces (Dasch, 1985). Recently, a PUFfilter-based surrogate surface was placed in the glass bucketto successfully collect the dry-deposited airborne particlesfor trace metal analysis (Pan et al., 2010b). The method canavoid particle bounce and is relatively inexpensive and sim-ple; it can be used at a variety of locations and over varying
Atmos. Chem. Phys., 12, 6515–6535, 2012 www.atmos-chem-phys.net/12/6515/2012/
Y. P. Pan et al.: Wet and dry deposition of atmospheric nitrogen in Northern China 6531
time intervals to delineate spatial and temporal information.The method was used in this study to estimatepIN. For largeparticles, gravitational settling is a major component thatcan be sampled with this method. Studies have shown, how-ever, it is difficult to capture fine particles, because the im-paction and interception of particles are important for veg-etative canopies, and their effects are not reproduced in thedesign of any standardized artificial collection device (We-sely and Hicks, 2000). Therefore, the estimation of the dry-deposited particles in this study has potential uncertaintiesand may provide an estimation of the lower limit forpIN.
Additionally, measuring the particles NH+4 and NO−
3 isknown to be plagued with problems due to the semi-volatilityin the form of NH4NO3 (Lestari et al., 2003). In previousstudies, the concentrations of particulate NO−
3 collected bythe weekly filter pack were 7% lower than those by the an-nular denuder system (Sickles et al., 1999). Even the two ex-isting North American inferential dry deposition networks,CASTNET and CAPMoN, have known measurement uncer-tainties due to the volatilization of the particle NH4NO3, andlarge uncertainties in the flux estimates due to differencesin their respective inferential models (Dentener et al., 2009).Since the dry-deposited particles in this study were collectedat ambient temperatures for a relatively long sampling pe-riod, artifacts cannot be prevented due to volatilization ofsome reactive N species, especially NH+
4 and NO−
3 in sum-mer, andpIN could probably be underestimated.
3.5.3 Uncertainties in estimation ofgIN
Measurements of gas dry deposition are technically chal-lenging and expensive, so modeledVd are paired with mea-sured concentrations to estimategIN in this study. However,all models entail a degree of uncertainty and this study isno exception. Due to many factors, including incomplete-ness of observations, uncertainties in chemistry schemes andsparseness of measurements, modeled dry deposition fluxesare very uncertain and can seldom be compared to measure-ments (Pleim and Ran, 2011). For example, NH3 exhibits dis-tinctly bi-directional behavior, where it alternately depositsand emits on diurnal, seasonal, or sometimes longer timescales, yet CMAQ v4.6 is not able to model this real-worldphenomenon. Additionally, the current model works withoutdated land cover databases, because land cover in recentyears was not available. Furthermore, the underlying surfaceparameters (e.g., albedo and surface roughness length) usedin CMAQ were on the basis of early measurements in Eu-rope and the US and may be different from China, possiblyleading to large inconsistencies.
Although it is important to understand the dominance ofthese factors on theVd variations, it still remains unclear howaccurate the model is due to a paucity of measurements. Evenfor ozone dry deposition, which is the most widely measuredsubstance, current model results still show substantial errorscompared to observations (Pleim and Ran, 2011). Since the
experimental data to confirm the calculated resistances forthe large areas meant to be addressed are not available, un-certainties are difficult to quantify (Endo et al., 2010; We-sely, 1989). In a previous comparison of models, relative un-certainties for weekly estimates ofVd computed for selectedgases for selected areas in the eastern US are approximately±30 % (Wesely, 1989). Uncertainties inVd modeling can bereduced if field measurements provide constraints on param-eterizations, but that is beyond the scope of this paper. To re-fine the quantities of dry deposition flux, follow-on field ex-periments will focus on comparisons of the modeling-basedresults against NH3 flux measured by eddy covariance, con-sidering NH3 contributes a larger fraction of the reactive Nbudget.
3.5.4 Effects of the stomatal compensation point onNH3 deposition
NH3 is subject to a bi-directional flux over N-rich ecosys-tems and the net direction of this flux is often uncertain. Todetermine the direction of the NH3 flux, a so-called compen-sation point (C0) was introduced in previous studies (Massadet al., 2010; Sutton et al., 1998). The bi-directional exchangeflux of NH3 (FNH3) is defined as
FNH3 = (Cair − C0)Vd. (4)
Deposition occurs whenC0 is below the ambient concen-trations of NH3 (Cair), otherwise emission occurs.C0 is notavailable in the present study; for simplification,C0 was as-sumed to be 5 µg N m−3 under a crop canopy (Denmead etal., 2008). WhenC0 was set as zero,FNH3 was equal to theflux deposited only (i.e., the NH3 compensation point wasnot taken into account in the flux calculation). The deposi-tion flux of NH3 (F ′
NH3) is then given by
F ′
NH3= CairVd. (5)
Therefore, the ratio ofC0/Cair can be used as an index toevaluate the degree influenced by use and non-use of bi-directional exchange. Using the three-year mean concentra-tions of NH3 at the YC and LC (14.0 and 20.1 µg N m−3)
sites,C0/Cair at these two sites was estimated to be 0.36 and0.25, respectively. This result indicated thatgNH3 would de-crease 36 % and 25 % if NH3 emission from the vegetationwas considered, declining from 37.3 to 24.0 and from 44.1to 33.1 kg N ha−1 yr−1 at the YC and LC sites, respectively.Thus, thegNH3 estimated for the two sites in Figs. 2c and3e should be treated as the high-end values. Ignoring the bi-directional NH3 exchange is unlikely to significantly over-estimate the total flux, but will result in misleading spatialvariation of that flux. Additional work is required to evaluatebi-directional NH3 exchange more thoroughly over agricul-tural areas, in the context of the stomatal compensation point,as well as an extension of this framework to the whole region.
www.atmos-chem-phys.net/12/6515/2012/ Atmos. Chem. Phys., 12, 6515–6535, 2012

6532 Y. P. Pan et al.: Wet and dry deposition of atmospheric nitrogen in Northern China
4 Conclusions
Although uncertainties existed in the current estimation ofatmospheric N deposition, this is the first time such anexperiment-based work has been applied to quantify the indi-vidual N species deposited via precipitation (wet deposition)and as gases and particles (dry deposition) simultaneously inNorthern China. This unique dataset provides field-based ev-idence that the total N deposition is significantly higher thanprevious estimates in the target area and in other regions ofthe world, thus prompting concerns regarding ecological im-pacts. We consider that the results presented are importantnot only to inform policy-makers on abatement of pollutantemissions and ecosystem protection but also to initiate fur-ther detailed studies. The major results and conclusions areas follows.
1. Clear seasonal variations were observed, although spa-tial differences in thewIN were not significant betweenthe ten sites or in the different years. While the spatialvariations of annualwNH+
4 throughout Northern Chinacan mainly be explained by the precipitation amount,annualwNO−
3 was strongly dependent on local emis-sions from coal burning. NH+4 remains the major con-tributor to wet N deposition in the target areas, but thecontribution of NO−
3 to wIN was enhanced in certain ur-ban areas due to emissions from vehicles.
2. Relative to wet deposition, the intense perturbation ofthe chemical composition ofpIN due to fossil fuse com-bustion was identified in certain urban and industrialsites, where the molar ratio of NH+4 /NO−
3 was less than1. The peak values ofpNO−
3 in summer and autumnand its enhanced contribution topIN at certain sites aresupported by the measurements that NO−
3 had a largercoarse mode in warm months and in polluted areas. Thecomplex relationship between coarse particles and de-posited N species will be a focus of a future study.
3. Unlike pIN, the seasonal and spatial variations ofgINwere significant. A slight increasing trend of annualgNO2 and gNH3 was observed at most sites, whichis consistent with their emissions in recent years. Al-though the measured concentrations of NH3 and NO2were comparable, NH3 played a more significant rolethan NOx in the annualgIN because of relatively highVd. TheVd was also a dominant factor influencing theseasonal variations ofgNO2. However, the seasonalvariation ofgNH3 was consistent with the ambient con-centration of NH3.
4. The greatest contribution to thetIN was fromgIN, fol-lowed bywIN andpIN. Although there was a slight in-creasing trend for dry deposition from 2008 to 2010, theinter-annual variations oftIN were more ambiguous, be-cause the year-to-year variations ofwIN showed no con-sistent trend. The atmospheric deposition flux of NHx
was greater than that of NOy. Human activities havegreater significant impacts on the deposition of NOythan NHx at certain urban and industrial sites, which isin agreement with NH3 and NOx emission data.
Despite the bias of the current monitoring approach for drydeposition, the results presented in this study clearly demon-strate the importance of the contributions of NH3 to the to-tal N deposition. To mitigate N deposition risks to sensitiveterrestrial and aquatic ecosystems in Northern China, prior-ity should be given to strategies for bringing NH3 emissionsto within acceptable levels. The results also underscore theneed to refine total N deposition measurement over North-ern China, in the context of an improved simulation ofVdfor the gaseous N dry deposition, as well as an extension ofthis framework to the whole country. An alternative methodfor quantifying bi-directional flux of NH3 using eddy covari-ance and concentration measurements is underway and willconstrain the simulatedVd in evaluating the performance ofthe atmospheric chemistry models (e.g., CMAQ). Such mod-els are also needed to provide regional-scale deposition mapsover long-term periods so that the information can be used toinvestigate the detrimental effects of N deposition on variousnatural ecosystems.
Acknowledgements.This work was supported by the KnowledgeInnovation Project of the Chinese Academy of Sciences (No.:KZCX1-YW-06-01), the National Basic Research Program ofChina (No.: 2012CB417100 and 2007CB407303) and the NationalNatural Science Foundation of China (No.: 41021004). The authorswould like to thank H. Tang, W. Liu, W. Wang, G. Fu, Y. Chang,X. Feng, Y. Cheng, C. Zhang, Z. Liu and other staff at the tenmonitoring sites for their cooperation during sample collection. Weare indebted to X. Zheng, L. Zhang, Q., Tong, T. Wang, X. Tie andJ. Shen for their constructive comments and suggestions. The au-thors are also grateful to two anonymous reviewers for stimulatinga fruitful discussion, due to which some results presented in thediscussion version of the paper could be revised and expanded.
Edited by: T. Wang
References
Arimoto, R., Duce, R., Savoie, D., Prospero, J., Talbot, R.,Cullen, J., Tomza, U., Lewis, N., and Rayl, B.: Relation-ships among aerosol constituents from Asia and the North Pa-cific during PEM-West A, J. Geophys. Res., 101, 2011–2023,doi:10.1029/95JD01071, 1996.
Balestrini, R., Arisci, S., Brizzio, M. C., Mosello, R., Rogora,M., and Tagliaferri, A.: Dry deposition of particles and canopyexchange: Comparison of wet, bulk and throughfall deposi-tion at five forest sites in Italy, Atmos. Environ., 41, 745–756,doi:10.1016/j.atmosenv.2006.09.002, 2007.
Barile, P. J. and Lapointe, B. E.: Atmospheric nitrogen deposi-tion from a remote source enriches macroalgae in coral reefecosystems near Green Turtle Cay, Abacos, Bahamas, Mar. Pol-
Atmos. Chem. Phys., 12, 6515–6535, 2012 www.atmos-chem-phys.net/12/6515/2012/

Y. P. Pan et al.: Wet and dry deposition of atmospheric nitrogen in Northern China 6533
lut. Bull., 50, 1262–1272,doi:10.1016/j.marpolbul.2005.04.031,2005.
Byun, D. W. and Ching, J. K. S.: Science algorithms of the EPAModels-3 community multiscale air quality (CMAQ) modelingsystem; Report EPA/600/R-99/030; US Environmental Protec-tion Agency: Research Triangle Park, NC, 1999.
Chen, N. W., Hong, H. S., Xiao, J., Zhang, L. P., and Wang, J. P.:Dry deposition of atmospheric nitrogen to Jiulong River water-shed in southeast China, Acta Ecologica Sinica, 26, 2602–2067,2006 (in Chinese).
Clark, H. and Kremer, J. N.: Estimating direct and episodic atmo-spheric nitrogen deposition to a coastal waterbody, Mar. Environ.Res., 59, 349–366,doi:10.1016/j.marenvres.2004.06.001, 2005.
Costabile, F., Bertoni, G., Desantis, F., Wang, F., Weimin, H., Fen-glei, L., and Allegrini, I.: A preliminary assessment of major airpollutants in the city of Suzhou, China, Atmos. Environ., 40,6380–6395,doi:10.1016/j.atmosenv.2006.05.056, 2006.
Dasch, J. M.: Direct measurement of dry deposition to a polyethy-lene bucket and various surrogate surfaces, Environ. Sci. Tech-nol., 19, 721–725,doi:10.1021/es00138a011, 1985.
Denmead, O., Freney, J., and Dunin, F.: Gas exchangebetween plant canopies and the atmosphere: Case-studies for ammonia, Atmos. Environ., 42, 3394–3406,doi:10.1016/j.atmosenv.2007.01.038, 2008.
Dentener, F., Vet, B., Dennis, R., Enza, D., Kulshrestha,U., and Galy-Lacaux, C.: Progress in monitoring andmodelling estimates of N deposition at local, regionaland global scales, available at:http://www.initrogen.net/fileadmin/userupload/2009edinburgh/backgrounddocuments/Topic1-DepositionBackgroundDocument.pdf (last access:13 July 2012), 2009.
Dise, N. B. and Wright, R. F.: Nitrogen leaching from Europeanforests in relation to nitrogen deposition, Forest Ecol. Manag.,71, 153–161,doi:10.1016/0378-1127(94)06092-W, 1995.
Draaijers, G. P. J., Spranger, T., Erisman, J. W., and Wyers,G. P.: The application of throughfall measurements for atmo-spheric deposition monitoring, Atmos. Environ., 30, 3349–3361,doi:10.1016/1352-2310(96)00030-1, 1996.
Duan, L., Xie, S., Zhou, Z., Ye, X., and Hao, J.: Calculation andmapping of critical loads for S, N and acidity in China, WaterAir. Soil Poll., 130, 1199–1204,doi:10.1023/A:1013908629150,2001.
Endo, T., Yagoh, H., Sato, K., Matsuda, K., Hayashi, K., Noguchi,I., and Sawada, K.: Regional characteristics of dry deposi-tion of sulfur and nitrogen compounds at EANET sites inJapan from 2003 to 2008, Atmos. Environ., 45, 1259–1267,doi:10.1016/j.atmosenv.2010.12.003, 2010.
Fahey, T. J., Williams, C. J., Rooney-Varga, J. N., Cleveland,C. C., Postek, K. M., Smith, S. D., and Bouldin, D. R.: Ni-trogen deposition in and around an intensive agricultural dis-trict in central New York, J. Environ. Qual., 28, 1585–1600,doi:10.2134/jeq1999.00472425002800050025x, 1999.
Fenn, M. E., Poth, M. A., Aber, J. D., Baron, J. S., Bormann, B.T., Johnson, D. W., Lemly, A. D., McNulty, S. G., Ryan, D. F.,and Stottlemyer, R.: Nitrogen excess in North American ecosys-tems: predisposing factors, ecosystem responses, and manage-ment strategies, Ecol. Appl., 8, 706–733,doi:10.2307/2641261,1998.
Flechard, C. R., Nemitz, E., Smith, R. I., Fowler, D., Vermeulen, A.T., Bleeker, A., Erisman, J. W., Simpson, D., Zhang, L., Tang,Y. S., and Sutton, M. A.: Dry deposition of reactive nitrogen toEuropean ecosystems: a comparison of inferential models acrossthe NitroEurope network, Atmos. Chem. Phys., 11, 2703–2728,doi:10.5194/acp-11-2703-2011, 2011.
Galloway, J. N., Schlesinger, W. H., Hiram Levy, I. I., Michaels,A., and Schnoor, J. L.: Nitrogen fixation: anthropogenicenhancement-environmental response, Global. Biogeochem. Cy,9, 235–252,doi:10.1029/95GB00158, 1995.
Gruber, N. and Galloway, J. N.: An Earth-system perspec-tive of the global nitrogen cycle, Nature, 451, 293–296,doi:10.1038/nature06592, 2008.
Guo, S., Hu, M., Wang, Z. B., Slanina, J., and Zhao, Y. L.: Size-resolved aerosol water-soluble ionic compositions in the summerof Beijing: implication of regional secondary formation, Atmos.Chem. Phys., 10, 947–959,doi:10.5194/acp-10-947-2010, 2010.
Guo, Y., Feng, X., Li, Z., He, T., Yan, H., Meng, B., Zhang, J.,and Qiu, G.: Distribution and wet deposition fluxes of total andmethyl mercury in Wujiang River Basin, Guizhou, China, Atmos.Environ., 42, 7096–7103,doi:10.1016/j.atmosenv.2008.06.006,2008.
Hanson, P. J. and Lindberg, S. E.: Dry deposition of reactive nitro-gen compounds: A review of leaf, canopy and non-foliar mea-surements, Atmos. Environ., 25, 1615–1634,doi:10.1016/0960-1686(91)90020-8, 1991.
He, C. E., Liu, X. J., Fangmeier, A., and Zhang, F. S.: Quanti-fying the total airborne nitrogen input into agroecosystems inthe North China Plain, Agr. Ecosyst. Environ., 121, 395–400,doi:10.1016/j.agee.2006.12.016, 2007.
He, J., Balasubramanian, R., Burger, D. F., Hicks, K., Kuylen-stierna, J. C. I., and Palani, S.: Dry and wet atmospheric deposi-tion of nitrogen and phosphorus in Singapore, Atmos. Environ.,45, 2760–2768doi:10.1016/j.atmosenv.2011.02.036, 2011.
He, K., Yang, F., Ma, Y., Zhang, Q., Yao, X., Chan, C. K.,Cadle, S., Chan, T., and Mulawa, P.: The characteristics ofPM2.5 in Beijing, China, Atmos. Environ., 35, 4959–4970,doi:10.1016/s1352-2310(01)00301-6, 2001.
Hill, K. A., Shepson, P. B., Galbavy, E. S., and Anastasio, C.:Measurement of wet deposition of inorganic and organic nitro-gen in a forest environment, J. Geophys. Res., 110, G02010,doi:10.1029/2005jg000030, 2005.
Holsen, T. M. and Noll, K. E.: Dry deposition of atmospheric parti-cles: application of current models to ambient data, Environ. Sci.Technol., 25, 1807–1815,doi:10.1021/es00033a015, 1992.
Hu, Z. Y., Xu, C. K., Zhou, L. N., Sun, B. H., He, Y. Q., Zhou,J., and Cao, Z. H.: Contribution of Atmospheric Nitrogen Com-pounds to N Deposition in a Broadleaf Forest of Southern China,Pedosphere, 17, 360–365,doi:10.1016/S1002-0160(07)60043-5,2007.
Huebert, B. J., Wang, M. X., and Lu, W. X.: Atmospheric nitrate,sulfate, ammonium and calcium concentrations in China, TellusB, 40, 260–269,doi:10.1111/j.1600-0889.1988.tb00296.x, 1988.
Ianniello, A., Spataro, F., Esposito, G., Allegrini, I., Rantica, E.,Ancora, M. P., Hu, M., and Zhu, T.: Occurrence of gas phaseammonia in the area of Beijing (China), Atmos. Chem. Phys.,10, 9487–9503,doi:10.5194/acp-10-9487-2010, 2010.
Lu, C. Q. and Tian, H. Q.: Spatial and temporal patterns of nitrogendeposition in China: Synthesis of observational data, J. Geophys.
www.atmos-chem-phys.net/12/6515/2012/ Atmos. Chem. Phys., 12, 6515–6535, 2012
6534 Y. P. Pan et al.: Wet and dry deposition of atmospheric nitrogen in Northern China
Res., 112, D22S05,doi:10.1029/2006JD007990, 2007.Larssen, T., Lydersen, E., Tang, D., He, Y., Gao, J., Liu, H., Duan,
L., Seip, H., Vogt, R., and Mulder, J.: Acid rain in China, Envi-ron. Sci. Technol., 40, 418–425,doi:10.1021/es0626133, 2006.
Lestari, P., Oskouie, A. K., and Noll, K. E.: Size distribution anddry deposition of particulate mass, sulfate and nitrate in an ur-ban area, Atmos. Environ., 37, 2507–2516,doi:10.1016/s1352-2310(03)00151-1, 2003.
Liu, X., Ju, X., Zhang, Y., He, C., Kopsch, J., andFusuo, Z.: Nitrogen deposition in agroecosystems inthe Beijing area, Agr. Ecosyst. Environ., 113, 370–377,doi:10.1016/j.agee.2005.11.002, 2006.
Liu, X., Duan, L., Mo, J. M., Du, E., Shen, J. L., Lu, X. K., Zhang,Y., Zhou, X. B., He, C. E., and Zhang, F. S.: Nitrogen depositionand its ecological impact in China: An overview, Environ. Pol-lut., 155, 2251–2264,doi:10.1016/j.envpol.2010.08.002, 2010.
Marner, B. B. and Harrison, R. M.: A spatial refined monitoringbased study of atmospheric nitrogen deposition, Atmos. Envi-ron., 38, 5045–5056,doi:10.1016/j.atmosenv.2004.06.016, 2004.
Massad, R. S., Tuzet, A., Loubet, B., Perrier, A., and Cellier,P.: Model of stomatal ammonia compensation point (STAMP)in relation to the plant nitrogen and carbon metabolismsand environmental conditions, Ecol. Model., 221, 479–494,doi:10.1016/j.ecolmodel.2009.10.029, 2010.
Mathur, R. and Dennis, R. L.: Seasonal and annual modeling of re-duced nitrogen compounds over the eastern United States: Emis-sions, ambient levels, and deposition amounts, J. Geophys. Res,108, 4481,doi:10.1029/2002JD002794, 2003.
Meng, Z. Y., Xu, X. B., Wang, T., Zhang, X. Y., Yu, X. L., Wang, S.F., Lin, W. L., Chen, Y. Z., Jiang, Y. A., and An, X. Q.: Ambientsulfur dioxide, nitrogen dioxide, and ammonia at ten backgroundand rural sites in China during 2007–2008, Atmos. Environ., 44,2625–2631,doi:10.1016/j.atmosenv.2010.04.008, 2010.
Meng, Z. Y., Lin, W. L., Jiang, X. M., Yan, P., Wang, Y., Zhang,Y. M., Jia, X. F., and Yu, X. L.: Characteristics of atmosphericammonia over Beijing, China, Atmos. Chem. Phys., 11, 6139–6151,doi:10.5194/acp-11-6139-2011, 2011.
Nho-Kim, E. Y., Michou, M., and Peuch, V. H.: Parame-terization of size-dependent particle dry deposition veloci-ties for global modeling, Atmos. Environ., 38, 1933–1942,doi:10.1016/j.atmosenv.2004.01.002, 2004.
Pan, Y. P., Wang, Y. S., Xin, J. Y., Tang, G. Q., Song, T., Wang, Y.H., Li, X. R., and Wu, F. K.: Study on dissolved organic carbonin precipitation in Northern China, Atmos. Environ., 44, 2350–2357,doi:10.1016/j.atmosenv.2010.03.033, 2010a.
Pan, Y. P., Wang, Y. S., Yang, Y. J., Wu, D., Xin, J. Y., and Fan, W.Y.: Determination of trace metals in atmospheric dry depositionwith a heavy matrix of PUF by inductively coupled plasma massspectroscopy after microwave digestion, Environ. Sci., 31, 553–559, 2010b (in Chinese).
Park, S. U. and Lee, Y. H.: Spatial distribution of wet deposi-tion of nitrogen in South Korea, Atmos. Environ., 36, 619–628,doi:10.1016/S1352-2310(01)00489-7, 2002.
Perrino, C. and Catrambone, M.: Development of a variable-path-length diffusive sampler for ammonia and evaluation of ammoniapollution in the urban area of Rome, Italy, Atmos. Environ., 38,6667–6672,doi:10.1016/j.atmosenv.2004.08.032, 2004.
Pleim, J. and Ran, L.: Surface flux modeling for air quality ap-plications, Atmosphere, 2, 271–302,doi:10.3390/atmos2030271,
2011.Pryor, S. C., Barthelmie, R. J., and Jensen, B.: Nitrogen dry depo-
sition at an AmeriFlux site in a hardwood forest in the MidWest,Geophys. Res. Lett., 26, 691–694,doi:10.1029/1999GL900066,1999.
Russow, R. and Bohme, F.: Determination of the total nitrogendeposition by the15N isotope dilution method and problemsin extrapolating results to field scale, Geoderma, 127, 62–70,doi:10.1016/j.geoderma.2004.11.015, 2005.
Sakata, M., Marumoto, K., Narukawa, M., and Asakura, K.:Regional variations in wet and dry deposition fluxes oftrace elements in Japan, Atmos. Environ., 40, 521–531,doi:10.1016/j.atmosenv.2005.09.066, 2006.
Schwede, D., Zhang, L., Vet, R., and Lear, G.: An intercom-parison of the deposition models used in the CASTNETand CAPMoN networks, Atmos. Environ., 45, 1337–1346doi:10.1016/j.atmosenv.2010.11.050, 2011.
Shen, J. L., Tang, A. H., Liu, X. J., Fangmeier, A., Gould-ing, K. T. W., and Zhang, F. S.: High concentrations anddry deposition of reactive nitrogen species at two sites inthe North China Plain, Environ. Pollut., 157, 3106–3113,doi:10.1016/j.envpol.2009.05.016, 2009.
Shen, J. L., Liu, X. J., Fangmeier, A., Goulding, K., and Zhang, F.S.: Atmospheric ammonia and particulate ammonium from agri-cultural sources in the North China Plain, Atmos. Environ., 45,5033–5041,doi:10.1016/j.atmosenv.2011.02.031, 2011.
Sickles, I. J. E., Hodson, L. L., and Vorburger, L. M.: Evaluation ofthe filter pack for long-duration sampling of ambient air, Atmos.Environ., 33, 2187–2202,doi:10.1016/s1352-2310(98)00425-7,1999.
Sun, Y.: Chemical composition and mass closure of particulate mat-ter in Beijing ,Tianjin and Hebei megacities, Northern China, Ms.thesis, Capital Normal University, Beijing, 69 pp., 2011.
Sutton, M. A., Asman, W. A. H., and Schjørring, J. K.:Dry deposition of reduced nitrogen, Tellus B, 46, 255–273,doi:10.1034/j.1600-0889.1994.t01-2-00002.x, 1994.
Sutton, M. A., Burkhardt, J. K., Guerin, D., Nemitz, E., and Fowler,D.: Development of resistance models to describe measurementsof bi-directional ammonia surface-atmosphere exchange, Atmos.Environ., 32, 473–480,doi:10.1016/S1352-2310(97)00164-7,1998.
Tang, A., Zhuang, G., Wang, Y., Yuan, H., and Sun, Y.: The chem-istry of precipitation and its relation to aerosol in Beijing, Atmos.Environ., 39, 3397–3406,doi:10.1016/j.atmosenv.2005.02.001,2005.
Tang, G. Q.: Modelling of ozone spatial-temporal distribution inthe vicinity of Beijing during Olympics, Ph.D thesis, Instituteof Atmospheric Physics, Chinese Academy of Sciences, Beijing,153 pp., 2010.
Townsend, A. R., Braswell, B. H., Holland, E. A., and Penner, J.E.: Spatial and temporal patterns in terrestrial carbon storage dueto deposition of fossil fuel nitrogen, Ecol. Appl., 6, 806–814,doi:10.2307/2269486, 1996.
Vitousek, P., Mooney, H., Lubchenco, J., and Melillo, J.: Hu-man domination of Earth’s ecosystems, Science, 277, 494–499,doi:10.1126/science.277.5325.494, 1997.
Wang, Y., Zhuang, G., Tang, A., Yuan, H., Sun, Y., Chen,S., and Zheng, A.: The ion chemistry and the source ofPM2.5 aerosol in Beijing, Atmos. Environ., 39, 3771–3784,
Atmos. Chem. Phys., 12, 6515–6535, 2012 www.atmos-chem-phys.net/12/6515/2012/

Y. P. Pan et al.: Wet and dry deposition of atmospheric nitrogen in Northern China 6535
doi:10.1016/j.atmosenv.2005.03.013, 2005.Wang, Y., Yu, W., Pan, Y., and Wu, D.: Acid neutralization of pre-
cipitation in Northern China, J. Air. Waste. Manage., 62, 204–211,doi:10.1080/10473289.2011.640761, 2012.
Wesely, M. L.: Parameterization of surface resistances to gaseousdry deposition in regional-scale numerical models, Atmos. Envi-ron., 23, 1293–1304,doi:10.1016/0004-6981(89)90153-4, 1989.
Wesely, M. L. and Hicks, B. B.: A review of the current status ofknowledge on dry deposition, Atmos. Environ., 34, 2261–2282,doi:10.1016/s1352-2310(99)00467-7, 2000.
Wu, D., Wang, Y. S., Pan, Y. P., Xin, J. Y., and Tang, G. Q.: Appli-cation of passive sampler to monitor and study atmospheric tracegases in Beijing-Tianjin-Hebei area, Environ. Sci., 31, 2844–2851, 2010 (in Chinese).
Xie, Y., Xiong, Z., Xing, G., Yan, X., Shi, S., Sun, G., andZhu, Z.: Source of nitrogen in wet deposition to a rice agroe-cosystem at Tai lake region, Atmos. Environ., 42, 5182–5192,doi:10.1016/j.atmosenv.2008.03.008, 2008.
Xin, J. Y., Wang, Y. S., Tang, G. Q., Wang, L. L., Sun, Y., Wang, Y.H., Hu, B., Song, T., Ji, D. S., and Wang, W. F.: Variability andreduction of atmospheric pollutants in Beijing and its surround-ing area during the Beijing 2008 Olympic Games, Chinese. Sci.Bull., 55, 1937–1944,doi:10.1007/s11434-010-3216-2, 2010.
Yang, R., Hayashi, K., Zhu, B., Li, F., and Yan, X.: AtmosphericNH3 and NO2 concentration and nitrogen deposition in an agri-cultural catchment of Eastern China, Sci. Total. Environ., 408,4624–4632,doi:10.1016/j.scitotenv.2010.06.006, 2010.
Yao, X., Chan, C. K., Fang, M., Cadle, S., Chan, T., Mulawa, P., He,K., and Ye, B.: The water-soluble ionic composition of PM2.5 inShanghai and Beijing, China, Atmos. Environ., 36, 4223–4234,doi:10.1016/S1352-2310(02)00342-4, 2002.
Zhang, K., Wang, Y., Wen, T., Meslmani, Y., and Murray, F.: Prop-erties of nitrate, sulfate and ammonium in typical polluted at-mospheric aerosols (PM10) in Beijing, Atmos. Res., 84, 67–77,doi:10.1016/j.atmosres.2006.05.004, 2007.
Zhang, L., Brook, J. R., Vet, R., Wiebe, A., Mihele, C., Shaw,M., O’Brien, J. M., and Iqbal, S.: Estimation of contributionsof NO2 and PAN to total atmospheric deposition of oxidized ni-trogen across Eastern Canada, Atmos. Environ., 39, 7030–7043,doi:10.1016/j.atmosenv.2005.08.023, 2005.
Zhang, L., Vet, R., O’Brien, J. M., Mihele, C., Liang, Z., andWiebe, A.: Dry deposition of individual nitrogen species ateight Canadian rural sites, J. Geophys. Res., 114, D02301,doi:10.1029/2008JD010640, 2009.
Zhang, L., Wright, L. P., and Asman, W. A. H.: Bi-directional air-surface exchange of atmospheric ammonia–A review of mea-surements and a development of a big-leaf model for applica-tions in regional-scale air-quality models, J. Geophys. Res, 115,D20310,doi:10.1029/2009JD013589, 2010.
Zhang, Q., Streets, D. G., Carmichael, G. R., He, K. B., Huo, H.,Kannari, A., Klimont, Z., Park, I. S., Reddy, S., Fu, J. S., Chen,D., Duan, L., Lei, Y., Wang, L. T., and Yao, Z. L.: Asian emis-sions in 2006 for the NASA INTEX-B mission, Atmos. Chem.Phys., 9, 5131–5153,doi:10.5194/acp-9-5131-2009, 2009.
Zhang, X. Y., Wang, Y. Q., Niu, T., Zhang, X. C., Gong, S.L., Zhang, Y. M., and Sun, J. Y.: Atmospheric aerosol com-positions in China: spatial/temporal variability, chemical sig-nature, regional haze distribution and comparisons with globalaerosols, Atmos. Chem. Phys., 12, 779–799,doi:10.5194/acp-12-779-2012, 2012.
Zhang, Y., Liu, X. J., Fangmeier, A., Goulding, K. T. W., andZhang, F. S.: Nitrogen inputs and isotopes in precipitationin the North China Plain, Atmos. Environ., 42, 1436–1448,doi:10.1016/j.atmosenv.2007.11.002, 2008a.
Zhang, Y., Wu, S. Y., Krishnan, S., Wang, K., Queen, A., Aneja, V.P., and Arya, S. P.: Modeling agricultural air quality: Current sta-tus, major challenges, and outlook, Atmos. Environ., 42, 3218–3237,doi:10.1016/j.atmosenv.2007.01.063, 2008b.
Zhang, Y., Liu, J., Mu, Y., Pei, S., and Lun, X.: Emissions of ni-trous oxide, nitrogen oxides and ammonia from a maize fieldin the North China Plain, Atmos. Environ., 45, 2956–2961,doi:10.1016/j.atmosenv.2010.10.052, 2011.
Zhao, X., Yan, X., Xiong, Z., Xie, Y., Xing, G., Shi, S., and Zhu, Z.:Spatial and temporal variation of inorganic nitrogen wet deposi-tion to the Yangtze River Delta Region, China, Water Air. SoilPoll., 203, 277–289,doi:10.1007/s11270-009-0011-2, 2009.
Zhao, Y., Wang, S., Duan, L., Lei, Y., Cao, P., and Hao, J.: Pri-mary air pollutant emissions of coal-fired power plants in China:Current status and future prediction, Atmos. Environ., 42, 8442–8452,doi:10.1016/j.atmosenv.2008.08.021, 2008.
Zhao, Y., Duan, L., Xing, J., Larssen, T., Nielsen, C. P., andHao, J.: Soil Acidification in China: Is Controlling SO2Emissions Enough?, Environ. Sci. Technol., 43, 8021–8026,doi:10.1021/es901430n, 2009.
Zheng, X. H., Fu, C. B., Xu, X. K., Yan, X. D., Huang, Y., Han, S.H., Hu, F., and Chen, G. X.: The Asian nitrogen cycle case study,Ambio, 31, 79–87,doi:10.1579/0044-7447-31.2.79, 2002.
Zhou, J., Cui, J., Fan, J., Liang, J., and Wang, T.: Dry deposi-tion velocity of atmospheric nitrogen in a typical red soil agro-ecosystem in Southeastern China, Environ. Monit. Assess, 167,105–113,doi:10.1007/s10661-009-1034-2, 2010.
www.atmos-chem-phys.net/12/6515/2012/ Atmos. Chem. Phys., 12, 6515–6535, 2012