westinghouse hematite decommissioning project - final
TRANSCRIPT
(:I 2013 Westinghouse Elcc1ric Company LLC All RighL~ Reserved
(i9 Westinghouse
· II l . ; ;- - · - -~ - • -' ...i • -~ - - ~ I - - - -- • ~ .",
Hematite Decommissioning Project
NUMBER: HDP-INST-FSS-LSAOS-02
TITLE: Final Status Survey Plan and Instructions for Survey Area & Unit: LSA 05-02
REVISION: 1
EFFECTIVE DATE: August 12, 2013
Approvals:
Author: Michelle E. Bresnahan
Owner: Joseph S. Guido
Revision: 2 Page P-1 of 10
HDP-PR-FSS-701, Final Status Survey Plan Development APPENDIX P-1
FINAL STATUS SURVEY SAMPLING PLAN FOR SOIL SURVEY UNITS
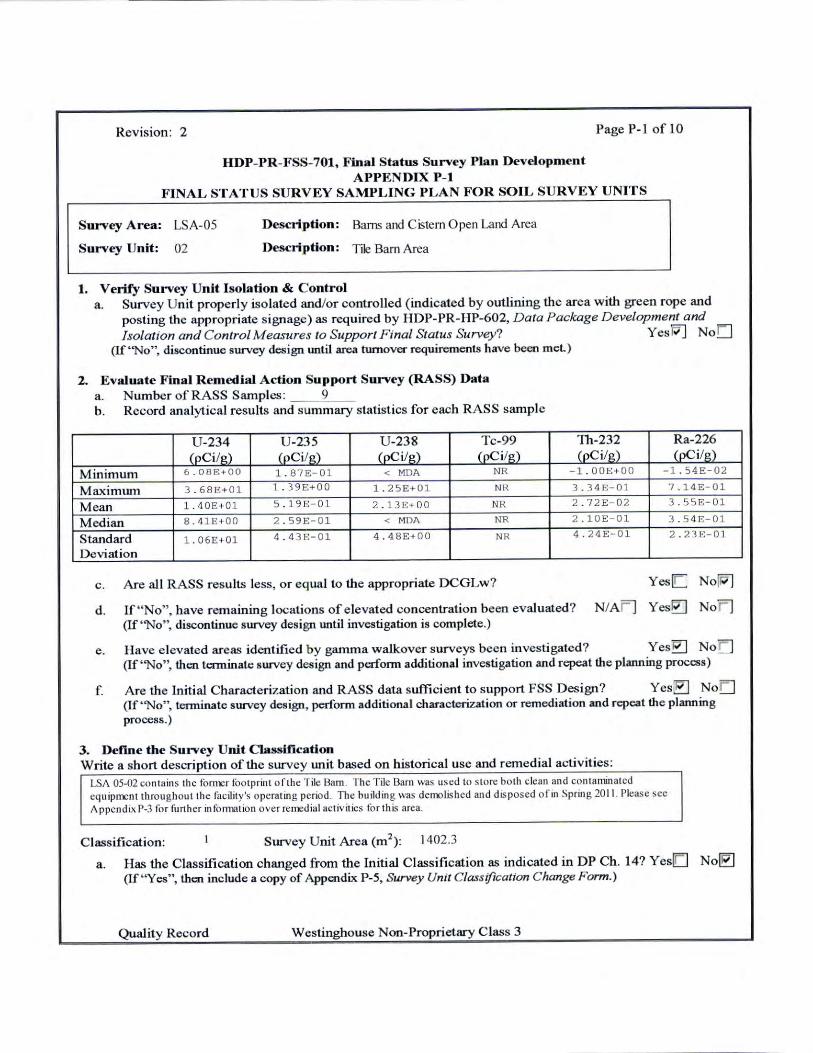
Survey Area: LSA-05
Survey Unit: 02
Description: Barns and Cistern Open Land Area
Description: Tile Barn Area
1. Verify Survey Unit Isolation & Control a. Survey Unit properly isolated and/or controlled (indicated by outlining the area with green rope and
posting the appropriate signage) as required by HDP-PR-I-IP-602, Data Package Development and Isolation and Control Measures to Support Final Status Survey? Yes~ No[]
(If "No", discontinue survey design until area turnover requirements have been meL)
2. Evaluate Final Remedial Action Support Survey {RASS) Data a. Number ofRASS Samples: 9 b. Record analytical results and summary statistics for each RASS sample
U-234 U-235 U-238 Tc-99 Th-232 Ra-226 (oCi/g) (pCi/g) <oCi/g) (pC i/ g) (oCi/Q) (pCi/g)
Minimum 6 . 08E+OO 1. 8'/E- 01 < MD A NR -1 .00E+ OO -l.54E-02
Maximwn 3 . 68E+Ol 1 . 39E+OO 1. 25E+Ol NR 3.34E-01 7.14E-01
Mean l .10E+Ol 5 . 19E- Ol 2 .1 31-:+00 NR 2.72E- 02 3.55E-01
Median 8.41E+OO 2 .59E-01 < MDI\ NR 2.lOE- 01 3. 5 4 B-01
Standard 1.06E+Ol 4.43E- 0 1 4 .48E+OO NR 4.24£-01 2 . 23 E-01
Deviation
c. Are all RASS results less, or equal to the appropriate DCGLw?
d . If "No", have remaining locations of elevated concentration been evaluated? (If "No", discontinue survey design until investigation is complete.)
Yes[:: No[W)
NJAF] Yes~ Nor]
e. Have elevated areas identified by gamma walkover surveys been investigated? Yes~ NoO (If ''No", then tenninate swvey design and perform additional investigation and repeat the planning process)
f. Are the Initial Characterization and RASS data sufficient to support FSS Design? Yes~ No!:] (lf ' 'No", terminate survey design, perform additional characterization or remediation and repeat the planning process.)
3. Define the Survey Unit Cla.ssificatlon Write a short description of the survey unit based on historical use and remedial activities:
LSA 05-02 contains the fonn:r fooiprint o f the T ile Barn . The Tile 13arn was used to slore both clean and con taminated equipn~nt throughout the facility's operating period. Tiu: building was demolished and d isposed ofin Spring 2011. Please see ,\ ppendix P-3 for further in fomiat ion over remedial activities fo r this area.
Classification: Survey Unit Area (m2) : 1402.3
a . Has the Classification changed from the Initial Classification as indicated in DP Ch. 14? Yes[O No~ (If "Yes", then include a copy of Appendix P-5, Survey Unit Classification Change Form.)
Quality Record Westinghouse Non-Proprietary C lass 3
Revision: 2 Page P-2 of 10
HDP- PR-FSS-701, Final Status Survey Plan Development APPENDIX P-1
FINAL ST A TUS SURVEY SAMPLING PLAN FOR SOIL SURVEY UNITS
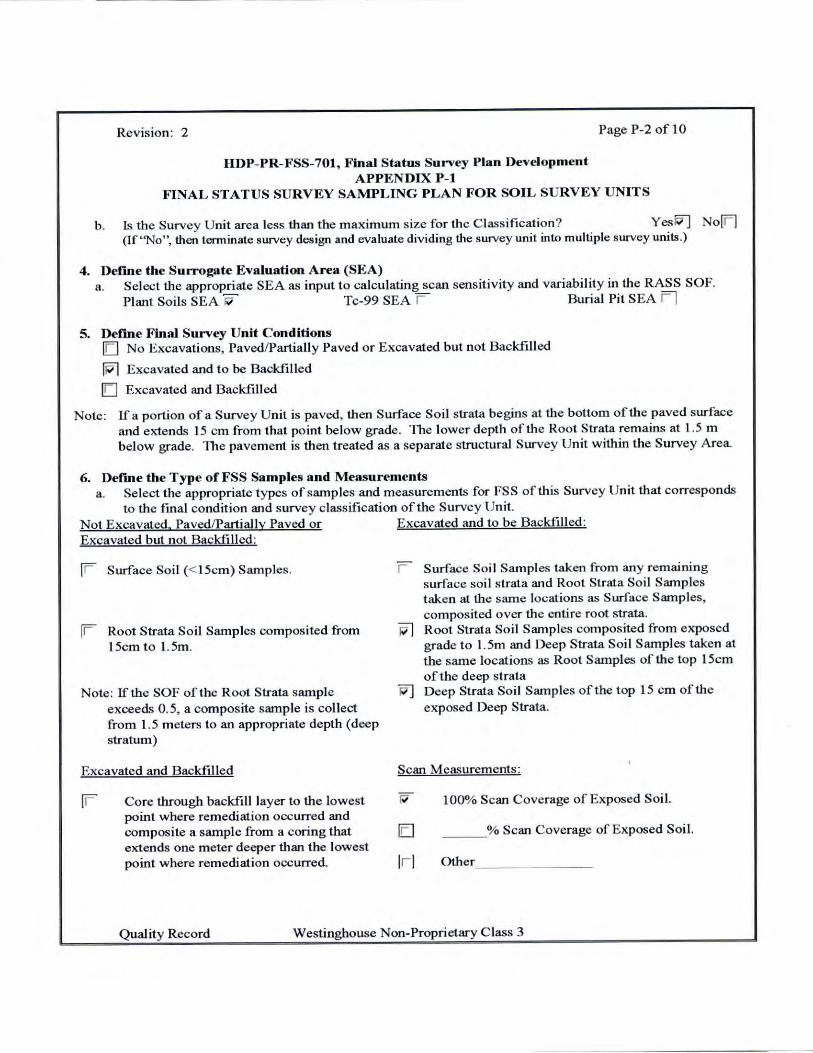
b. ls the Survey Unit area less than the maximum size for the C lassification? Yesi;7] No[Fl (lf''No", then terminate survey design and evaluate dividing tJ1e survey unit into multiple survey units.)
4. Define the Surrogate Evaluation Area (SEA) a . Select the appropriate SEA as input to calculating scan sensitivity and variability in the RASS SOF.
Plant Soils SEA ~ Tc-99 SEA r Burial Pit SEA Fl
5. Def'me Final Survey Unit Conditions [CJ No Excavations, Paved/Partially Paved or Excavated but not Backfilled
!Pl Excavated and to be Backfilled
l!J Excavated and Backfilled
Note: If a portion of a Survey Unit is paved, then Surface Soil strata begins at the bottom of the paved surface and extends 15 cm from that point below grade. The lower depth of the Root Strata remains at 1.5 m below grade. The pavement is then treated as a separate structural Survey Unit within the Survey Area.
6. Define the Type of FSS Samples and Measurements a. Select the appropriate types of samples and measurements for FSS of this Survey Unit that corresponds
to the final condition and survey classification of the Survey Unit. Not Excavated, Paved/Partially Paved or Excavated and to be Backfilled: Excavated but not Backfilled:
[F Surface Soil (< 15cm) Samples.
[F Root Strata Soil Samples composited from 15cm to 1.5m.
Note: If the SOF of the Root Strata sample exceeds 0 . 5, a composite sample is collect from 1.5 meters to an appropriate depth (deep stratum )
Excavated and Backfilled
[r Core through backfill layer to the lowest point where remediation occurred and composite a sample from a coring that extends one meter deeper than the lowest point where remediation occurred.
r Surface Soil Samples taken from any remaining surface soil strata and Root Strata Soil Samples taken at the same locations as Surface Samples, composited over the entire root strata.
~ Root Strata So il Samples composited from exposed grade to I.Sm and Deep Strata Soil Samples taken at the same locations as Root Samples of the top 15cm of the deep strata
W] Deep Strata Soil Samples of the top 15 cm of the exposed Deep Strata.
Scan Measurements :
IE]
lr J
100% Scan Coverage of Exposed Soil.
___ % Scan Coverage of Exposed Soil.
Other __
Quality Record Westinghouse Non-Proprietary Class 3

Revision: 2 Page P-3 of 10
HDP-PR-FSS-701, Final Status Survey Plan Development APPENDIX P-1
FINAL STATUS SURVEY SAMPLING PLAN FOR SOIL SURVEY UNITS
7. Define Derived Concentration Guideline Levels (DCGL) a. Select the appropriate DCGL for each Radionuclide of Concern (ROC) based on the corresponding
SEA and the Uniform Concept ual Site Model (CSM).
U-234 U-235 U-238 Tc-99
• lfTc-99 was m easured during the characterization/RASS survey, then the "Measure Tc-99" DCGLs w ill be used from Appendix A ofHDP-PR-FSS-701.
• IfTc-99 was not measured in the characterization/RASS survey, then the modified U-235 DCGL ("Infer Tc-99" ) will be used from Appendix/\. HDP-PR-FSS-70 1.
Surface Strata Root Strata Deep Strata 1 Uniform (oCi/g) (oCi/g) (oC i/1?:) (oCi/g)
508.5 235.6 872.4 195.4
14 I 3 11 .8 2.5
297.6 183.3 55 1. 1 168.8
151 30. 1 74 25. 1
Th-232 + C 4 .7 2 5.2 2
Ra-226 + C 5 2. 1 5.4 1.9
1. The Deep Strata DCGLs corresPond to the Excavation Scenario OCGL from Appendix A of HDP-PR-FSS-701 .
NOTE: The Uniform DCGL will be used to calculated the number of samples in the statistical survey population.
8. Calculate the Number of Samples in the Statistical Survey Population
NOTE: The Statistical Survey Population is routinely derived based on the Uniform DCGL • Alternatively, if the Survey U nit excavation ex-tends into multiple C SMs (e.g. surface, root &
deep), then the DCGL(s) from the m ost limiting strata can be used with the equations below~ OR • lfthe excavation s ignificantly extends into the deep strata, then the alternate approach presented in
section 8.2.5 of HDP-PR-FSS-701 may be used for determining the mean SOF and weighted standard deviation that accounts for the reduced dose from the deeper s urface, i.e., by weighting the Root stratum and Excavation DCGLw values.
• The values used in the fo llowing equations (SOFmcan and crsoF) can be found in the tables from Section 2b and Section 7a.
a. Calculate a mean SOF for the characterization/RASS survey dat a set .
Conc 0 1 34 Cono 0 215 Conc 0 231 ConcTc-99 ConcTo 232 + ConcP.a-n 6 SOFM.., . + - + - + + -D CGL 0 •134 DCGL 0 _ 135 DCGL 0 _ 231 DCGLTc-99 DCGLTh-'231 DCGLRa-2l6
Lower Bound of the Grey Region (LBGR) = SOFMcan = 0.49
b. Calculate the mean and standard deviation in the SOF for the characterizalion/RASS survey data set. NOTE: For the calculation of SOFMcan and crsoF, include the concentration for Tc-99 if it was measured. lf
Tc-99 was not measured, include the modified U -235 DCGL and omit Tc-99 concentration term.
(J = (J u-n• + (J U-2)5 + (J U-2)8 + (J Tc-99 + (JTh-2n + (Jliu-226 7( )2 ( )2 ( )2 ( )2 ( )2 ( )2 J soF ' , OCGL0 _ 234 DCGL u-m OCGL 0 238 OCGLTc-1>9 DCGLTh-zn DCGLRa-226
Quality Record Westinghouse Non-Proprietary C lass 3
Revision: 2
IIDP-PR-FSS-701, Final Status Survey Plan Development APPENDIX P-1
Page P-4 of 10
FINAL STATUS SURVEY SAMPLING PLAN FOR SOIL SURVEY UNITS
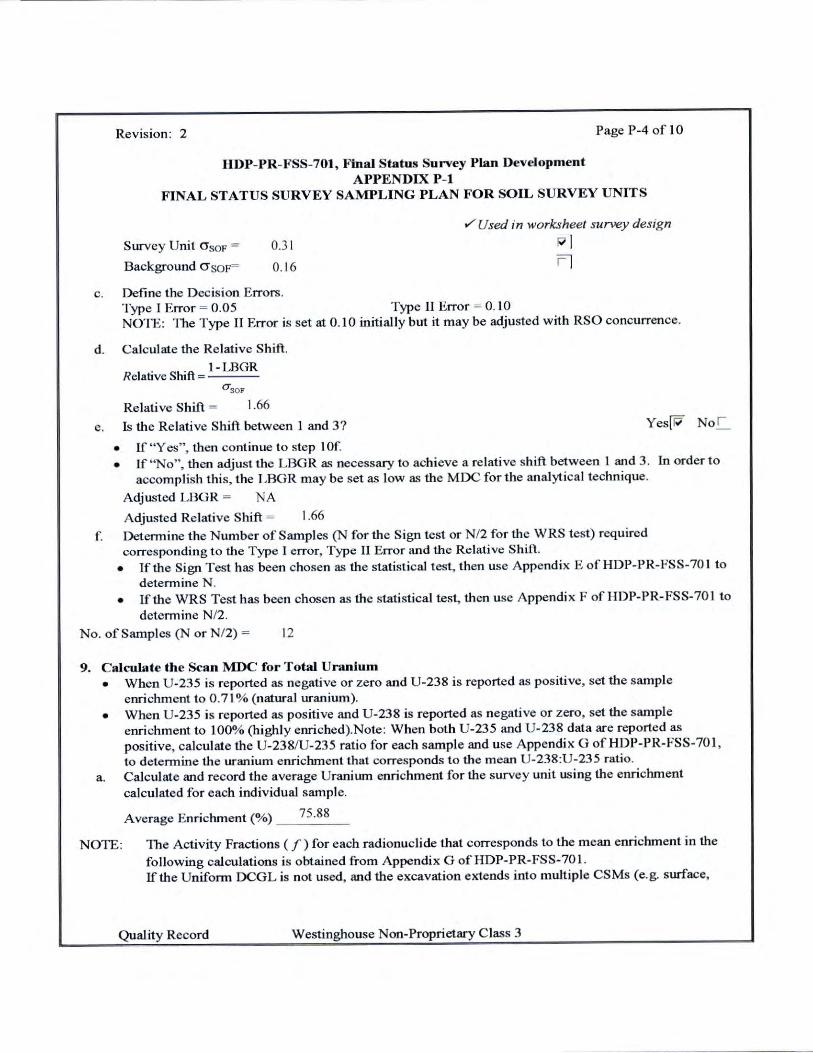
Survey Unit crsoF = Background crsoF=
0.31
0.16
,/ Used in worksheet survey design
I Fl
c . Define the Decision Errors. Type r Error = 0.05 Type 11 Error = 0.10 NOTE: The Type II Error is set at 0 .10 initially but it may be adjusted with RSO concurrence.
d. Calculate the Relative Shift.
R I . Shift 1 - LBGR e abve = ----
O'soF
Relative Shift = 1.66
e. Is the Relative Shift between 1 and 3? YesW Noc_
• If "Yes", then continue to step I Of. • If "No", then adjust the LBGR as necessary to achieve a relative shift between 1 and 3. In order to
accomplish this, the LBGR may be set as low as the MDC for the analytical technique.
Adjusted LBGR = NA
Adjusted Relative Shift = 1.66 f. Determine the Number of Samples (N for the Sign test or N/2 for the WRS test) required
corresponding to the Type I error, Type II Error and the Relative Shill. • If the Sign Test has been chosen as the statistical test, then use Appendix E of HDP-PR-FSS-70 I to
determine N. • Ifthe WRS Test has been chosen as the statistical test, then use Appendix F ofHDP-PR- FSS-701 to
determine N/2. No. of Samples (N or N/2) = 12
9. Calculate the Scan MDC for Total Uranium
•
•
a .
NOTE:
When U -235 is reported as negative or zero and U-238 is reported as positive, set the sample enrichment to 0.71 % (natural uranium). When U-235 is reported as positive and U-238 is reported as negative or zero, set the sample enrichment to 100% (highly enriched).Note: When both U-235 and U-238 data are reported as positive, calculate the U-238/U-235 ratio for each sample and use Appendix G ofHDP-PR-FSS-701 , to determine the uranium enrichment that corresponds to the mean U-238:U-235 ratio. Calculate and record the average Uranium enrichment for the survey unit using the enrichment calculated for each individual sample.
Average Enrichment(%) __ 75_._8_8_
The Activity Fractions ( f) for each radionuclide that corresponds to the mean enrichment in the following calculations is obtained from Appendix G of HDP-PR-FSS-701 . If the Uniform DCGL is not used, and the excavation extends into multiple CSMs (e.g. surface,
Quality Record Westinghouse Non-Proprietary Class 3
Revision : 2
HDP-PR-FSS-701, Final Status Survey Plan Development APPENDIX P-1
Page P-5 of 10
FINAL ST A TUS SURVEY SAMPLING PLAN FOR SOIL SURVEY UNITS
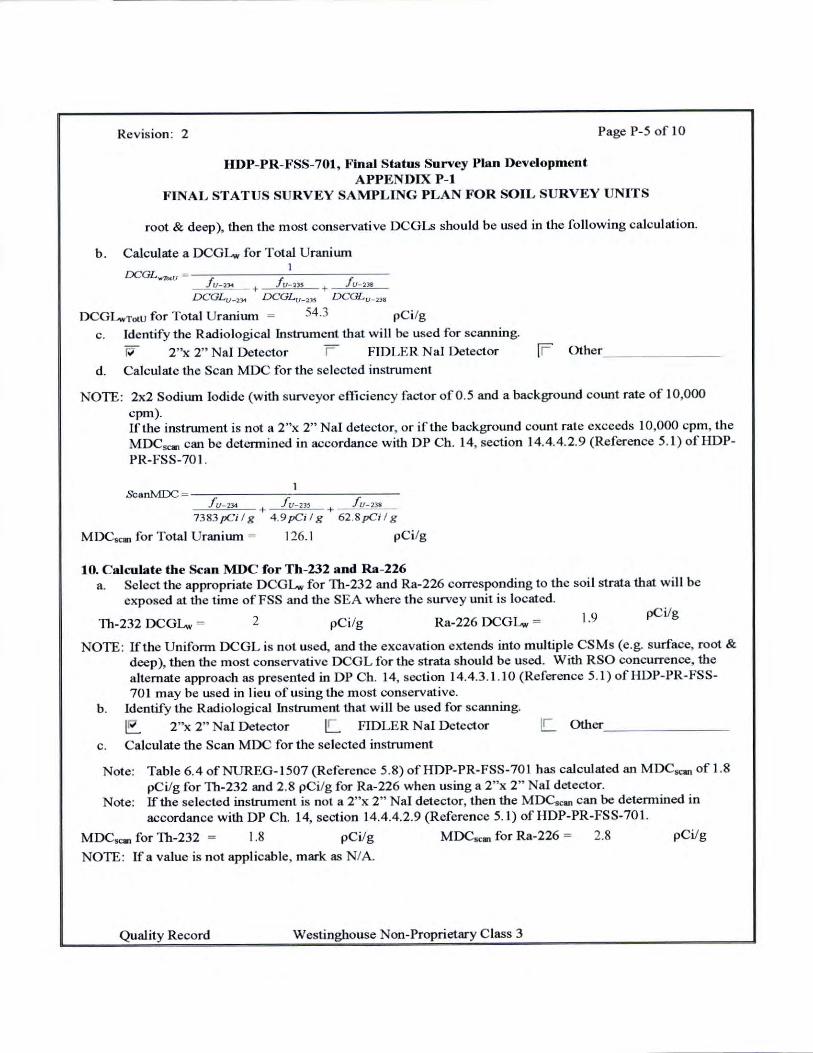
root & deep), then the most conservative DCGLs should be used in the fo llowing calculation.
b . Calculate a DCGLw for Total Uranium
f v-,..,. + f v-ns + f v- 2>• D CGL u_,,,, DCGL u-m DCGLv- 238
DCGLwn>tu for Total Uranium = 54.3 pCi/g
c. Identify the Radiological Instrument that will be used for scanning. ~ 2"x 2" Nal Detector r FIDLER Nal Detector [F Other ______ _
d. Calculate the Scan MDC for the selected instrument
NOTE: 2x2 Sodiwn Iodide (with surveyor e fficiency factor of 0.5 and a background count rate of 10,000 cpm). If lhe instrument is not a 2"x 2" Nal detector, or if the background count rate exceeds I 0,000 cpm, the MDCsca, can be determined in accordance with DP Ch. 14, section 14.4.4.2.9 (Reference 5.1) ofHDPPR- FSS-70 1.
ScanMDC f v - 234 + f u- 23s + f u-na
7383pCi / g 4.9 pCi I g 62.8 pCi / g
MDCscan for Total Uraniwn = I 26. I pCi/g
10. Calculate the Scan MDC for Th-232 and Ra-226 a. Select the appropriate DCGLw for Th-232 and Ra-226 corresponding to the soil strata that will be
exposed at the time of FSS and the SEA where the survey unit is located.
Th-232 DCGLw - 2 pCi/g Ra-226 DCGLw = 1.9 pCi/g
NOTE: If the Un iform DCGL is not used, and the excavation extends into multiple CS Ms (e.g. surface, root & deep), then the most conservative DCGL for the strata should be used. With RSO concurrence, the alternate approach as presented in DP Ch. 14, section 14.4.3 .1.10 (Reference 5.1) ofHDP-PR-FSS-701 m ay be used in lieu of using the most conservative.
b . Identify the Radiological Instrument that will be used for scanning. ~ 2"x 2" Nal Detector E. FIDLER Nal Detector IC._ Other ______ _
c . Calculate the Scan MDC for the selected instrument
Note: Table 6.4 of NUREG-1507 (Reference 5.8) of HDP-PR-FSS-70 I has calculated an MDCscan of 1.8 pCi/g for Th-232 and 2 .8 pCi/g for Ra-226 when using a 2"x 2" Nal detector.
Note: If the selected instrument is not a 2"x 2" Nal detector, then the MDCscan can be determined in accordance with DP Ch. 14, section 14.4.4.2.9 (Reference 5.1) of HDP-PR-FSS-701.
MDCsan for Th-232 = 1.8 pCi/g MDCsc., for Ra-226 = 2.8 pCi/g
NOTE: If a value is not applicable, mark as NIA.
Quality Record Westinghouse Non-Proprietary Class 3
Revision: 2
HDP-PR-FSS-701, Final Status Survey Plan Development APPENDIX P-1
Page P-6 of I 0
FINAL STATUS SURVEY SAMPLING PLAN FOR SOIL SURVEY UNITS
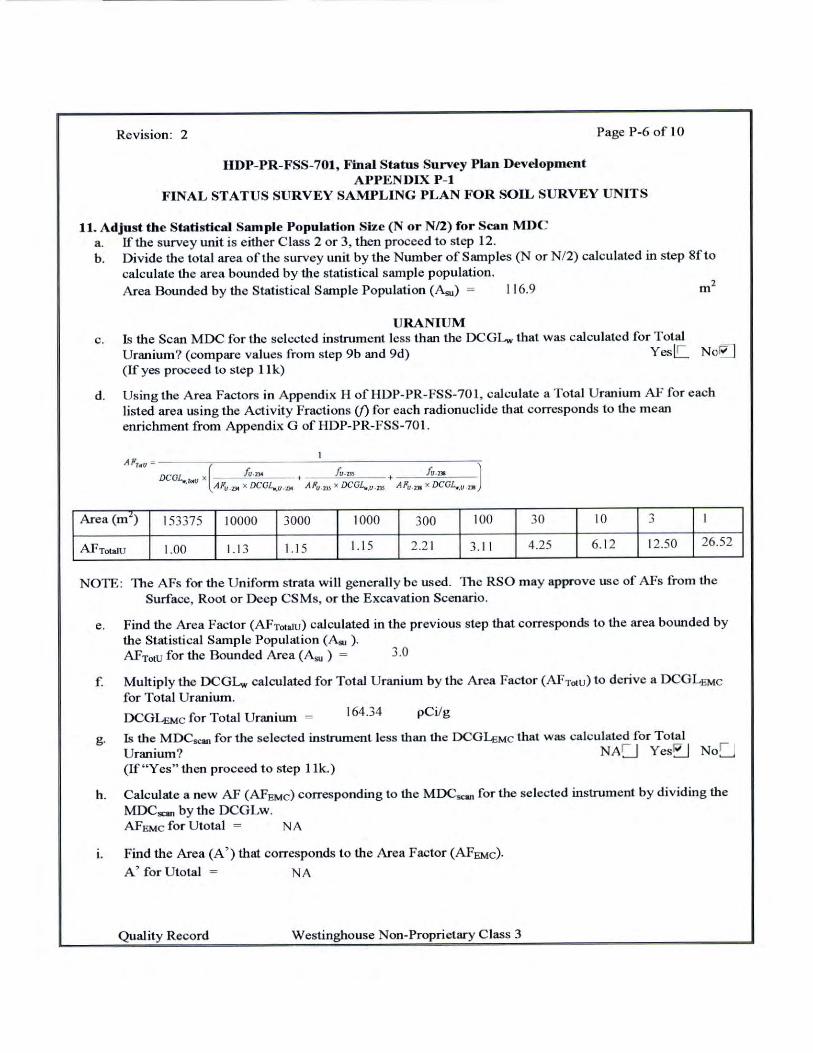
11. Adjust the Statistical Sample Population Size (N or N/2) for Scan MDC a. If the survey unit is either Class 2 or 3, then proceed to step 12. b . Divide the total area of the survey unit by the Nwnber of Samples (N or N/2) calculated in step 8f to
calculate the area bounded by the statistical sample population. Area Bounded by the Statistical Sample Population (Asu) = 11 6.9 m
2
URANIUM c. Is the Scan MDC for the selected instrument less than the DCGL,., that was calculated for Total
Uranium? (compare values from step 9b and 9d) YeslC_ No~ (If yes proceed to step 11 k)
d. Using the Area Factors in Appendix H ofHDP-PR-FSS-701 , calculate a Total Uranium AF for each listed area using the Activity Fractions (j) for each radionuclide that corresponds to the mean enrichment from Appendix G ofHDP-PR-FSS-701.
A~u=-- I
DCOL.. l«u x (______ji!_.n,. _ , fu- m + fu.na ) · APv.n, x DCGL•,V·D< APv.ru x DCGL •. u.n, APu,,. x DCGL...u,,.
Area (mi) 153375 10000 3000 1000 300 100 30 10 3 I
AFTollllU 1.00 1.1 3 1.15 1. 15 2.2 1 3.1 1 4.25 6. 12 12.50 26.52
NOTE: The AFs for the Uniform strata will generally be used. The RSO may approve usc of AFs from the Surface, Root or Deep CS Ms, or the Excavation Scenario.
e. Find the Area Factor (AFTotaJU) calculated in the previous step that corresponds to the area bowtded by the Statistical Sample Population (Aw ). AFTotU for the Bounded Area (Asu) = 3.0
f Multiply the DCGL,., calculated for Total U ranium by the Arca Factor (AFTotu) to derive a DCGLEMC for Total Uranium.
DCGLEMc for Total Uraniwn = 164.34 pCi/g
g. Is the MDCscan for the selected instrument less than the DCG1-£Mc that was calculated for Total Uranium ? NACj Yes~ No~ (If"Yes" tben proceed to step Ilk.)
h. Calculate a new AF (AFEMC) corresponding to the MDCscan for the selected instrument by dividing the MDCscan by the DCGLw. AF EMC for Utotal = NA
1. Find the Area (A' ) that corresponds to the Area Factor (AFEMc).
A ' forUtotal = NA
Quality Record Westinghouse Non-Proprietary Class 3
Revision: 2 Page P-7 of IO
HDP-PR-FSS-701, Final Status Survey Plan Development APPENDIX P-1
FINAL ST A TUS SURVEY SAMPLING PLAN FOR SOIL SURVEY UNITS
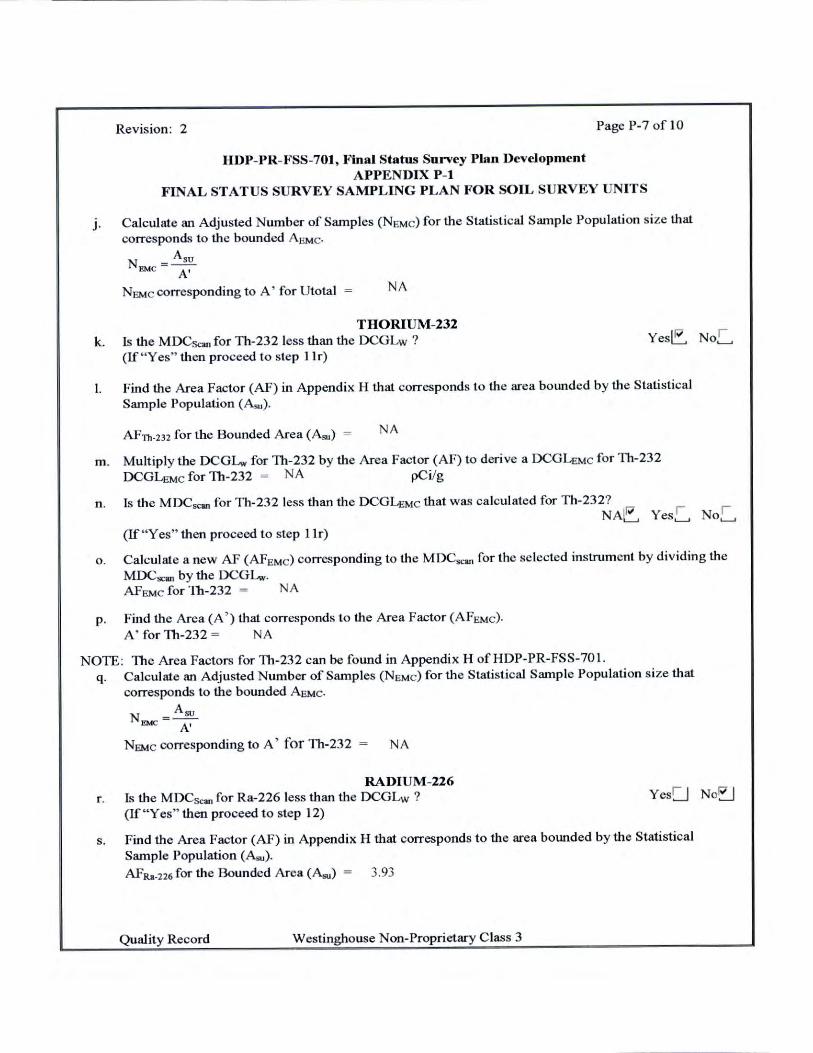
J. Calculate an Adjusted Number of Samples CNEMC) for the Statistical Sample Population size that corresponds to the bounded AEMC·
N = Asu EMC A'
Nate corresponding to A ' for Utotal NA
THORIUM-232 k. Is the MDCScan for Th-232 less than the DCGLw ?
(If "Yes" then proceed to step l lr) YesE. No.C:..
1. Find the Area Factor (AF) in Appendix H that corresponds to the area bounded by the Statistical Sample Population (Asu).
AF11,.232 for the Bounded Area (As11) NA
m . Multiply the DCGLw for Th-232 by the Area Factor (AF) to derive a DCGI..aic for Th-232 DCGLEMc for Th-232 = NA pCi/g
n . Is the MDCscan for Th-232 less than the DCGLEMC that was calculated for Th-232? NAE., Yes[_, No~
(If "Yes" then proceed to step l lr)
o. Calculate a new AF (AFEMC) corresponding to the MDCscan for the selected instrument by dividing the MDC= by the DCGLw. AFEMc for lb-232 = NA
p. Find the Area (A ' ) that corresponds to the Area Factor (AFEMc). A ' for Th-232 = NA
NOTE: The Area Factors for Th-232 can be found in Appendix H ofHDP-PR-FSS-701. q. Calculate an Adjusted Number of Samples (NEMC) for the Statistical Sample Population size that
corresponds to the bounded AEMC·
N = A su EMC A'
NEMc corresponding to A ' for Th-232 NA
RADIUM-226 r. Is the MDCScan for Ra-226 Jess than the DCGLw ?
(If"Yes" then proceed to step 12) YesCJ No~
s. Find the Area Factor (AF) in Appendix H that corresponds to the area bounded by the Statistical Sample Population (As,..). AFRa-226 for the Bounded Area (Asu) = 3.93
Quality Record Westinghouse Non-Proprietary Class 3

Revision : 2
HDP-PR-FSS-701, Final Status Survey Plan Development APPENDIX P-1
Page P-8 of 10
FINAL STATUS SURVEY SAMPLING PLAN FOR SOIL SURVEY UNITS
t. Multiply the DCGLw for Ra-226 by the Area Factor (AF) to derive a DCGLEMc for Ra-226 DCGLEMc for Ra-226 = 7.47
u. Is the MDCscao for Ra-226 less than the DCGLEMC that was calculated for Ra-226? NA[r YesW No[r
(If "Yes" then proceed to step 12)
v. Calculate a new AF (AFEMc) corresponding to the MDCscan for the selected instrument by div iding the MDCscan by the OCGLw AFEMC for Ra-226 = NA
w . Find the Area (A' ) that corresponds to the Area Factor (AfEMc). A ' for Ra-226 = NA
x. Calculate an Adjusted Number of Samples <NEMC) for the Statistical Sample Population size that corresponds to the bounded AnMC·
N =Asu EMC A'
NEMc corresponding to A ' for Ra-226 = NA
12. Calculate t.he Grid Spacing a Larger of N from step 8f and the maximum value of NEMC from I lj , 1 lq or 1 l x.
(NEMc( max] or N) = 12
b. ls the Survey Unit a C)a<,s 3 Survey Unit? (lf" Yes", then continue to step 13)
Yes[r No~
C. Calculate Grid Spacing (L).
I ~ : Triangular Grid L = ,~--Ar-ea __ _ V. 866(N or N/2)
[::c= Square Grid L = Area
(Nor N/2)
Grid Spacing (L) for Survey Unit = 11 .62
13. Generate a Survey Map a Assign a unique identification nwnber to each sample in the Statistical Sample Population using the
guidance and direction provided in Appendix M of HDP-PR-FSS-701. b. Generate a graphic representation of the Survey Unit with dimensions and boundaries
corresponding to the established reference coordinate system in accordance with step 8.2.10 of HDP-PR-FSS-701.
c. Using the reference coordinate system, ascertain coordinates for each sample location.
m
d . Designate sample locations, and location coordinates on Appendix P-4, FSS Sample & Measurement Locations & Coordinates and attach a copy of that form to this FSSP.
e. Attach a copy of the developed Survey Map with sample locations to this FSSP.
14. QC & Biased Samples a. Randomly choose 5% of the Statistical Sample Population as QC Samples in accordance with
Quality Record Westinghouse Non-Proprietary Class 3
Revision: 2 Page P-9 of 10
HDP-PR-FSS-701, Final Status Survey Plan Development APPENDIX P-1
FINAL ST A TUS SURVEY SAMPLING PLAN FOR SOIL SURVEY UNITS
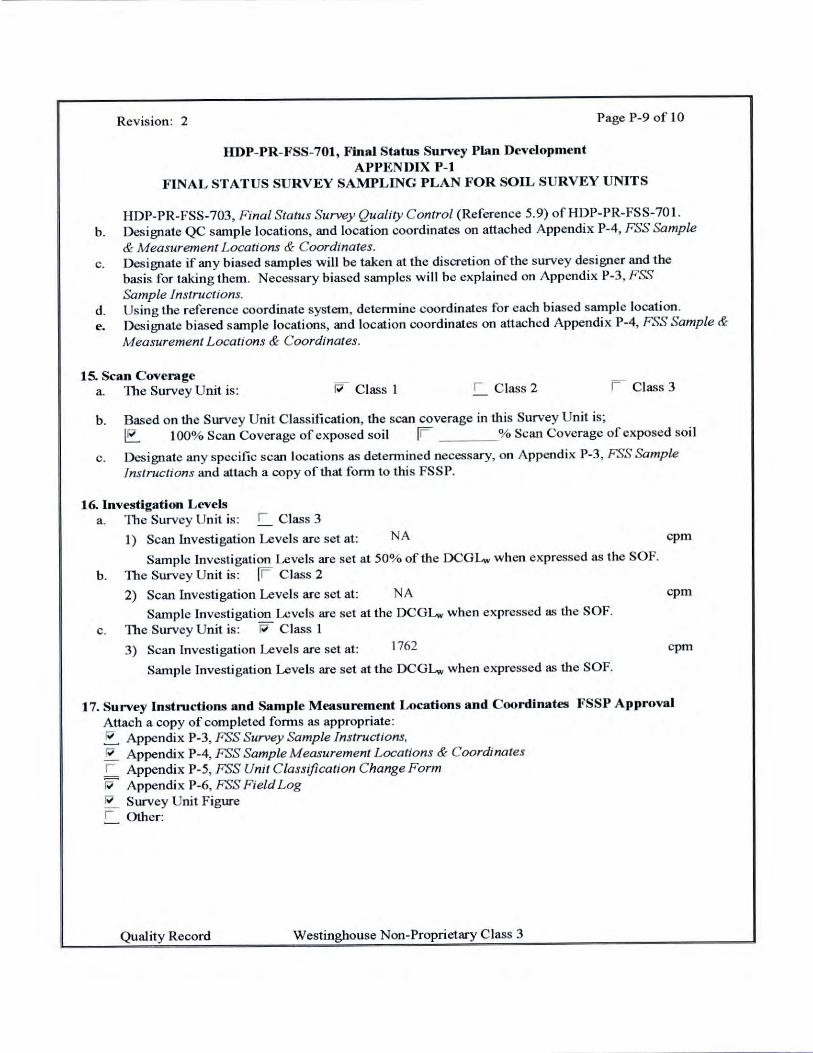
HDP-PR-FSS-703, Final Status Survey Quality Control (Reference 5.9) of HDP-PR-FSS-701. b . Designate QC sample locations, and location coordinates on attached Appendix P-4, FSS Sample
& Measurement Locations & Coordinates. c. Designate if any biased samples will be taken at the discretion of the survey designer and the
bas is for talcing them. Necessary biased samples will be explained on Appendix P-3, FSS Sample Instructions.
d. Using the reference coordinate system, determine coordinates for each biased sample location. e. Designate biased sample locations, and location coordinates on attached Appendix P-4, FSS Sample &
lvfeasurement Locations & Coordinates.
15. Scan Coverage a. The Survey Unit is : if"" C lass 1 c_ C lass 2 F Class 3
b. Based on the Survey Uni t Classification, the scan coverage in this Survey Unit is; ~ 100% Scan Coverage of exposed soil IF % Scan Coverage of exposed soil
c . Designate any specific scan locations as determined necessary, on Appendix P-3, FSS Sample Instructions and attach a copy of that form to this FSSP.
16. Investigation Levels a. The Survey Unit is : c._ Class 3
1) Scan Investigation Levels are set at: NA cpm
Sample Investigation Levels are set at 50% of the DCGLw when expressed as the SOF. b. The Survey Unit is: [F Class 2
2) Scan Investigation Levels are set at : NA cpm
Sample Investigation Levels are set at the DCGLw when expressed as the SOF. c . The Survey Unit is: ~ C lass 1
3) Scan Investigation Levels are set at: 1762 cpm
Sample Investigation Levels are set at the DCGLw when expressed as the SOF.
17. Survey Instructions and Sample Measurement Locations and Coordinates FSSP Approval Attach a copy of completed forms as appropriate: ~ Appendix P-3, FSS Survey Sample Instructions, ~ Appendix P-4, FSS Sample Measurement Locations & Coordinates r Appendix P-5, FSS Unit Classification Change Form ~ Appendix P-6, FSS Field Log ~ Survey Unit Figure r Other:
Quality Record Westinghouse Non-Proprietary Class 3
Revision : 2
HDP-PR-FSS-701, Final Status Surv<'y Plan Development APPENDIX P-1
Page P- 10 of 10
FINAL STATUS SURVEY SAMPLING PLAN FOR SOIL SURVEY UNITS
18. FSSP Approval PrepaJ'ed by :
Peer Reviewed by :
Approved by ( l{S0):
Quality Record
.N'1 1c.~llt 6ws~ (Print Name)
__fld n;e vta tt (Print Name)
}t>~ C,1.1\QO (Print Name)
Westinghouse Non-Propri etary C lass 3
6-f,2-(~ (Date)
e, 12.-13 /, (Date) J ... 11,, ,,
(Dale)
Revision: 2 Page P-1 of 6
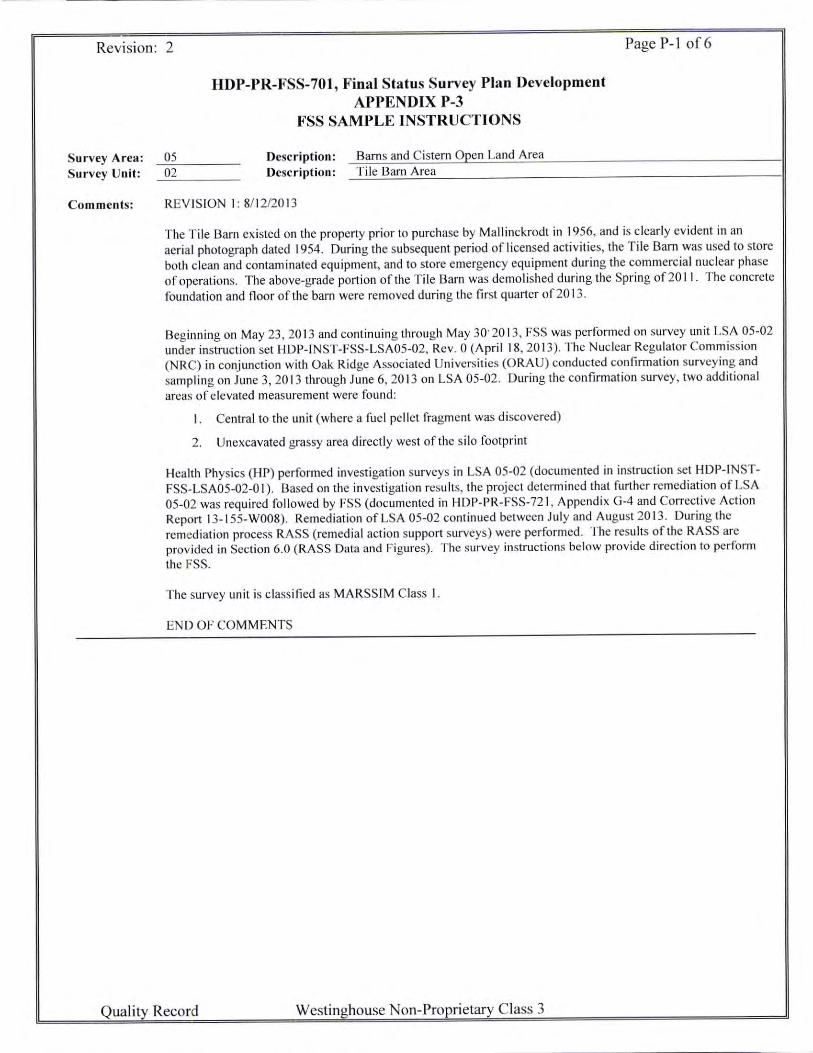
Survey Area: Survey Unit:
Comments:
05 02
HDP-PR-J?SS-701, Final Status Survey Plan Development APPENDIX P-3
FSS SAMPLE INSTRUCTIONS
Description: Barns and Cisrem Open Land Area Description: Tile Barn Area
REV ISION I : 8/ 12/20 13
The Tile Barn existed on Lhe properly prior LO purchase by Mallinckrodt in 1956, and is clearly evident in an aerial photograph dated 1954. During the subsequent period of licensed activities, the T ile Barn was used to store bolh clean and contaminated equ ipment, and to store emergency equipment during the commercial nuclear phase of operations. The above-grade portion of the Tile Barn was demolished during the Spring of20 I I . The concrete foundation and floor of the barn were removed during the first quarter of2013 .
Beginning on May 23, 20 13 and continuing through May 30· 20 13, FSS was performed on survey unit LSA 05-02 under instruction set HOP-!NST-FSS-LSA05-02, Rev. 0 (April 18, 20 13). T he Nuclear Regula tor Commission (NRC) in conjunction with Oak Ridge Associated Universities (ORAU) conducted confirmation survey ing and sampling on June 3, 2013 through June 6, 2013 on LSA 05-02. During rhe confirmation survey, two additional areas of elevated measurement were found:
I . Central to the unit (where a fue l pellet fragment was discovered)
2. Un excavated grassy area directly west of the silo footprint
Health Physics (HP) perfo1med investigation surveys in LSA 05-02 (documented in instruction set HDP-INSTFSS-LSA05-02-0 I). Based on the investigation results, the project determined that further remediation of LSA 05-02 was required fo llowed by FSS (documented in HDP-PR-FSS-72 1, Appendix G-4 and Corrective Action Report I 3- I 55-W008). Remediation of LSA 05-02 continued between July and August 2013 . During the remediation process RASS (remedial action support surveys) were performed. The results of the RASS arc provided in Section 6.0 (RASS Dt1ta and Figures). The survey instructions below provide di rection to perfonn the FSS.
The survey unit is classilied as MARSSIM Class I.
E D OF COMMENTS
Qua) i ty Record Westinghouse Non-Proprietary Class 3
Revision: 2 Page P-2 of 6
HDP-PR-FSS-701, Final Status Survey Plan Development APPENDIX P-3
FSS SAMPLE INSTRUCTIONS
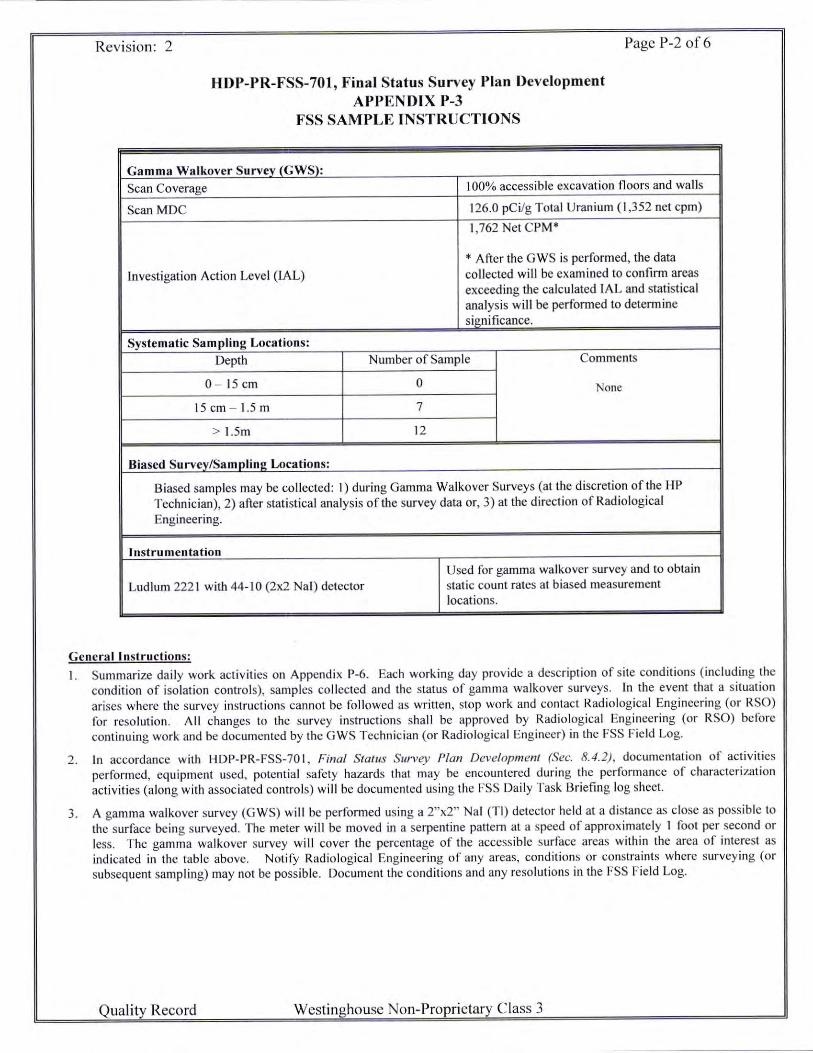
Gamma Walkover Survev (GWS): Scan Coverage l 00% accessible excavation floors and walls
Scan MDC 126.0 pCi/g Total Uranium ( 1,352 net cpm)
1,762 Net CPM •
• After the G WS is performed, the data
Investigation Action Level (IAL) collected will be examined to confirm areas exceeding the calculated JAL and statistical analys is will be performed to determine significance.
Systematic Sampling Locations: Depth Number of Sample Comments
0 - 15 cm 0 one
15 cm - 1.5 m 7
> I .Sm 12
Biased Survev/Samplin2 Locations:
Biased samples may be collected: I) during Gamma Walkover Surveys (at the discretion of the HP Technician), 2) after statistical analysis of the survey data or, 3) at the d irection of Radiological Engineering.
Instrumentation Used for gamma walkover survey and to obtain
Ludlum 222 1 with 44-10 (2x2 Na!) detector static count rates at biased measurement locations.
General Instructions: I. Su mmarize daily work activities on Appendix P-6. Each working day provide a description of site conditions (including the
condition of isolation controls), samples collected and the status of gamma walkover surveys. In the event that a situation arises where the survey instructions cannot be followed as written, stop work and contact Radiological Engineering (or RSO) for resolut ion. All changes to the survey instructions shall be approved by Radiological Engineering (or RSO) before continuing work and be documented by the GWS Technician (or Radiological Engineer) in the FSS Field Log.
2. In accordance with HDP-PR-FSS-70 I, Final Status Survey Plan Development (Sec. 8.4.2), documentation o f' activities performed, equipment used, potential safety hazards that may be encountered during the performance of characterization activ ities (a long with associated controls) wi ll be documented using the FSS Dai ly Task Briefing Jog sheet.
3. A gamma walkover survey (G WS) will be performed using a 2"x2" Nal (Tl) detector held al a distance as close as possible to the surface being surveyed. The meter wi ll be moved in a serpentine pattern at a speed of approximately I foot per second or less. The gamma walkover survey will cover the percentage of the accessible surface areas withi n the area of interest as indicated in the table above. Notify Radiological Eng ineering of any areas, conditions or constrainls where surveying (or subsequent sampling) may not be possible. Document the conditions and any resolutions in the FSS Fie ld Log.
Quality Record Westinghouse Non-Propri etary Class 3

Revision: 2
HDP-PR-FSS-701, Final Status Survey Plan Development APPENDIX P-3
FSS SAMPLE lNSTRlJCTIONS
Page P-3 of 6
4. A GPS system and data logger should be interfaced with the meter. The downloaded information wi ll tl1en be used to prepare maps illustrating relative count rates and to perform sta tistical analysis of the data. If a GPS data logging system is not avai lable, contact Radiological Eng ineering to determ ine specific instructions for performing and documenting gamma walkover surveys.
5. Class I Open Land Survey Units will be gridded to identify the systematic sampling locations. Each sample location will have associated GPS coordinates specified. lo the case of inaccessible sampling locations, the sample location will be relocated within a radial distance of2 feet of the origina l sample location.
6. Verify that isolation controls established in accordance with HDP-PR-HP-602 arc in p lace prior LO the start ofFSS.
7. Perform daily pre and post QC source checks in accordance with I IDP-PR-l lP-416.
8. A map of the survey unit showing predetermined sample locations is provided. Additional (biased) sampling may be required, based on results of the GWS, at the discretion o f the HP Technician based on fie ld conditions, or as detennined by Radiological Engineering. Statistical analys is of the survey/sampling data will be used to help identi fy locations for biased soil sampling. Biased soi l samples will be collected in a manner similar to systematic soil sampling locations. Record the location of biased samples on the rss Field Log.
9. At each systematic so il sampling location a composite so il sample will be collected from each location and depth listed on Appendix P-4. 0, 0 - 15 cm (surface), 7, 15 cm 1.5 m (root) and 12, > 1.5 m (deep) samples will be collected.
I 0. Care should be exercised Lo ensure the ent ire sample is included from within the depths specified for sampling. When collecting the composite samples, vegetation and native debris/rocks with a diameter greater than I inch should be discarded.
11. All samples collected as part of this survey wi ll be analyzed at an off-site laboratory by gamma spectroscopy for uranium and gamma emitting radionuclides (Th-232, Am-241, etc.), and for technetium-99 by liquid scintillation count ing or !CPMS.
Specific Instructions : NOTE: Un less othenvise indicated, the perfonnance of these specific instructions is the responsibility of the HP Technician.
Before Beginning Work
I. Rad. Engineer/HP Technician: Verify and document (each shift) that isolation controls established in accordance with HDPPR-HP-602 are in place prior to the start of FSS using the Daily Task Briefing log sheet.
2. Rad. Engineer/HP Technician: Perfonn a daily task-specific briefing; documenting the attendants, planned work act ivities, anticipated hazards, and controls on the FSS Daily Task Briefing log sheet. Reta in all completed daily briefing log sheets in the Field Log section of this package.
NOTE: If soil sampling to a depth greater than one foot is required, ensure I IDP Safety & Health are aware of the activity, an Excavation Permit (Form HDP-PR-EHS-02 1-1 ) has been performed for the work area, and underground uti lities have been ident ified
Gamma Walkover Survey (GWS)
3. Establish a general area background, in accordance with HDP-PR-FSS-71 I.
4. Perfonn a gamma walkover of the survey unit ho lding the probe as close to the surface as possible, in accordance with HDPPR-FSS-711.
a. Look and/or listen for locations that exhibit anomalous read ings (e.g., count rates in excess of the area background count rate and/or count rates that exceed the IA L ror this unit).
b . Mark the locat ion(s) exhibiting anomalous readings to fac il itate possible future investigations (for example, use a nag, stake, or other marking resistant to ant ic ipated environmental conditions).
Quality Record Westinghouse Non-Proprietary Class 3

Revision: 2
HDP-PR-FSS-701, Final Status Survey Plan Development APPENDIX P-3
FSS SAMPLE INSTRUCTIONS
Page P-4 of 6
5. At each location where anomalous readings occur, perform a more detailed point survey of the area. Pause and place the survey probe as close as possible to the surface to define and record the total count rate associated with the area of interest on the rie ld Log.
NOTE: If fie ld conditions limit the abi lity to perform contact readings, collect read ings a5 close as practical. Contact HP Supervisor (or Radiological Engineering) regarding the issue for each location. The I IP Technician, I IP Supervisor and/or Rad iological Engineer will log the issue (and resolut ion) fo r each location in the FSS Field Log and on app licable HOP survey forms.
6. CPS (and associated data logger) is the preferred method for performing GWS.
When a GPS and data Jogger is used, down load and provide the survey data to a GIS Special ist.
a. C IS Specialist: Provide colorimetric maps indicating survey coverage and measurements exceeding the IAL and send the survey data to Radiological Engineering.
b. Radio logica l Engineering: Provide statistical analysis to determine population characteristics of the survey data set and identify any areas requiring add itional surveys or sampling. Contact HP Technician to mark additional locations requiring survey or sampl ing as described above in Step 5 of these Specific Instructions.
lf a GPS and data logger cannot be used to perform GWS in any portion of this survey unit, the HP Technician wil l contact Radiological Engi11eering to determine compensatory survey methods. Radiological Engineering will log the compensatory methods in tbe FSS Survey Log.
Samp ling
7. Obtain soil samples at locations and depths identified in Appendix P-4 and at locations specified by Radiological Engineering in accordance with 11 OP-PR-FSS-71 1.
8. Collect one duplicate sample for every 20 samples. Collect a minimum of one duplicate sample is requi red for each survey unit.
9. Submit samples for analysis fo llowing sample chain of custody requirements contained in HOP-PR-QA-006.
I 0. When performing biased sampling, monitor the count rate within the depression created by the biased surface soil sample.
a. If the count rate with in the depression exceeds the count rate on the surface by a factor two, then collect an additional soil sample from a depth of 15 cm - 30 cm.
b. Monitor the count rate within the depression created at each location requiring a second biased soil sample.
11 . Mon itor the count rates observed at all accessible surfaces within close proximity (e.g., 2 meter diameter) of each biased sampling location, as practical. Note any accessibility issues and discuss compensatory measures with supervision.
a. Contact and brief Radiological Engineering (or HP Supervision) on the results obtained from monitoring the locations of biased sampling to receive instructions for further investigation or the need for add it ional excavation.
Quality Record Westinghouse Non-Proprietary Class 3

Revision: 2
HDP-PR-FSS-701, Final Status Survey Plan Development APPENDIX P-3
FSS SAMPLE INSTRUCTIONS
Required Additio nal Surveys
Page P-5 of 6
NOTE: The fo llowing ilcms were identified in LSA 05-02 lhat require survey. The surveys will be performed in accordance with HDP-PR-HP-3 11 and wi ll be compared to the limi ts found in document Guidelines for Decontamination of Facilities and Equipment Prior tn Release for Unrestricted Use or Termination of Licenses for Byproduct, Source, or Special Nuclear Material.
I) Storm drain (located in the NW corner) adjacent to Highway P;
2) Concrele associated with s tom1 drain pipe (located in the NW corner) adjacenl to Highway P;
3) Concrete curb ( located due N) adjacent to the storm drain and Highway P;
4) Uti lity junction box ( located due N) adj acent to llighway P;
5) Concrete Footer (located in the center of the uni t)
Meters B, I or D (Ludlum 2360 w/ 43-89) will be selected to perform the following surveys. See attached sheets (Minimum Detectable Concentration (MDC) Worksheet) for scan MDC and IA L calculations.
Surface Contamination Survcv (SCS): Scan Coverage I 00% exposed surfaces
Meter B: A loha Scan MDC 82 dom/ I 00cni2
Meter B: Beta Scan MDC 2,057 dpm/ 1 OOcn,2
Meter 8 : Aloha Investigation Action Level (JAL) 15 Net C PM
Meter B: Beta Investi.e,ation Act ion Level (JAL) 218 Net C PM
Meter I: Alpha Scan MDC I IO dorn/ I OOcml
Meler I: Beta Scan MDC 2 ,725 dprn/ 1 OOcrnz
Meter I: Aloha Investigation Action Level (IAL) 19 Net C PM Meler I: Beta Investigation Action Level (IAL) 252 Net C PM
Meter D: Aloha Scan MDC 169 dom/ I 00cm2
Meter D: Beta Scan MDC 2,023 dpm/100cm2
Meter D: Aloha In vestigation Action Level ( IAL) 27 Net C PM Meter D: Beta Investiga tion Action Level (IAL) 2 17 Net CPM
Svstematic Surface Contamination Measurements: N umber of Locations
The number of measurements is dependent on the size of the item. A minimum of one measurement wi ll be performed. *" A measurement wi ll be oerformed on the surface of the item approximately everv linear meter.
Biased Surface Contamination Measurements:
lfa scan result is greater than e ither the a lpha or beta !AL listed above, take a static measurement and a removable activity smear.
I fthc item scanned is concrete (e.g. footer, curb, etc.), collect 3 volumetric samples from O" to 0.25" depth at locations with the highest static measurements. Volumetric samples wi ll be sent to an offs ite laborato1y for ana lys is by gamma spectroscopy and liquid scintillation or ICPMS for Tc-99.
Instrumentation Lud lum 2360 w/ 43-89 I Used for direct alpha and beta measurements and
surface contamination scan surveys. ;\1~,\.., ~ -k-N~ ·. St.L fi,lJ.L.oj ,\of'C~\l\1lS fo~l V\\Ml!bt.Y' o1f l'l"ltAS\l\rtoMt1>1 ~.i ht~n ufl 4 CC/'Y\Clft.t-e. ft,ofu ( 1E-(wi 6) .
12. Perfonn daily pre QC source check on the instrument used in accordance with HDP-PR- HP-4 11. Perform a post QC source
Quality Record Westinghouse Non-Proprietary Class 3
Revision: 2 Page P-6 of 6
HDP-PR-FSS-701 , Final Status Survey Plan Development APPENDIX P-3
FSS SAMPLE INSTRUCTIONS
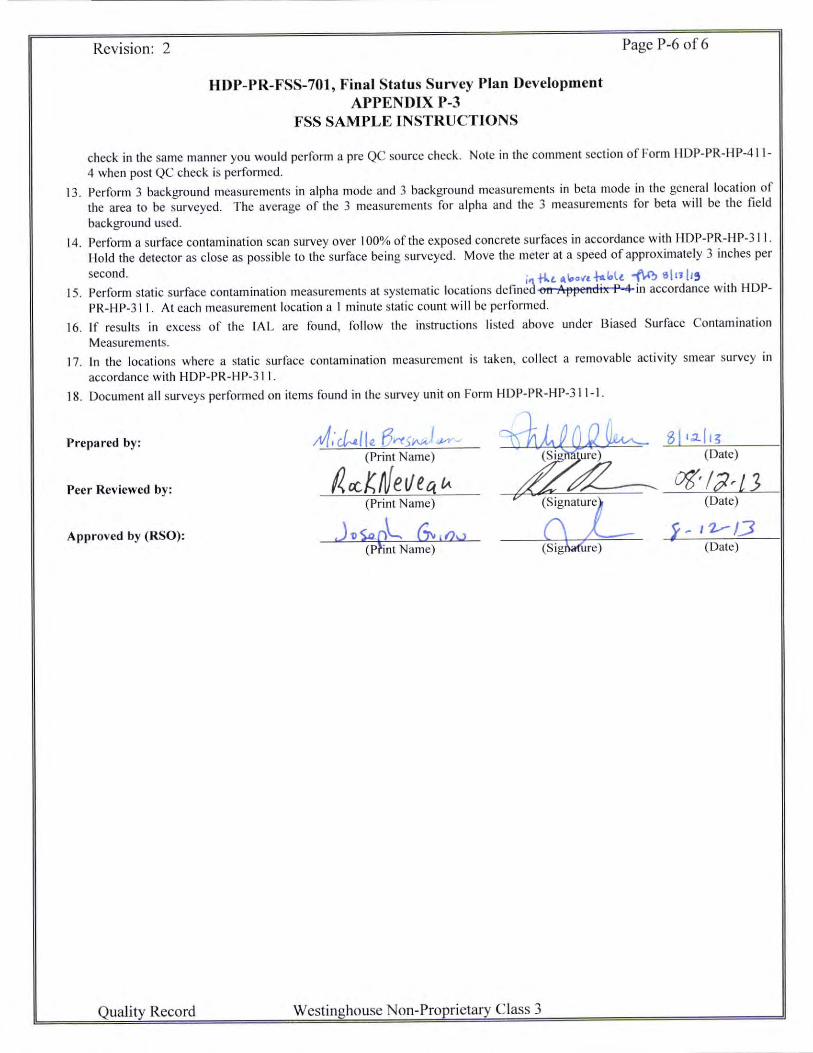
check in the same manner you would perform a pre QC source check. Note in the comment section of Form HDP-PR-HP-41 1-4 when post QC check is performed.
13. Perform 3 background measurements in a lpha mode and 3 backgro und measurements in beta mode in the general location of the area to be surveyed. The average of the 3 measurements for a lpha and the 3 measurements for beta will be the fie ld background used.
14 . Perfom1 a surface conta mination scan survey over I 00% of the exposed concrete surfaces in accordance with HDP-PR-HP-3 11 . I !o ld the detector as close as possible to the surface being surveyed. Move the meter at a speed of approximately 3 inches per
second. i +lt. ""'ov't~L,lt -(\.4, sin t,, 15. Perfonn static surface contamination measurements at systematic locations derined -en A13pe11di,c P-4 in accordance with HDP
PR-HP-3 l l . At each measurement location a I minute static count will be performed.
16. If results in excess of the IA L arc found, fo llow the instructions listed above under Biased Surface Contamination Measurements.
17. In the locations where a static surface contamination measurement is taken, collect a removable activity smear survey in accordance with HDP-PR-HP-3 11 .
18. Document a ll surveys performed on items found in the survey unit on Form HDP-PR-HP-3 11-1 .
Prepared by: Al[,-~11~ Fsl'YsV\.) j,1' ~~L~ QL Sl•;z..(,~ (Print Name) )Z'c) (Date)
~a:,(,/Jeveg, ~ 1/6' /;,. 13 Peer Reviewed by: £r (Print Name) (Date)
Approved by (RSO): J 1) $D_~l c~ I QI;.). (\ ~ 1~ I '1-,,- CJ (P~ nt Name) (SigWlirc) (Date)
Quality Record Westinghouse Non-Proprietary Class 3
Revision : 2
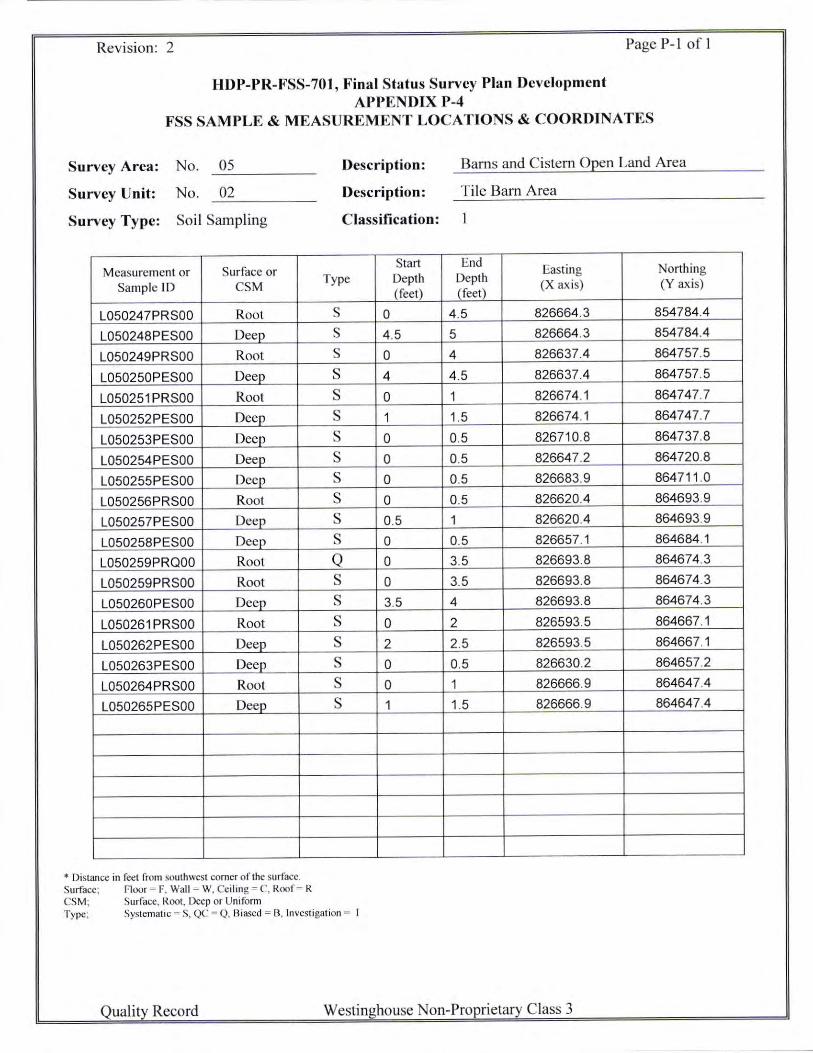
HDP-PR-FSS-701, Final Status Survey Plan Development APPENDIX P-4
Page P-1 of I
FSS SAMPLE & MEASUREMENT LOCATIONS & COORDINATES
Survey Area: No. 05 ------ Description: Barns and Cistern Open Land Area
Survey Unit: No. 02 ------ Description: Tile Barn Area
Survey Type: Soil Sampling Classification:
Measurement or Surface or Start End Easting Northing
Type Oepth Depth Sample ID CSM (feet) (feet)
(X axis) (Y axis)
L050247PRS00 Root s 0 4.5 826664.3 854784.4
L050248PES00 Deep s 4.5 5 826664.3 854784.4
L050249PRS00 Root s 0 4 826637.4 864757.5
L050250PES00 Deep s 4 4.5 826637.4 864757.5
L050251 PRSOO Root s 0 1 826674.1 864747.7
L050252PES00 Deep s 1 1.5 826674.1 864747.7
L050253PES00 Deep s 0 0.5 826710.8 864737.8
L050254PES00 Deep s 0 0.5 826647.2 864720.8
L050255PES00 Deep s 0 0.5 826683.9 864711 .0
L050256PRS00 Root s 0 0.5 826620.4 864693.9
L050257PES00 Deep s 0.5 1 826620.4 864693.9
L050258PES00 Deep s 0 0.5 826657.1 864684.1
L050259PRQOO Root Q 0 3.5 826693.8 864674.3
L050259PRS00 Root s 0 3.5 826693.8 864674.3
L050260PES00 Deep s 3.5 4 826693.8 864674.3
L050261 PRSOO Root s 0 2 826593.5 864667.1
L050262PES00 Deep s 2 2.5 826593.5 864667.1
L050263PES00 Deep s 0 0.5 826630.2 864657.2
L050264PRS00 Root s 0 1 826666.9 864647.4
L050265PES00 Deep s 1 1.5 826666.9 864647.4
• Dis tance in feel from southwest comer of the surface. Surface: Floor = F. Wall = W, Ceiling = C, Roof~ R CSM; Surface, Root, Deep or Unifonn Type; Systematic - S, (.)C = Q, Biased = B, Investigation = I
Quality Record Westinghouse Non-Proprietary Class 3

' " ' " ' " ' " ' " ' " '
I , , I , ,
I , , I , ,
I
I I
I
I I ' I
I ' I
I I
LSA-05-01
LSA-06-01
LSA-02-01
LEGEND:
D Land Survey Area
C] LSA-05-02
[] Property Boundary
[Il] FoITI1er Building Footprint
0 Road
Parking Area
- Fence
N
W~E w s
0 20 40 Feet
LSA-05-02 Boundary
Requested By M Bresnahan
Document /Reason · Final Status Survey
Hematite Decommissioning Project Jefferson County
Hematite, MO
Prepared Dy: I Rev· DJH I
S1zc: 8.Sx 11
Date: 08-12-13
'
' ' ' ' ' '
i ~
' ' ' ' ' '
I I
I
I I
I
I I
I
I , , I
I I
I I
I , I
I
I
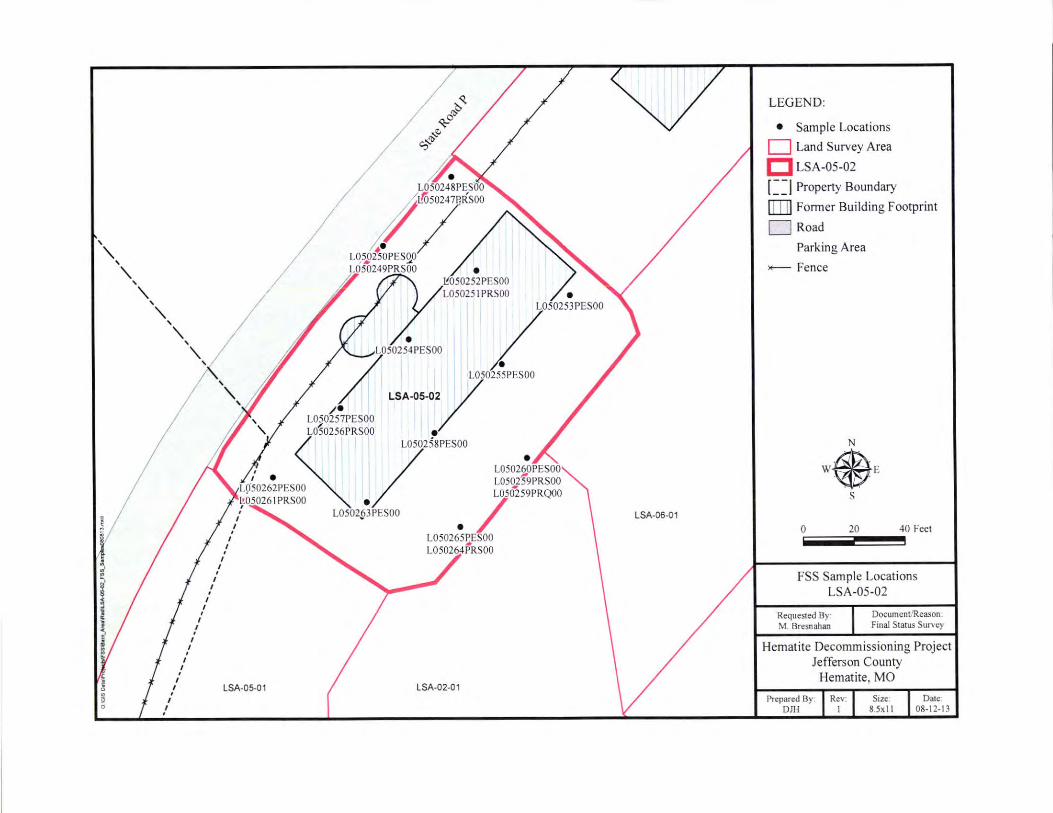
;. L050248PES00
/ Lfoso241e,Rsoo
.. / Lq~ 250PES2_0 Lf)50249PRS00
/ • L050253PES00
7L050254PES00 ~
L050255PES00
LSA-05-02/ /•
L050257PES00 L010256PRS00 e
~ L050258PES00
I •
,' • L050260PES00
L9'50262PES / L05<2f59PRS00 ~~0~ 61 PRS • / L050259PRQOO
L0502§3PES00
• L050265!:ES00 L05026:4PRS00
I LSA-05-01 LSA-02-01 I
I I
I
LSA-06-01
LEGEN D:
• Sample Locations
D Land Survey Area
C] LSA-05-02
[] Property Boundary
[I] Former Building Footprint
0 Road
Parking Area
-- Fence
N
w@, s
0 20 40 Feet
FSS Sample Locat ions LSA-05-02
Requested Uy· M. Bresnahan
Document/Reason. Final Starus Survey
Hematite Decommissioning Project Jefferson County
Hemat ite, MO
Prepared By· I Rev: OJI! I
S1zc 8.5xll
Date. 08-12-13