western lake erie watersheds - toledo metropolitan area ... · pdf fileclimate trends...
TRANSCRIPT


Western Lake Erie Watersheds
7.1 Million Acres70% Oh, 12% In, & 18% Mi
About 76% Cropland,3/4 Corn & Soybeans
Maumee Drains 2/3rds Area


Average Annual Export From the Maumee WS is 1.1 Pounds of P per acre
as measured through the Heidelberg Gage at Waterville.

Where Does the Agricultural Component of P Runoff
Come From?
What Causes The Loss?

March 8 2009

March 2009

Maumee River, Total Phosphorus Loading, 2003 Water Year
0
20
40
60
80
100
120
10/01 11/30 01/30 04/01 06/01 08/01Date
TP lo
adin
g ra
te,
mto
ns/d
ay
0
500
1,000
1,500
2,000
2,500
3,000
TP lo
ad, m
etric
tons
TP loading rate, mtons/day TP load, metric tons
2,448 metric tons P exported
Major Storms With High
Delivery of P

March‐June Maumee Total P
1,099
Year 2011
Year 2013
Year 2012

08/30/2012
09/03/2011)
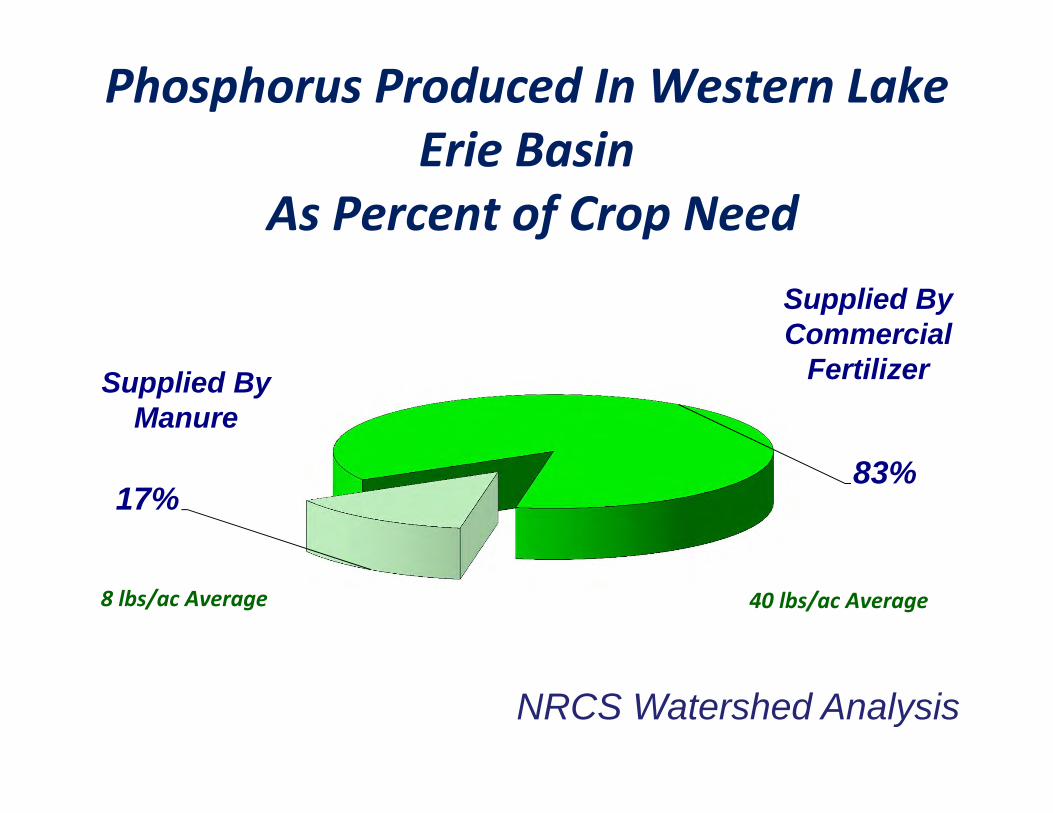
83%17%
Supplied By Manure
Supplied By Commercial
Fertilizer
8 lbs/ac Average 40 lbs/ac Average
Phosphorus Produced In Western Lake Erie Basin
As Percent of Crop Need
NRCS Watershed Analysis


Climate Trends – NWF Report1988 2nd Wettest June for Ohio since 1883
2003 3rd Wettest May in 100 years – Maumee ws
2008 1100 Daily Precip Records broken in Ohio
2011 75% Annual Ohio Precip fell Feb ‐May
2013 8th Wettest May since 1882 – Toledo Airport

How Do We Reduce The Loss?

Upland/In‐field Edge‐of‐field Downstream% Red
uctio
n in Pollutant Transpo
rt4‐R approach
Scale
What is the most effective scale to address water quality? How do we avoid tradeoffs among pollutants? How does it depend on the
ecoregion? How do we convince landowners to look at their individual fields in a larger environmental context?
Avoid Control Trap
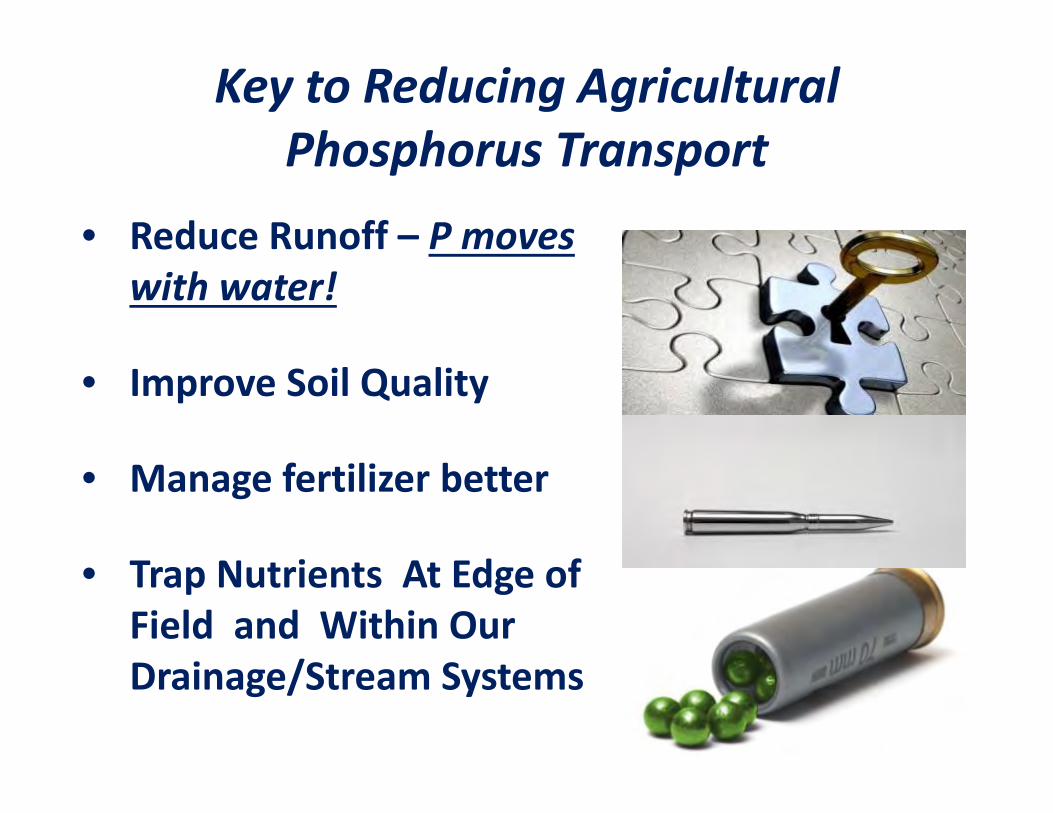
Key to Reducing AgriculturalPhosphorus Transport
• Reduce Runoff – P moves with water!
• Improve Soil Quality
• Manage fertilizer better
• Trap Nutrients At Edge of Field and Within Our Drainage/Stream Systems

What Conservation – BMP Practices Are Effective?

Cover CropsRight Place
Right Time
Right Rate

It Starts With Residue Management and No‐Till
Fertilizer In Soil + Residue = Less Runoff

Fertilizer Injection Into Cover Crop

Grass Waterways
Buffers
Wetlands
Precision Mgt.Filter Strips

Controlled Drainage
Bio Filters
Blind InletDrainage Water Management
Need To Put Filters and Retention Back in our drainage Systems


In all we have collected 200+ samples, to date, and the soluble P from gypsum treated soils averaging
over 50% reduction.
Samples were collected from the Rolland Wolfrum Hale Farm (Hicksville, OH) on December 20, 2012.
Water Quality Benefits

Ohio Phosphorus Risk Evaluation And
Field Scale Edge of Field Monitoring
Measuring Field Scale Surface and
Tile Runoff
16 Paired Edge of Field Sites
32 Fields

Do These Things Work?

Maumee Sandusky
Flow Has Increased 4.6% Per Decade 4.9% Per Decade
Suspended Sediment Has Decreased
-18% Per Decade -11% Per Decade
Particulate Phosphorous Has Decreased
-14% Per Decade -10% Per Decade
Since 1974
Source: Heidelberg College NCWQ

Documents 5 Years of
Changes in the Watershed
2013 Chesapeake CEAP Report:
SedimentNitrogen
PhosphorousSoil Carbon

100%
18%25%
0%
10%
20%
30%
40%
50%
60%
70%
80%
90%
100%
No ConservationPractices
With ConservationPractices
With ConservationPractices
Sediment Load % of Base
Phosphorus Load % of Base
Base
2011 Chesapeake Edge of Field Loads With Conservation Practices
Compared To No Practice Condition

Chesapeake Bay 2006 to 2011 Changes
2003‐2006
2011 Change
Structural Practices on
52% of ac 66% of ac 14% increase
Edge FieldTrapping on
14% of ac 31% of ac 17% increase
Continuous No‐Till on
38% of ac 54% of ac 16% increase
Cover crops at some point in rotation on
12% of ac 52% of ac 40% increase

Chesapeake Bay 2006 to 2011Edge of Field Changes in Losses:
2003‐2006
2011 Change
Sediment loss 5.1 t/ac 1.9 t/ac 63% reduction
Total P loss 3.4 #/ac 1.9 #/ac 44% reduction
N Loss ‐ surface 15.7 #/ac 9.7 #/ac 38% reduction
Acres losing Soil Carbon
189 #/ac 95 #/ac 50% reduction


Edge of Field P Losses
P Reduction Due ToConservation Practices
No Practices Loss
Existing PracticesLoss
Existing Practices Loss
Pounds Reduction
Percent Reduction
20.9Million Lbs
14.2 Million lbs
2.05Lbs/ac
6.65Million Lbs
32%
Impact of Conservation Practices on Phosphorous Loading
To Lake Erie BasinNRCS Great Lakes CEAP Report ‐ Tables 49&50

Potential P Savings From Additional Treatment Basin Wide ‐All Areas Treated /W All Practices
Edge of Field Savings ‐ Great Lakes Basin CEAP StudyCritical Under Treated Areas
Additional Under Treated Areas
Remaining Areas
Acres 2,840,000 5,040,000 6,920,000
% of Basin 19% 34% 47%Potential P SavingsAvg Lbs/Ac
Worst Acres
2.8 lbsMiddle Acres
1.9 lbsBest Acres
0.9 lbsReduction 14% 17% 12%

What About Regulation?

March 8 2009

Scene of the
Crime!

44 Different Crop Fields!

14 Different Soil Types818 Acres Drainage Area

30 Different Parcels18 Farms & 12 Home sites

44 Crop Fields14 Soil Types30 Landowners
18 Different Farms4 Major Tile Mains818 Acres Drained

March 8 2009
Who Do You Handcuff?

8,700 =
Number of These 818 Acre Units in Western Lake Erie
Basin Watershed!

15,500 Farms In
Ohio Portion of Western Lake Erie Basin!

How Can We Change/Increase Adoption of These Practices?

Ohio Agriculture Fertilizer Applicator Certification Training
• Required if apply fertilizer on more than 50 acres
• Three hour training session –by Sept 2017
• Renewed every 3 years
• 750 Farmers Attended First Three Sessions


For FY 2010, 2011, and 2012, NRCS Invested $24 Million in EQIP Cost Share
In Lake Erie Basin.
That Calculates to an average of $1.60 Per Acre
On Land That:
• Sells for $5,000 to $12,000 per acre
• Has Potential for Gross Receipts of $500 to $1000 per acre
• Impacts a $1 Billion Per Year Sport fishing Industry and $11 Billion Tourism Industry

What About Targeting?
Every EQIP Application Is Ranked OnMore Than 20
Different factors!

Sample Ranking QuestionsAre the practices planned within one of the following Priority HUC 10 Watersheds: (100 Points)
i. Bad Creek , Upper Swan Creek, and Lower Swan Creek HUC 0410000903, 0410000907, 0410000908 (Fulton and Lucas Counties)…..
Does a field within offered acres have a soil test exceeding 150 lbs/Acre of P2O5 (Bray P1 Soil Test)? (50 Points)
Are 50% of the acres adjacent to a stream or ditch? (10 Points)
Priority Practices: Blind inlet, Drainage Water Management Structure, Cover Crops, or Nutrient Placement. (50 Points)


The Tri‐State Western Lake Erie Regional Conservation Partnership Proposal =
$17.5 Million in Conservation Funding to the Western Basin.

More Than 40 Partners Signed Letters of Intent To Cooperate for the Tri‐State WELB Project.
RCPP GoalGoal – “to protect the western basin of Lake Erie by reducing phosphorus (P) and sediment loading, harmful algal blooms (HAB) by working with partners and farmers to identify sources of nutrients and sediment and implement conservation practices and technology to address them”

What Other Efforts Are Underway?

2015 Water Quality Programs for Nutrient Reduction
2015 Water Quality Programs for Nutrient Reduction
Ohio Department of Natural ResourcesDivision of Soil & Water Resources

Nutrient Reduction Programs Lake Erie ‐ Nutrient Reduction Program
‐ $1.2 Million ‐ August 2014 thru March, 2015
Great Lakes Restoration Initiative ‐ Nutrient Reduction Program ‐ $5.9 Million ‐ August, 2014 – Sign‐ups continue until Fall, 2015
Regional Conservation Partnership Program ‐ $17.5 Million January, 2015 thru December 2019

Lake Erie ‐ Nutrient Reduction Program
Three Best Management Practices • Cover Crops • Controlled Drainage Structure • Blind Tile Inlets

GLRI‐NRP Best Management PracticesStructural Practices Manure Storage & Roofing Controlled Drainage
Agronomic System Practices Soil Testing Cover Crops Agronomic System

GLRI‐NRP Best Management PracticeFertilizer Placement
Goal: 20,000 Acres $1,300,000.00
Ksfarmsmfg.com, 2014
Looking for new and innovativeways to place fertilizer below the surface

A team approach to increase conservation practice implementation and MAEAP verifications on farms in
the Western Lake Erie Watershed Basin
From the Fields to the Great Lakes
Michigan Agricultural Environmental Assurance Program

Ted Mason Farm
Iott Farms
Calby & Lindsay Garrison Farm
EducationOn Farm
Risk Assessment
Third Party (MDARD)
Verification

“More Farmers need to get out to the Great Lakes to see for themselves and learn about what is happening – the Great Lakes are a treasure and we all need to do our part to protect them”. Blaine Baker Bakerlad Dairy, Clayton, MI

OSU Field To Faucet Initiative

Ohio Farm Bureau Federation $1 Million ‐Water Quality Action Plan
All WLEB Farmers certified by Earth Day, 2015
Assist Farmers prepare Nutrient Mgt Plans – OFB, OSU Extension – NRCS grant for 4 Agronomists in basin
Demonstration farm proposal with NRCS

Industry Led4R Nutrient Certification Program
• 49 AG RETAILERS HAVE APPLIED
• REPRESENTS 1.25 MILLION ACRES
• 25% OF MAUMEE WATERSHED
• www.4rcertified.org

Summary:
We know today. “No Regret” Actions:1. Manage runoff – Maintain Residue Cover, Improve Soil
Quality, Use Buffer and Trapping Practices. Manage tile drain water
2. Follow 4R’s – Follow Tri State Guide Recommendations, Soil Test, Manure Test, Use Variable Rate Technology.
3. Drawl down High Soil Test Fields.4. Eliminate application on frozen and snow covered ground5. Place P in contact with the soil, or incorporate and plant a
cover crop6. Look for low risk application windows (after wheat harvest,
etc)7. Do not apply ahead of predicted large rain events.
