wesco international - amazon s3 capital markets global industrials conference – september 8, 2016...
TRANSCRIPT
WESCO International John Engel Chairman, President and CEO RBC Capital Markets Global Industrials Conference September 8, 2016

2
RBC Capital Markets Global Industrials Conference – September 8, 2016
Safe Harbor Statement Note: All statements made herein that are not historical facts should be considered as “forward-looking statements” within the meaning of the Private Securities Litigation Act of 1995. Such statements involve known and unknown risks, uncertainties and other factors that may cause actual results to differ materially. Such risks, uncertainties and other factors include, but are not limited to: adverse economic conditions; disruptions in operations or information technology systems; product, labor or other cost fluctuations; supply chain disruptions or loss of key suppliers; expansion of business activities; exchange rate fluctuations; tax law changes or challenges to tax matters; increase in competition; risks related to acquisitions, including the integration of acquired businesses; litigation, disputes, contingencies or claims; legal or regulatory matters; debt levels, terms, financial market conditions or interest rate fluctuations; goodwill or intangible asset impairment; common stock dilution; and other factors described in detail in the Form 10-K for WESCO International, Inc. for the year ended December 31, 2015 and any subsequent filings with the Securities & Exchange Commission. Any numerical or other representations in this presentation do not represent guidance by management and should not be construed as such. The following presentation includes a discussion of certain non-GAAP financial measures. Information required by Regulation G with respect to such non-GAAP financial measures can be found in the appendix and obtained via WESCO’s website, www.wesco.com.
3
RBC Capital Markets Global Industrials Conference – September 8, 2016 RBC Capital Markets Global Industrials Conference – September 8, 2016
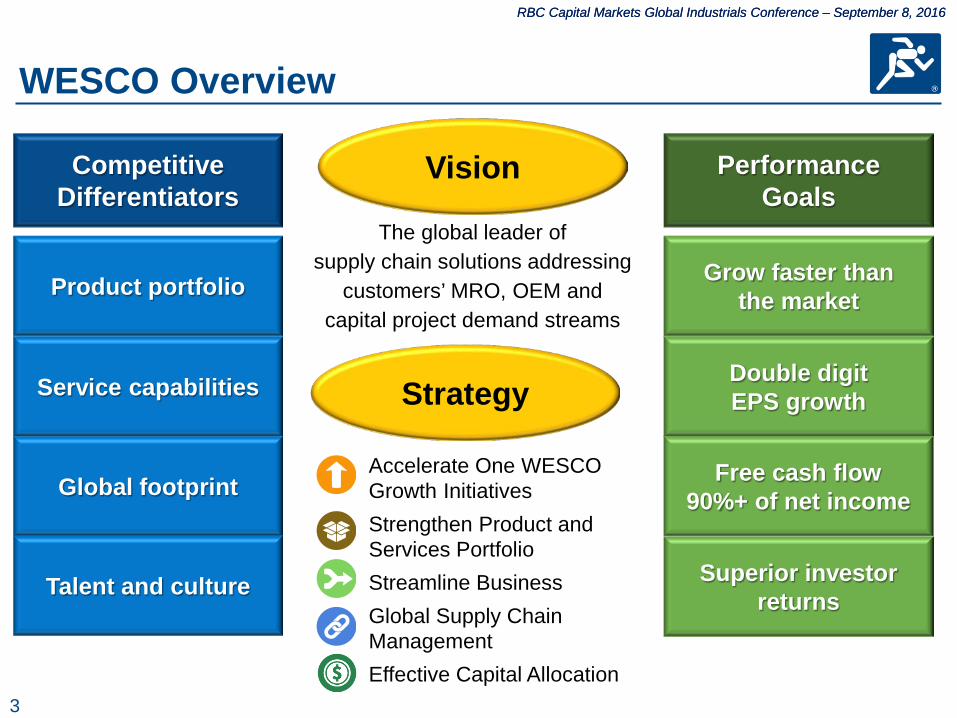
Competitive Differentiators
Performance Goals
The global leader of supply chain solutions addressing
customers’ MRO, OEM and capital project demand streams
Global footprint
Service capabilities
Product portfolio
Free cash flow 90%+ of net income
Double digit EPS growth
Grow faster than the market
Talent and culture Superior investor returns
Vision
WESCO Overview
Strategy
Accelerate One WESCO Growth Initiatives Strengthen Product and Services Portfolio Streamline Business Global Supply Chain Management Effective Capital Allocation
4
RBC Capital Markets Global Industrials Conference – September 8, 2016 RBC Capital Markets Global Industrials Conference – September 8, 2016
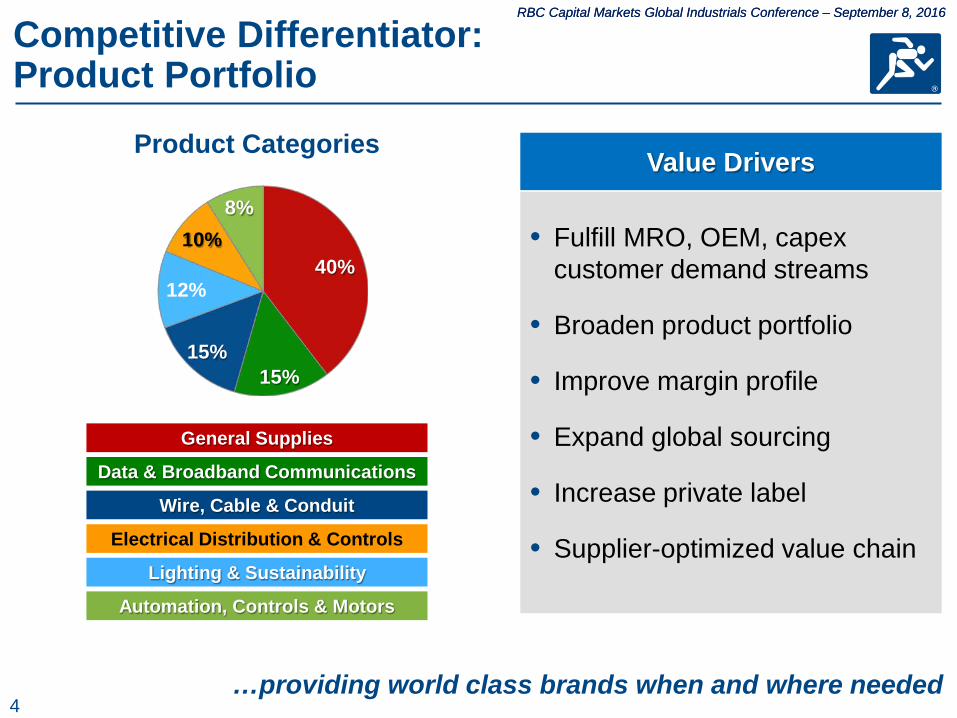
• Fulfill MRO, OEM, capex customer demand streams
• Broaden product portfolio
• Improve margin profile
• Expand global sourcing
• Increase private label
• Supplier-optimized value chain
…providing world class brands when and where needed
Automation, Controls & Motors
Lighting & Sustainability
General Supplies
Data & Broadband Communications
Wire, Cable & Conduit
Electrical Distribution & Controls
Product Categories Value Drivers
Competitive Differentiator: Product Portfolio
40%
15% 15%
12%
10% 8%
5
RBC Capital Markets Global Industrials Conference – September 8, 2016 RBC Capital Markets Global Industrials Conference – September 8, 2016
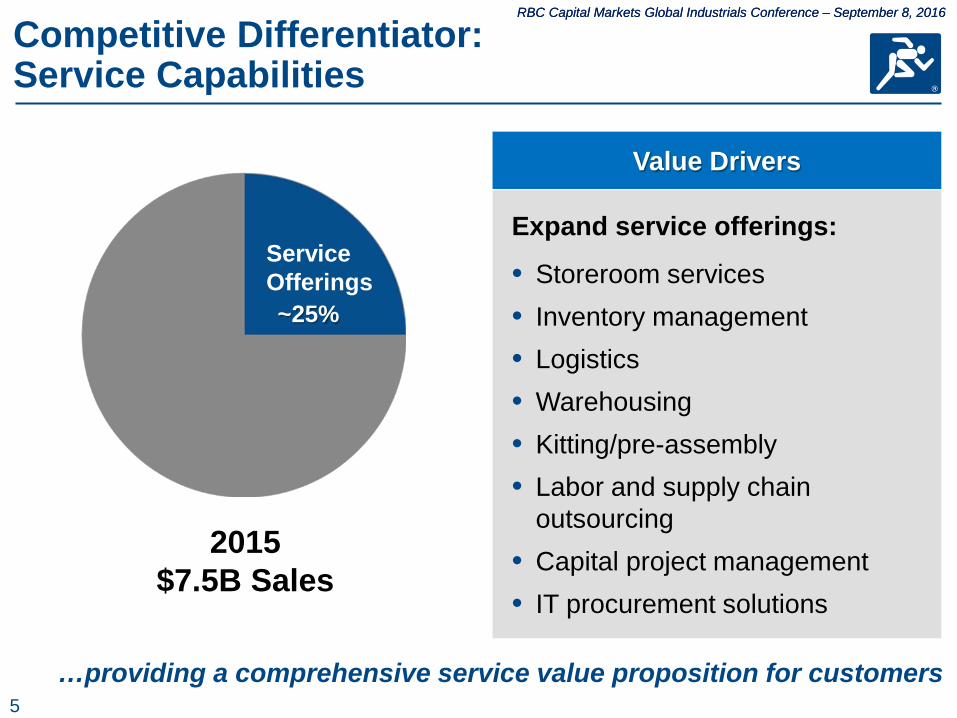
Expand service offerings:
• Storeroom services • Inventory management • Logistics • Warehousing • Kitting/pre-assembly • Labor and supply chain
outsourcing • Capital project management • IT procurement solutions
Value Drivers
…providing a comprehensive service value proposition for customers
~25%
Service Offerings
2015 $7.5B Sales
Competitive Differentiator: Service Capabilities
6
RBC Capital Markets Global Industrials Conference – September 8, 2016 RBC Capital Markets Global Industrials Conference – September 8, 2016
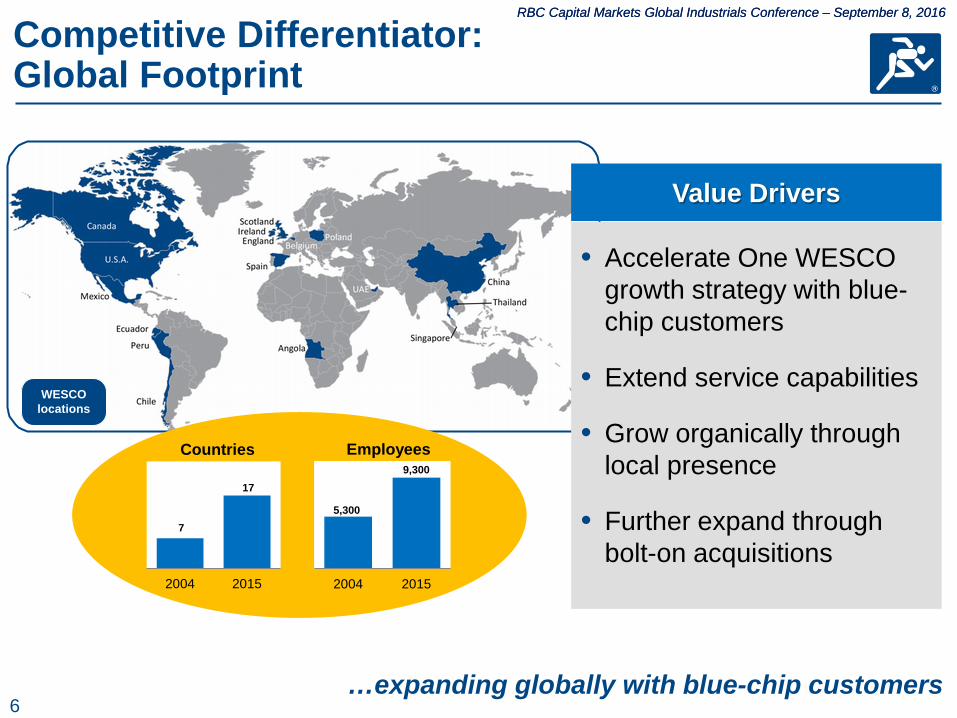
• Accelerate One WESCO growth strategy with blue-chip customers
• Extend service capabilities
• Grow organically through local presence
• Further expand through bolt-on acquisitions
…expanding globally with blue-chip customers
Value Drivers
7
17
2004 2015
Countries
5,300
9,300
2004 2015
Employees
WESCO locations
Competitive Differentiator: Global Footprint

7
RBC Capital Markets Global Industrials Conference – September 8, 2016 RBC Capital Markets Global Industrials Conference – September 8, 2016
Competitive Differentiator: Continuous Improvement Culture
…accelerating Lean inside and outside the company
Pull system for continuous improvement to drive business
results by engaging employees at all levels to be customer focused,
process minded, relentless in waste reduction, and empowered to lead
positive change.
• Enterprise-wide application and results – Focus on sales, operations and
transactional processes – Industry-leading value creation
program for customers
• Lean leadership, culture and certification programs
• Dedicated field resources driving increase in kaizens
• A distinct, competitive differentiator
WESCO Lean Journey
8
RBC Capital Markets Global Industrials Conference – September 8, 2016
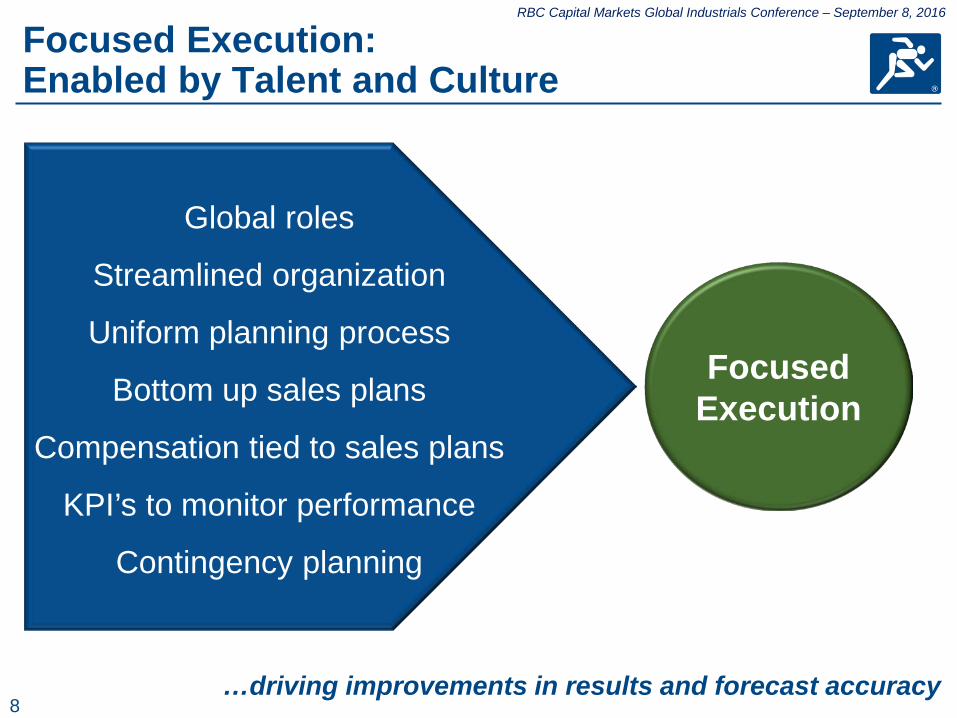
Focused Execution: Enabled by Talent and Culture
…driving improvements in results and forecast accuracy
Global roles
Streamlined organization
Uniform planning process
Bottom up sales plans
Compensation tied to sales plans
KPI’s to monitor performance
Contingency planning
Focused Execution
9
RBC Capital Markets Global Industrials Conference – September 8, 2016
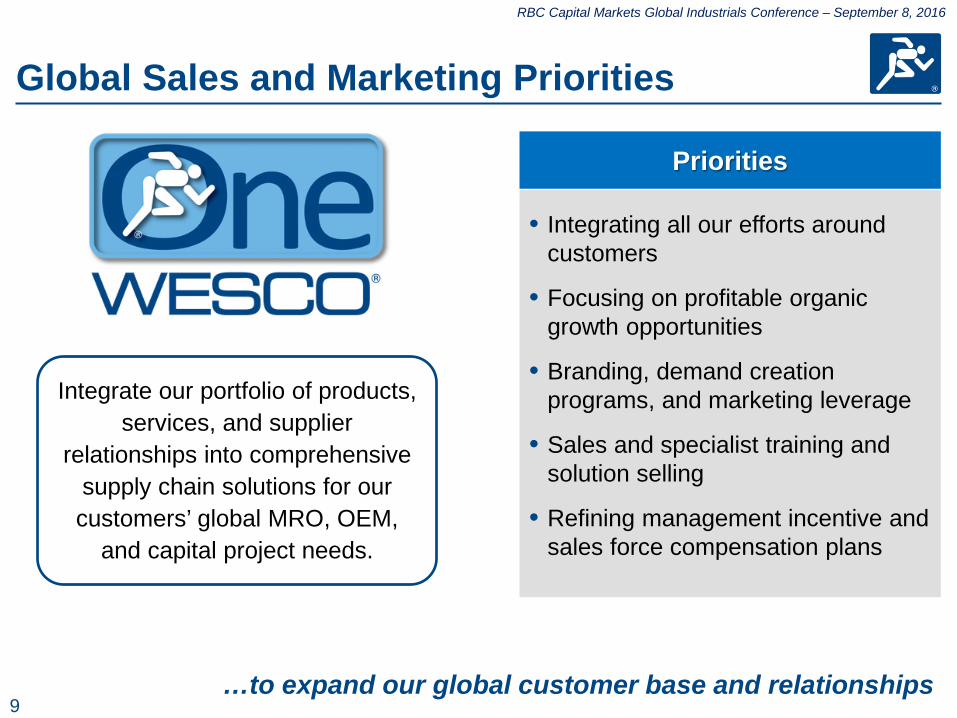
Global Sales and Marketing Priorities
• Integrating all our efforts around customers
• Focusing on profitable organic growth opportunities
• Branding, demand creation programs, and marketing leverage
• Sales and specialist training and solution selling
• Refining management incentive and sales force compensation plans
Priorities
…to expand our global customer base and relationships
Integrate our portfolio of products, services, and supplier
relationships into comprehensive supply chain solutions for our customers’ global MRO, OEM,
and capital project needs.
10
RBC Capital Markets Global Industrials Conference – September 8, 2016 RBC Capital Markets Global Industrials Conference – September 8, 2016
OEM Lighting
DA
TA C
OM
MU
NIC
ATI
ON
S
WIR
E D
ATA
CO
MM
UN
ICA
TIO
NS
CON
DU
IT-M
ETA
L
CON
DU
IT-N
ON
MET
ALL
IC
CON
DU
IT &
CA
BLE
FITT
ING
S
RACE
WA
YS, W
IREW
AYS
,STR
UT,
CABL
E TR
AY
WIR
E, P
OW
ER, C
ORD
S &
BU
ILD
ING
BOXE
S M
ETA
LLIC
& N
ON
-MET
ALL
IC
CIRC
UIT
BRE
AKE
RS
CUTO
UT,
ARR
ESTO
R, C
APA
CITO
RS &
H.V
. SW
ITCH
ES
ENCL
OSU
RES
ENG
INEE
R SE
RVIC
ES &
(W) R
ENEW
AL
PART
S
FUSE
S, F
USE
BLO
CKS
& F
USE
HO
LDER
S
LOA
DCE
NTE
RS/B
REA
KERS
/MET
ER C
ENTE
R
MET
ERIN
G/I
NST
RUM
ENT
TRA
NSF
ORM
ERS
PAN
ELBO
ARD
S/SW
ITCH
GEA
R/BU
SDU
CT
T&D
UTI
LITY
PRO
DU
CTS
TERM
INA
TIO
NS,
LUG
S,CO
NN
ECTO
RS &
ACC
ESSO
RIES
TRA
NSF
ORM
ERS
TRA
NSF
ORM
ERS:
DIS
TRIB
UTI
ON
TRA
NSF
ORM
ERS:
POW
ER
WIR
ING
DEV
ICES
MO
TOR
CON
TRO
L CE
NTE
RS
MO
TORS
& D
RIVE
S
SAFE
TY S
WIT
CHES
CON
TRO
L - O
PEN
& C
LOSE
D
PRO
GRA
MM
ABL
E CO
NTR
OLL
ERS
ELEC
TRIC
AL
SUPP
LIES
FAN
S,H
EATE
RS,V
ENTI
NG
EQ
UIP
.
IND
UST
RIA
L M
AIN
TEN
AN
CE
MIS
C EL
ECTR
ICA
L
TOO
LS
TAPE
,INSU
LATI
NG
MA
TERI
AL,
HEA
T SH
RIN
K TU
BIN
G,S
EALA
NTS
& A
DH
ESIV
ES
FACT
ORY
PRO
DU
CTS
BALL
AST
S
LAM
PS
LIG
HTI
NG
LOCATION 1LOCATION 2LOCATION 3LOCATION 4LOCATION 5
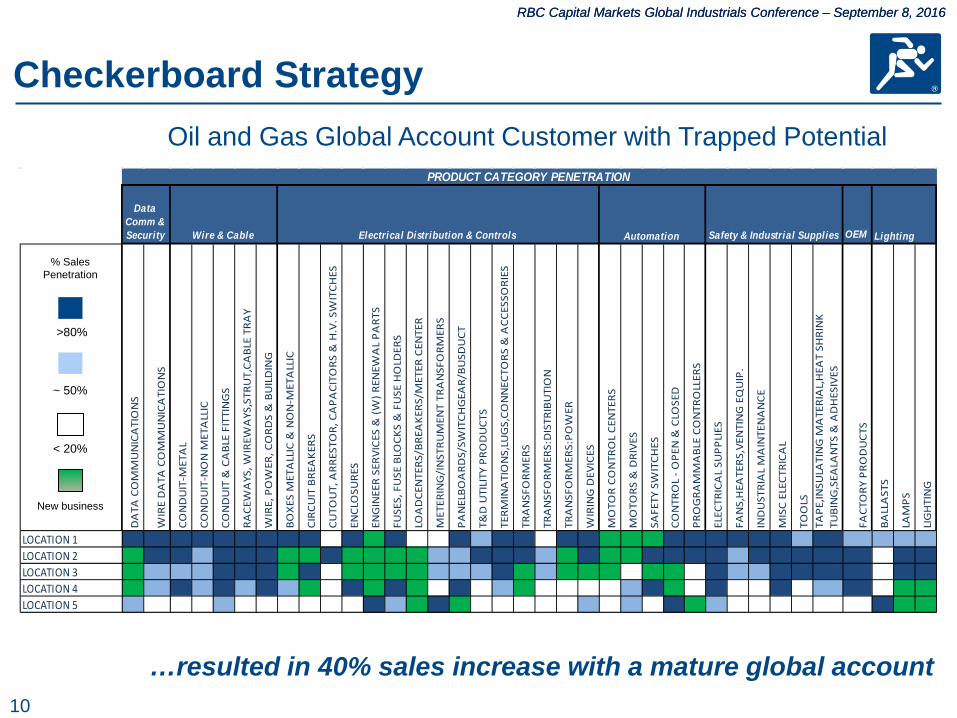
PRODUCT CATEGORY PENETRATION
Data Comm & Security Wire & Cable Electrical Distribution & Controls Automation Safety & Industrial Supplies
% Sales Penetration
>80%
~ 50%
< 20%
New business
Oil and Gas Global Account Customer with Trapped Potential
…resulted in 40% sales increase with a mature global account
Checkerboard Strategy
11
RBC Capital Markets Global Industrials Conference – September 8, 2016 RBC Capital Markets Global Industrials Conference – September 8, 2016
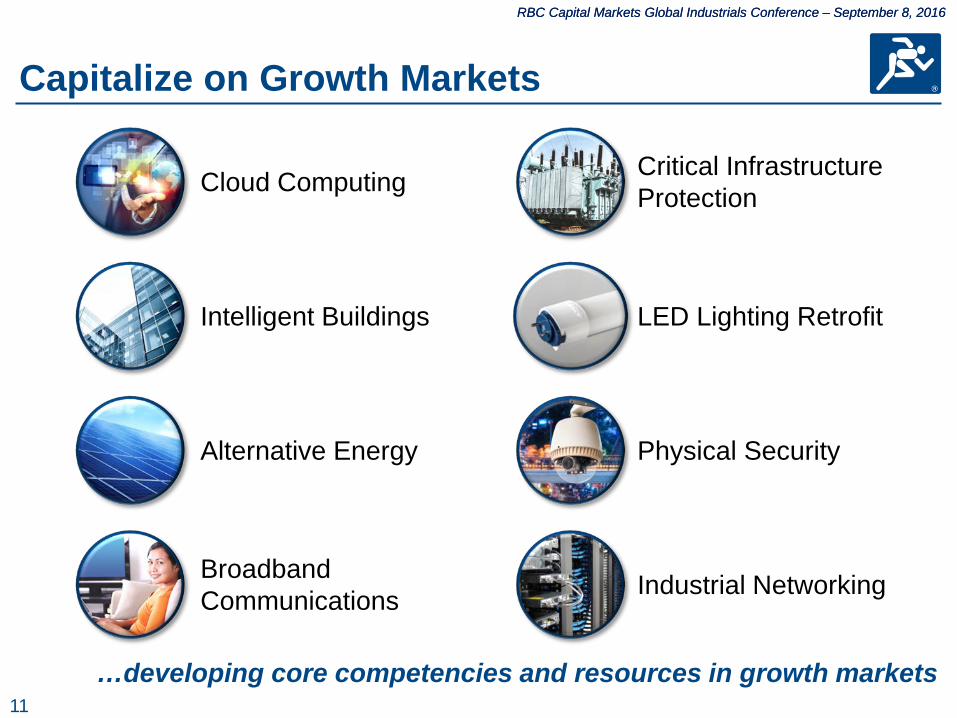
Capitalize on Growth Markets
Cloud Computing Critical Infrastructure Protection
Intelligent Buildings LED Lighting Retrofit
Alternative Energy Physical Security
Broadband Communications Industrial Networking
…developing core competencies and resources in growth markets
12
RBC Capital Markets Global Industrials Conference – September 8, 2016
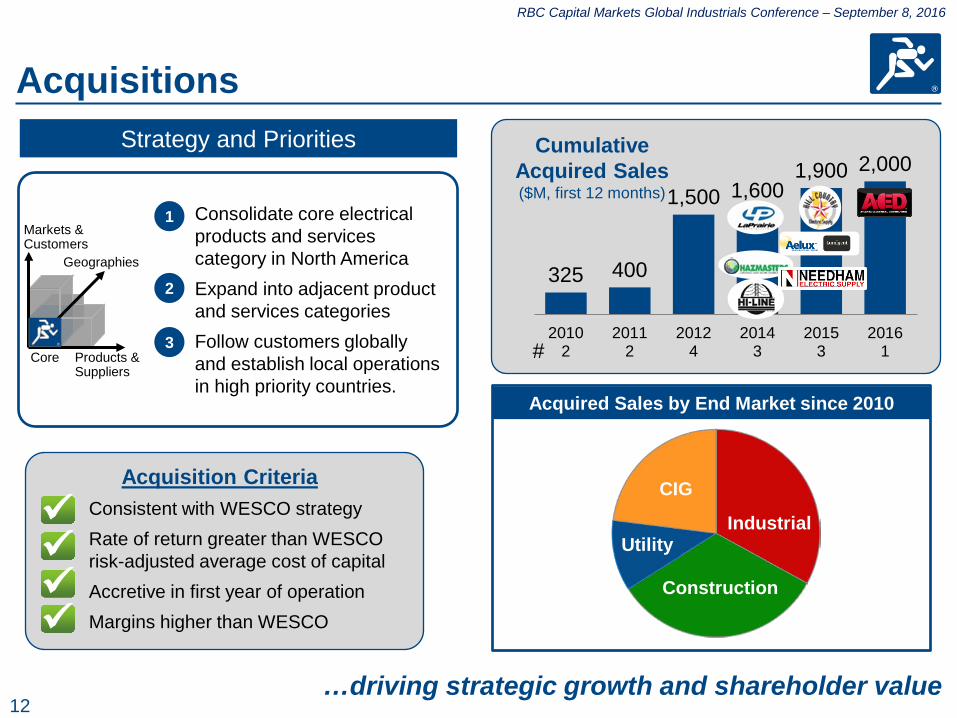
Acquisitions
325 400
1,500 1,600 1,900 2,000
20102
20112
20124
20143
20153
20161
Acquisition Criteria Consistent with WESCO strategy Rate of return greater than WESCO risk-adjusted average cost of capital Accretive in first year of operation Margins higher than WESCO
Cumulative Acquired Sales ($M, first 12 months)
#
…driving strategic growth and shareholder value
Strategy and Priorities
Acquired Sales by End Market since 2010
CIG
Industrial Utility
Construction
• Consolidate core electrical products and services category in North America
• Expand into adjacent product and services categories
• Follow customers globally and establish local operations in high priority countries.
Markets & Customers
Geographies
Products & Suppliers
Core
1
2
3
13
RBC Capital Markets Global Industrials Conference – September 8, 2016
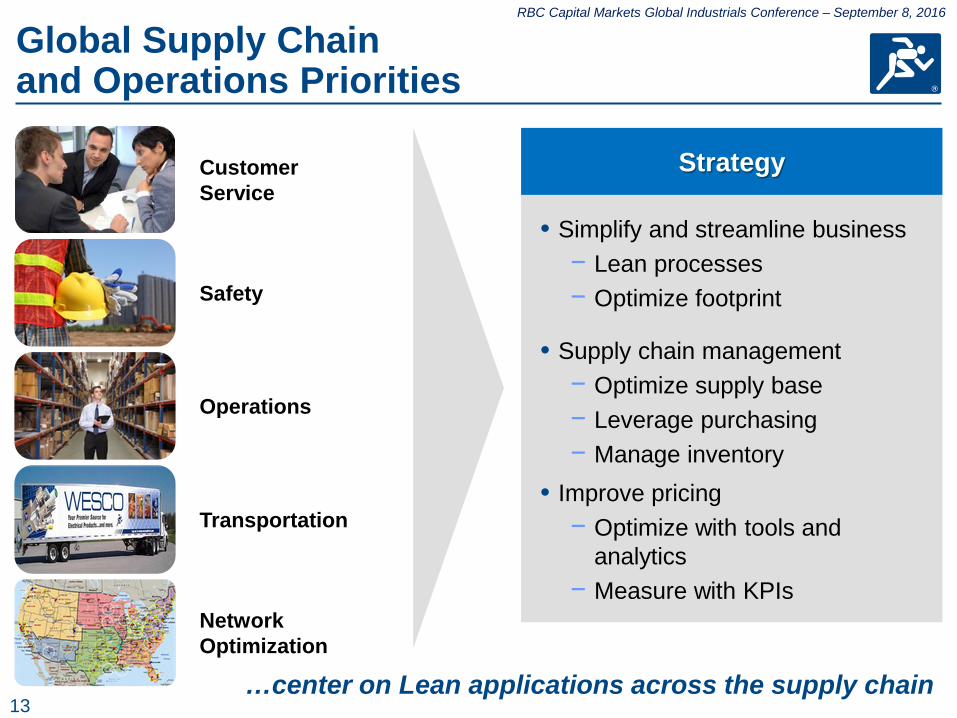
Global Supply Chain and Operations Priorities
Network Optimization
Operations
Transportation
Safety
• Simplify and streamline business − Lean processes − Optimize footprint
• Supply chain management − Optimize supply base − Leverage purchasing − Manage inventory
• Improve pricing − Optimize with tools and
analytics − Measure with KPIs
Strategy Customer Service
…center on Lean applications across the supply chain
14
RBC Capital Markets Global Industrials Conference – September 8, 2016
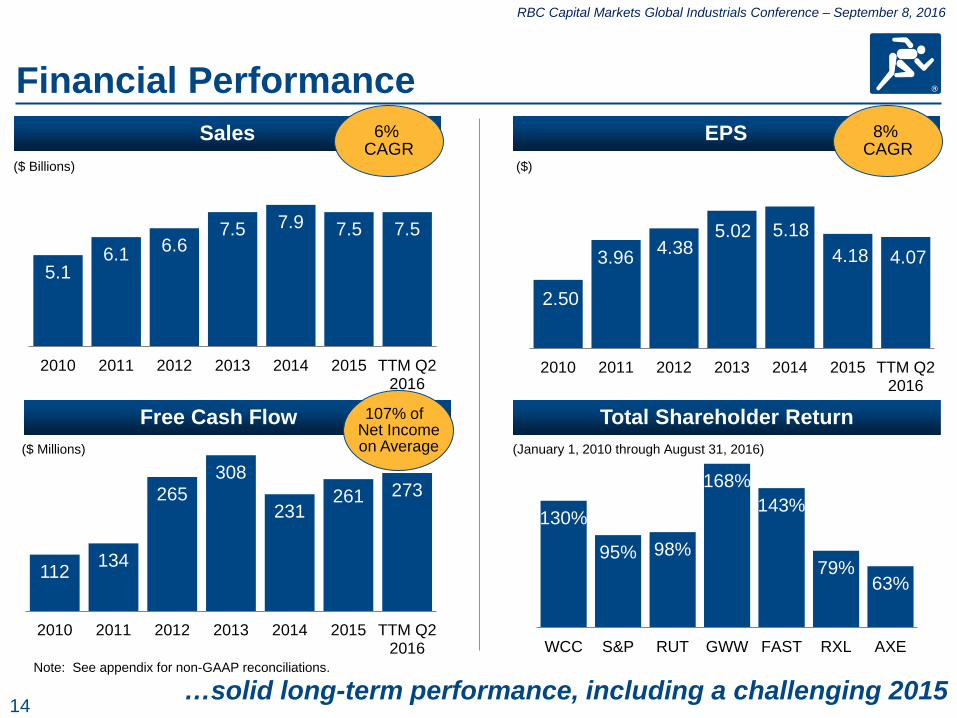
Financial Performance EPS Sales 8%
CAGR
…solid long-term performance, including a challenging 2015
6% CAGR
2.50
3.96 4.38 5.02 5.18
4.18 4.07
2010 2011 2012 2013 2014 2015 TTM Q22016
5.1 6.1 6.6
7.5 7.9 7.5 7.5
2010 2011 2012 2013 2014 2015 TTM Q22016
112 134
265 308
231 261 273
2010 2011 2012 2013 2014 2015 TTM Q22016
Free Cash Flow 107% of Net Income on Average
130%
95% 98%
168% 143%
79% 63%
WCC S&P RUT GWW FAST RXL AXE
Total Shareholder Return
($ Billions)
($ Millions) (January 1, 2010 through August 31, 2016)
($)
Note: See appendix for non-GAAP reconciliations.

15
RBC Capital Markets Global Industrials Conference – September 8, 2016
Q2 2016 Highlights
…performance in line with outlook
• Reported sales were flat • Organic sales were down 3% in
the US and down 3% in Canada • Adjusting for Easter holiday, April
organic sales were down 5% • Oil & gas sales were down ~25% • Gross margin was flat • Operating margin and EPS were
in line with expectations • Strong free cash flow of over
100% of net income • July organic sales down mid-
single digits month-to-date
1.6
6.0 6.7
8.1
3.2
(3.0)
(5.3)
(7.6) (6.7)
(3.1)
Organic Growth (%)
Apr (3)% May (3)% Jun (4)%
Note: See appendix for non-GAAP reconciliations.
Q1 Q2 Q3 Q4 Q1 Q2 Q3 Q4
2014 2015
Q1
2016
Q2
16
RBC Capital Markets Global Industrials Conference – September 8, 2016 RBC Capital Markets Global Industrials Conference – September 8, 2016
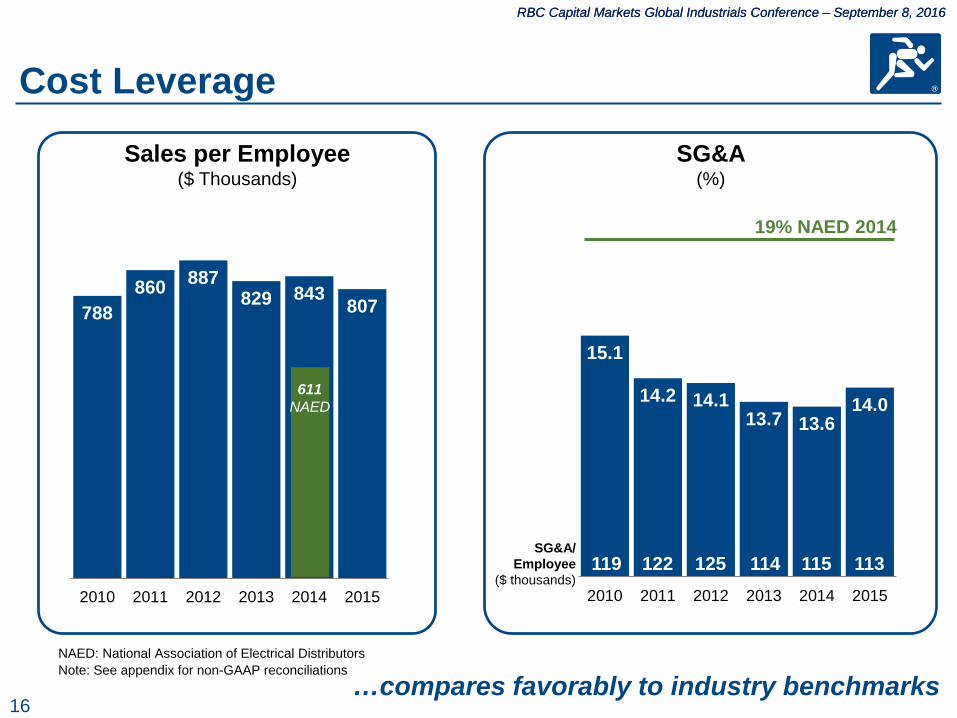
788 860 887
829 843 807
2010 2011 2012 2013 2014 2015
Cost Leverage
Sales per Employee ($ Thousands)
SG&A (%)
…compares favorably to industry benchmarks NAED: National Association of Electrical Distributors
15.1
14.2 14.1 13.7 13.6
14.0
2010 2011 2012 2013 2014 2015
19% NAED 2014
SG&A/ Employee
($ thousands) 119 122 125 114 113 115
611 NAED
Note: See appendix for non-GAAP reconciliations
17
RBC Capital Markets Global Industrials Conference – September 8, 2016 RBC Capital Markets Global Industrials Conference – September 8, 2016
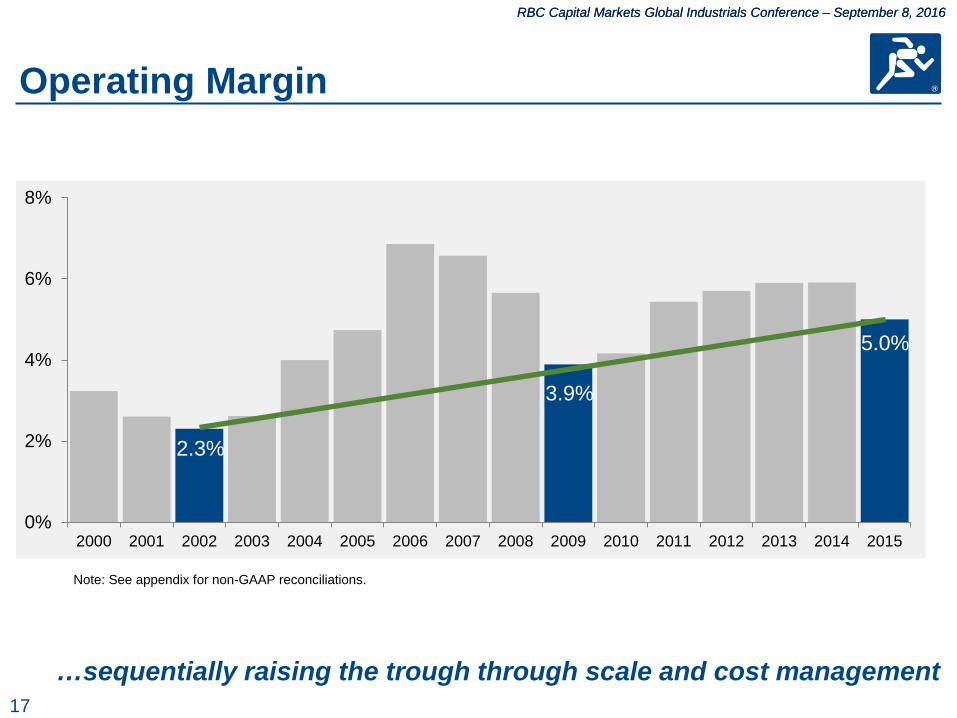
Operating Margin
2.3%
3.9%
5.0%
0%
2%
4%
6%
8%
2000 2001 2002 2003 2004 2005 2006 2007 2008 2009 2010 2011 2012 2013 2014 2015
…sequentially raising the trough through scale and cost management
Note: See appendix for non-GAAP reconciliations.
18
RBC Capital Markets Global Industrials Conference – September 8, 2016
1.5
2
2.5
3
3.5
4
Q1 Q2 Q3 Q4 Q1 Q2 Q3 Q4 Q1 Q2
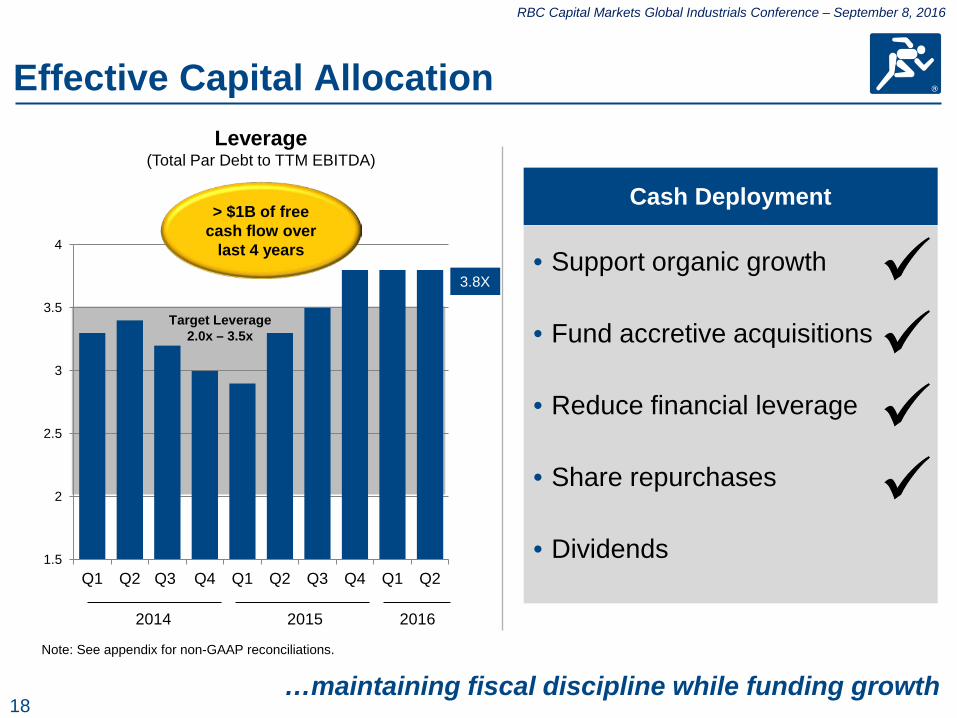
Effective Capital Allocation Leverage
(Total Par Debt to TTM EBITDA)
…maintaining fiscal discipline while funding growth
Cash Deployment
• Support organic growth
• Fund accretive acquisitions
• Reduce financial leverage
• Share repurchases
• Dividends
> $1B of free cash flow over
last 4 years
Target Leverage 2.0x – 3.5x
Note: See appendix for non-GAAP reconciliations.
2014
3.8X
2015 2016
19
RBC Capital Markets Global Industrials Conference – September 8, 2016 RBC Capital Markets Global Industrials Conference – September 8, 2016
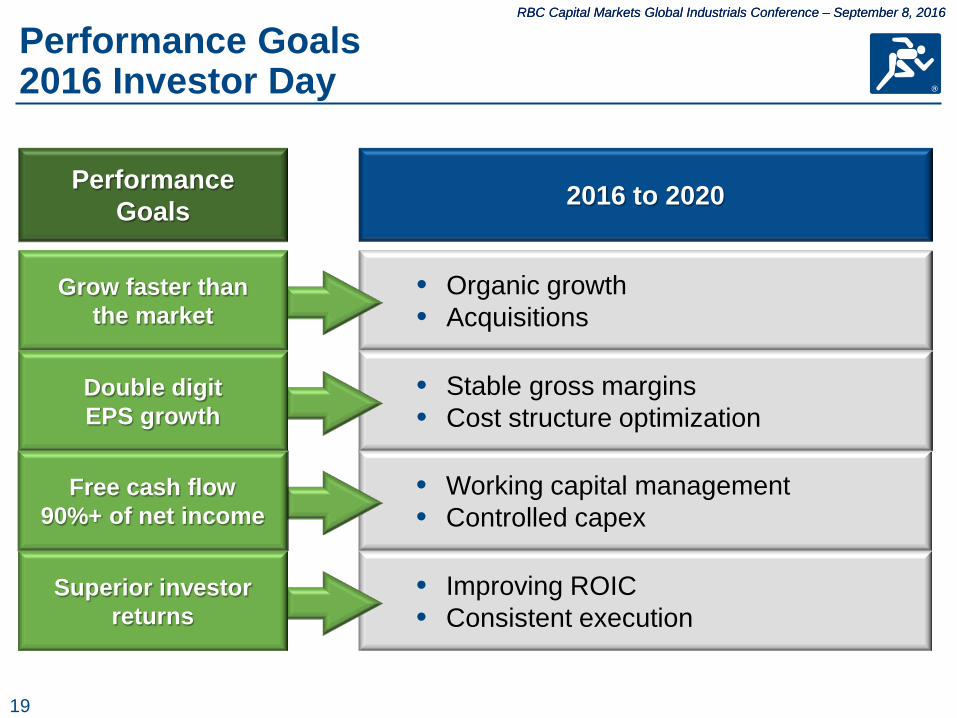
Performance Goals 2016 Investor Day
2016 to 2020
• Working capital management • Controlled capex
• Stable gross margins • Cost structure optimization
• Organic growth • Acquisitions
• Improving ROIC • Consistent execution
Performance Goals
Free cash flow 90%+ of net income
Double digit EPS growth
Grow faster than the market
Superior investor returns

20
RBC Capital Markets Global Industrials Conference – September 8, 2016 RBC Capital Markets Global Industrials Conference – September 8, 2016
5.1
6.1 6.6
7.5 7.9
7.5 ~7.4
2010 2011 2012 2013 2014 2015 2016E 2020E
Five-Year Targets 2016 Investor Day
Sales ($ B)
EPS ($)
…managing the business for double-digit EPS growth
See appendix for non-GAAP reconciliations.
7% to 9% CAGR
2.50
3.96 4.38
5.02 5.18
4.18 ~3.85
2010 2011 2012 2013 2014 2015 2016E 2020E
10+% CAGR
• Free cash flow equal to at least 90% of Net Income • ROIC above WACC, including acquisitions
~7.5 ~4.10
Average per year
• 2% from organic growth initiatives
• 2-3% from acquisitions
• Market growth
Average per year • ~20 bps
gross margin • ~50% pull
through • ~30% effective
tax rate • Share
repurchase to manage dilution
21
RBC Capital Markets Global Industrials Conference – September 8, 2016
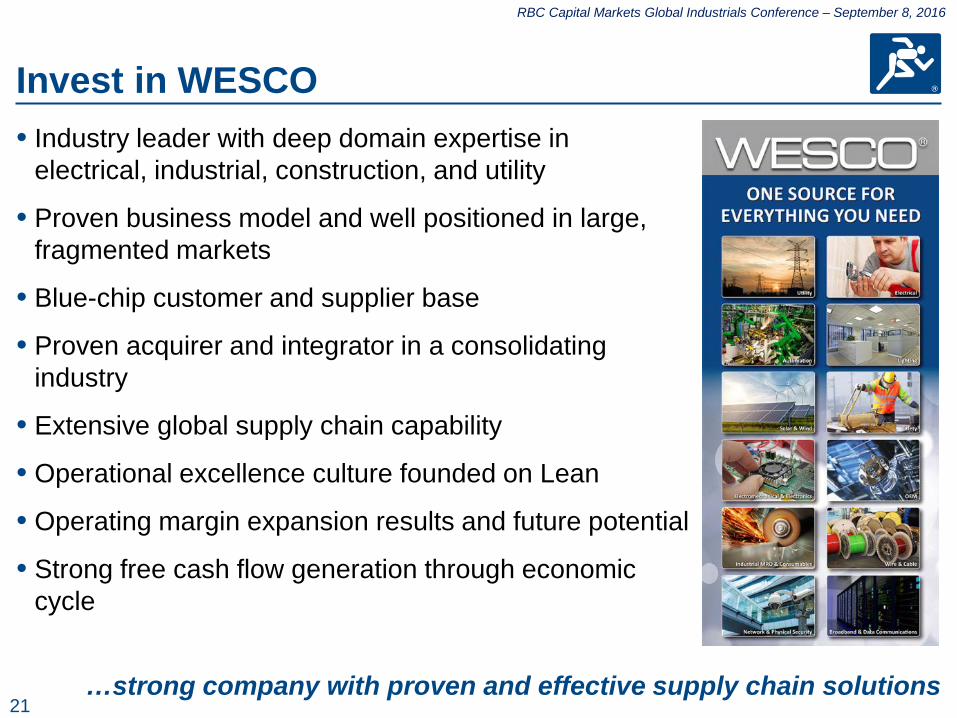
• Industry leader with deep domain expertise in electrical, industrial, construction, and utility
• Proven business model and well positioned in large, fragmented markets
• Blue-chip customer and supplier base
• Proven acquirer and integrator in a consolidating industry
• Extensive global supply chain capability
• Operational excellence culture founded on Lean
• Operating margin expansion results and future potential
• Strong free cash flow generation through economic cycle
Invest in WESCO
…strong company with proven and effective supply chain solutions
Webcast Presentation July 28, 2016
Q2 2016 Earnings
23
RBC Capital Markets Global Industrials Conference – September 8, 2016
Safe Harbor Statement Note: All statements made herein that are not historical facts should be considered as “forward-looking statements” within the meaning of the Private Securities Litigation Act of 1995. Such statements involve known and unknown risks, uncertainties and other factors that may cause actual results to differ materially. Such risks, uncertainties and other factors include, but are not limited to: adverse economic conditions; disruptions in operations or information technology systems; product, labor or other cost fluctuations; supply chain disruptions or loss of key suppliers; expansion of business activities; exchange rate fluctuations; tax law changes or challenges to tax matters; increase in competition; risks related to acquisitions, including the integration of acquired businesses; litigation, disputes, contingencies or claims; legal or regulatory matters; debt levels, terms, financial market conditions or interest rate fluctuations; goodwill or intangible asset impairment; common stock dilution; and other factors described in detail in the Form 10-K for WESCO International, Inc. for the year ended December 31, 2015 and any subsequent filings with the Securities & Exchange Commission. Any numerical or other representations in this presentation do not represent guidance by management and should not be construed as such. The following presentation includes a discussion of certain non-GAAP financial measures. Information required by Regulation G with respect to such non-GAAP financial measures can be found in the appendix and obtained via WESCO’s website, www.wesco.com.
24
RBC Capital Markets Global Industrials Conference – September 8, 2016
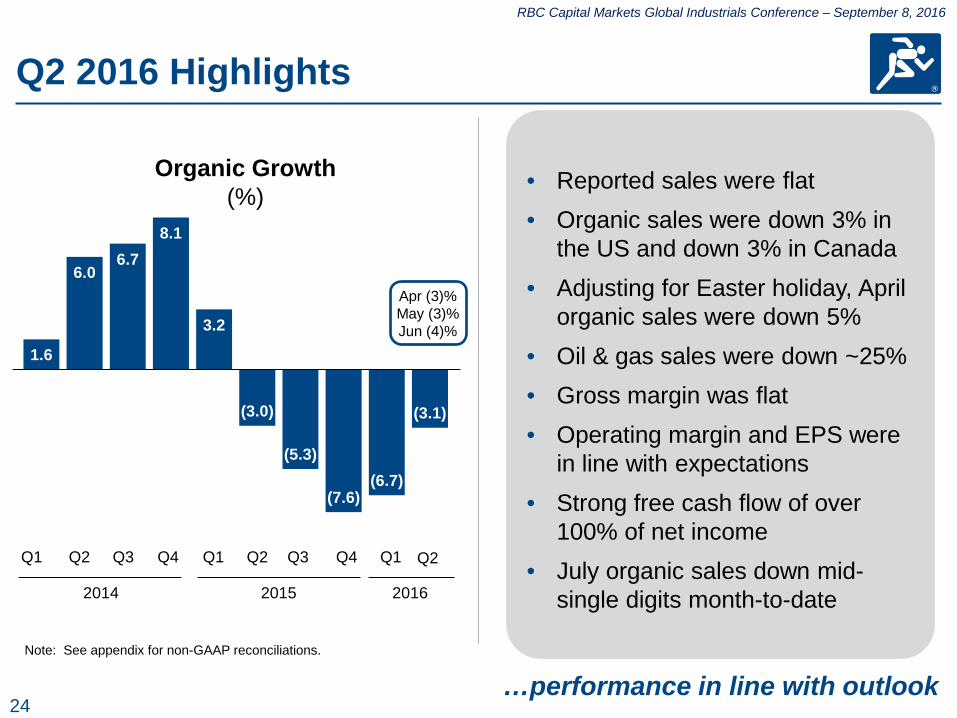
Q2 2016 Highlights
…performance in line with outlook
• Reported sales were flat • Organic sales were down 3% in
the US and down 3% in Canada • Adjusting for Easter holiday, April
organic sales were down 5% • Oil & gas sales were down ~25% • Gross margin was flat • Operating margin and EPS were
in line with expectations • Strong free cash flow of over
100% of net income • July organic sales down mid-
single digits month-to-date
1.6
6.0 6.7
8.1
3.2
(3.0)
(5.3)
(7.6) (6.7)
(3.1)
Organic Growth (%)
Apr (3)% May (3)% Jun (4)%
Note: See appendix for non-GAAP reconciliations.
Q1 Q2 Q3 Q4 Q1 Q2 Q3 Q4
2014 2015
Q1
2016
Q2
25
RBC Capital Markets Global Industrials Conference – September 8, 2016 RBC Capital Markets Global Industrials Conference – September 8, 2016
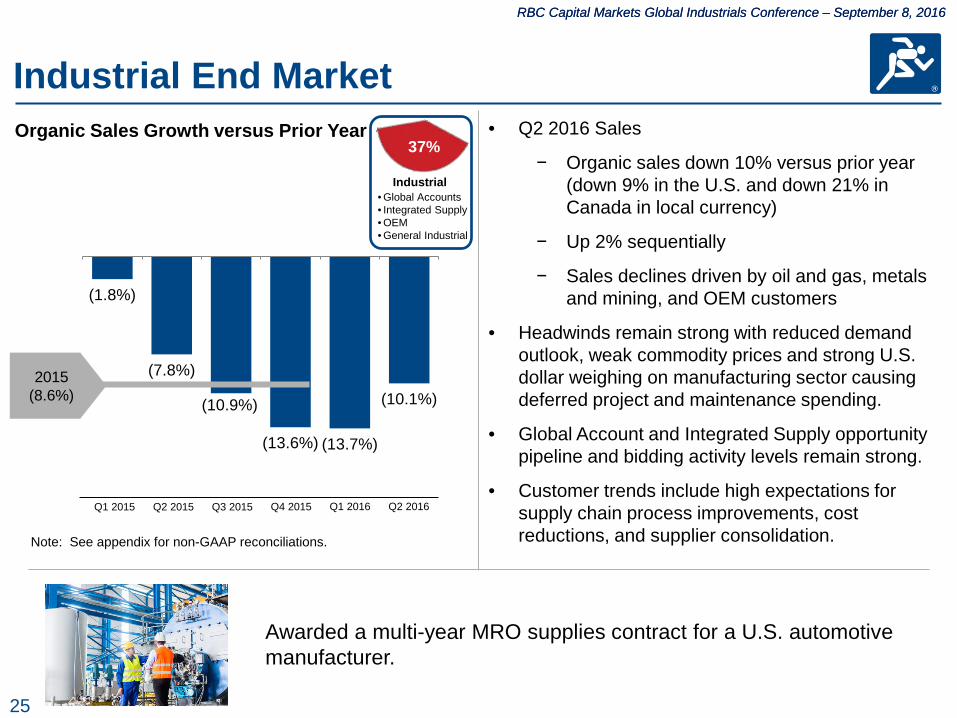
Industrial End Market • Q2 2016 Sales
− Organic sales down 10% versus prior year (down 9% in the U.S. and down 21% in Canada in local currency)
− Up 2% sequentially
− Sales declines driven by oil and gas, metals and mining, and OEM customers
• Headwinds remain strong with reduced demand outlook, weak commodity prices and strong U.S. dollar weighing on manufacturing sector causing deferred project and maintenance spending.
• Global Account and Integrated Supply opportunity pipeline and bidding activity levels remain strong.
• Customer trends include high expectations for supply chain process improvements, cost reductions, and supplier consolidation.
Organic Sales Growth versus Prior Year 37%
Industrial • Global Accounts • Integrated Supply • OEM • General Industrial
Awarded a multi-year MRO supplies contract for a U.S. automotive manufacturer.
(1.8%)
(7.8%)
(10.9%)
(13.6%) (13.7%)
(10.1%)
Q3 2015 Q2 2015 Q1 2015
2015 (8.6%)
Q4 2015 Q1 2016 Q2 2016
Note: See appendix for non-GAAP reconciliations.
26
RBC Capital Markets Global Industrials Conference – September 8, 2016 RBC Capital Markets Global Industrials Conference – September 8, 2016
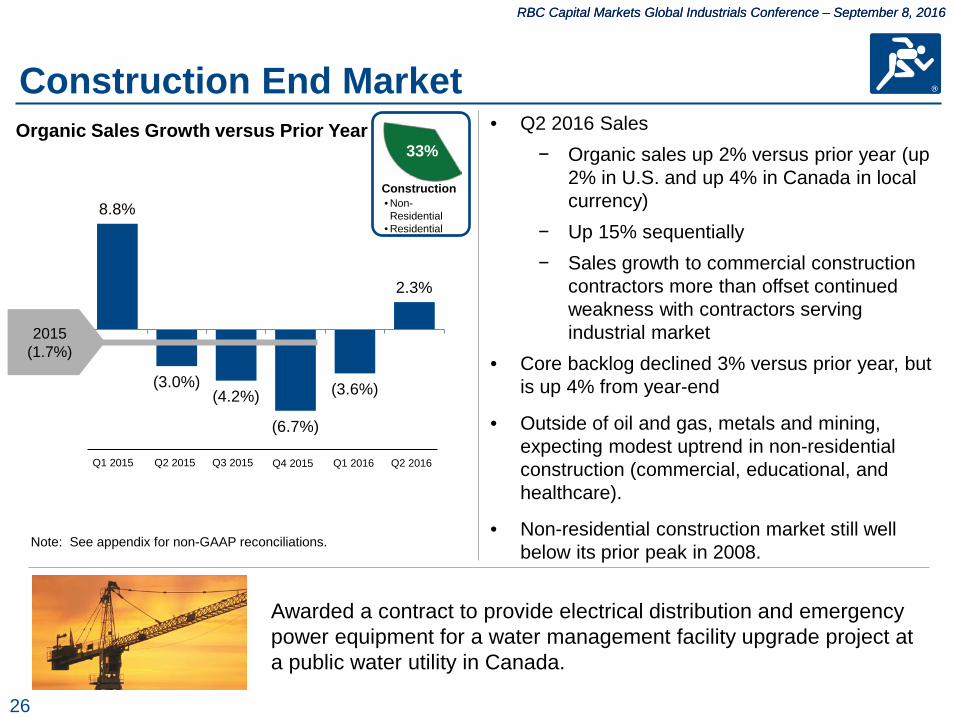
• Q2 2016 Sales − Organic sales up 2% versus prior year (up
2% in U.S. and up 4% in Canada in local currency)
− Up 15% sequentially − Sales growth to commercial construction
contractors more than offset continued weakness with contractors serving industrial market
• Core backlog declined 3% versus prior year, but is up 4% from year-end
• Outside of oil and gas, metals and mining, expecting modest uptrend in non-residential construction (commercial, educational, and healthcare).
• Non-residential construction market still well below its prior peak in 2008.
Construction • Non-Residential
• Residential
33% Organic Sales Growth versus Prior Year
Construction End Market
Awarded a contract to provide electrical distribution and emergency power equipment for a water management facility upgrade project at a public water utility in Canada.
8.8%
(3.0%) (4.2%)
(6.7%)
(3.6%)
2.3%
Q2 2015 Q1 2015 Q3 2015 Q4 2015
2015 (1.7%)
Q2 2016 Q1 2016
Note: See appendix for non-GAAP reconciliations.
27
RBC Capital Markets Global Industrials Conference – September 8, 2016 RBC Capital Markets Global Industrials Conference – September 8, 2016
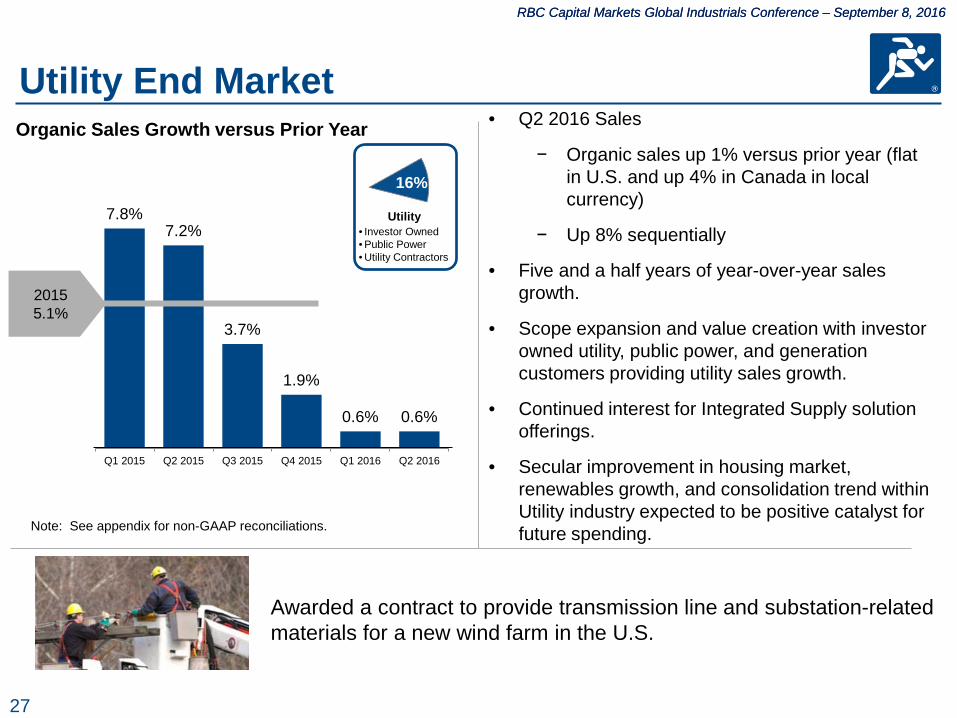
Utility End Market Organic Sales Growth versus Prior Year
16%
Utility • Investor Owned • Public Power • Utility Contractors
• Q2 2016 Sales
− Organic sales up 1% versus prior year (flat in U.S. and up 4% in Canada in local currency)
− Up 8% sequentially
• Five and a half years of year-over-year sales growth.
• Scope expansion and value creation with investor owned utility, public power, and generation customers providing utility sales growth.
• Continued interest for Integrated Supply solution offerings.
• Secular improvement in housing market, renewables growth, and consolidation trend within Utility industry expected to be positive catalyst for future spending.
Awarded a contract to provide transmission line and substation-related materials for a new wind farm in the U.S.
7.8% 7.2%
3.7%
1.9%
0.6% 0.6%
Q1 2015 Q2 2015 Q3 2015 Q4 2015 Q1 2016 Q2 2016
2015 5.1%
Note: See appendix for non-GAAP reconciliations.
28
RBC Capital Markets Global Industrials Conference – September 8, 2016 RBC Capital Markets Global Industrials Conference – September 8, 2016
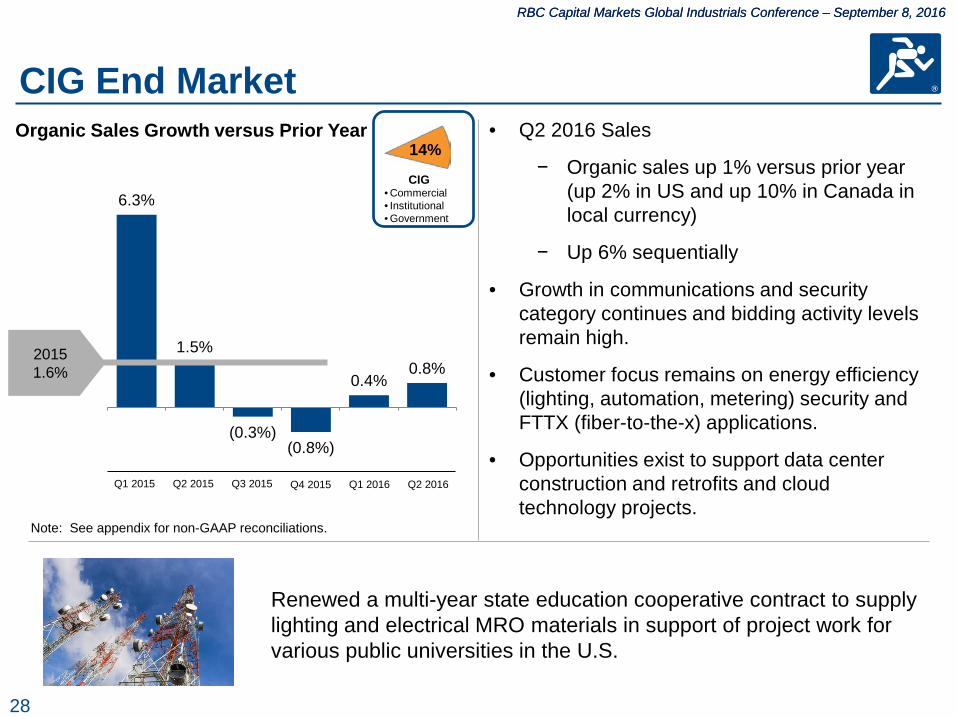
CIG End Market • Q2 2016 Sales
− Organic sales up 1% versus prior year (up 2% in US and up 10% in Canada in local currency)
− Up 6% sequentially
• Growth in communications and security category continues and bidding activity levels remain high.
• Customer focus remains on energy efficiency (lighting, automation, metering) security and FTTX (fiber-to-the-x) applications.
• Opportunities exist to support data center construction and retrofits and cloud technology projects.
Organic Sales Growth versus Prior Year
CIG • Commercial • Institutional • Government
14%
Renewed a multi-year state education cooperative contract to supply lighting and electrical MRO materials in support of project work for various public universities in the U.S.
6.3%
1.5%
(0.3%) (0.8%)
0.4% 0.8%
Q2 2015 Q1 2015 Q3 2015 Q4 2015
2015 1.6%
Q1 2016 Q2 2016
Note: See appendix for non-GAAP reconciliations.

29
RBC Capital Markets Global Industrials Conference – September 8, 2016
Q2 2016 Results
Outlook Actual YOY
Sales (3)% to (1)% $1.91B (0.3)% growth
Gross Margin 19.9% Flat
SG&A $275M, 14.4% Flat, flat; core down 4%
Operating Profit $88M Down 3%
Operating Margin 4.5% to 4.9% 4.6% Down 10 bps
Effective Tax Rate ~30% 27.3% Down 200 bps
370 bps
(2.7)% Growth
70 bps 200 bps
$1.91B $1.92B
Q2 2016 Sales
Acquisitions Foreign Exchange
Rest of World
Canada U.S. Q2 2015 Sales
90 bps 30 bps
(3.4)% Growth
(6.1)% Growth
(3.1)% Organic Growth
(0.3)% Growth
30
RBC Capital Markets Global Industrials Conference – September 8, 2016 RBC Capital Markets Global Industrials Conference – September 8, 2016
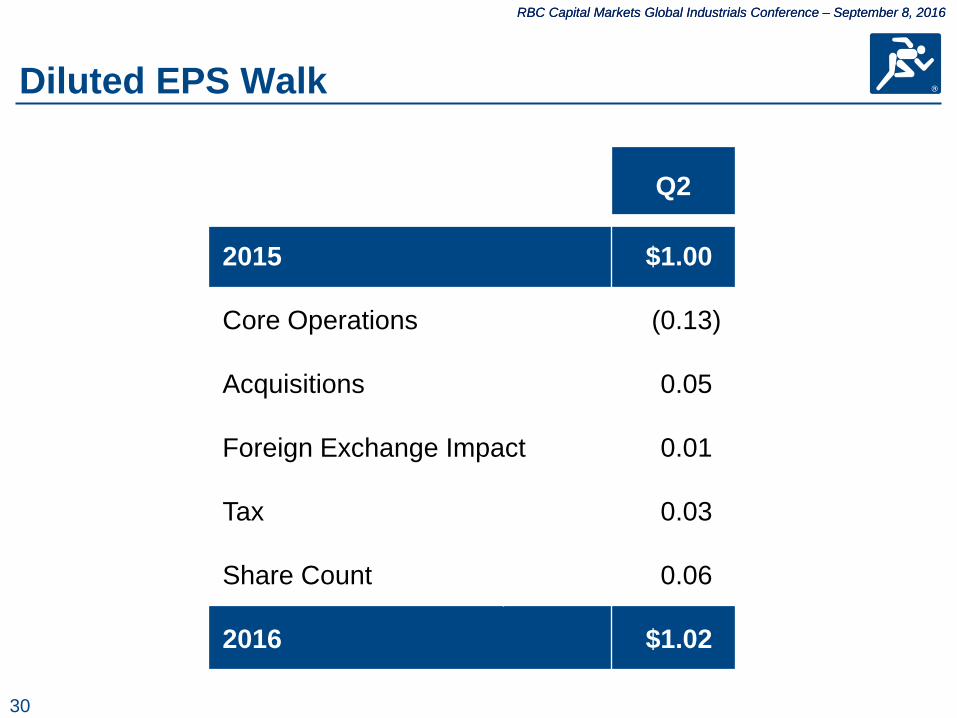
Diluted EPS Walk
Q2
2015 $1.00)
Core Operations (0.13)
Acquisitions 0.05)
Foreign Exchange Impact 0.01)
Tax 0.03)
Share Count 0.06)
2016 $1.02)
31
RBC Capital Markets Global Industrials Conference – September 8, 2016
1.5
2
2.5
3
3.5
4
Q1 Q2 Q3 Q4 Q1 Q2 Q3 Q4 Q1 Q2
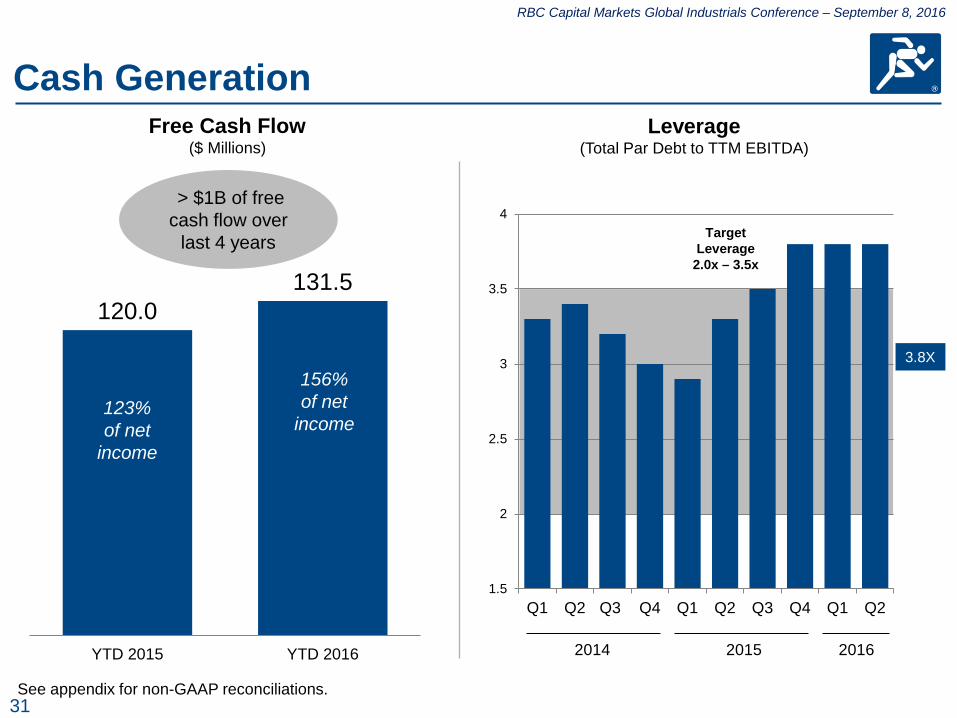
120.0 131.5
YTD 2015 YTD 2016
Cash Generation Free Cash Flow
($ Millions)
See appendix for non-GAAP reconciliations.
156% of net
income
123% of net
income
> $1B of free cash flow over
last 4 years
2014
Target Leverage
2.0x – 3.5x
3.8X
Leverage (Total Par Debt to TTM EBITDA)
2015 2016
32
RBC Capital Markets Global Industrials Conference – September 8, 2016
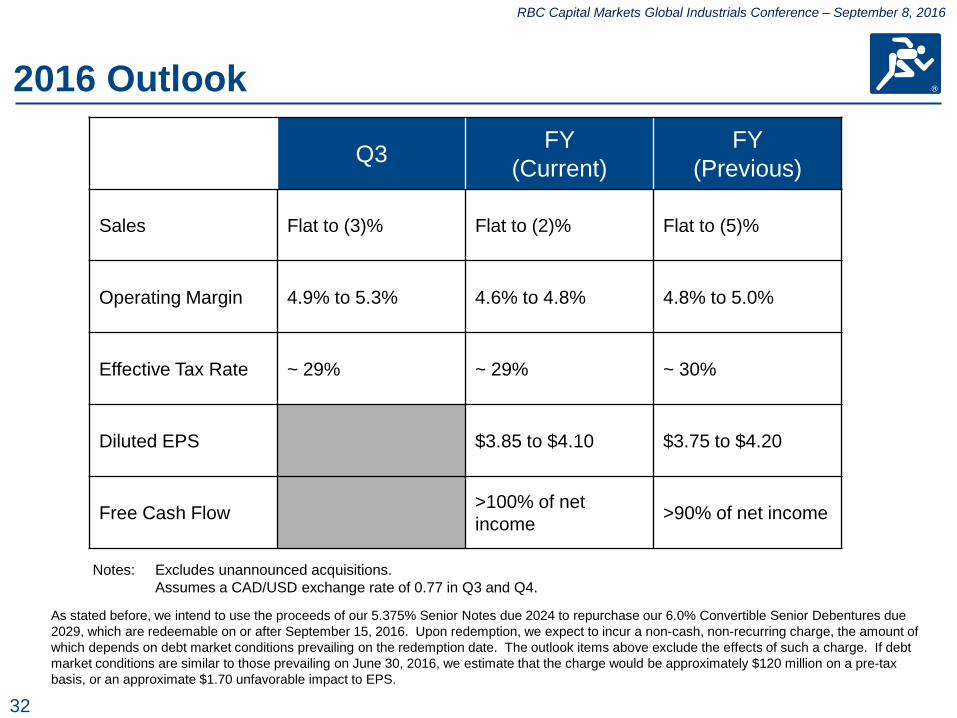
2016 Outlook
Q3 FY (Current)
FY (Previous)
Sales Flat to (3)% Flat to (2)% Flat to (5)%
Operating Margin 4.9% to 5.3% 4.6% to 4.8% 4.8% to 5.0%
Effective Tax Rate ~ 29% ~ 29% ~ 30%
Diluted EPS $3.85 to $4.10 $3.75 to $4.20
Free Cash Flow >100% of net income >90% of net income
Notes: Excludes unannounced acquisitions. Assumes a CAD/USD exchange rate of 0.77 in Q3 and Q4.
As stated before, we intend to use the proceeds of our 5.375% Senior Notes due 2024 to repurchase our 6.0% Convertible Senior Debentures due 2029, which are redeemable on or after September 15, 2016. Upon redemption, we expect to incur a non-cash, non-recurring charge, the amount of which depends on debt market conditions prevailing on the redemption date. The outlook items above exclude the effects of such a charge. If debt market conditions are similar to those prevailing on June 30, 2016, we estimate that the charge would be approximately $120 million on a pre-tax basis, or an approximate $1.70 unfavorable impact to EPS.
33
RBC Capital Markets Global Industrials Conference – September 8, 2016
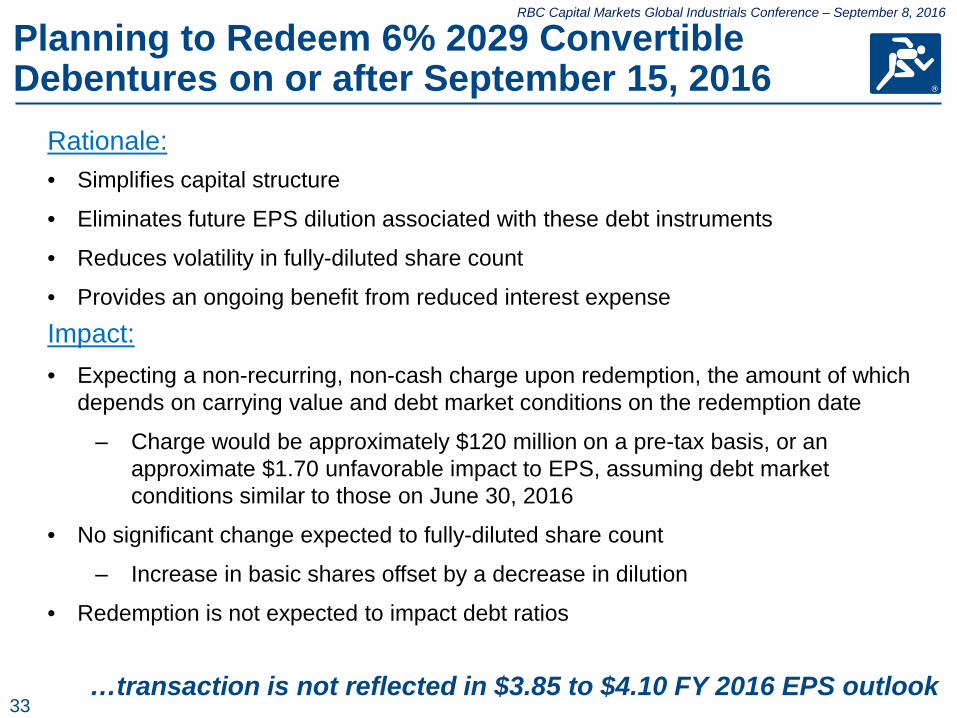
Planning to Redeem 6% 2029 Convertible Debentures on or after September 15, 2016
• Simplifies capital structure
• Eliminates future EPS dilution associated with these debt instruments
• Reduces volatility in fully-diluted share count
• Provides an ongoing benefit from reduced interest expense
• Expecting a non-recurring, non-cash charge upon redemption, the amount of which depends on carrying value and debt market conditions on the redemption date
‒ Charge would be approximately $120 million on a pre-tax basis, or an approximate $1.70 unfavorable impact to EPS, assuming debt market conditions similar to those on June 30, 2016
• No significant change expected to fully-diluted share count
‒ Increase in basic shares offset by a decrease in dilution
• Redemption is not expected to impact debt ratios
…transaction is not reflected in $3.85 to $4.10 FY 2016 EPS outlook
Rationale:
Impact:
34
RBC Capital Markets Global Industrials Conference – September 8, 2016
Appendix
NON-GAAP FINANCIAL MEASURES This webcast includes certain non-GAAP financial measures. These financial measures include normalized organic sales growth, gross profit, financial leverage and free cash flow. The Company believes that these non-GAAP measures are useful to investors in order to provide a better understanding of the Company's organic growth trends, capital structure position and liquidity on a comparable basis. Management does not use these non-GAAP financial measures for any purpose other than the reasons stated above.
35
RBC Capital Markets Global Industrials Conference – September 8, 2016
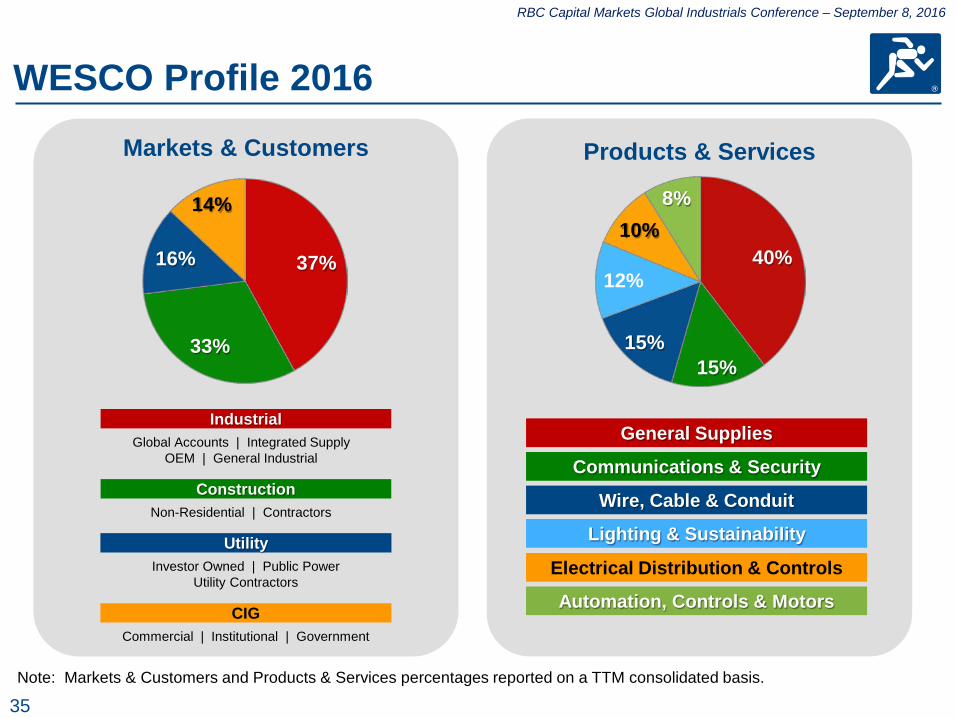
WESCO Profile 2016
37%
33%
16%
14%
40%
15% 15%
12%
10% 8%
Note: Markets & Customers and Products & Services percentages reported on a TTM consolidated basis.
Products & Services Markets & Customers
Utility
CIG
Industrial
Construction
Investor Owned | Public Power Utility Contractors
Commercial | Institutional | Government
Global Accounts | Integrated Supply OEM | General Industrial
Non-Residential | Contractors
Automation, Controls & Motors
Lighting & Sustainability
General Supplies
Communications & Security
Wire, Cable & Conduit
Electrical Distribution & Controls

36
RBC Capital Markets Global Industrials Conference – September 8, 2016
Sales Growth
2014 2015 2016 Q1 Q2 Q3 Q4 FY Q1 Q2 Q3 Q4 FY Q1 Q2
Change in Net Sales 0.2 5.9 7.6 6.1 5.0 0.3 (4.4) (7.4) (6.7) (4.7) (2.2) (0.3)
Acquisition Impact 0.5 1.6 1.8 1.6 1.4 1.2 1.6 2.0 3.0 2.0 3.9 3.7
Core (0.3) 4.3 5.8 4.5 3.6 (0.9) (6.0) (9.4) (9.7) (6.7) (6.1) (4.0)
FX Impact (1.9) (1.7) (0.9) (2.0) (1.6) (2.5) (3.0) (4.1) (3.7) (3.4) (2.6) (0.9)
Organic 1.6 6.0 6.7 6.5 5.2 1.6 (3.0) (5.3) (6.0) (3.3) (3.5) (3.1)
Workday Impact (1.6) (0.4) (1.6) 1.6 3.2
Normalized Organic 1.6 6.0 6.7 8.1 5.6 3.2 (3.0) (5.3) (7.6) (3.3) (6.7) (3.1)
(%)
37
RBC Capital Markets Global Industrials Conference – September 8, 2016
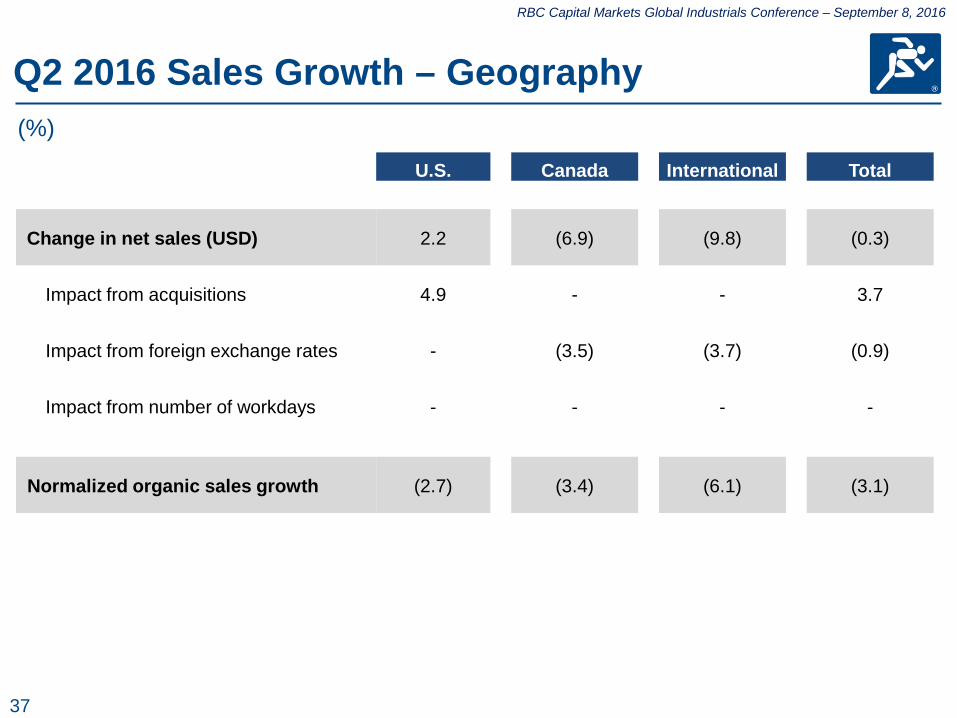
Q2 2016 Sales Growth – Geography
U.S. Canada International Total
Change in net sales (USD) 2.2 (6.9) (9.8) (0.3)
Impact from acquisitions 4.9 - - 3.7
Impact from foreign exchange rates - (3.5) (3.7) (0.9)
Impact from number of workdays - - - -
Normalized organic sales growth (2.7) (3.4) (6.1) (3.1)
(%)

38
RBC Capital Markets Global Industrials Conference – September 8, 2016 RBC Capital Markets Global Industrials Conference – September 8, 2016
Note: The prior period end market amounts noted above may contain reclassifications to conform to current period presentation.
($ Millions)
Sales Growth-End Markets
Q2 2016 vs. Q2 2015 Q2 2016 vs. Q1 2016
Q2 Q2 Q2 Q1
2016 2015 %
Growth 2016 2016 %
Growth
Industrial Core 676 758 (10.8) % 679 670 1.3%
Construction Core 612 606 0.9 % 640 567 12.8%
Utility Core 298 298 0.2 % 298 279 6.8%
CIG Core 262 262 0.1 % 275 262 5.0%
Total Core Gross Sales 1,848 1,924 (4.0) % 1,892 1,778 6.4%
Total Gross Sales from Acquisitions 71 - - 27 4 -00
Total Gross Sales 1,919 1,924 (0.3) % 1,919 1,782 7.6%
Gross Sales Reductions/Discounts (7) (7) - (7) (6) -00
Total Net Sales 1,912 1,917 (0.3) % 1,912 1,776 7.6%
39
RBC Capital Markets Global Industrials Conference – September 8, 2016
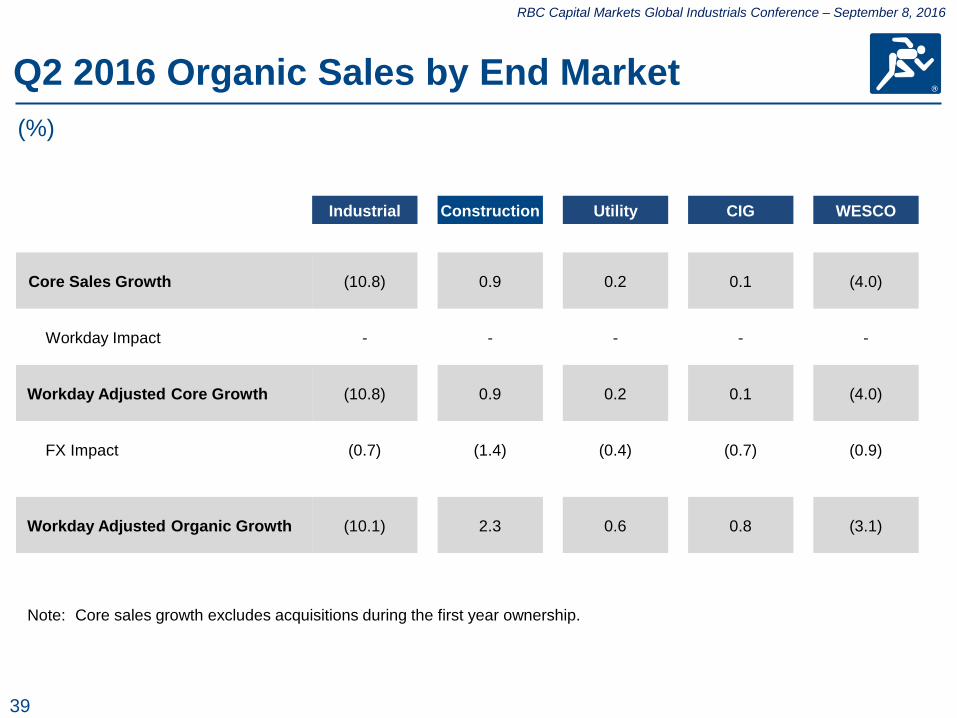
Q2 2016 Organic Sales by End Market
Industrial Construction Utility CIG WESCO
Core Sales Growth (10.8) 0.9 0.2 0.1 (4.0)
Workday Impact - - - - -
Workday Adjusted Core Growth (10.8) 0.9 0.2 0.1 (4.0)
FX Impact (0.7) (1.4) (0.4) (0.7) (0.9)
Workday Adjusted Organic Growth (10.1) 2.3 0.6 0.8 (3.1)
(%)
Note: Core sales growth excludes acquisitions during the first year ownership.
40
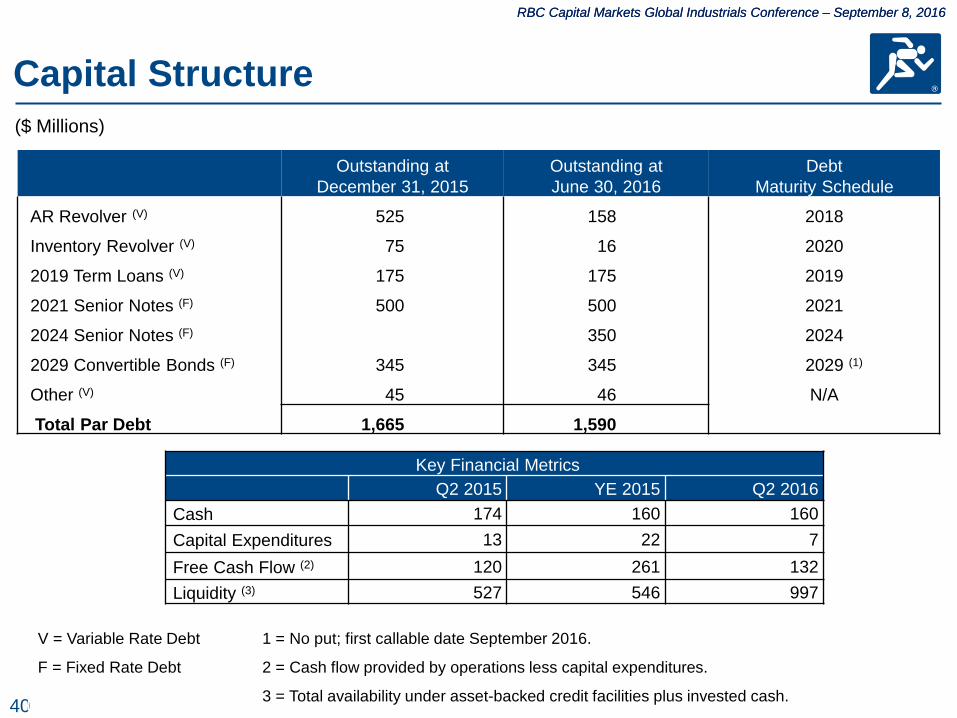
RBC Capital Markets Global Industrials Conference – September 8, 2016 RBC Capital Markets Global Industrials Conference – September 8, 2016
Outstanding at
December 31, 2015 Outstanding at June 30, 2016
Debt Maturity Schedule
AR Revolver (V) 525 158 2018
Inventory Revolver (V) 75 16 2020
2019 Term Loans (V) 175 175 2019
2021 Senior Notes (F) 500 500 2021
2024 Senior Notes (F) 350 2024
2029 Convertible Bonds (F) 345 345 2029 (1)
Other (V) 45 46 N/A
Total Par Debt 1,665 1,590
Capital Structure
Key Financial Metrics
Q2 2015 YE 2015 Q2 2016 Cash 174 160 160 Capital Expenditures 13 22 7 Free Cash Flow (2) 120 261 132 Liquidity (3) 527 546 997
($ Millions)
V = Variable Rate Debt 1 = No put; first callable date September 2016.
F = Fixed Rate Debt 2 = Cash flow provided by operations less capital expenditures.
3 = Total availability under asset-backed credit facilities plus invested cash.
41
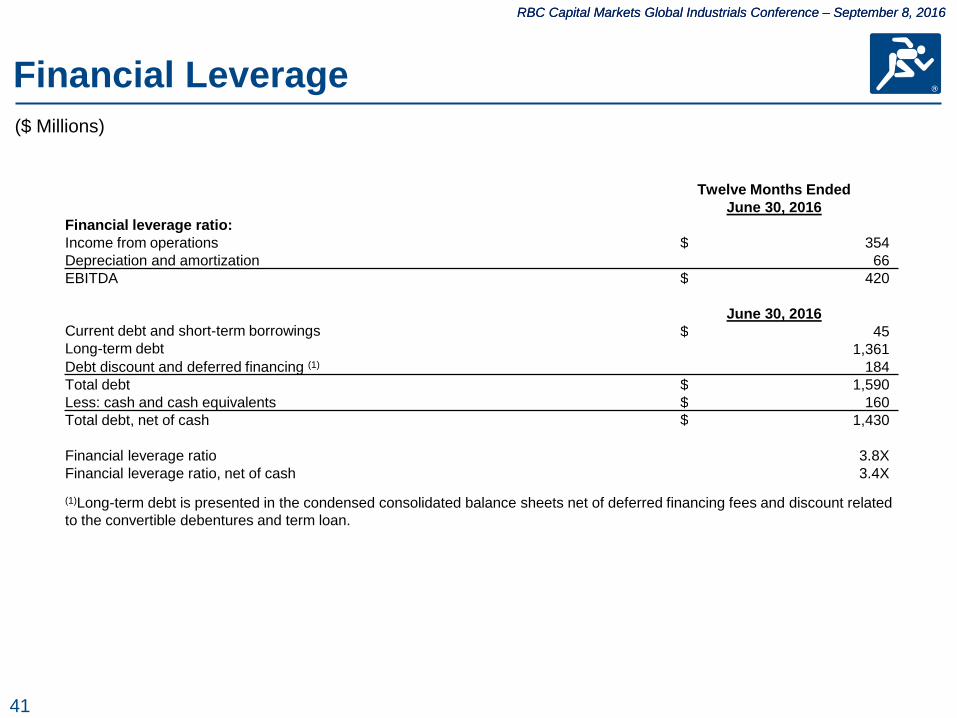
RBC Capital Markets Global Industrials Conference – September 8, 2016 RBC Capital Markets Global Industrials Conference – September 8, 2016
Financial Leverage
Twelve Months Ended June 30, 2016
Financial leverage ratio: Income from operations $ 354 Depreciation and amortization 66 EBITDA $ 420
June 30, 2016 Current debt and short-term borrowings $ 45 Long-term debt 1,361 Debt discount and deferred financing (1) 184 Total debt $ 1,590 Less: cash and cash equivalents $ 160 Total debt, net of cash $ 1,430
Financial leverage ratio 3.8X Financial leverage ratio, net of cash 3.4X
(1)Long-term debt is presented in the condensed consolidated balance sheets net of deferred financing fees and discount related to the convertible debentures and term loan.
($ Millions)
42
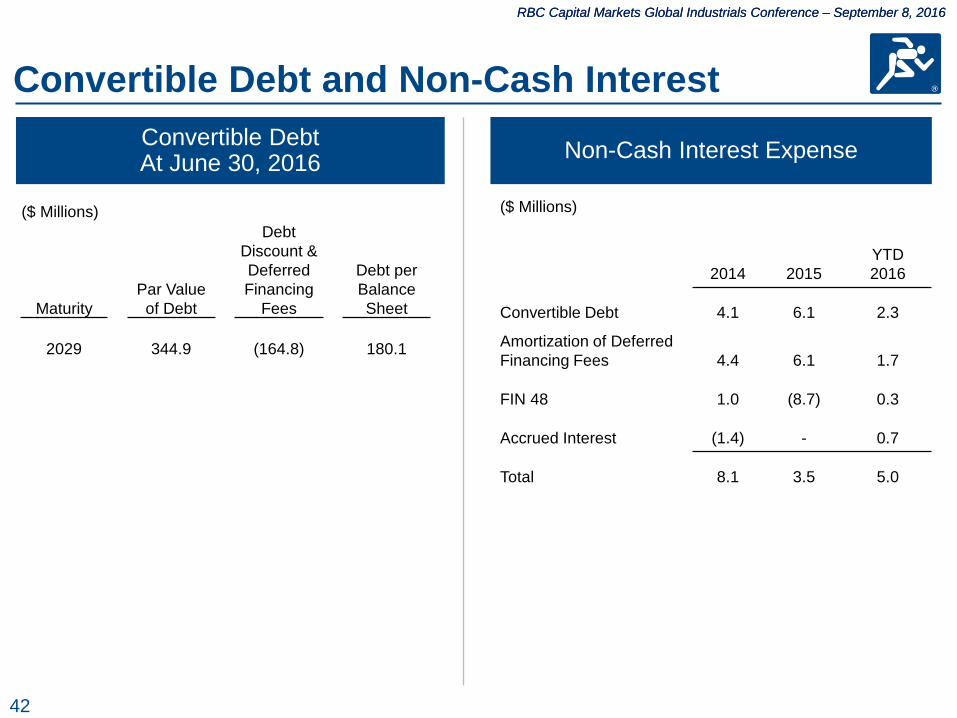
RBC Capital Markets Global Industrials Conference – September 8, 2016 RBC Capital Markets Global Industrials Conference – September 8, 2016
($ Millions)
Maturity Par Value of Debt
Debt Discount & Deferred Financing
Fees
Debt per Balance Sheet
2029 344.9 (164.8) 180.1
Convertible Debt At June 30, 2016 Non-Cash Interest Expense
($ Millions)
2014 2015 YTD 2016
Convertible Debt 4.1 6.1 2.3
Amortization of Deferred Financing Fees 4.4 6.1 1.7
FIN 48 1.0 (8.7) 0.3
Accrued Interest (1.4) - 0.7
Total 8.1 3.5 5.0
Convertible Debt and Non-Cash Interest

43
RBC Capital Markets Global Industrials Conference – September 8, 2016 RBC Capital Markets Global Industrials Conference – September 8, 2016
EPS Dilution
Weighted Average Quarterly Share Count
Stock Price Incremental Shares from 2029 Convertible Debt
(in millions)3
Incremental Shares from Equity Awards
(in millions)
Total Diluted Share Count (in millions)4
$30.00 0.45 0.16 42.85
$40.00 3.33 0.32 45.88
50.00 5.05 0.48 47.77
Q2 2016 Average $56.29 5.82 0.57 48.63
$60.00 6.20 0.63 49.07
$70.00 7.02 0.89 50.15
$80.00 7.64 1.08 50.95
2029 Convertible Debt Details
Conversion Price $28.8656
Conversion Rate 34.6433 1
Underlying Shares 11,947,533 2
Footnotes: 2029 Convertible Debenture 1 1000/28.8656 2 $344.9 million/1,000 x 34.6433
3 (Underlying Shares x Avg. Quarterly Stock Price) minus $344.9 million Avg. Quarterly Stock Price
4 Basic Share Count of 42.2 million shares
44
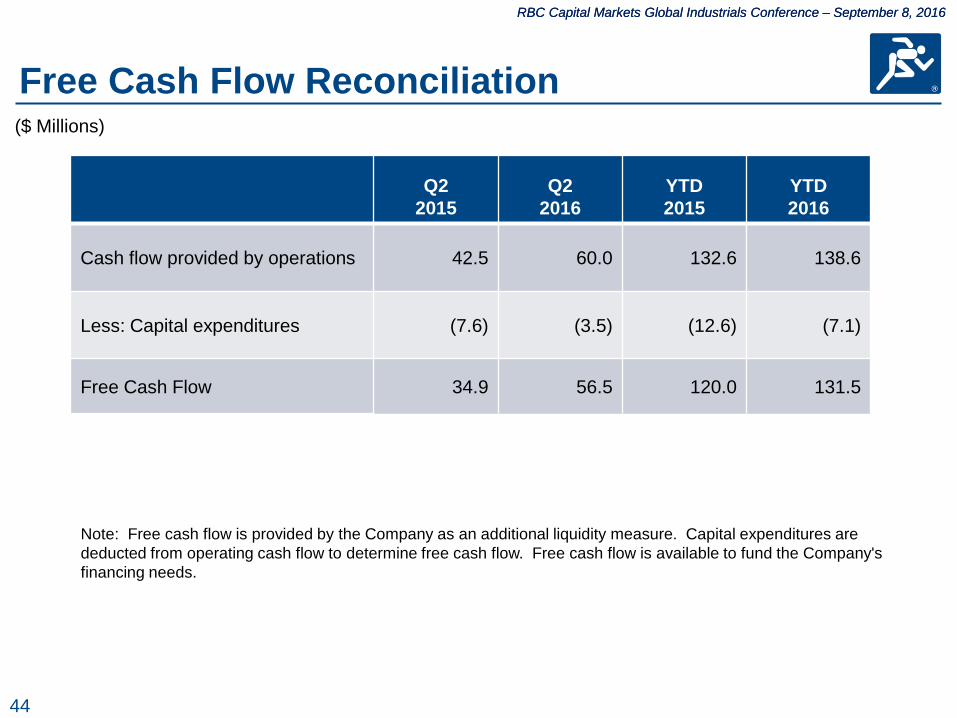
RBC Capital Markets Global Industrials Conference – September 8, 2016 RBC Capital Markets Global Industrials Conference – September 8, 2016
Free Cash Flow Reconciliation
Q2 2015
Q2 2016
YTD 2015
YTD 2016
Cash flow provided by operations 42.5 60.0 132.6 138.6
Less: Capital expenditures (7.6) (3.5) (12.6) (7.1)
Free Cash Flow 34.9 56.5 120.0 131.5
Note: Free cash flow is provided by the Company as an additional liquidity measure. Capital expenditures are deducted from operating cash flow to determine free cash flow. Free cash flow is available to fund the Company's financing needs.
($ Millions)

45
RBC Capital Markets Global Industrials Conference – September 8, 2016 RBC Capital Markets Global Industrials Conference – September 8, 2016
Work Days
Q1
Q2 Q3 Q4 FY
2014 63 64 64 62 253
2015 62 64 64 63 253
2016 64 64 64 62 254
46
RBC Capital Markets Global Industrials Conference – September 8, 2016 RBC Capital Markets Global Industrials Conference – September 8, 2016
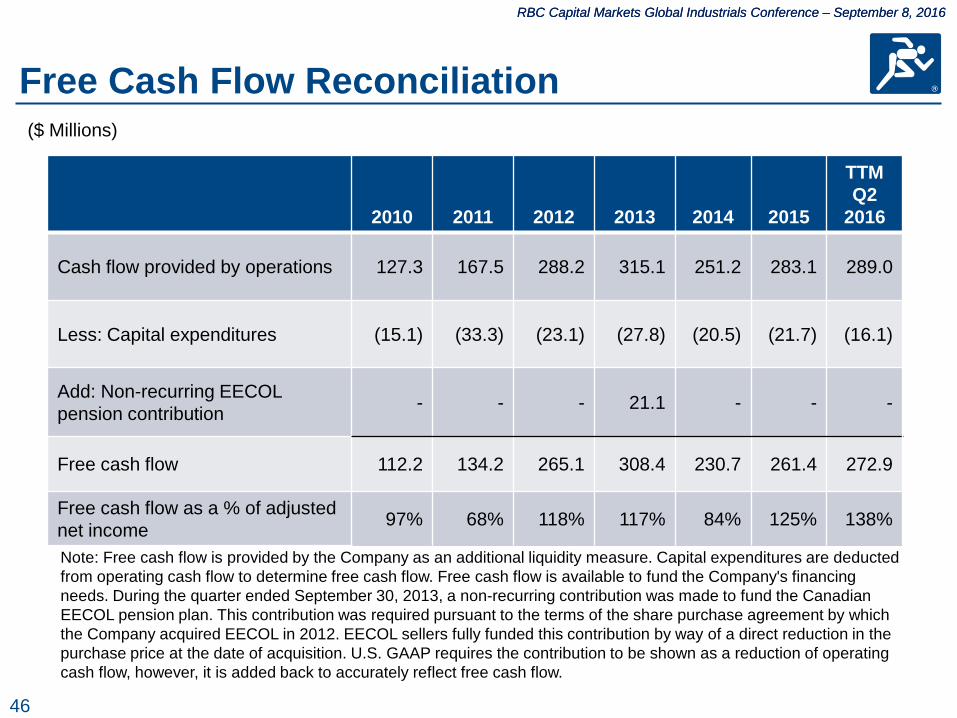
Free Cash Flow Reconciliation ($ Millions)
2010 2011 2012 2013 2014 2015
TTM Q2
2016
Cash flow provided by operations 127.3 167.5 288.2 315.1 251.2 283.1 289.0
Less: Capital expenditures (15.1) (33.3) (23.1) (27.8) (20.5) (21.7) (16.1)
Add: Non-recurring EECOL pension contribution - - - 21.1 - - -
Free cash flow 112.2 134.2 265.1 308.4 230.7 261.4 272.9
Free cash flow as a % of adjusted net income 97% 68% 118% 117% 84% 125% 138%
Note: Free cash flow is provided by the Company as an additional liquidity measure. Capital expenditures are deducted from operating cash flow to determine free cash flow. Free cash flow is available to fund the Company's financing needs. During the quarter ended September 30, 2013, a non-recurring contribution was made to fund the Canadian EECOL pension plan. This contribution was required pursuant to the terms of the share purchase agreement by which the Company acquired EECOL in 2012. EECOL sellers fully funded this contribution by way of a direct reduction in the purchase price at the date of acquisition. U.S. GAAP requires the contribution to be shown as a reduction of operating cash flow, however, it is added back to accurately reflect free cash flow.
47
RBC Capital Markets Global Industrials Conference – September 8, 2016 RBC Capital Markets Global Industrials Conference – September 8, 2016
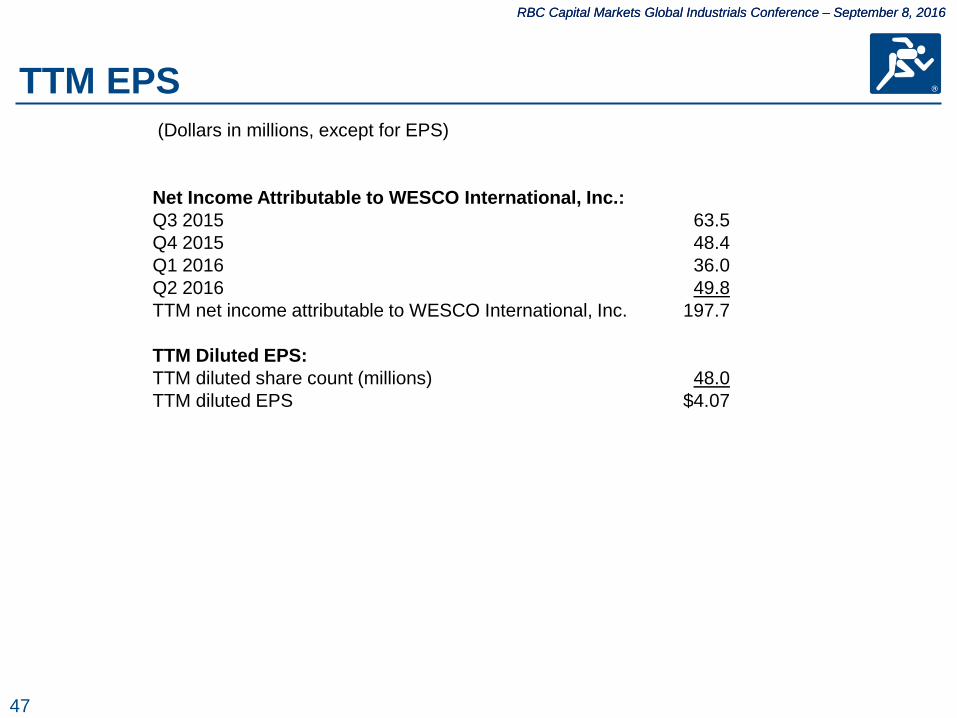
(Dollars in millions, except for EPS)
Net Income Attributable to WESCO International, Inc.: Q3 2015 63.5 Q4 2015 48.4 Q1 2016 36.0 Q2 2016 49.8 TTM net income attributable to WESCO International, Inc. 197.7
TTM Diluted EPS: TTM diluted share count (millions) 48.0 TTM diluted EPS $4.07
TTM EPS
48
RBC Capital Markets Global Industrials Conference – September 8, 2016 RBC Capital Markets Global Industrials Conference – September 8, 2016
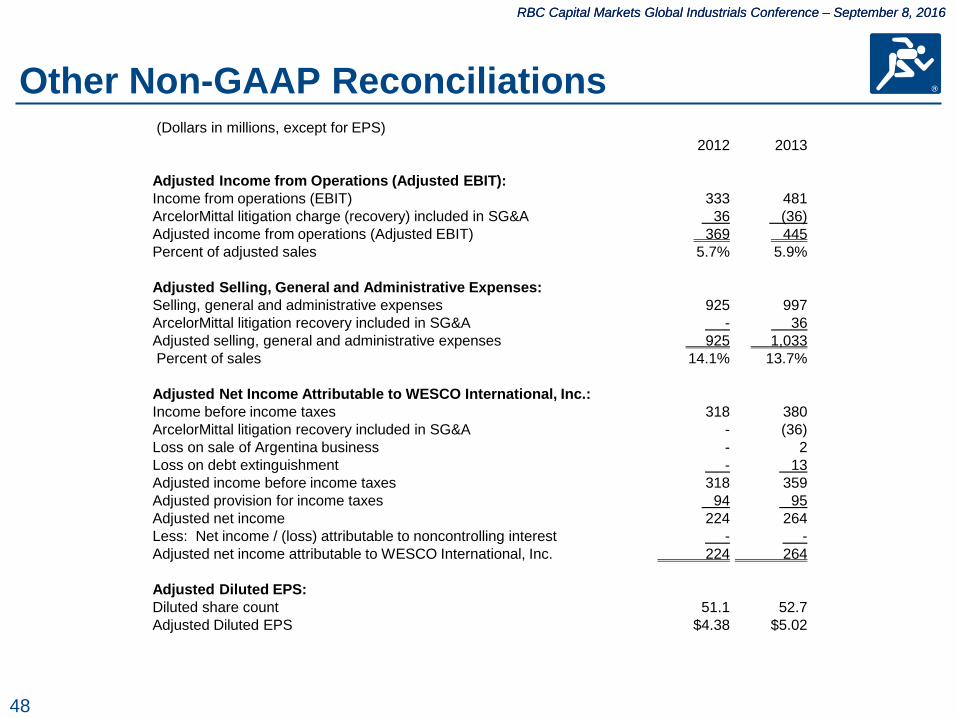
(Dollars in millions, except for EPS) 2012 2013
Adjusted Income from Operations (Adjusted EBIT): Income from operations (EBIT) 333 481 ArcelorMittal litigation charge (recovery) included in SG&A 36 (36) Adjusted income from operations (Adjusted EBIT) 369 445 Percent of adjusted sales 5.7% 5.9%
Adjusted Selling, General and Administrative Expenses: Selling, general and administrative expenses 925 997 ArcelorMittal litigation recovery included in SG&A - 36 Adjusted selling, general and administrative expenses 925 1,033 Percent of sales 14.1% 13.7%
Adjusted Net Income Attributable to WESCO International, Inc.: Income before income taxes 318 380 ArcelorMittal litigation recovery included in SG&A - (36) Loss on sale of Argentina business - 2 Loss on debt extinguishment - 13 Adjusted income before income taxes 318 359 Adjusted provision for income taxes 94 95 Adjusted net income 224 264 Less: Net income / (loss) attributable to noncontrolling interest - - Adjusted net income attributable to WESCO International, Inc. 224 264
Adjusted Diluted EPS: Diluted share count 51.1 52.7 Adjusted Diluted EPS $4.38 $5.02
Other Non-GAAP Reconciliations