welfare targeting and work incentives - esri · welfare targeting and work incentives michael...
TRANSCRIPT

Welfare Targeting and Work Incentives
Michael Savage, Tim Callan Claire Keane, Elish Kelly John R. Walsh
June 2014
BUDGET PERSPECTIVES 2015PAPER 3


Welfare Targeting and Work Incentives M. Savage, T. Callan, C. Keane, E. Kelly, J.R. Walsh
BUDGET PERSPECTIVES 2015 PAPER 3
June 2014
Available to download from www.esri.ie © The Economic and Social Research Institute Whitaker Square, Sir John Rogerson’s Quay, Dublin 2

The ESRI
The Economic Research Institute was founded in Dublin in 1960, with the assistance of a grant from
the Ford Foundation of New York. In 1966 the remit of the Institute was expanded to include social
research, resulting in the Institute being renamed The Economic and Social Research Institute (ESRI).
In 2010 the Institute entered into a strategic research alliance with Trinity College Dublin, while
retaining its status as an independent research institute.
The ESRI is governed by an independent Council which acts as the board of the Institute with
responsibility for guaranteeing its independence and integrity. The Institute’s research strategy is
determined by the Council in association with the Director and staff. The research agenda seeks to
contribute to three overarching and interconnected goals, namely, economic growth, social progress
and environmental sustainability. The Institute’s research is disseminated through international and
national peer reviewed journals and books, in reports and books published directly by the Institute
itself and in the Institute’s working paper series. Researchers are responsible for the accuracy of
their research. All ESRI books and reports are peer reviewed and these publications and the ESRI’s
working papers can be downloaded from the ESRI website at www.esri.ie
The Institute’s research is funded from a variety of sources including: an annual grant-in-aid from the
Irish Government; competitive research grants (both Irish and international); support for agreed
programmes from government departments/agencies and commissioned research projects from
public sector bodies. Sponsorship of the Institute’s activities by Irish business and membership
subscriptions provide a minor source of additional income.

The Authors
Michael Savage is a Research Analyst, Tim Callan is a Research Professor, Claire Keane and Elish Kelly are Research Officers and John R. Walsh is a Senior Research Analyst at the Economic and Social Research (ESRI).
The paper has been accepted for publication by the Institute, which does not itself take institutional policy positions. The authors are solely responsible for the content and the views expressed.
Acknowledgements
Helpful comments were received from two referees, and from our colleagues Frances Ruane, Emer Smyth, Helen Russell, Bertrand Maitre and Dorothy Watson. We are grateful to Regina Moore, Deirdre Whitaker and Donnacha Ó Súilleabháin for their excellent work on print preparation. The usual disclaimer applies.


Table of Contents
Abstract ....................................................................................................................................... 1
1. Introduction ......................................................................................................................... 2
2. Measuring Financial Incentives to Work ................................................................................ 3
2.1 Replacement rates: Meaning and Measurement ................................................................................. 3
2.2 Estimating Wages for the Unemployed ................................................................................................ 5
2.3 Unemployment and Wage Scarring ...................................................................................................... 6
2.4 Estimating Unemployment Compensation for Employees ................................................................... 9
2.5 Data and the Microsimulation Model ................................................................................................. 10
3. Distribution of Replacement Rates ...................................................................................... 11
3.1 Sensitivity Tests: Wage Scarring and In-Work Costs ........................................................................... 14
4. Profiling Replacement Rates ............................................................................................... 16
5. Which Aspects of Policy Contribute Most to High Replacement Rates? ................................ 19
6. Behavioural Responses to Replacement Rates ..................................................................... 23
7. Conclusions ........................................................................................................................ 24
Bibliography .............................................................................................................................. 26


Welfare Targeting and Work Incentives
Abstract
Tax and welfare policies must strike a balance between providing income support to those in need and maintaining a financial incentive to work. This paper focuses mainly on the latter objective, identifying the financial incentive to work as measured by the replacement rate – the ratio of out-of-work income to in-work income. While a high ratio is positive in terms of the income support function, it reduces the financial gain from employment. The analysis shows that high replacement rates tend to be found for individuals who receive payments in respect of adults or children who are financially dependant on a jobseeker. However, most of Ireland’s unemployed individuals are single or do not receive additional payments in respect of adults or children. The proportion of non-workers facing high replacement rates is similar to that in the UK. The Irish Rent Supplement scheme is one factor leading to more very high replacement rates than the UK’s Housing Benefit. Monitoring the impact of the shift to a new Housing Assistance Payment will be important in this context.
.
1
1. INTRODUCTION
A recent IMF report on fiscal policy and economic inequality stressed that “Both tax and expenditure policies need to be carefully designed to balance distributional and efficiency objectives, including during fiscal consolidation” (IMF, 2014). Striking this balance requires information both on the extent to which income support objectives are being met, and on the implications of taxes and benefits for the financial incentive to work. For advanced economies, the IMF report indicates that means-testing, with a gradual phasing out of benefits as incomes rise, is one of the options helping to minimise the adverse impact on the financial incentive to work. In this paper we explore the financial incentives to work associated with the Irish tax and welfare systems – including many means-tested elements. Our analysis takes account of the great diversity in circumstances (wage rates, marital status, number of children, housing tenure) among the population by using SWITCH, the ESRI tax benefit model which is based on data from the Survey of Income and Living Conditions (CSO, 2011).
We focus in particular on the incentive to take up (or remain in) employment – often termed the “extensive margin” in labour supply analysis. The most commonly used measure of the financial incentive to be employed is the replacement rate – the ratio of out-of-work income to in-work income.1 Decisions on how many hours to work, for those who are in employment – the “intensive margin” – are influenced by the marginal effective tax rate. This was examined in our paper to last year’s conference (Callan et al., 2013), and is also the subject of ongoing work.
The paper is structured as follows. The measures, data and methods used are set out in Section 2. Section 3 examines the incidence of high replacement rates, including some comparisons with the UK, and tests of the sensitivity of the results to alternative predictions of wage rates for the unemployed and the inclusion of in-work costs. Section 4 identifies the characteristics of individuals and families which are associated with high or very high replacement rates. Section 5 then identifies the policy features which tend to contribute towards individuals facing high replacement rates. Section 6 reviews international evidence on the extent to which replacement rates, and some other aspects of welfare systems – such as activation requirements – influence labour supply decisions. The main conclusions and some issues for further research are drawn together in the final section.
1 Adam and Browne (2013), comparing the replacement rate [RR] with an alternative “participation tax rate” [PTR] state that “Arguably, the RR is a better measure of the financial incentive to be in work, while the PTR is a better measure of how far the tax and benefit system weakens the financial incentive to be in work”.
2

2. MEASURING FINANCIAL INCENTIVES TO WORK2
2.1 Replacement rates: Meaning and Measurement
The replacement rate is the most commonly used single measure of the incentive to be in work. It measures the proportion of in-work income which would be retained or replaced (e.g., by jobseeker payments) when out of work. For example, an individual might find that his or her family income when unemployed is €180 per week, but that on taking up a job that disposable income would rise to €300 per week. The replacement rate in this situation would be 60 per cent. Replacement rates are in widespread use both in empirical studies and in theoretical models of the labour market. They are also widely used in policy debate, both nationally (e.g., NESC, 2011) and internationally (e.g., OECD, 2014). For all these reasons, it is the replacement rate measure which is the focus of the current study.
In looking at replacement rates it is essential to be aware of two different perspectives. From one perspective, the replacement rate provides a measure of the financial incentive to work – the lower the replacement rate, the greater the incentive to work, other things being equal. Looked at from the point of view of the income support goal, however, a higher replacement rate is seen as improving the level of support and degree of insurance afforded to those who become unemployed. Policy must be designed to strike a balance between these perspectives, in a context in which there is considerable variation both in needs (related to family size, for example) and in potential wages (which vary in response to factors such as productivity, skills and experience rather than needs). The need to balance the potential conflicts between the income support and work incentive goals means that careful monitoring of both the income support and work incentive outcomes is needed. The present paper contributes to this task.
How do replacement rates relate to the goal of “making work pay”?
• A replacement rate of 50 per cent means that moving into work would lead to a doubling of net family income.
• A replacement rate of 67 per cent means that an individual's net income would rise by 50 per cent when moving from unemployment or non-employment to employment.3
2 Parts of this section draw on the description of measurement methods in Callan et al. (2012). 3 For example, if in-work income were €300 and out-of-work income €200 per week, then moving into work would raise
income by €100 or 50 per cent of the out-of-work income.
3

• A replacement rate of more than 100 per cent or more means that the individual would lose net income when moving from unemployment to employment.
There are two broad approaches to the use of replacement rates in monitoring financial incentives to work. One is based on spreadsheet analysis for a set of example households. While useful in identifying some aspects of incentives, the fundamental difficulty with this approach is that it cannot arrive at a nationally representative picture (See Callan et al., 2012, for further details). The alternative approach is to start with a nationally representative survey, and use a tax-benefit model to simulate in-work incomes for the unemployed, and out-of-work incomes for those who are employed. While the OECD have made extensive use of the first approach, OECD (2013) states that “Welfare and tax adjustments should be made based on micro-based evidence that identifies particular groups where the disincentive to work is high. “For example, such evidence (Callan et al., 2012) suggests that” ...around 8 per cent of the unemployed face a replacement rate of over 100 per cent, often due to the receipt of housing related benefits that are available when in unemployment but rarely when in employment.” This paper builds on Callan et al. (2012) to provide improved identification of groups with high disincentives based on a tax-benefit model analysis of nationally representative survey data (the Survey on Income and Living Conditions, CSO’, 2011).
In this paper we examine the financial work incentives facing single persons couples,4 and lone parents, taking account of the ways in which tax and welfare entitlements are affected by the number and ages of dependent children. For a single person who is unemployed or not at work, we simulate the welfare payments received when not in work, and the resulting net income.5 This is compared with an estimate of the net income they would obtain if they were employed – something which depends on the wage they are likely to be able to obtain in the labour market. Potential wages are influenced by such factors as educational qualifications and age or experience. For example, other things being equal, someone with a university degree is likely to obtain a higher wage than someone whose highest qualification is a Junior Certificate – further details of the wage estimation procedure used are given in Section 2.2.
4 The small numbers of cohabiting couples in the SILC survey mean that it is not possible to report separately on this group; however, they are included in the model.
5 This includes housing-related payments such as Rent or Mortgage Supplement. It does not include the value of medical card or GP services card, but work is now under way on this topic.
4

We examine the incentives facing both partners in a couple, taking each person in turn. When examining incentives facing one spouse, we hold the labour market participation of the partner constant. In so doing, we take into account the overall impact of the change on family income. A narrow focus on the individual's own disposable income6 would fail to take account of the possible impact of an individual's taking up employment on the social welfare entitlements and/or income tax liabilities of his or her spouse or partner. Adult children are regarded as separate decision making units, but the impact of the household means test ("benefit and privilege") applying to young adults living with their parents is taken into account, as are the new, lower rates of payment for Jobseeker's Allowance for those aged under 25.
2.2 Estimating Wages for the Unemployed
For people who are not currently in paid work,7 a key issue is how much they could expect to earn if they were employed.8 The broad approach used here is in line with empirical studies of labour supply, which use a predicted wage taking into account wage-relevant individual characteristics. For example, this is the approach used in Adam et al. (2010) and in the Mirrlees Review (Mirrlees et al., 2011) – now a major landmark in tax policy analysis. This is the concept used in our microsimulation approach (following earlier work by Callan et al., 1996) and in Adam et al. (2006) and Adam and Browne (2010). The key point is that jobseekers vary in the wage that they can reasonably expect to attain in the labour market, and that a method which allows for this is more realistic than a "one wage fits all" approach.
In earlier work (Callan et al., 2012) used a particular technique – a selection corrected regression or Heckman correction – to take account of the fact that there might be differences in unmeasured characteristics of unemployed and employed populations (over and above age, education etc.) which would affect the wages which could be commanded. Here, we use an alternative approach which seems better able to capture the key features.9
In this section we summarise the main features of the estimated results: details are provided in an Appendix to this paper. Wage equations are estimated
6 Disposable income is cash income from all sources – including wages and salaries, profits, pensions, interest, dividends and welfare payments – net of taxes, levies and social insurance contributions.
7 This includes those who are unemployed – whether or not they receive any jobseeker payment – and those who classify themselves as not in the paid labour market.
8 The focus here is on the wage which could be expected in the short run. Individual’s decisions regarding employment will also be influenced by the likely time path of earnings arising from taking up employment.
9 We are grateful to an anonymous referee for helpful suggestions on these issues.
5

separately for four categories: single women, single men, married women and married men. This approach allows not only for gender differences in pay, but also for the very widespread finding that there is a “wage premium” attached to marriage for men, and, commonly though not universally, a “wage penalty” attached to marriage for women. (The sources and interpretation of such premia are discussed in Pollmann-Schult, 2011).
An alternative would be to limit such wage premia/penalties to an impact on the constant term in the wage equation. However, a statistical test10 indicates that the interaction variables contribute significantly to explaining the variation in wages across individuals. Thus, their inclusion in the wage prediction procedure is warranted on statistical grounds.
The key variables used to predict hourly wages are age (and its square, to allow for a positive but decreasing impact) and five levels of educational qualification (none beyond primary is the base case, followed by Junior Certificate or equivalent, Leaving Certificate, non-degree third level, and third-level degree or higher). The minimum wage for those under 18 years of age, which at €6.06 is 30 per cent below the general minimum wage, is used as a floor for predicted wages.11 Weekly earnings are generated on the basis of a job with a 40 hour week – this is the modal value reported by full-time workers in SILC 2010.12
2.3 Unemployment and Wage Scarring
There is substantial evidence that spells of unemployment, or spells out of the labour market, have, on average, a negative impact on the wages which can be commanded in the labour market. Here we review some of that evidence, and develop an approach to take account of it in predicting wages for those not in employment, based on data available in SILC.
Early investigations of the scarring impact of unemployment and wages were conducted by Arulampalam (2001) and Gregory and Jukes (2001). Arulampalam analysed the British Household Panel Study, and found evidence of a wage penalty which varied over time. She estimated that the average initial impact was a reduction of 6 per cent in wages, rising to 14 per cent about 3 years after returning to work, and then declining to about 11 per cent. Gregory and Jukes
10 Technically, the test is of the hypothesis that the additional variables do not contribute to explanatory power, and an F-test value of 1.77 (degrees of freedom (21,2817) is significant at the 5 per cent level. 11 We allow for the fact that wages cannot be perfectly predicted – an error term, drawn from the normal distribution, is
added to the predictions to ensure that the "spread" of predicted wages is in line with what is indicated by the estimated wage equation.
12 An analysis of incentives facing those interested in part-time work, or in moving from part-time to full-time work, has also been undertaken, and will be reported in subsequent papers.
6
identified two effects using linked administrative data: an impact from having a spell of any length, and an impact from the duration of the spell. A short spell could have a 10 per cent impact in the short run, but a long-run penalty of 2 per cent. Spells of six months to a year could have long-run impacts of 5 to 10 per cent. Gregg and Tominey (2005) analysed the National Cohort Development Study, which surveyed the same individuals at ages 16, 23, 33 and 42. They found that the “scar” from early unemployment could be of the order of 13 to 21 per cent by age 42. But this wage penalty would be lower – close to 10 per cent – if the individual managed to avoid repeat exposure to unemployment.
Another approach to estimating the impact of spells out of the labour market (whether unemployed or out of the labour force) is to use information on individual work histories – which cover the entire period since first leaving education. A standard approach in the literature is to include variables for years worked and years not worked – along with the square of each of these variables to allow for the fact that the influence may not be linear. Typically international and Irish results find that there is a positive influence from years worked (negative for its square) and a negative coefficient attached to time out of the labour market (positive for its square). The most recent Irish data which supports this approach came from the Living in Ireland Surveys of 1994-2001. McGuinness et al. (2009) used the work history information in the Living in Ireland Surveys to find that an additional year out of the labour market or unemployed would, on average, reduce wages by between 3 and 4 per cent for women in all years examined (1994, 1997 and 2001) and for men in the years 1994 and 1997; however, a higher impact was found for men, of close to 6 per cent, in 2001.
Our approach in this paper is to estimate the relationship between wages and characteristics (age, education level, marital status, gender) for those who are in employment. We use Ordinary Least Squares (OLS) for this step. We then allow for a 10 per cent reduction in wages associated with a spell of unemployment or a spell out of the labour market. We examine the results of this procedure in Table 1, focusing in particular on how well wages predicted on this basis represent the actual wage of those who have been unemployed during the past year but have returned to work. We examine the impact of alternative reductions (5 per cent or 15 per cent) on the distribution of replacement rates in Section 3
7

TABLE 1 Estimating potential wages for the unemployed
Hourly wage band Actual Wage
Predicted Wage (OLS Minus 10 Per Cent) Actual Wage
Predicted Wage (OLS )
Employees with period of
Unemployment Employees without period of
unemployment (1) (2) (3) (4) % % % %
Under €10 18 29 12 16
€10 to €12.50 33 17 15 14
€12.50 to €15 17 13 17 12
€15 to €20 12 20 22 22
Over €20 19 21 34 36
Total 100 100 100 100
Source: CSO SILC 2010 and SWITCH.
Column (1) of Table 1 shows the distribution of wages actually obtained by those who had a spell of unemployment during the 12 months preceding the survey interview, but who had obtained a job by the time of that interview. It is clear that there is a wide spread of hourly wages. Predicted wages for the same individuals, using the OLS estimates, reduced by 10 per cent to take account of wage scarring, are also shown (Column (2)). These predicted wages substantially overestimate the proportion of individuals facing wages below €10 – i.e., overstate the incidence of very low pay – but come close to the correct proportion facing wages of under €12.50. At the other end of the wage distribution, about 1 in 5 of the relevant group (those with unemployment experience who have returned to employment) have a predicted wage (OLS minus 10 per cent) of more than €20 per hour – in line with what is observed.13
Corresponding patterns for the Heckman predictions are much further from the observed data for those who have returned to work from unemployment. These patterns suggest that a predicted wage based on OLS, minus 10 per cent to take account of wage scarring, come closer to representing the wages facing unemployed people than the Heckman approach previously used. Thus, it is the
13 The predicted wage underestimates the proportion in the €12.50 to €15 and overstates the proportion in the €15 to €20 hourly wage band. Predicted wages have about one-third of the group in the €12.50 to €20 band, as against 29 per cent for the observed wages.
8

OLS wage, minus 10 per cent, which will be used in the rest of this paper, unless otherwise specified.
For employees without any period of unemployment, actual wages and predicted wages – in this case OLS without any reduction, as there has been no unemployment – are reported in Columns (3) and (4). These confirm that the wage equation estimates broadly capture the key features of the distribution of wages, using a rather small number of predictor variables.
2.4 Estimating Unemployment Compensation for Employees
For those who are in employment, estimating a replacement rate requires a simulation of the income they would obtain if they were unemployed. The main issue to be decided here is whether the replacement rate should be calculated on the basis of an entitlement to Jobseeker's Benefit (JB), or to Jobseeker's Allowance (JA). The qualification conditions for Jobseeker's Benefit mean that not all of those in employment would qualify for it. Those who did qualify would receive it for a maximum of nine months, then transferring to the JA rate if they remained unemployed and satisfied the search for work criterion. In many instances, the payments received on JA and JB would be the same; but where differences occur, the rate on JB would be higher, meaning that some of those who are employed would have a higher replacement rate for up to 9 months, if the calculation were done in terms of an entitlement to JB. Two considerations point towards the use of the JA rate. First, if the in-work/out-of-work decision is thought of as a long-term one, then the JA rate would be the more relevant one. Second, much of the focus in recent debate (IMF, 2012; OECD, 2011) has been on long-term replacement rates. For these reasons, we focus here on calculations which are based on the JA rate.
It should be noted that only the replacement rates of those who are currently employed would be affected by an alternative treatment seeking to apply JB rates instead of JA rates. It would require a significant input of time to implement this in the SWITCH model. But we can, even at this stage, be clear on what the nature of the outcome would be. Changing this assumption would have no impact on replacement rates for those who are currently unemployed or not in the paid labour market. Shifting to allow JB where individuals qualify for it would make replacement rates for some employees somewhat higher – but the individuals concerned would still be in employment. So the JA assumption may lead to some understatement of the incidence of high replacement rates for employees.
9

2.5 Data and the Microsimulation Model
The underlying data are from the CSO’s Survey on Income and Living Conditions 2010. We focus here on the working age population, including also dependent children. The data are adjusted for growth (or decline) in average employee and self-employed incomes, and for changes in numbers in employment and unemployed, so as to represent the 2014 situation. Weighting factors have been estimated (using the CALMAR program, widely used by Central Statistics Offices and by EUROSTAT) to ensure good representation of the income tax base, and to improve an already very good representation of the social welfare client population. The adjustment methods are described in Keane et al. (2014).
We include some results for employees, and for persons who are classified with a labour force status of “home duties”. However, our main focus is on those who are
1. Unemployed;
2. in receipt of Jobseeker’s Benefit or Jobseeker’s Assistance;
3. and not engaged in paid employment.
The reason for focusing on the unemployed is straightforward: this is a group which is, by definition, seeking paid employment, so that the financial incentive issue is particularly relevant. Those who are not receiving a Jobseeker payment are typically facing a stronger incentive to take up employment than those who do receive a payment. Thus, in identifying high replacement rates it is helpful to focus on those who are in receipt of payment. The third condition – that the individual should not be engaged in part-time or casual-employment – arises from the fact that such individuals are in a position in which they “mix” benefit income and wages. The key issue for them is not so much the replacement rate, as the marginal effective tax rate on further earnings. This issue is being investigated separately.
Estimates from the SILC data suggest that close to 224,000 individuals match these criteria (unemployed, receiving a Jobseeker payment, not in paid work). This is substantially lower than the widely quoted headline number from the Live Register, currently close to 390,000. The difference between the two is explained by the following facts:
• The Live Register includes almost 80,000 individuals who are engaged in casual or part-time work, for whom marginal effective tax rates on additional earnings are a more appropriate measure of incentives than a replacement rate.
10
• About 35,000 individuals are on the Live Register because they are “claiming for credits” or otherwise not applying for payment.
• The LR also includes all those who claim a payment – but a substantial number of those claims do not succeed.
When these factors are taken into account, it seems that the SILC-based estimate covers about 90 per cent of the relevant population
3. DISTRIBUTION OF REPLACEMENT RATES
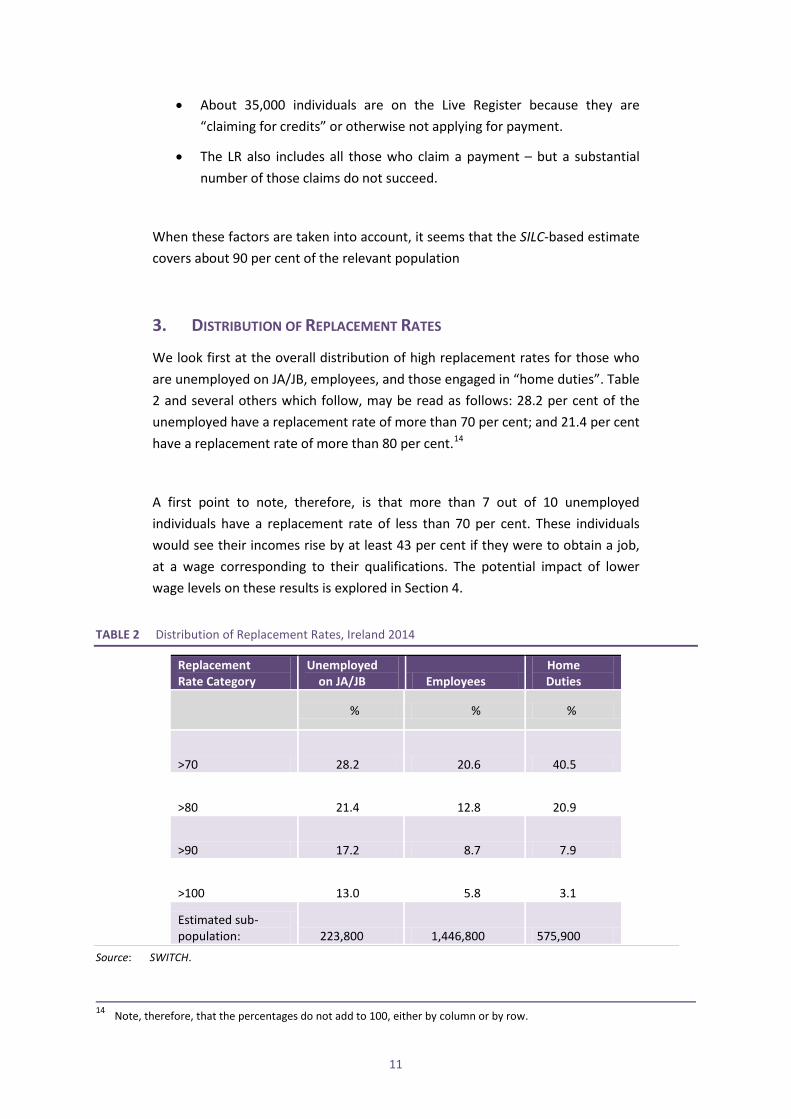
We look first at the overall distribution of high replacement rates for those who are unemployed on JA/JB, employees, and those engaged in “home duties”. Table 2 and several others which follow, may be read as follows: 28.2 per cent of the unemployed have a replacement rate of more than 70 per cent; and 21.4 per cent have a replacement rate of more than 80 per cent.14
A first point to note, therefore, is that more than 7 out of 10 unemployed individuals have a replacement rate of less than 70 per cent. These individuals would see their incomes rise by at least 43 per cent if they were to obtain a job, at a wage corresponding to their qualifications. The potential impact of lower wage levels on these results is explored in Section 4.
TABLE 2 Distribution of Replacement Rates, Ireland 2014
Replacement Rate Category
Unemployed on JA/JB Employees
Home Duties
% % %
>70 28.2 20.6 40.5
>80 21.4 12.8 20.9
>90 17.2 8.7 7.9
>100 13.0 5.8 3.1
Estimated sub-population: 223,800 1,446,800 575,900
Source: SWITCH.
14 Note, therefore, that the percentages do not add to 100, either by column or by row.
11

The “risk” of facing a high replacement rate (over 70 per cent) is greatest for those in home duties, next highest for the unemployed, and lowest for employees. The risk of facing very high replacement rates (over 90 per cent or 100 per cent) is highest for the unemployed. Given the relative sizes of these groups, however (1,450,000 employees as against 224,000 unemployed) most of those who are facing high or very high replacement rates are in fact in employment. For example, of those facing very high replacement rates (90 per cent or more) about 125,000 are employees (split evenly between full-time and part-time) while about 38,000 are unemployed.
If we are to understand the likely impact of very high replacement rates on those who are unemployed, we must also consider the situation of employees facing high replacement rates. Callan et al. (2012) point to some reasons why such individuals might choose to stay in employment, despite the fact that they could be financially better off if unemployed and claiming a jobseeker’s payment:
1. Replacement rates measure the financial gain from employment in static terms; but staying in work tends to lead to higher wages in future, so there are also dynamic gains which are not taken into account here or in other work on replacement rates.15
2. Individuals may choose to work in such circumstances for reasons such as self-respect, providing an example to their children, or the non-financial rewards from working life.
On the latter point, Gallie (2013) notes that “Many economists have been of the view that work is a disutility and consequently unemployment is likely to undermine the work ethic as people become habituated to a life of greater leisure. But a contrary argument is that unemployment will tend to reinforce employment commitment because people will become aware of benefits of employment which they previously took for granted – for instance the time structure it gives to their day, their status, and their ability to interact with other people on a regular basis”. Collectively, such items give a non-financial value to work. Empirically, Steiber (2013) examines “non-financial employment commitment”, which captures the value individuals attribute to the non-financial aspects of work. She finds, in a wide range of European countries, that the non-financial employment commitment of the unemployed is no less than that of employees, and sometimes significantly more – particularly in high unemployment countries.
15 Individuals may also take into account the build up of social insurance entitlements or pension rights.
12

Table 3 illustrates the sharp differences between replacement rates facing full-time and part-time employees. Part-time workers, with lower incomes because of their lower hours,16 are about 3 times more likely to face a high replacement rate (70 per cent plus) and about twice as likely to face a very high replacement rate.17
TABLE 3 Distribution of Replacement Rates for Full-time and Part-time Workers, Ireland 2014
All Employees
Full-time Employees
Part-time Employees
% % %
>70 20.6 12.2 40.7 >80 12.8 8.5 23.3 >90 8.7 6.3 14.4 >100 5.8 4.1 9.7 N 1,446,800 1,020,000 426,800
How do the overall results compare with recent findings for the UK? In order to undertake this comparison we must shift focus from the unemployed to those who are not at work – including those engaged in “home duties” as well as the unemployed. This is because figures for the UK are available for workers and non-workers, but not currently for the unemployed separately.18 Table 4 shows the results for non-workers in our analysis of Ireland for 2014,19 and for a UK analysis of the 2009-10 situation. Recently published results for the UK (Adam and Browne, 2013) do not allow a precise comparison, but suggest that changes in respect of these comparative figures from the earlier analysis are relatively small.
The proportion of non-workers facing high replacement rates (over 70 per cent and over 80 per cent) is very similar for the UK and for Ireland. However, the proportion facing very high replacement rates (over 90 or 100 per cent) is higher in Ireland. Callan et al. (2012) point to the structure of the Rent Supplement scheme as playing a major role in this outcome, and further results on this issue will be given in Section 5. These are based on nationally representative data for both countries, and on tax-benefit models which have been extensively tested. They take into account a key contrast: that housing benefits are received by a
16 There may also be an association with lower hourly wage rates, adjusting for characteristics – this has been found in the UK, but evidence for Ireland is more mixed.
17 Replacement rates for part-time workers are calculated on the basis of their actual hours of work. Part-time workers who are also in receipt of benefit are excluded from these calculations: the key issue here is the marginal effective tax rate on additional earnings, which is the subject of a separate study for the Advisory Group on Tax and Social Welfare.
18 The “non-worker” population in the UK is currently somewhat broader than that included in the Irish analysis; work is ongoing to extend the analysis to make it more comparable, but the present results are the best comparison that can currently be made.
19 The proportions facing high replacement rates are not directly comparable with those in Callan et al. (2012), as they are based on different wage prediction approaches – see Section 2. .
13

high proportion of the UK unemployed, and Rent Supplement by a low proportion of the Irish unemployed. These results suggest that a focus on the extent of very high replacement rates may be productive – UK experience indicates that the incidence of such rates can be lowered. Both IMF (2012) and OECD (2013) highlight the highest replacement rates –mostly associated with Rent Supplement – as requiring particular attention. Empirical evidence is quite limited as to whether responsiveness is likely to be greater for those with the highest replacement rates, or elsewhere in the replacement rate distribution. But the comparison with the UK does suggest that the incidence of the highest replacement rate can be lowered, and this would fit with a broader “make work pay” agenda. Thus in our analysis we maintain a focus on high and very high replacement rates.
TABLE 4 Distribution of Replacement Rates for Non-Workers, Ireland and UK
Replacement Rate Category
Ireland, 2014 UK, 2009-10
% %
>70 37.3 37.2
>80 20.4 20.0
>90 8.9 5.0
>100 4.3 2.2
Source: SWITCH.
3.1 Sensitivity Tests: Wage Scarring and In-Work Costs
Results so far have been based on a wage scarring effect of 10 per cent (a 10 per cent reduction on the OLS estimate of the wage). How much difference does it make if predicted wages were higher or lower than this? Here we explore the impact of reductions of 5 per cent and 15 per cent in estimated wages for the unemployed to span the scale of the impact found in empirical work. Table 5 shows that a 5 per cent reduction in wages would give rise to a reduction in the proportions with high and very high replacement rates of at most between 1½ and 2½ percentage points. A 15 per cent scarring effect would have a somewhat greater impact, with the proportions having replacement rates above 70 per cent close to 3 percentage points higher; while at the 100 per cent cut-off, the incidence would rise by about 1½ percentage points.
14

TABLE 5 Replacement Rate Distributions with Alternative Wage Predictions for Unemployed JA/JB Recipients, Ireland 2014
OLS OLS Minus 5%
OLS minus 10%
OLS minus 15%
Replacement Rate Category
% % % %
>70 25.7 27.1 28.2 31.0
>80 19.2 20.7 21.4 22.8
>90 15.8 16.0 17.2 17.6
>100 10.8 11.5 13.0 14.7
Source: SWITCH.
A further sensitivity test is reported in Table 6, which takes an income measure net of childcare costs and travel to work costs, as explained in Callan et al. (2012). There is a small rise in the incidence of high replacement rates for the unemployed (e.g., from 27 per cent to 29 per cent). This reflects the fact that most unemployed people do not have children. Results for employees do change, with the proportion having high replacement rates rising by 8 percentage points. A key point to remember here is that these individuals are in employment, notwithstanding the balance of immediate financial incentives. Even if the balance is unfavourable in the short term, remaining in the labour market to attain higher wages can make sense;20 expected reductions in childcare costs as children move into the school-going years may also play a role.
TABLE 6 Distribution of Replacement Rates including In-Work Costs, Ireland 2014
Replacement Rate Category
Unemployed on JA/JB Employees
(%) In-work Costs (%)
(%) In-work Costs (%)
>70 28.2 29.3 20.6 26.9
>80 21.4 24.7 12.8 15.7
>90 17.2 19.5 8.7 10.4
>100 13.0 14.9 5.8 7.2
Source: SWITCH.
20 In some jobs pay may rise automatically with job tenure through increments; in others, pay may rise as enhanced experience and productivity are recognised.
15

4. PROFILING REPLACEMENT RATES
Which groups are more likely to have high replacement rates? Here we look at a series of characteristics of individuals and families to identify what contributes to a higher risk of facing a high replacement rate. In the next section we identify the aspects of policy which contribute towards high replacement rates.
Table 7 presents results on the distribution of replacement rates for the unemployed group, for those who do and do not have children. There is a very sharp distinction between these groups, with a low risk for those without children (more than 150,000 individuals) and a very high risk for those who do have children (some 68,000 cases). About 60 per cent of the unemployed group who have children have a replacement rate above 70 per cent – this means some 43,000 individuals. Close to one-third of the “with children” group of unemployed face replacement rates of more than 100 per cent – this translates into some 22,000 of the overall unemployed population.
TABLE 7 Recipients of Jobseekers Benefit/Assistance With and Without Children, Ireland 2014
Replacement Rate Category
With Children
Without Children
With Children
Without Children
% % Numbers of individuals
>70% 64 13 43,300 19,900
>80% 51 8 34,800 13,000
>90% 40 7 27,100 11,300
>100% 32 5 21,700 7,400
Source: SWITCH.
What difference do work-related costs such as childcare and travel to work make to this picture? Including such costs, on the basis described earlier, would lead to an increase in the numbers facing high replacement rates (over 70 per cent) from 43,000 to just under 45,000. For those facing the highest replacement rates, the increase would be greater, from about 22,000 to just over 25,000. Given the size of childcare costs, this result may seem surprising. A key factor is that many of those facing high replacement rates are in receipt of a welfare payment in respect of a qualified adult – meaning that that adult is likely to be outside the labour market. In this situation, the spouse or partner is therefore very often available to undertake childcare, so that purchasing of childcare does not arise.
Next we consider to what extent high replacement rates are linked to wage levels. Table 8 shows results for unemployed people grouped into four equal
16

groups, based on a ranking of their wages from the lowest wage levels (Quartile 1 – close to the minimum wage) to the highest (Quartile 4). The risk of facing a high or very high replacement rate (over 70 per cent or over 90 per cent) is highest for the low wage group, and lowest for the high wage group.
TABLE 8 Distribution of Replacement Rates by Expected Hourly Earnings, Ireland 2014
Replacement Rate Category
Lowest Quartile (<€8.70)
Quartile 2 (<€13.16)
Quartile 3 (<€18)
Top Quartile (>€18)
% % % %
>70 38.4 32.8 25.8 16.1
>80 31.4 26.6 18.7 9.0
>90 28.5 20.7 12.4 7.4
>100 23.8 11.4 11.2 6.0
Source: SWITCH.
EU indicators have contributed to a focus on the incidence of “jobless households”: SILC data suggest that this is particularly high in Ireland (Watson et al., 2012). Joblessness, in this context, is not simply to do with unemployment. A jobless household is one in which less than one-fifth of the time of working-age adults is spent in work.21 Thus, single person households in which one individual is ill or disabled, or couples with one partner ill/disabled and the other in a caring role, would also be defined as jobless. Here, however, we focus on whether or not unemployed individuals are in jobless households, and on the incentives they face compared with unemployed individuals who are in “non-jobless” households.
Table 9 shows a strong contrast between unemployed individuals in jobless households and in non-jobless households. Unemployed individuals in jobless households are more than 2½ times more likely to face a high replacement rate (over 70 per cent) and 3½ times more likely to face a very high replacement rate (over 90 per cent).
21 Watson et al. (2012) use the term “jobless households” to refer to households where less than one-fifth of the available time of working age adults was spent in employment or self-employment during the previous year – this is what the EU term “very low work intensity” (VLWI). As the VLWI measure relates to amounts of work carried out in the previous year, this implies that the individual is in long-term unemployment or non-employment; however the converse is not true as individuals may be long-term unemployed without being in a workless household.
17

TABLE 9 Replacement rates facing unemployed in Jobless households, Ireland 2014
Replacement Rate Category
Jobless HHs Non-Jobless HHs
2014
% %
>70 39.6 16.5
>80 30.1 12.1
>90 24.7 9.1
>100 19.9 5.7
N of individuals 110,300 111,600
Source: SWITCH.
Why are high/very high replacement rates more common for recipients of Jobseeker payments in jobless households? One part of the explanation is that the very structure of the means tests and income tests in the social welfare system is designed to focus greater payments on those who have lowest incomes. For example, an individual who is married to another unemployed person, or to someone engaged in home duties, may receive the maximum rate of Jobseeker’s Benefit or Assistance, along with increases in respect of a qualified adult and qualified children. An individual married to an employed individual, on the other hand, will typically receive a lower payment which does not include additions in respect of an adult partner or children – and for Jobseeker’s Assistance, the amount of the personal payment may also be reduced.
A further issue meriting additional investigation is the extent to which these higher replacement rates influence decisions. One possibility is that unemployed persons may respond to the incentives faced by reducing job search intensity and/or rejecting job offers which do not provide a sufficient margin over and above the income available from welfare. On the other hand, even if there is no behavioural response, the structure of the social welfare system ensures that a significant gap will be seen between the replacement rates faced by Jobseeker recipients in jobless and non-jobless households. The key issue here is the extent of behavioural responses. Section 6 reviews the available evidence on the issue of behavioural response to the welfare systems – including replacement rates, and measures such as activation or controls. Of necessity, this review draws largely on the international literature.
The final aspect examined in this section is the distribution of replacement rates facing lone parents who are not in employment. About a third of lone parents not
18

in employment face high replacement rates – somewhat more than for the unemployed. But the situation is reversed when it comes to very high replacement rates, which are faced by fewer lone parents than unemployed. A key feature here is that the means test in the One-Parent Family Payment has been more favourable to the combination of work and welfare income than the means test under the Jobseeker’s Assistance scheme.
TABLE 10 Distribution of Replacement Rates for Lone Parents not in Employment, 2014
Replacement Rate Category % of Lone Parents
>70 33.5
>80 17.7
>90 6.2
>100 0.9
N of cases 46,352 Source: SWITCH.
As of 2011, the OPFP scheme allowed for a disregard of €147 per week before any reduction in benefit, and then withdrew benefit on the basis of a 50 per cent taper rate (i.e., withdrawing 50 cent of benefit for every additional €1 of earnings over and above the disregard). The disregard is, however, on a downward path. It is currently (2014) set at €90 per week, but is set to fall in steps to €60 in 2016 – the same level as the disregard in the Jobseeker’s Assistance scheme. A full assessment of the impact of the recent and prospective changes in the One-Parent Family Scheme is outside the scope of the present paper. However, careful monitoring of the incentives facing this group is warranted, given the significant shift in policy, the fact that childcare costs are especially relevant for this group, and international evidence that the labour supply of lone parents tends to be more responsive than that of other groups.22
5. WHICH ASPECTS OF POLICY CONTRIBUTE MOST TO HIGH
REPLACEMENT RATES?
In this section we try to identify which aspects of policy contribute most to the incidence of high or very high replacement rates. It must be stressed that this is a technical exercise, aimed at improving the diagnosis of problem areas, rather than a prescription or set of policy recommendations. We simply isolate different aspects of the welfare system to see the extent to which they contribute to the prevalence of high replacement rates.
22 The survey by Meghir and Phillips (2010) reports “a strong consensus in the literature that the participation elasticity for lone mothers is among the highest of all demographic groups”.
19

Table 11 below first repeats the basic distribution of replacement rates for the unemployed in 2014. Subsequent columns then examine three equal-valued reductions in welfare payments focused on:
a) personal rates of payment;
b) reduction of the increase for a qualified child (IQC, formerly known as Child Dependant Additions);
c) reduction in the Increase for a Qualified Adult (IQA, formerly known as Qualified Adult Addition or Adult Dependant Addition).
Again, it must be stressed that these are not proposals for policy changes – they are simply a technical device to identify the contribution each of these elements makes to the extent of high replacement rates. The changes are scaled so that the cost is approximately the same in each case. We find that the cost of child dependant additions (IQCs) is similar to the savings which would arise from a 30 per cent reduction in personal rates of payment, or a 45 per cent reduction in the Increase for a Qualified Adult (IQA).
TABLE 11 Impact of Alternative Equal-Valued Reductions in Jobseeker Payments on Replacement Rates
RR Category
2014 30% Reduction in JA/JB
Personal Rate
2014 (No Child Increase)
2014 (Increase for a Qualified Adult
reduced by 45%) >70 28.2 24.2 25.2 23.9
>80 21.4 19.5 18.7 18.0
>90 17.2 15.3 13.4 11.6
>100 13.0 10.1 9.8 7.9
Source: SWITCH.
Table 11 shows that a 30 per cent reduction in the personal rate of Jobseeker payments would have quite a limited impact on the extent of high replacement rates – a reduction of 2 to 3 percentage points in most cases. This is not surprising, when one recalls that the unemployed population is largely single and without children, with many young and not receiving the full adult rate of payment. Thus, a reduction in the personal rate of payment would tend to reduce the payment in respect of many people who had low or moderate replacement rates.
A system without child dependant additions would have a broadly similar impact (2 to 3 point reduction) but with a greater impact on the highest replacement
20

rates (5 percentage point reduction on replacement rates above 100 per cent). There are, however, stronger impacts from a reduction in IQA payments, with reductions in the risk of high or very high replacement rates of between 5 and 7 percentage points.
The counterpart to these results is, of course, that the income supports – whether through personal rates, IQAs or IQCs – play a role in the prevention of poverty. Table 12 shows how these equal valued reductions in welfare spending would affect commonly used measures of income poverty. The “at risk of poverty” measures are based on poverty lines at 60 per cent of median income, and are widely used in EU statistics. The head count ratio simply identifies the proportion of individuals in households with incomes below these poverty cut-offs. While widely used, the limitations of the head count measure are well known and it is often complemented by a “poverty gap” measure which takes account of the depth of poverty – how far below the income cut off the incomes of poor people are.
TABLE 12 Impact of Alternative Equal-Valued Reductions in Jobseeker Payments on the “at risk of poverty” Measure and Poverty Gap
“At risk of poverty” indicator
30% Reduction in JA/JB
Personal Rate
2014 (No Child Increase)
2014 (Increase for a Qualified Adult
reduced by 45%) % increase in poverty measure
Head count, All 3.7 5.2 1.3
Poverty gap, All 13.1 18.5 9.5
Head count, Children
-1.1 9.6 -0.1
Poverty gap, Children
9.1 33.4 8.6
The reductions in welfare spending have a limited impact on the head count of poverty – the greatest impact is from the abolition of IQCs on child poverty, which leads to a rise of 10 per cent. But there are much more substantial impacts on the poverty gap measure: reductions in personal rates lead to an increase in the poverty gap of 13 per cent, and elimination of IQCs to a rise of 19 per cent. This reflects the fact that a major part of the impact of these measures is on individuals and families who are already below the poverty line income. The impact of reductions in IQAs on the poverty gap and head count measure is more limited. These calculations are on a static basis, which does not take account of potential changes in labour supply or other behaviour.
21

Rent Supplement has already been identified23 as a component of the system which contributes to high replacement rates. “The highest replacement rates affect those also receiving housing benefits, resulting in unemployment and inactivity traps that lower exit rates from unemployment, making it especially important to reform the structure of social payments in this area.” (IMF, 2012). One of the key conditions governing eligibility for Rent Supplement is that the claimant must not be working more than 30 hours per week. Here again we seek to isolate the impact of this component by comparing results of the current system with a system without Rent Supplement. Once again, this is a technical device to isolate the impact rather than a policy proposal. Table 13 shows the results, with a reduction of 6 to 7 percentage points in the incidence at each replacement rate cut off.
TABLE 13 Impact of Rent Supplement on Replacement Rate Distribution, Ireland 2014
Replacement Rate Category
2014 2014 –No Rent or Mortgage Supplement
% %
>70 28.2 22.6
>80 21.4 16.0
>90 17.2 11.0
>100 13.0 6.9
Source: SWITCH.
Proposals for a Housing Assistance Payment, which would provide housing-related support in a more incentive-friendly fashion, are already being piloted. Research on incentive-related aspects of the design is also under way in a separate project.
23 Callan et al. (2007); Callan et al. (2012).
22

6. BEHAVIOURAL RESPONSES TO REPLACEMENT RATES
The size of unemployment benefits is often viewed as being an important determinant in unemployed peoples’ decision to work or remain unemployed. Howell and Rehm (2009) provide a review of micro studies that have examined the impact of unemployment payments on unemployment duration.24 We draw on this survey and a number of individual studies in attempting to assess the evidence on the extent of behavioural responses to high replacement rates.
Early studies on this issue included Lancaster and Nickell (1980) and Katz and Meyer (1990). They concluded that there was a strong association between benefit size and unemployment duration. However, the robustness of the relationship between benefits and unemployment duration, particularly the magnitude of the impact, was questioned by some during the 1990s (e.g., Atkinson and Micklewright, 1991; Holmlund, 1998). Nevertheless, in more recent times researchers have been able to exploit natural experiment-like policy changes in unemployment compensation in their analyses and have found a positive benefit effect on unemployment duration (e.g., Card and Levine, 2000; and Lalive and Zweimuller, 2004), with some researchers finding larger positive benefit effects for workers that are more loosely attached to the labour market (e.g., Cockx and Ries, 2004; Lalive, 2007; and van Ours and Vodopivec, 2008).
In summarising the findings from these studies, Howell and Rehm (2009) conclude that while recent micro research has found a positive association between unemployment benefits and duration, the magnitude of the impact is quite small. For example, accounting for policy endogeneity, Lalive and Zweimuller (2004) examined a major policy change introduced in certain regions in Austria which extended unemployment benefits from 30 weeks to a maximum of 209 weeks for older workers (aged 50 and over). This was found to be associated with an increase in unemployment duration of approximately 9 weeks. On this basis, a 30 day extension of unemployment benefits would lead to an increase in unemployment duration of 1.5 days. In a companion paper Lalive et al. (2006) find, using the same dataset, that an increase in the replacement rate of 6 percentage points is associated with an increase in unemployment duration of 0.38 weeks. Howell and Rehm (2009) believe that the modest results that have been found support the view that workers place a positive value on having a job over and above its benefit in terms of earning an income - a finding reinforced by the literature surveyed by Gallie (2013).
24 Some micro research has also examined the impact of unemployment benefits on post-unemployment outcomes, such as earnings, job quality, employment duration, etc. (e.g., Card et al., 2007; and Lalive, 2007).
23

In Ireland, research on this topic has been limited by the lack of suitable data i.e., data which is gathered for unemployed individuals and their households over a sustained period. Layte and Callan (2001) used data from the Living in Ireland panel study (1994-1998 waves) to analyse the impact of replacement rates on unemployment duration. They summarise their results as showing a significant impact of replacement rates on duration, but one which is very small by international standards. In addition, it is confined to those in receipt of Unemployment Benefit and is not identifiable for those in receipt of Unemployment Assistance. (They note that a similar finding – greater evidence of incentive effects among the short-term unemployed – is common internationally.) There is evidence, however, that exits from unemployment tended to increase as entitlement to UB came close to exhaustion (then at 15 months – the time limit is now 9 months).
7. CONCLUSIONS
Replacement rates (the ratio of out-of-work to in-work income) are widely used in economic studies and in policy debate to assess the financial incentive to work. This simple measure of the balance between income in-work and out-of-work provides a useful summary of the incentive to take up (or remain in) employment as against being unemployed or outside the labour force. The findings are based on a nationally representative sample – the CSO’s Survey on Income and Living Conditions – and on SWITCH, the ESRI tax-benefit model, which incorporates the effects of current tax and welfare policies. Thus the results given here provide the most comprehensive picture available of the pattern of incentives faced by real households.
For those who are not in employment, the proportions facing high replacement rates (70 per cent or more) are very similar in the UK and in Ireland. However, substantially more of the Irish non-workers face a very high replacement rate (over 90p per cent). The Irish results take account of the fact that the potential wages of unemployed people are subject to a “scarring” effect, leading to lower wages in future. The impact of including in-work costs on replacement rates is quite limited for those who are unemployed – largely because most of the unemployed are childless. Of those who are unemployed and married with children, many have have a partner who is in a position to undertake the necessary childcare. Childcare costs have a greater impact on the proportion of those in employment facing high replacement rates; but this means that these individuals are in employment, despite facing a high replacement rate.
24

Risk factors for high replacement rates include the receipt of payments for qualified adults and/or children, low wages, and/or being in a “jobless household”. The constrast between jobless and non-jobless households arises because of the targeted nature of income support – less support is given where there are other sources of income, and as a result, the impact of withdrawal of support is less severe. The policy factors contributing most strongly to the incidence of high replacement rates were identified by “policy experiments”, which are not to be thought of as recommendations. Reductions in personal rates of payment for Jobseeker’s schemes would have quite a limited impact on replacement rates, reflecting the fact that many of those on Jobseeker schemes are single, and facing replacement rates which are low or moderate.The key factors contributing to high replacement rates are Rent Supplement – which will be partially replaced by the new Housing Assistance Payment – and the Increase for a Qualified Adult.
Policy changes to address incentive issues would also need to be evaluated against the goals of income support and poverty prevention. For example, cuts which are focused on the increases for qualified children (child dependant payments) would have a stronger impact on overall poverty and on child poverty than cuts of the same aggregate amount in the increase for qualified adults (formerly adult dependant addition). Alternative lines of inquiry would include the design of in-work benefits, which would seek to improve incentives while maintaining the anti-poverty effect of income supports, and strengthening of activation/work search requirements associated with unemployment compensation.25 Andersen and Svarer (2014) show in a job-search model how, for given benefit levels, activation requirements could be used to improve the incentive structure. Empirically, this finding ties in with the fact that Scandinavian systems tend to involve both high unemployment benefits and strong activation requirements.
The extent of behavioural response to replacement rate incentives remains a key issue. This has been an active area of research in the international literature. A recent survey (Howell and Rehm, 2009) points to the fact that several studies have found significant evidence of behavioural response, but that the magnitude of such responses is often rather small. An Irish study on similar lines reaches the same conclusion. (Layte and Callan, 2001). One factor which contributes to such results is that decisions are not based simply on the balance of immediate financial advantage. Lifetime earnings can be scarred by an unemployment spell, and taking up employment can lead to increased earnings over time.
25 This would be particularly relevant for those whose earnings potential is low.
25
BIBLIOGRAPHY Adam, S. and J. Browne, 2010. "Redistribution, Work Incentives and Thirty Years
of UK Tax and Benefit Reform", Institute for Fiscal Studies Working Paper 10/24.
Adam, S. and J. Browne, 2013. “Do the UK Government’s welfare reforms make work pay?”, IFS Working Paper W13/26.
Adam, S., M. Brewer and A. Shephard, 2006. "Financial Work Incentives in Britain: Comparisons Over Time and Between Family Types", Institute for Fiscal Studies, Working Paper WP06/20.
Andersen, T.M. and M. Svarer, 2014. "The Role of Workfare in Striking a Balance between Incentives and Insurance in the Labour Market," Economica, London School of Economics and Political Science, Vol. 81(321), pp. 86-116, 01.
Arulampalam, W, 2001. “Is Unemployment Really Scarring? Effects of Unemployment Experiences on Wages” Economic Journal, Royal Economic Society, vol. 111(475), pages F585-606, November.
Atkinson, A.B. and J. Micklewright, 1991. “Unemployment Compensation and Labor Market Transitions: A Critical Review”, Journal of Economic Literature, Vol. 29, No. 4 (Dec. 1991), pp. 1679-1727.
Blundell, R., 2011. "Tax Policy Reform: The Role of Empirical Evidence", Journal of the European Economic Association, Vol. 10, No. 1, pp 43-77.
Brewer, M., E. Saez and A. Shephard, 2010. "Means-testing and Tax Rates on Earnings" in Institute for Fiscal Studies (ed.) Dimensions of Tax Design, Oxford: Oxford University Press.
Callan, T., B. Nolan, C. O'Donoghue, 1996. "What Has Happened to Replacement Rates?", The Economic & Social Review, Vol. 27, No. 5, October 1996, pp. 439-456.
Callan, T., J.R. Walsh and K. Coleman, 2007. Work Incentives, Poverty and Welfare in Ireland, Policy Research Series No. 60, Dublin: The Economic and Social Research Institute.
Callan, T, N. Crilly, C. Keane, J.R. Walsh and Á. Ní Shúilleabháin, 2011. “Tax, Welfare and Work Incentives”, Budget Perspectives 2012, Research Series No. 28, Dublin: Economic and Social Research Institute.
Callan, T., C. Keane, M. Savage, J.R. Walsh, K. Timoney, 2012. “Work Incentives: New Evidence for Ireland” in T. Callan (ed.) Budget Perspectives 2013, Dublin: The Economic and Social Research Institute.
Callan, T., C. Keane, M. Savage and J.R. Walsh,. 2013. "Taxes on Income: Ireland in Comparative Perspective", Budget Perspectives 2014, Dublin: The Economic and Social Research Institute.
Card, D. and P.B. Levine, (2000). “Extended Benefits and the Duration of UI Spells: Evidence from the New Jersey Extended Benefit Program”, Journal of Public Economics, Vol. 78, pp. 107-38.
Cockx, B. L.W. and J. Ries, 2004. “The Exhaustion of Unemployment Benefits in Belgium: Does it Enhance the Probability of Employment?”, Institute for the Study of Labor IZA Discussion Paper No. 1177.
26
CSO, 2011. Survey on Income and Living Conditions (SILC) 2010, Dublin: Stationery Office.
Department of Social Protection, 2010. A Policy and Value for Money Review of Child Income Support, November 2010. www.welfare.ie/EN/Policy/ CorporatePublications/Finance/exp_rev/Documents/CISReviewFinal.pdf
Department of Social Protection, 2012. Statistical Information on Social Welfare Services, www.welfare.ie
Gallie, D. (ed.) 2013. Economic Crisis, Quality of Work, and Social Integration The European Experience, Oxford.: Oxford University Press, Gregg, P. and Tominey, E. 2005. “The wage scar from male youth unemployment”
Labour Economics, Elsevier, vol. 12(4), pages 487-509, August. Gregory, M. and Jukes, R. 2001. “Unemployment and Subsequent Earnings:
Estimating Scarring among British Men 1984-94” Economic Journal, Royal Economic Society, vol. 111(475), pages F607-25, November.
Holmlund,B. 1998. “Unemployment Insurance in Theory and Practice”, Scandinavian Journal of Economics, Vol. 100, No. 1, pp. 113-141.
Howell, D.R. and M. Rehm, 2009. “Unemployment compensation and high European unemployment: a reassessment with new benefit indicators”, Oxford Review of Economic Policy, Vol. 25, No. 1, pp. 60-93.
International Monetary Fund, 2012. Staff Report for the 2012 Article IV Consultation, Washington: IMF.
IMF, 2014. “Fiscal Policy and Economic Inequality”, IMF policy paper available online at : http://www.imf.org/external/np/pp/eng/2014/012314.pdf
Katz, L. F. and B.D. Meyer, 1990. “The Impact of the Potential Duration of Unemployment Benefits on the Duration of Unemployment”, Journal of Public Economics, Vol. 41, pp. 45-72.
Keane, C., T. Callan, M. Savage, J.R. Walsh, K. Timoney, 2014. “Identifying Policy Impacts in the Crisis: Microsimulation Evidence on Tax and Welfare”, Journal of the Statistical and Social Inquiry Society of Ireland, Vol. XLII, 2012-13, pp. 1-14.
Kluve, J. 2010. “The effectiveness of European active labor market programs,” Labour Economics, Elsevier, Vol. 17, No. 6, pp. 904-918, December.
Lalive, R., 2007. “Unemployment Benefits, Unemployment Duration, and Post-Unemployment Jobs: A Regression Discontinuity Approach”, American Economic Review, Vol. 97, No. 2, pp. 108-112.
Lalive, R. and J. Zweimuller, 2004. “Benefit entitlement and unemployment duration: The role of policy endogeneity”, Journal of Public Economics, Vol. 88, pp. 2587-2616.
Lalive, R., J. C. van Ours and J. Zweimuller, 2006. "How Changes in Financial Incentives Affect the Duration of Unemployment," Review of Economic Studies, 2006, Vol. 73, No. 4, pp. 1009-1038.
Lancaster, T., and S. Nickell, 1980. “The Analysis of Re-employment Probabilities for the Unemployed”, Journal of the Royal Statistical Society, “A” Vol. 143, No. 2, pp. 141-165.
Layte, R. and T. Callan, 2001. “Unemployment Welfare Benefits and the Financial Incentive to Work,” The Economic and Social Review, Vol. 32, No. 2 103-129.
McGuinness, S., McGinnity, F. and O'Connell, P. J., 2009, “Changing Returns to Education During a Boom? The Case of Ireland”. LABOUR, 23: 197–221.
27

Meghir, C. and D. Phillips, 2010. "Labour Supply and Taxes", in J. Mirrlees, S. Adam, T. Besley, R. Blundell, S. Bond, R. Chote, M. Gammie, P. Johnson, G. Myles and J. Poterba (eds.), Dimensions of Tax Design: The Mirrlees Review, Oxford University Press for Institute for Fiscal Studies.
Mirrlees, J. S. Adam, T. Besley, R. Blundell, S. Bond, R. Chote, M. Gammie, P. Johnson, G. Myles and J. Poterba, 2011. Tax by Design: The Mirrlees Review, Oxford: Oxford University Press.
National Economic and Social Council (NESC), 2011. Supports and Services for Unemployed Jobseekers: Challenges and Opportunities in a Time of Recession, Dublin: National Economic and Social Development Office.
OECD, 2011. OECD Economic Surveys: Ireland 2011 Paris: OECD Publishing. OECD, 2013. OECD Economic Surveys: Ireland 2013 Paris: OECD Publishing. OECD, 2014. Benefits and Wages: OECD Indicators, www.oecd.org/els/social/
workincentives. Petrongolo, B. 2009. “The long-term effects of job search requirements: Evidence
from the UK JSA reform,” Journal of Public Economics, Elsevier, Vol. 93, Nos 11-12, pp. 1234-1253, December.
Pina, A., 2011. “Structural Reforms to Reduce Unemployment and Restore Competitiveness in Ireland”, OECD Economics Department Working Papers, No. 910, OECD Publishing. http://dx.doi.org/10.1787/5kg0szws6t6c-en
Pollmann-Schult, M., 2011. “Marriage and Earnings: Why Do Married Men Earn More than Single Men?” European Sociological Review, Vol. 27, No.2, pp.147-163.
Røed, K. And L. Westlie, 2007. “Unemployment Insurance in Welfare States: Soft Constraints and Mild Sanctions,”. Journal of the European Economic Association.
Steiber, N. 2013. ”Economic Downturn and Work Motivation” in Gallie, D. ed. Economic Crisis, Quality of Work, and Social Integration The European Experience, Oxford.: Oxford University Press,
van Ours, J. C., and M. Vodopivec, 2008. “Does Reducing Unemployment Insurance Generosity Reduce Job Match Quality?”, Journal of Public Economics, Vol. 92, Nos 3-4, pp. 684-695.
Watson, D., Maitre, B. And Whelan, C., 2012. Work and Poverty in Ireland: An Analysis of CSO Survey on Income and Living Conditions 2004-2010, ESRI and Social Inclusion Division of Department of Social Protection.
28