welcome! uds-2128 pc-communication analyzer · thomson filter combinations for standard data rates...
TRANSCRIPT

Welcome! UDSWelcome! UDS--21282128PCPC--Communication AnalyzerCommunication Analyzer
Product PresentationProduct Presentationwww.eltesta.com

The UDSThe UDS--2000 Family of PC2000 Family of PC-- OscilloscopesOscilloscopes
Eltesta Eltesta offers a wide range of wide bandwidth PC-Sampling Oscilloscopes for electrical and optical signals to cover your measurement needs.
www.eltesta.com
UDS-2020 UDS-2128 UDS-2030
2 2 psps RMS Jitter
12 GHz12 GHz Trigger Bandwidth
30 GHz30 GHz Electrical Bandwidth
2.7 2.7 Gb Gb Clock-Data Recovery
35 35 psps Step
Generator
8 GHz8 GHz Optical Bandwidth
12 GHz12 GHz Trigger Bandwidth
20 GHz20 GHz Electrical Bandwidth
20 GHz20 GHz Electrical Bandwidth

IntroductionThe UDSUDS--21282128 is the world Faster PC-Communication Analyzer
2 The UDSUDS--21282128 is a powerful instrument designed specifically to give you the highest accuracy, measurement speed, and ease-of use for characterizing telecommunications and data communications waveforms.
2 The UDSUDS--21282128 is a three-channel (two electrical and one optical), wide-bandwidth Analyzer that uses a sequential equivalent-time sampling technology to achieve bandwidth of up to 20 GHz20 GHz.
2 The UDSUDS--21282128 includes an integrated optical channels with 20 GHz20 GHz unfiltered bandwidth. It gives highest waveform fidelity and measurement accuracy.
2 With the accurate optical power meter built into the module, optical signals are accurately measured and displayed in optical power units.
2 The UDSUDS--21282128 has a broad range of Bessel-Thomson filter combinations for standard data rates from 155 Mbps155 Mbps to 3.125 3.125 GbpsGbps. www.eltesta.com
2.7 GHz2.7 GHz Clock Recovered Trigger
100100 ksks/s/s Acquisition Speed
12 GHz12 GHz Trigger Bandwidth
<2 mV max<2 mV max RMS Noise
<2.5 <2.5 psps max max RMS Jitter
100100 fsfs Time Resolution
8 GHz8 GHz Unfiltered Optical Bandwidth
1.6%1.6% Vertical and
0.4%0.4% Horizontal Accuracy
1414--bitbit ADC20 GHz20 GHz Channel Bandwidth
2The UDSUDS--21282128 provides fast acquisition, repeatable waveform performance analysis with:
!! Complete characterization of waveforms with automated measurement, and mask testing.
!! Accurate and repeatable extinction-ratio measurements with automatic dark-level compensation.
!! Fast measurement throughput resulting in lowest cost per test.
!! Flexible platform with possibility to have two electrical channels or one electrical channel and one optical channel.
!! HighHigh--resolution TDR/TDT.resolution TDR/TDT.!! Histograms.Histograms.!! Math or FFT analysis.Math or FFT analysis.!! ColorColor--Graded Display.Graded Display.

Units of the UDS-2128The UDSUDS--21282128 is a PC-Communication Analyzer, or an analyzer for the Personal Computer.
2 It requires just USB 2.0 or LPT connector in your PC to give you the power of a stand-alone instrument within your PC.
The UDSUDS--21282128 needs only simple USB 2.0 or LPT connection with PC.
www.eltesta.com
AC-coupled 12 GHz12 GHz typ prescaler for triggering on high-speed data without cumbersome manual adjustment.
2 Five Heads for UDSUDS--21282128
"" UDXUDX--P01P01Trigger Head
Free-running tunnel diode oscillator with a control to synchronize the oscillator to a sub harmonic of the input trigger signal up to 10 GHz10 GHz.
"" UDXUDX--T01T01Trigger Head
"" UDXUDX--R01R01 Clock Recovery Head
The 622 Mbps622 Mbps Clock Recovery Head covers OC12/STM4 bit rate.
The 2.4882.488 GbpsGbps Clock Recovery Head covers OC48/ STM16 bit rate.
"" UDXUDX--R02R02 Clock Recovery Head
A 3535--psps rise time Pulse Head provides capability of performing single-ended TDT as well as TDR measurements
"" UDXUDX--G01G01Pulse Head
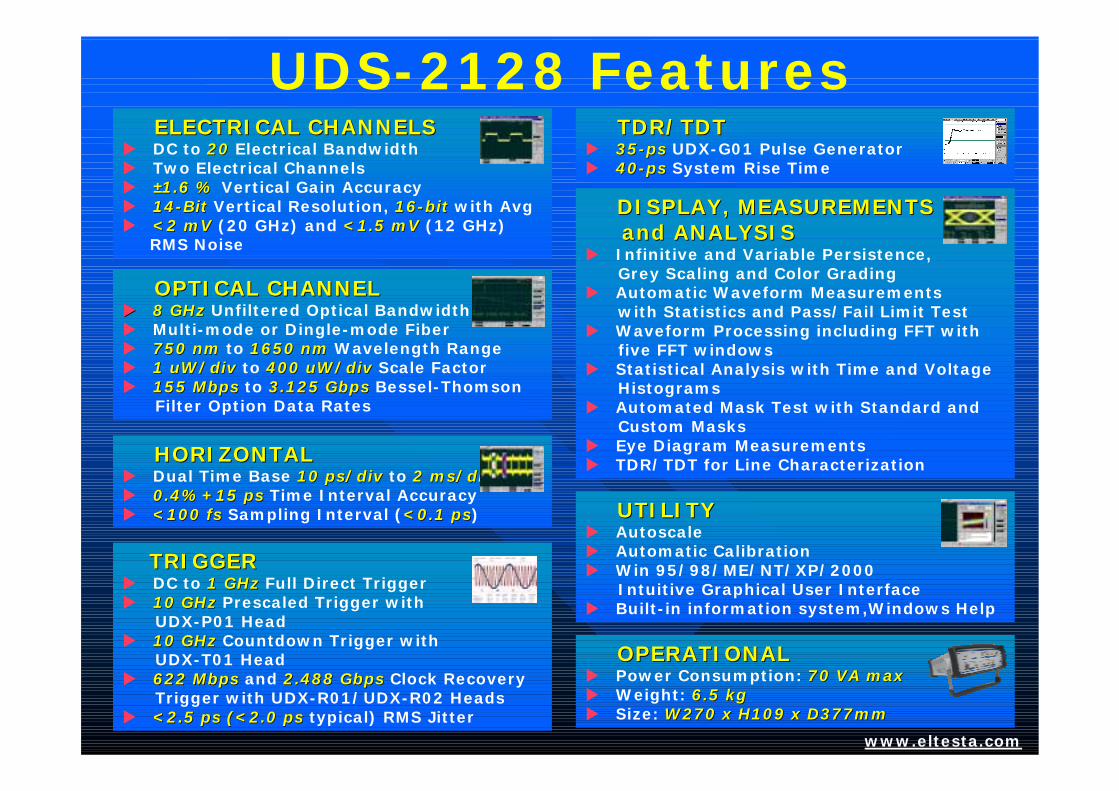
UDS-2128 FeaturesELECTRICAL CHANNELSELECTRICAL CHANNELS
! DC to 2020 Electrical Bandwidth! Two Electrical Channels! ±±1.6 %1.6 % Vertical Gain Accuracy! 1414--BitBit Vertical Resolution, 1616--bitbit with Avg! <2 mV<2 mV (20 GHz) and <1.5 mV<1.5 mV (12 GHz)
RMS Noise
DISPLAY, MEASUREMENTS DISPLAY, MEASUREMENTS and ANALYSISand ANALYSIS
! Infinitive and Variable Persistence, Grey Scaling and Color Grading
! Automatic Waveform Measurements with Statistics and Pass/Fail Limit Test
! Waveform Processing including FFT with five FFT windows
! Statistical Analysis with Time and Voltage Histograms
! Automated Mask Test with Standard and Custom Masks
! Eye Diagram Measurements! TDR/TDT for Line Characterization
www.eltesta.com
HORIZONTALHORIZONTAL! Dual Time Base 1010 psps/div/div to 2 ms/div2 ms/div! 0.4%+150.4%+15 psps Time Interval Accuracy! <100 <100 fsfs Sampling Interval (<0.1 <0.1 psps)
TRIGGERTRIGGER! DC to 1 GHz1 GHz Full Direct Trigger! 10 GHz10 GHz Prescaled Trigger with
UDX-P01 Head! 10 GHz10 GHz Countdown Trigger with
UDX-T01 Head ! 622 Mbps622 Mbps and 2.488 2.488 GbpsGbps Clock Recovery
Trigger with UDX-R01/UDX-R02 Heads! <2.5<2.5 psps (<2.0 (<2.0 psps typical) RMS Jitter
TDR/TDTTDR/TDT! 3535--psps UDX-G01 Pulse Generator ! 4040--psps System Rise Time
UTILITYUTILITY! Autoscale! Automatic Calibration! Win 95/98/ME/NT/XP/2000
Intuitive Graphical User Interface! Built-in information system,Windows Help
OPERATIONALOPERATIONAL! Power Consumption: 70 VA max70 VA max! Weight: 6.5 kg6.5 kg! Size: W270 x H109 x D377mmW270 x H109 x D377mm
OPTICAL CHANNELOPTICAL CHANNEL!! 8 GHz8 GHz Unfiltered Optical Bandwidth ! Multi-mode or Dingle-mode Fiber! 750 nm 750 nm to 1650 nm 1650 nm Wavelength Range! 1 1 uWuW/div /div to 400 400 uWuW/div /div Scale Factor! 155 Mbps155 Mbps to 3.125 3.125 GbpsGbps Bessel-Thomson
Filter Option Data Rates

UDS-2128 Applications
Testing for ITU/ANSIConformance
Limit and Mask Test
Signal Signal AnalysisAnalysis
Network Analysis Network Analysis with TDR/TDTwith TDR/TDT
HighHigh--Speed Digital Speed Digital CommunicationCommunication
Semiconductor Semiconductor TestingTesting
R & DR & D
Timing Timing AnalysisAnalysis
ManufacturingManufacturing
Automatic Test Systems
Autocalibration Routine
Automatic Parametric Measurements
Compliance Testing
Pulsed RF Switches
Microwave &RF Charac-terization
Digital Design
High-Energy Physics
Informative Waveform Displays
Hi-Speed Diodes
Fast Logic Families
Analogue Component Pulse Response
Designing/Verification of Telecom and Datacom Elements
Manufacturing/Testing for ITU/ANSI Conformance
Circuits Boards Characterization
IC Packages Characterization
Computer Backplane
Z-Impedance Measurements
Electrical StandardsCompliance Testing
Spectrum Analysis
Statistic Analysis
Eye-Diagram Analysis
www.eltesta.com

Sampling Oscilloscopes: Market Requirements
2 Significant Increase in Sampling OscilloscopeSampling OscilloscopeSpecifications Others
15%15%Price LevelTrigger JitterBandwidth
20%20%25%25%40%40%
2 Today’s speedsspeeds are causing more signal integrity challenges than ever
! Smaller logic swings! Differential signal! More signals to
measure! Signal impedance and
termination issues
! Faster clock and data rates! Quicker rise and fall times! Shorter setup and hold
times
Electrical and Electrical and physical challengesphysical challenges
Faster synchronous Faster synchronous bus architecturebus architecture
2 What affectsaffects ease of use? ! Waveform Update Rate
! Display Quality! User Input Control Response Time! Measurement and Math Function Capability! Intuitive GUI and Menu Structure! PC Connectivity
www.eltesta.com

Sequential SamplingThe UDSUDS--21282128 uses digital sequential sampling technology to acquire and display high bandwidth waveforms.
2 A sampling oscilloscopesampling oscilloscope does not continuously monitor the input signal applied to the channel, but looks at it only at discrete points in time. At each discrete point, the oscilloscope samples the signal and stores a replica of the input voltage on an input sampling capacitor.
www.eltesta.com
2 Sequential Sampling Technique means:
! Wide BandwidthApplications (> 1GHz(> 1GHz)
! Used ONLYONLY with Repetitive Signals
! One SampleOne Sample is taken for each Trigger
! Multiple TriggerMultiple Trigger Events Build Up Waveform
! NoNo PrePre--TriggerTriggerInformation
1st Acquisition Cycle
2nd Acquisition Cycle
Nth Acquisition Cycle
Reconstructed Waveform
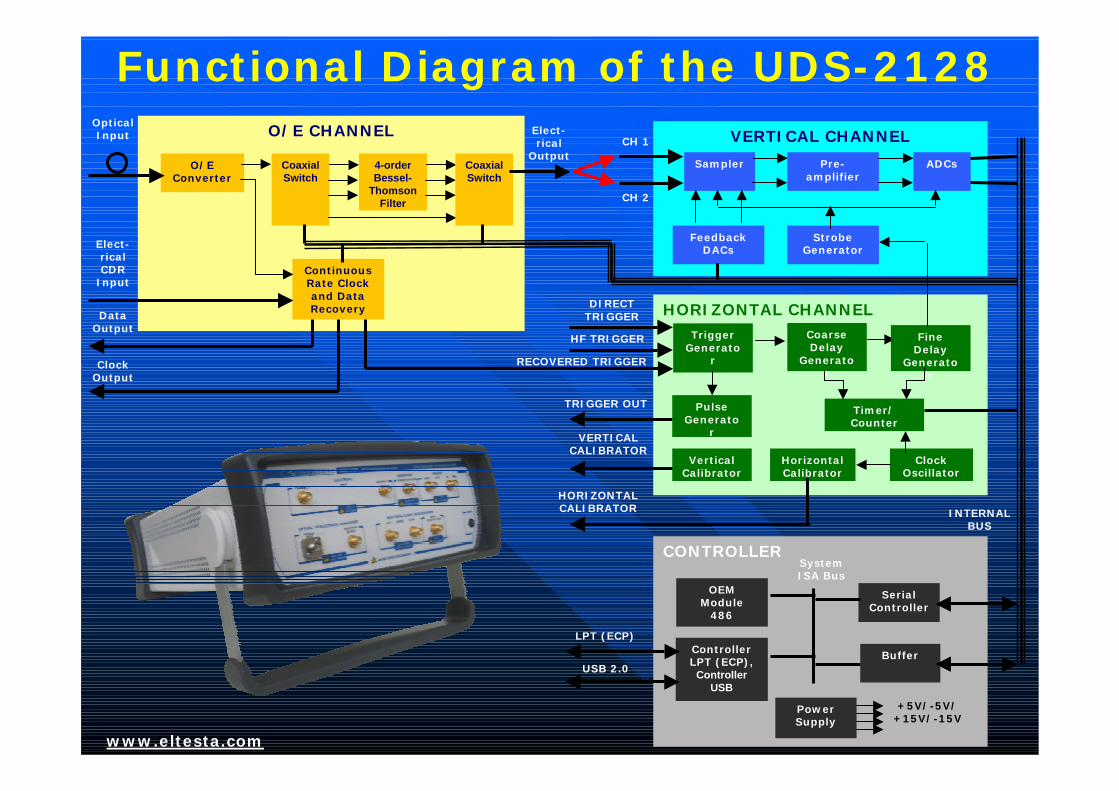
Functional Diagram of the UDS-2128
www.eltesta.com
VERTICAL CHANNEL
Sampler Pre-amplifier
ADCs
StrobeGenerator
CH 1
FeedbackDACs
HORIZONTAL CHANNEL
FineDelay
Generator
Timer/Counter
ClockOscillator
DIRECT TRIGGER
VERTICAL CALIBRATOR
HORIZONTAL CALIBRATOR
CoarseDelay
Generator
TriggerGenerato
r
PulseGenerato
r
Horizontal Calibrator
Vertical Calibrator
CONTROLLER
OEM Module
486
SerialController
Controller LPT (ECP),
Controller USB
Buffer
LPT (ECP)
System ISA Bus
PowerSupply
+5V/-5V/+15V/-15V
INTERNAL BUS
HF TRIGGER
TRIGGER OUT
USB 2.0
O/E CHANNEL
O/E Converter
Optical Input
4-order Bessel-
Thomson Filter
Coaxial Switch
Coaxial Switch
Elect-rical
Output
RECOVERED TRIGGER
Continuous Rate Clock and Data Recovery
Elect-ricalCDR
Input
Data Output
Clock Output
CH 2

USB Interface
www.eltesta.com
USB 2.0USB 2.0 for fast data transfer
The UDSUDS--21282128 PC-Communication Analyzer is connected to the USB USB port on any modern laptop or desktop PC. The USB 2.0USB 2.0 interface ensures a quick screen update rate, even when collecting large amounts of data, whilst still retaining backward compatibility with PC's using USB 1.1.USB 1.1.
Why USB USB ?
The Universal Serial Bus (USBUSB) has become the standard method for interfacing peripherals to PCs. Today virtually all PCs, including laptops and notebooks, are fully USBUSB-ready and include at least one USBUSB port. The UDS-2128 uses now USB 2.0 Full-Speed USB. This allows UDS-2128 to take advantage of the fast data transfer rate that ensures a quick screen update rate, even when collecting large amounts of data.
USB 2.0 is backward compatible with USB 1.1 allowing UDS-2128 to be used on older PCs with USB 1.1 ports. Although the data transfer rate will be slower when using USB 1.1, it is still faster than a parallel port connection.
Easy to setup and use
Connecting and using a UDS-2128 USB USB oscilloscope could not be easier. Simply connect the oscilloscope to the PC using a standard USB cable (supplied). The host PC will automatically detect the UDS-2128 avoiding the need for any complex setup procedures, and without the need to reboot the PC.
The benefits of USB USB
2 Easy to use: Easy to use: All USB peripherals are detected by the PC automatically and can be connected and reconnected without the need for rebooting the PC.2 Fast: Fast: Transfer rates many times faster than USB 1.1 or parallel port devices.2 Expandable: Expandable: Up to 127 peripherals can be plugged into one host computer.2 Compatibility: Compatibility: USB 2.0 is backward compatible with USB 1.1.

User InterfaceThe UDSUDS--21282128 has a Windows Intuitive Graphical User InterfaceWindows Intuitive Graphical User Interface, so you won’t have to spend a lot of time learning or relearning the instrument. Pull-down menus give you easy access to advanced features and icons provide quick access to an extensive set of common tests and measurements.
System Controls
Status Area
Display Area
Measure-ment Area
Permanent Controls Side Menu Area
Main Menu Area
www.eltesta.com
2 Good organized test results
2 View measurements, histogram, marker, mask and limit test results in individual places of Measurement Area
2 Original Interface Delivers Intuitive Access to the UDSUDS--21282128

Integrated Optical Channel
2 The integrated optical channel can be used The integrated optical channel can be used as a fully calibrated SONET/SDH/Gigabit as a fully calibrated SONET/SDH/Gigabit Ethernet orEthernet or FibreFibre Channel reference receiver Channel reference receiver or as a wideor as a wide--bandwidth receiver.bandwidth receiver.
www.eltesta.com
SamplerOptical
Receiver
Optical Input Signal
Average Power
Monitor
4-order Bessel-
Thomson Filter
GPO Module
2 9 GHz PIN/TIA module for 12.59 GHz PIN/TIA module for 12.5 GbGb/s rates/s rates
2 62.5 62.5 µµµµµµµµm MM fiber, SMA or GPO outputm MM fiber, SMA or GPO output
2 780 nm through 1550 nm applications780 nm through 1550 nm applications
2 Low frequency response to DCLow frequency response to DC
2 Adjustable DC output levelAdjustable DC output level
2 400 V/W / Conversion Gain (1310 nm)
2 450 V/A Transimpedance Gain

Optical Bandwidth Test
2 Optical Bandwidth Test
! Input Optical Pulse Width: <30 ps! Unfiltered Optical
Bandwidth: 8.6 GHz
www.eltesta.com
Optical Impulse Generator
Trigger Output
Optical Output
Optical Input
Trigger Input
UDS-2128

Optical Bandwidth Test (cont.)
2 Optical Bandwidth Test with OC-48 Bessel-Thomson Filter shows 2 GHz Optical Bandwidth.
www.eltesta.com
2 Optical Bandwidth Test with GBE Bessel-Thomson Filter shows 1 GHz Optical Bandwidth.

Digital Feedback Converter
Functional diagram of Digital Feedback Converter
Sampler Preamplifier 14-bit ADC
Digital Output Data
Analog Input Signal
Offset Signal
12-bit Feedback
DAC
DigitalFeedback Controller
www.eltesta.com
2 Digital feedback sampling allows software linearization of the sampling system to provide extremely linear extremely linear response regardlessresponse regardless of the sampling offset. 2 Sampling offsetSampling offset can be removed completely, or can feedback previously stored information recorded at discrete instants in time.

Dual-Channel 20-GHz SamplerThe UDSUDS--21282128 includes a dual-channel samplersampler. This sampler is designed for precise measurements on high speed, low amplitude signals and low-loss testing in applications such as microwave systems research and development, digital device characterisation, and high-speed digital communications circuit design.It provides an acquisition rise time of 17.5 17.5 psps, with a typical 2020--GHzGHz equivalent bandwidth, and maximum RMS noise 2 mV2 mV to ensure clean, undistorted signals. The electrical channel has both a 20 GHz20 GHz mode for better waveform fidelity, and a 12 GHz12 GHz mode for optimum noise performance. Changing the bias on the sampling bridge alters the bandwidth of both channels.
Dual-Channel 2020--GHzGHz Sampler used in the UDSUDS--21282128
2 Key SpecificationsSpecifications of the SamplerSampler:
! Number of Channels - 2 (Simultaneous acquisition)
! Bandwidth (-3dB) – Full BW: DC to 20 GHz20 GHz,Narrow BW: DC to 12 GHz12 GHz
! Rise Time (10%-90%) - Full BW: ≤≤≤≤≤≤≤≤17.517.5 psps, Narrow BW: ≤≤≤≤≤≤≤≤29.229.2 psps
! RMS Noise (maximum) - Full BW: ≤≤≤≤≤≤≤≤2 mV2 mV, Narrow BW: ≤≤≤≤≤≤≤≤1.5 mV1.5 mV
! Maximum operating input voltage - 1.0 V p1.0 V p--ppat ±±±±±±±± 1 V1 V range
! Maximum Safe Input Voltage - 1616 dBmdBm, or ±±±±±±±± 2 V (dc + peak ac)2 V (dc + peak ac)
! Nominal Input Impedance - (50 (50 ±±±±±±±± 1) 1) ΩΩΩΩΩΩΩΩ! Reflection from Input - <<±±±±±±±±5 %5 % for 4040--psps
rise time! Input connectors - NN--typetype, 7x3,04 mm (f)! Channel-to-channel isolation - <1 % p<1 % p--pp for
4040--psps rise timewww.eltesta.com
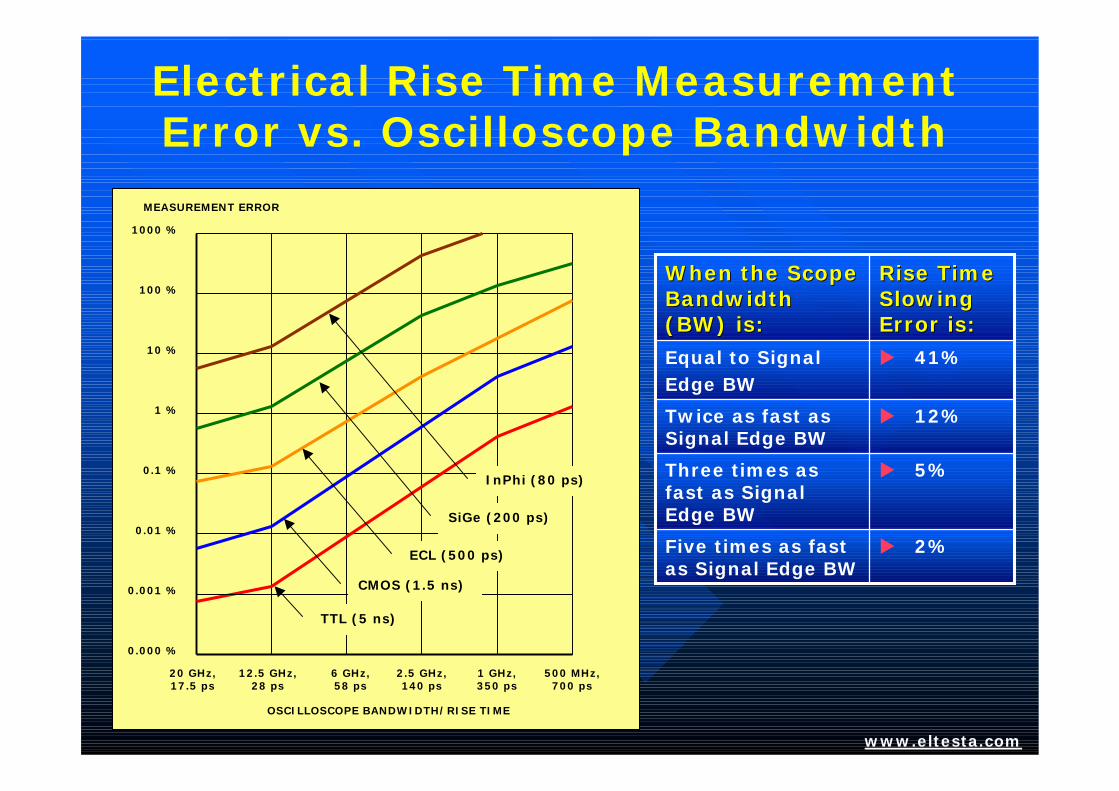
Electrical Rise Time Measurement Error vs. Oscilloscope Bandwidth
www.eltesta.com
1000 %
100 %
10 %
1 %
0.1 %
0.01 %
0.001 %
MEASUREMENT ERROR
20 GHz,17.5 ps
12.5 GHz,28 ps
6 GHz,58 ps
2.5 GHz,140 ps
1 GHz,350 ps
500 MHz,700 ps
OSCILLOSCOPE BANDWIDTH/RISE TIME
0.000 %
TTL (5 ns)
CMOS (1.5 ns)
ECL (500 ps)
SiGe (200 ps)
InPhi (80 ps)
! 2%Five times as fast as Signal Edge BW
! 5%Three times as fast as Signal Edge BW
! 12%Twice as fast as Signal Edge BW
! 41%Equal to SignalEdge BW
Rise Time Rise Time Slowing Slowing Error is:Error is:
When the Scope When the Scope Bandwidth Bandwidth (BW) is:(BW) is:
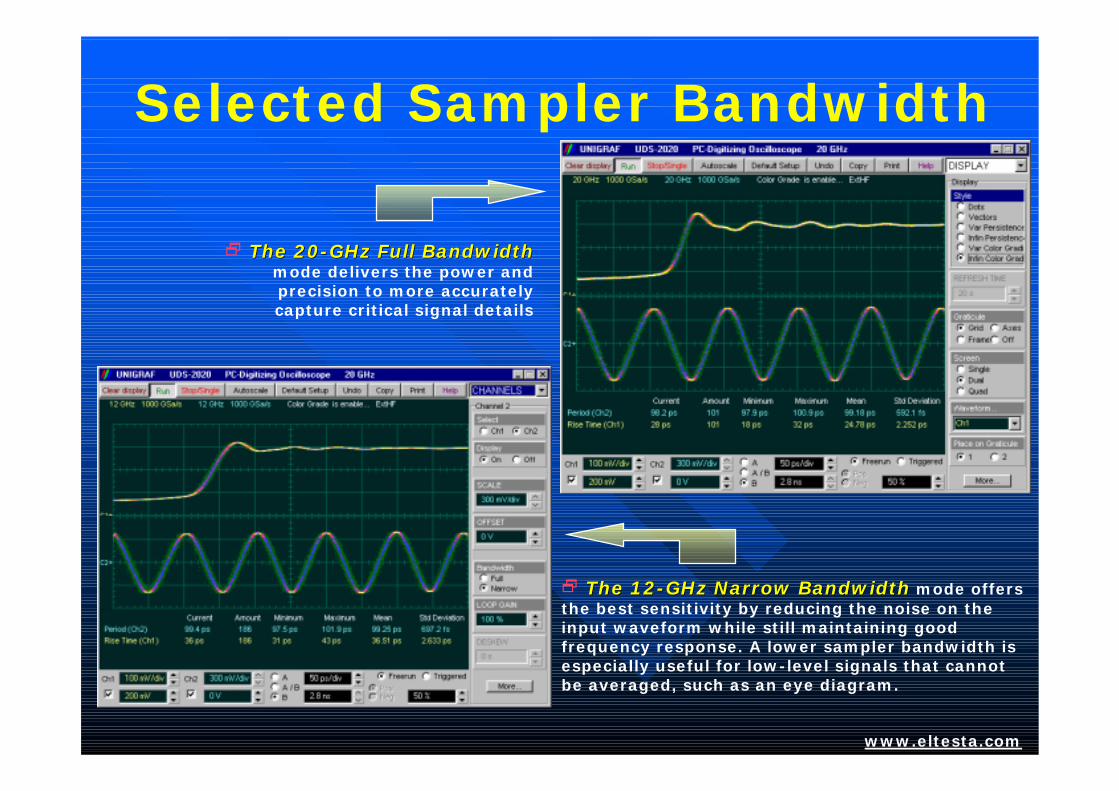
Selected Sampler Bandwidth
www.eltesta.com
2 The 12The 12--GHz Narrow BandwidthGHz Narrow Bandwidth mode offers the best sensitivity by reducing the noise on the input waveform while still maintaining good frequency response. A lower sampler bandwidth is especially useful for low-level signals that cannot be averaged, such as an eye diagram.
2 The 20The 20--GHz Full BandwidthGHz Full Bandwidthmode delivers the power and precision to more accurately capture critical signal details

Selected Sampler Bandwidth (cont.)
www.eltesta.com
2 The 12The 12--GHz Narrow BandwidthGHz Narrow Bandwidth mode offers the best sensitivity by reducing the noise on the input waveform while still maintaining good frequency response. A lower sampler bandwidth is especially useful for low-level signals that cannot be averaged, such as an eye diagram. Fall Time=46.22 ps
2 The 20The 20--GHz Full BandwidthGHz Full Bandwidthmode delivers the power and precision to more accurately
capture critical signal details. Eye Fall Time=38.28 ps

Time Base
A 2.52.5--GbpsGbps Eye Diagram displayed with dual-intensified time base
The Time BaseTime Base allows you to control the horizontal display through the Main, Intensified, Delayed or Dual Delayed time bases also TIME/DIV and DELAY functions.
www.eltesta.com
2 The Units function of the UDSUDS--21282128 Time Base lets you set the instrument time base to:
! Basic time units (second)! Meter, foot, inch! Bit period (data rate)
!! Bit period units provide an easy and intuitive way to display digital communication signals.
2 TIME BASE:10 10 psps/div to 2 ms/div/div to 2 ms/div
2 Delta Time Interval Accuracy: ±± 0.4 % of reading 0.4 % of reading ±± 10 10 ps ps ±± 100 100 ppm ppm of delay setting (typical)of delay setting (typical)

Time Base Preciseness
www.eltesta.com
A 1010--GHzGHz Sine-wave signal displayed with 100 100 psps/div/div time base
The UDSUDS--21282128 time base settings could be adjusted from 2 ms/div 2 ms/div to as low as 10 10 psps/div/div. With a 1010 psps/div /div setting, the full span of the instrument is 100 100 psps. Thus a 10 GHz10 GHz (or 10 10 GbGb/s/s) signal, with a 100 100 psps bit period, would have one bit period displayed. When displaying eye diagrams, it is typically preferred to display a single bit period on a 60% 60% of full horizontal screen. The ideal time span for a 10 10 GbGb/s/s eye diagram should be some-where between 16 16 psps/div /div and 12 12 psps/div/div.
2 TIME BASE SCALE:1010 psps/div to 2 ms/div/div to 2 ms/div
2 Time Base Resolution:<100 <100 fsfs
2 Delta Time Interval Accuracy: ±± 0.4 % of reading 0.4 % of reading ±± 1010 psps ±± 100100 ppmppm of delay of delay setting (typical)setting (typical)

Time Base Windowing2 The Time Base windowing function is similar to the delayed or dual delayed sweep on analog oscilloscopes because it turns on an expanded time base
2 Expanded time base allows you to pinpoint and to horizontally expand a portion (or two portions) of the signal for a more detailed or high-resolution analysis
2 Right picture shows the same waveform acquired with Dual Delay Time Base. Measured Pulse Width = 39.7 ns39.7 ns
www.eltesta.com
2 Left picture shows a waveform acquired with Intensified Time Base

Precise Measurements by using Windowing
www.eltesta.com
2 UDSUDS--21282128 windowing capability can be used to make precise measurements, including propagation delay measurements with 0.1 0.1 psps timing resolution.
2 Channel deskew capability provides accurately delay measurements in today’s high-speed digital systems.
The UDSUDS--21282128 measures 17.3317.33--psps delay between two sources

Long Delay Measurements
www.eltesta.com
2 Timing accuracy leads to waveform jitter:
! How much uncertainty exists in determining the precise time when a sample is taken
! A trigger event determines when the sampling process should begin
! The time between a trigger event and the sampling event is often several tens of nanoseconds
! Maintaining sub-pico-second timing precision over multiple nanosecond time span is extremely difficult
2 RMS JitterMax: 2.5 2.5 psps + 50 + 50 ppmppm of Delayof DelayTyp: 2.0 2.0 psps + 30 + 30 ppmppm of Delayof Delay
UDSUDS--21282128: RMS Jitter vs. variable Delay value
10 ps ps
8 ps
6 ps
4 ps
2 ps
RMS JITTER
0 ns 3 ns 10 ns 30 ns 100 ns 300 ns
DELAY VALUE
0 ps
1 us
Specified
Actual Direct Trigger
ActualPrescaledTrigger

Direct TriggerDirect TriggerThe power of wide-bandwidth sampling oscilloscopes is largely useless without fast, low-jitter triggering. UDSUDS--21282128 is equipped with built-in direct trigger for signals up to 1 GHz1 GHz repetitive rates without using an external trigger unit.
Equipment connections for Direct Trigger Test
2 Key specifications of Direct TriggerDirect Trigger:
! DC to 1 GHz1 GHz trigger bandwidth ! 100 mV p100 mV p--pp DC to 100 MHz100 MHz, 400 mV p400 mV p--pp
at 1 GHz1 GHz sensitivity! <2.5<2.5 psps max RMS jitter (22 psps typ)
www.eltesta.com
A typical picture of 1 GHz1 GHz signal by using Direct Trigger
UDSUDS--21282128
Synthesized CW Generator
Power Splitter

Direct Trigger JitterDirect Trigger Jitter
Timing accuracy leads to waveform jitter.
2 RMS Direct Trigger Jitter :
Max 2.5 2.5 psps + 50 + 50 ppmppmof Delayof Delay
Typ: 2.0 2.0 psps + 30 + 30 ppmppmof Delayof Delay
A typical picture showing 2.31 2.31 psps RMS Direct Trigger Jitter with 11--GHz GHz sine wave signal measured on 400 acquisitions400 acquisitions.
www.eltesta.com

Adjustable Trigger HoldoffAdjustable TriggerTrigger HoldoffHoldoff allows locking on a particular point in a pulse train or in irregular repetitive signals, such as radar signals.
Right picture shows stable trigger of the same Double Pulse signal with a 3030--nsnsTrigger Trigger HoldoffHoldoff adjusted with 22--nsns increment.
www.eltesta.com
Left picture shows unstable trigger of signal from 2020--MHzMHz Double Pulse Generator.
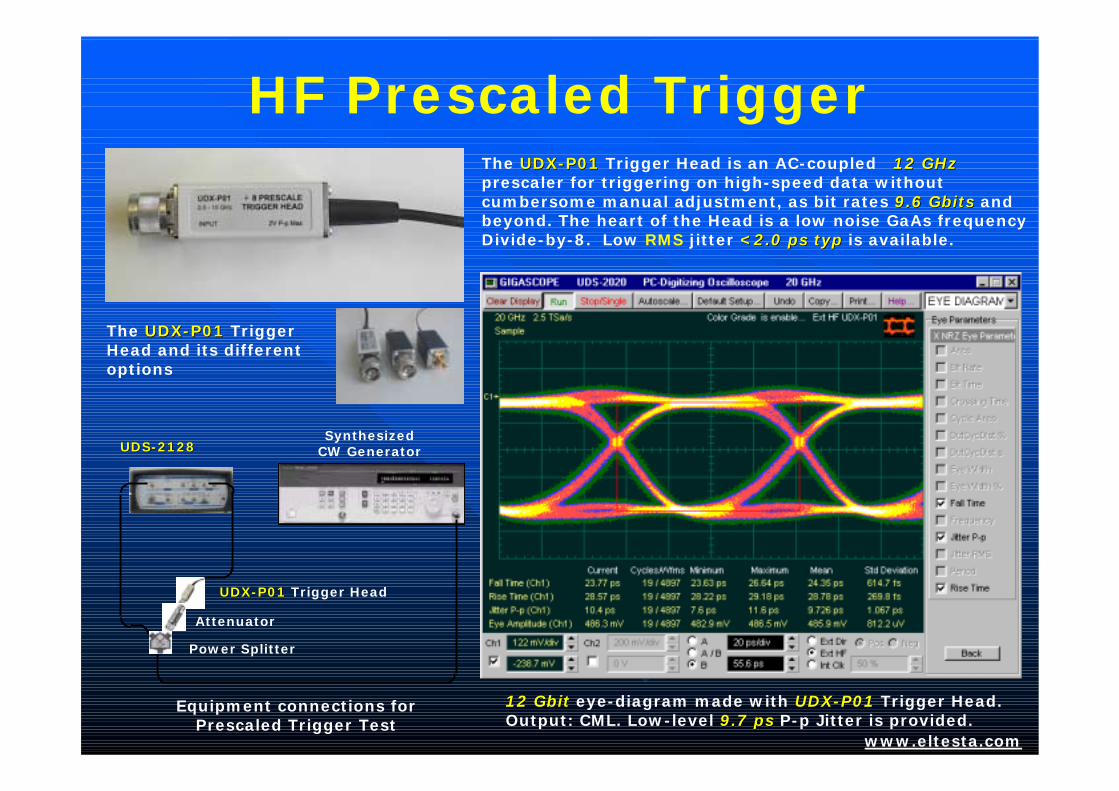
HF Prescaled TriggerThe UDXUDX--P01P01 Trigger Head is an AC-coupled 12 GHz12 GHzprescaler for triggering on high-speed data without cumbersome manual adjustment, as bit rates 9.69.6 GbitsGbits and beyond. The heart of the Head is a low noise GaAs frequency Divide-by-8. Low RMS jitter <2.0 <2.0 psps typtyp is available.
12 12 GbitGbit eye-diagram made with UDXUDX--P01P01 Trigger Head. Output: CML. Low-level 9.7 9.7 psps P-p Jitter is provided.
Equipment connections for Prescaled Trigger Test
www.eltesta.com
The UDXUDX--P01P01 Trigger Head and its different options
UDSUDS--21282128Synthesized
CW Generator
Power Splitter
Attenuator
UDXUDX--P01P01 Trigger Head

Trigger Jitter with HF Prescaler
Timing accuracy leads to waveform jitter.
2 Max RMS HF Trigger Jitter: 2.5 2.5 psps
2 Typical RMS HF Trigger Jitter: 2.0 2.0 ps ps
www.eltesta.com
A typical picture showing 1.32 1.32 psps RMS HF Trigger Jitter with 1010--GHz GHz sine wave signal measured on 400 acquisitions400 acquisitions.
HF Countdown Trigger
UDXUDX--T01T01 Trigger Head
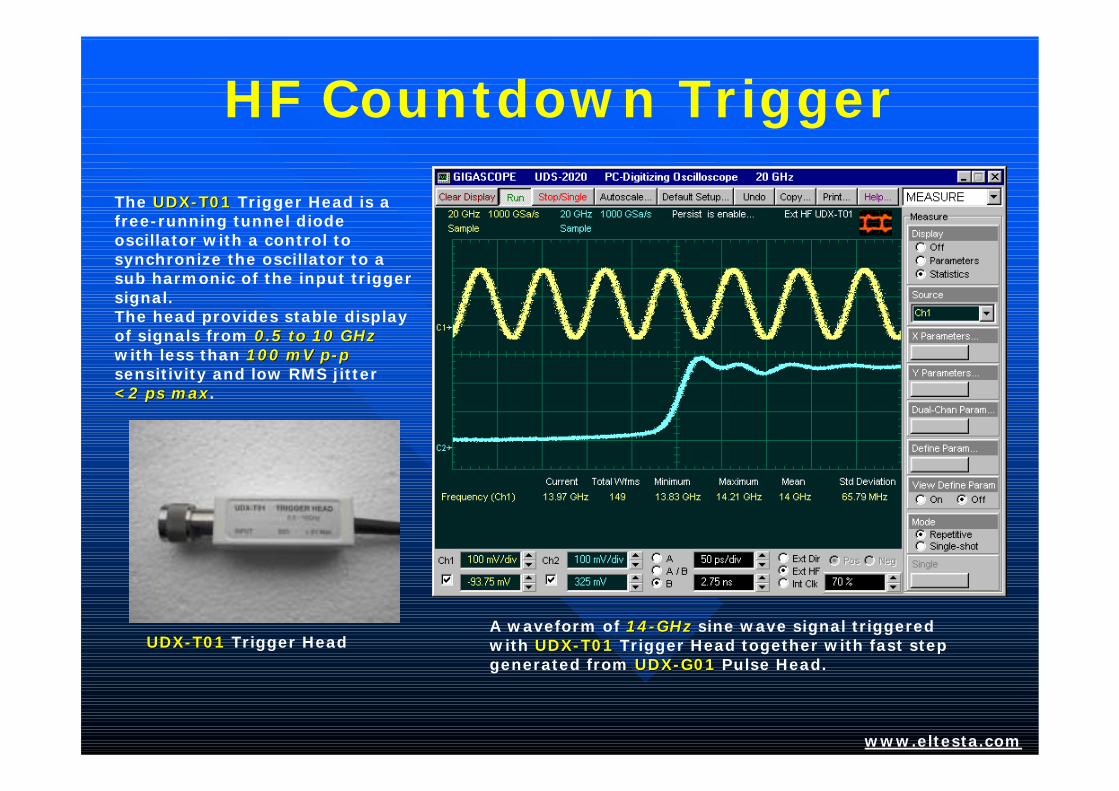
The UDXUDX--T01T01 Trigger Head is a free-running tunnel diode oscillator with a control to synchronize the oscillator to a sub harmonic of the input trigger signal. The head provides stable display of signals from 0.5 to 10 GHz0.5 to 10 GHzwith less than 100 mV p100 mV p--ppsensitivity and low RMS jitter <2 <2 psps maxmax.
A waveform of 1414--GHzGHz sine wave signal triggered with UDXUDX--T01T01 Trigger Head together with fast step generated from UDXUDX--G01G01 Pulse Head.
www.eltesta.com

Averaging Reduces NoiseAveraging is often used eliminate random noise on the display and increase resolution and accuracy of measurements. If a waveform is “buried” in noise, averaging can be used to extract a signal from the noise as shown in this illustration.
1010--GHzGHz signal with noise and jitter components The same 1010--GHzGHz signal without noise and jitter components after deep averaging.
www.eltesta.com
2 Averaging allows you to measure even noisy signal to less than 0.5 0.5 psps standard deviation enabling extreme accuracy when you need it most.
2 The UDSUDS--21282128 used three averaging algorithms:! Stable Average! Multiple Average! Median Average

Averaging Extracts Synchronous Harmonic Components
Significant application of AveragingAveraging is to extract individual noise components from noisy signal. The output signal can be a composite of the input signal plus several noise components (synchronous and non-synchronous).
2 All signal components (noise and signal) that are non-synchronous with the “suspect”will be “averaged out”.
2 Low-level synchronous components can be viewed without visual interference from the other noise components.
Averaging helps to extract synchronous low-level 1010--GHzGHz harmonic components from 500500--MHzMHz signal
www.eltesta.com

EnvelopingEnveloping
Min-Max Envelope detects 11--kHzkHz AM signal
Min-Max Envelope accumulates noise of 500500--MHzMHz signal
When one of the envelope mode is selected the UDSUDS--21282128 lets you acquire and display a waveform that shows the variation extremes of several acquisitions over a period of time. The oscilloscope detects peaks.
www.eltesta.com
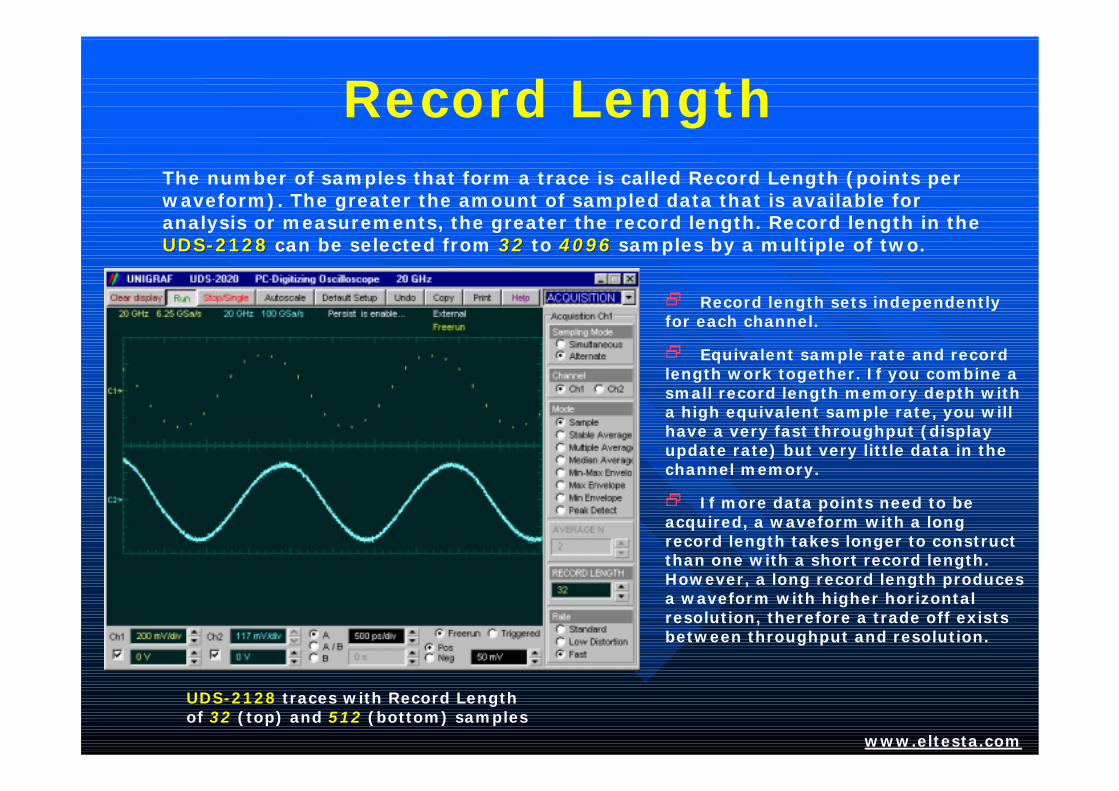
Record LengthThe number of samples that form a trace is called Record Length (points per waveform). The greater the amount of sampled data that is available for analysis or measurements, the greater the record length. Record length in the UDSUDS--21282128 can be selected from 3232 to 40964096 samples by a multiple of two.
UDSUDS--21282128 traces with Record Length of 3232 (top) and 512512 (bottom) samples
2 Record length sets independently for each channel.
2 Equivalent sample rate and record length work together. If you combine a small record length memory depth with a high equivalent sample rate, you will have a very fast throughput (display update rate) but very little data in the channel memory.
2 If more data points need to be acquired, a waveform with a long record length takes longer to construct than one with a short record length. However, a long record length produces a waveform with higher horizontal resolution, therefore a trade off exists between throughput and resolution.
www.eltesta.com

Multi-Waveform DisplayUp to eight traces can be displayed at the same time. The UDSUDS--21282128 can display two channels, four waveforms from waveform memories, four math waveforms (functions), and two FFTs (spectrums). Real and imaginary parts of memories, functions, and spectrums can be displayed separately.
UDSUDS--21282128 eight-waveform displaywww.eltesta.com
2 The UDSUDS--21282128 color GUI dedicates a different color for each trace and its associated readouts to simplify the viewing of complex signals on multiple channels.

Informative Waveform Display: Grey ScalingGrey Scaling
www.eltesta.com
Get valuable insight into your device behavior with gray scaling display. View pattern dependencies and different rare versus common events
2 The maximum population automatically gets the highest color intensity, the minimum population gets the lowest color intensity, and intermediate populations get intensities in between these extremes
2 The information in the lower populations (for example, down at the noise level) could be of greater interest to you than the rest.
2 The Grey ScalingGrey Scalingpersistence view highlights the distribution of data so that you can examine it in detail.
When you select Grey ScalingGrey Scaling mode, is assigned a single color. As a persistence data map develops, different intensities of that color are assigned to the range between a minimum and a maximum population.
Informative Waveform Display: Color Grading
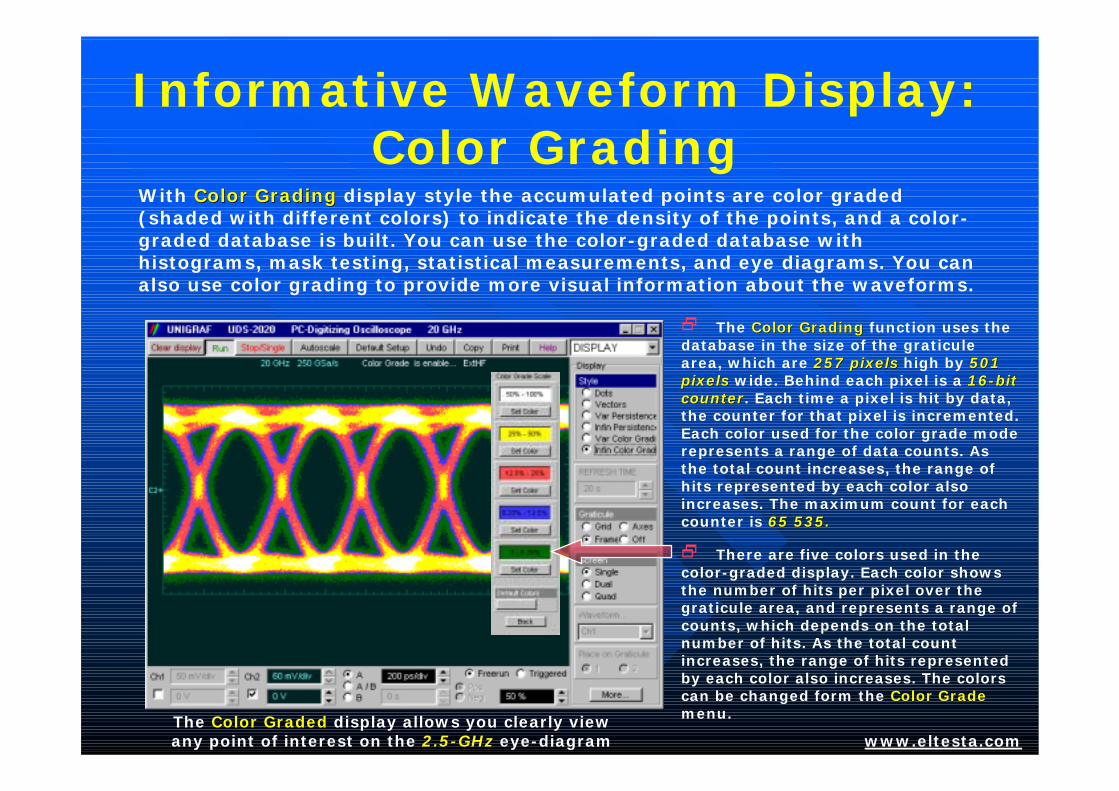
With Color GradingColor Grading display style the accumulated points are color graded (shaded with different colors) to indicate the density of the points, and a color-graded database is built. You can use the color-graded database with histograms, mask testing, statistical measurements, and eye diagrams. You can also use color grading to provide more visual information about the waveforms.
The Color GradedColor Graded display allows you clearly view any point of interest on the 2.52.5--GHzGHz eye-diagram
2 The Color GradingColor Grading function uses the database in the size of the graticulearea, which are 257 pixels257 pixels high by 501 501 pixelspixels wide. Behind each pixel is a 1616--bit bit countercounter. Each time a pixel is hit by data, the counter for that pixel is incremented. Each color used for the color grade mode represents a range of data counts. As the total count increases, the range of hits represented by each color also increases. The maximum count for each counter is 65 535.65 535.
2 There are five colors used in the color-graded display. Each color shows the number of hits per pixel over thegraticule area, and represents a range of counts, which depends on the total number of hits. As the total count increases, the range of hits represented by each color also increases. The colors can be changed form the Color GradeColor Grademenu.
www.eltesta.com

X-Y Display FormatThree FormatFormat menus determines how the instrument draws the waveforms:
!! The YTYT format is the normal time (on the horizontal axis) versus voltage (on the vertical axis).!! The XYXY format displays voltages of two waveforms against each other, and draws as the Source 1 versus Source 2 display of the two selected sources. Source 1's amplitude is plotted on the horizontal X axis and the Source 2’s amplitude is plotted on the vertical Y axis!! The XY & YTXY & YT format displays both YTYT and XYXY pictures. The YTYT format places on upper part of the screen, and XYXY format places on lower part of the screen.
YT & XYYT & XY Display Format XYXY Display Format
2 You can use the XYXY format to:
!! Compare frequency and phase relationships between two signals. !! Display strain vs. displacement, flow versus pressure, volts versus current,
or voltage versus frequency. www.eltesta.com

GraticuleThe UDSUDS--21282128 has a 1010 by 88 display graticule grid, which you can turn on, or off. The Graticule menu selection is: !! Grid, Grid, !! Axes, Axes, !! Frame, Frame, !! OffOff..
!! The OffOff option turned the back-ground graticule off. The displayed waveforms and waveform’s information is not turned off
!! The AxesAxes setting displays the outside border with a measure-ment scale and a measurement scale crossing at mid-screen.
!! The FrameFrameoption displays the outside border with a measurement scale that is incremented/ decremented with
!! The GridGrid background is complete graticule with ten horizontal major divisions and eight vertical major divisions. Vertically one minor division is one-quarter of a major division; and horizontally, one minor division is one-fifth of a major division.
major divisions and minor divisions based on the vertical and horizontal measurement settings.

ScreenScreenScreen function selects the number of screens to view:
!! SingleSingle - the entire display area is one screen and any displayed waveforms are superimposed on top of each other.!! DualDual - the display area is divided into two equal screens.!! QuadQuad - the display area is divided into four equal screens.
22 With the WfmWfm toto…… function you can set the waveform, that will be placed on the graticule, selected with the Place onPlace on GraticuleGraticule menu.22 With the Place onPlace on GraticuleGraticule menu you can place a waveform, selected by theWfmWfm toto…… function to each from possible graticule.
Screen with frame in dual screen mode Screen with frame in quad screen mode
www.eltesta.com

Waveform ManipulationWaveform Manipulation
www.eltesta.com
22 ZoomZoom!! Draw a box around the section
of the waveform you want to expand
Two features are available that can simplify your work with waveforms:
• Direct Manipulation• Direct Manipulation• Zoom• Zoom
!! Then click inside the box
22 Direct ManipulationDirect Manipulation
UUse the mouse to click and drag: • • WaveformsWaveforms• • Ground Reference IndicatorGround Reference Indicator
to new vertical positions, which changes the vertical offset, or to new horizontal positions, which changes the horizontal position or delay value.

Familiar File Management
www.eltesta.com
Standard Windows user interface allows you save and recall on PCs hard disks:
!! WWaveforms in various formatsaveforms in various formats!! WaveformWaveform DatabaseDatabase!! Scope setupsScope setups!! SScreen imagescreen images
Saving into Waveform File
Recalling Waveform DatabaseRecalling Setups

Copying a WaveformCopying a Waveform
www.eltesta.com
Clicking the CopyCopy button copies the programming window into the Window Clipboard. You can paste copied information in such Windows programs as Word, Corel Draw, Paint Brash, and etc.
22 Use CopyCopy function when preparing documentation based on usage of the UDSUDS--21282128.
Copy function includes four different options
Screen image copied with Invert Oscilloscope ScreenInvert Oscilloscope Screen option
UDSUDS--21282128 Copy function

AutoscaleAutoscaleGet waveform on screen quickly with AutoscaleAutoscale button.
22 AutoscaleAutoscale function adjusts an oscilloscope to display a stable trace of usable size and amplitude. The AutoscaleAutoscale feature of the UDSUDS--21282128 can quickly give you a stable, meaningful trace display.
Autoscale
The AustoscaleAustoscale button location
22 When you click the AutocaleAutocale button, you tell the UDSUDS--21282128 to examine the signal and adjust the following controls for optimum display:
! Vertical scale and offset.
! Time base scale and delay.
! Trigger level, if appropriate to that trigger source.
22 The AutoscaleAutoscale function can find repetitive signal with:
" Frequency greater than 1 1 kHkHzz.
" Duty cycle greater than 1 %.1 %.
" Vertical amplitude greater than 50 mV p50 mV p--pp.
" Trigger amplitude greater than 200 mV p200 mV p--pp.
www.eltesta.com
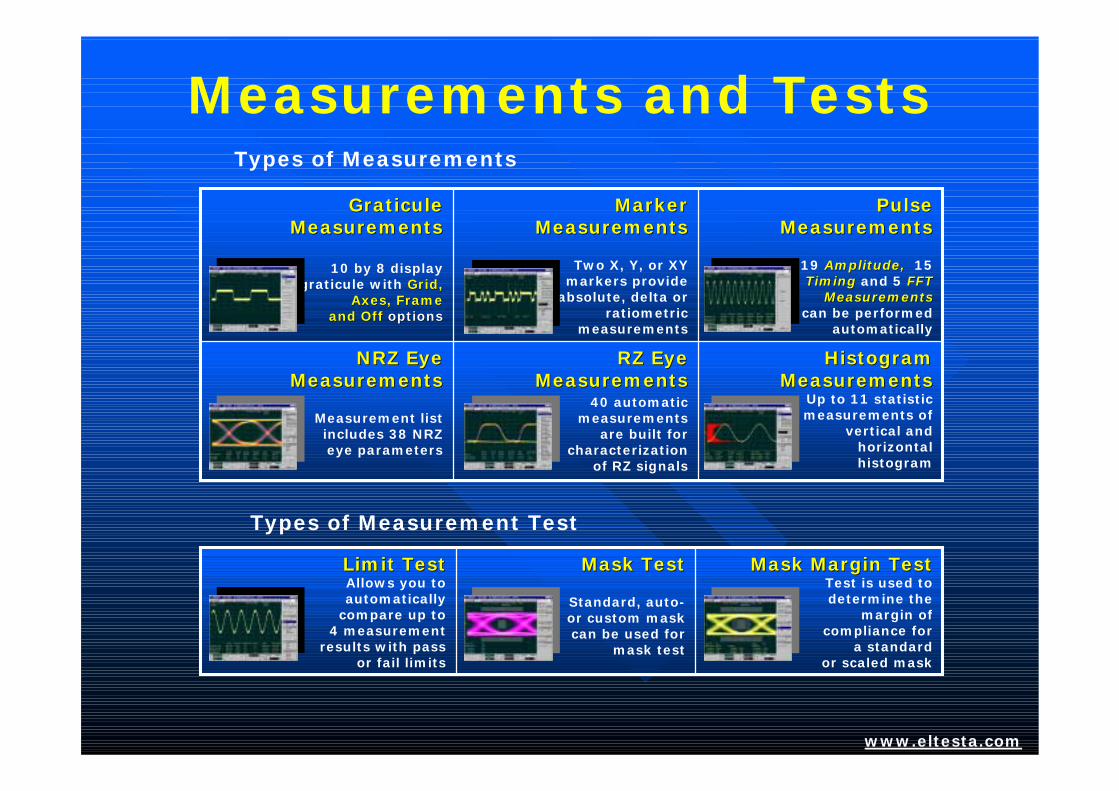
Measurements and Tests
www.eltesta.com
Histogram Histogram MeasurementsMeasurements
Up to 11 statistic measurements of
vertical and horizontal histogram
Pulse Pulse MeasurementsMeasurements
19 Amplitude, Amplitude, 15 Timing Timing and 5 FFT FFT
MeasurementsMeasurementscan be performed
automatically
Marker Marker MeasurementsMeasurements
Two X, Y, or XY markers provide
absolute, delta or ratiometric
measurements
GraticuleGraticuleMeasurementsMeasurements
10 by 8 display graticule with Grid, Grid,
Axes,Axes, Frame Frame andand OffOff optionsoptions
RZ Eye RZ Eye MeasurementsMeasurements
40 automatic measurements
are built for characterization
of RZ signals
NRZ Eye NRZ Eye MeasurementsMeasurements
Measurement list includes 38 NRZ eye parameters
Types of Measurements
Types of Measurement Test
Mask Margin Test Mask Margin Test Test is used to determine the
margin of compliance for
a standard or scaled mask
Mask TestMask Test
Standard, auto-or custom mask can be used for
mask test
Limit Test Limit Test Allows you to automatically
compare up to 4 measurement
results with pass or fail limits

Marker Customize MeasurementsMarkersMarkers are movable lines on the display that provide Customize Measurements. You set marker’s value by positioning them on the display. Their actual value, however, comes from internal data. This makes marker measurements more precise than graticules.
22 Marker Measurements:Marker Measurements:
" Absolute vertical (voltage)
" Ratiometric vertical (voltage)
" Absolute horizontal (timing)
" Ratiometric horizontal (timing)
MarkersMarkers measure timing shift of 11--GHzGHzsine-wave signal with 11--psps resolution www.eltesta.com
22 Best Marker Resolution:Best Marker Resolution:
" Voltage: 31.25 31.25 uVuV
" Time Interval: 0.2 0.2 psps
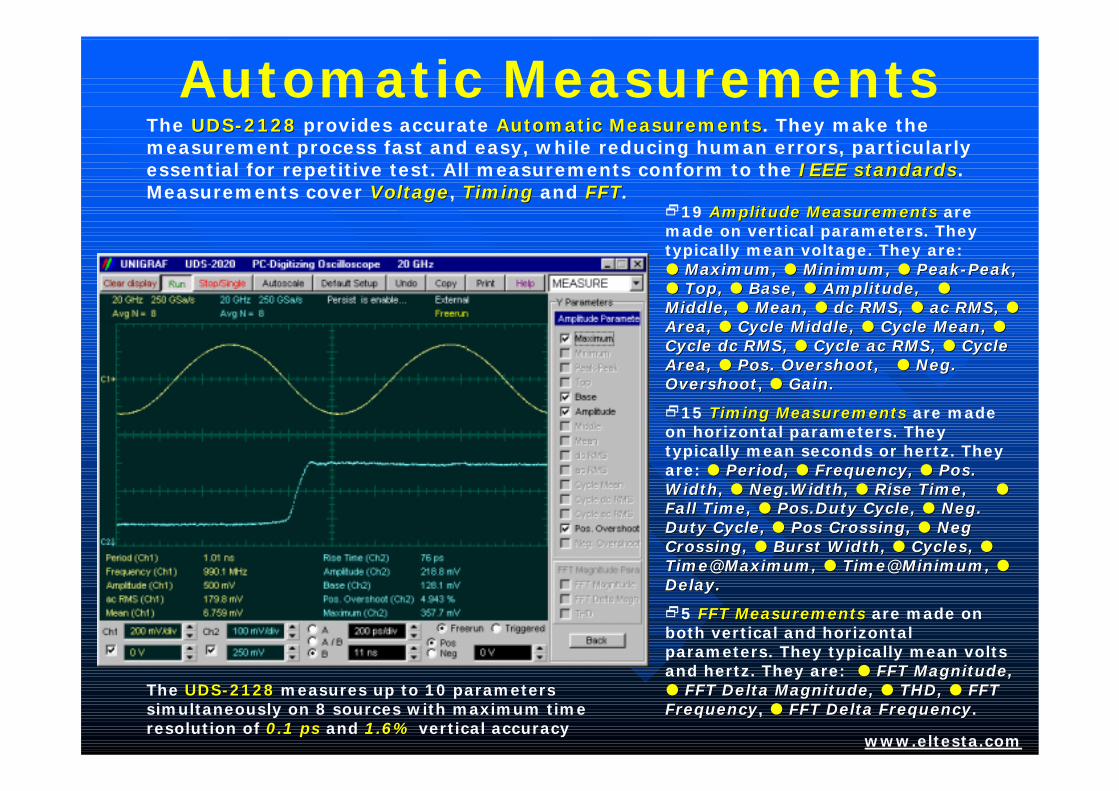
Automatic MeasurementsThe UDSUDS--21282128 provides accurate Automatic MeasurementsAutomatic Measurements. They make the measurement process fast and easy, while reducing human errors, particularly essential for repetitive test. All measurements conform to the IEEE standardsIEEE standards. Measurements cover VoltageVoltage, TimingTiming and FFTFFT.
219 Amplitude MeasurementsAmplitude Measurements are made on vertical parameters. They typically mean voltage. They are:!! Maximum, Maximum, !! Minimum, Minimum, !! PeakPeak--Peak, Peak, !! Top, Top, !! Base, Base, !! Amplitude, Amplitude, !!Middle,Middle, !! Mean, Mean, !! dc RMS, dc RMS, !! ac RMS, ac RMS, !!Area, Area, !! Cycle Middle, Cycle Middle, !! Cycle Mean, Cycle Mean, !!Cycle dc RMS, Cycle dc RMS, !! Cycle ac RMS, Cycle ac RMS, !! Cycle Cycle Area, Area, !! Pos. Overshoot, Pos. Overshoot, !! Neg. Neg. OvershootOvershoot, , !! Gain. Gain.
215 Timing MeasurementsTiming Measurements are made on horizontal parameters. They typically mean seconds or hertz. They are: !! Period, Period, !! Frequency, Frequency, !! Pos. Pos. Width, Width, !! Neg.Width, Neg.Width, !! Rise Time, Rise Time, !!Fall Time, Fall Time, !! Pos.Duty Cycle, Pos.Duty Cycle, !! Neg. Neg. Duty Cycle, Duty Cycle, !! Pos Crossing, Pos Crossing, !! NegNegCrossing, Crossing, !! Burst Width, Burst Width, !! Cycles, Cycles, !!Time@Maximum, Time@Maximum, !! Time@Minimum, Time@Minimum, !!Delay.Delay.
25 FFT MeasurementsFFT Measurements are made on both vertical and horizontal parameters. They typically mean volts and hertz. They are: !! FFT Magnitude, FFT Magnitude, !! FFT Delta Magnitude, FFT Delta Magnitude, !! THD, THD, !! FFT FFT FrequencyFrequency, !! FFT Delta FrequencyFFT Delta Frequency.
The UDSUDS--21282128 measures up to 10 parameters simultaneously on 8 sources with maximum time resolution of 0.1 0.1 psps and 1.6%1.6% vertical accuracy
www.eltesta.com

Statistics MeasurementsThe UDSUDS--21282128 measures up to 4 statistics parameters simultaneously
22 The Statistics function calculates the following values of the automatic measurement results:
!! Minimum!! Maximum!! Mean!! Standard Deviation!! Current Value!! Amount of measurements
22 Minimum and maximum are the absolute extremes of the automatic measurements.
22 Mean and standard deviation calculates the mean and standard deviation of the automatic measurement results.
22 Mean is the statistical average of all results for a particular measurement.
22 Standard deviation measures the dispersion of those measurement results.
www.eltesta.com
Simultaneous statistics measurements of PeriodPeriod, +Width+Width, AmplitudeAmplitude and TopTop parameters of 1212--MHzMHz Pulse

Histicons
www.eltesta.com
HisticonsHisticons are miniature histograms of parameter measurements that appear in Measurement Area. These thumbnail histograms let you see at a glance the statistical distribution of each parameter.
22 HisticonsHisticons provide a fast, dynamic view of parameters and wave shape characteristics.
Four HisticonsHisticonscorrespond to each of statistics measurement

Mathematics
An examples of UDSUDS--21282128 Math Functions.F1=Ch1+Ch2 F2=Ch1-Ch2F3=Diff(Ch1) F4=Inv(Ch2)
Functional transformation of an acquired waveform
The UDSUDS--21282128 supports up to four simultaneous mathematical combination and functional transformation of waveforms that is acquires.
22 You can select any of the math functions as a math operator to act on the operand or operands. A waveform math operator is a math function that requires either one or two sources.
The operators that involve two waveform sources are: !! Add, !! Subtract,!! Multiply, and !! Divide.
The operators that involve one waveform source are: !! Invert, !! Absolute, !! Exponent (e), !! Exponent (10), !! Logarithm (e), !! Logarithm (10), !! Differentiate, !! Integrate, !! InverseFFT, !! Linear Interpolation, !! Smoothing, !! Trend and !! Sin(x)/x Interpolation.
www.eltesta.com
Source (operand) waveform (Ch1)
Math function (operator, Divide)
Math function(waveform F1)
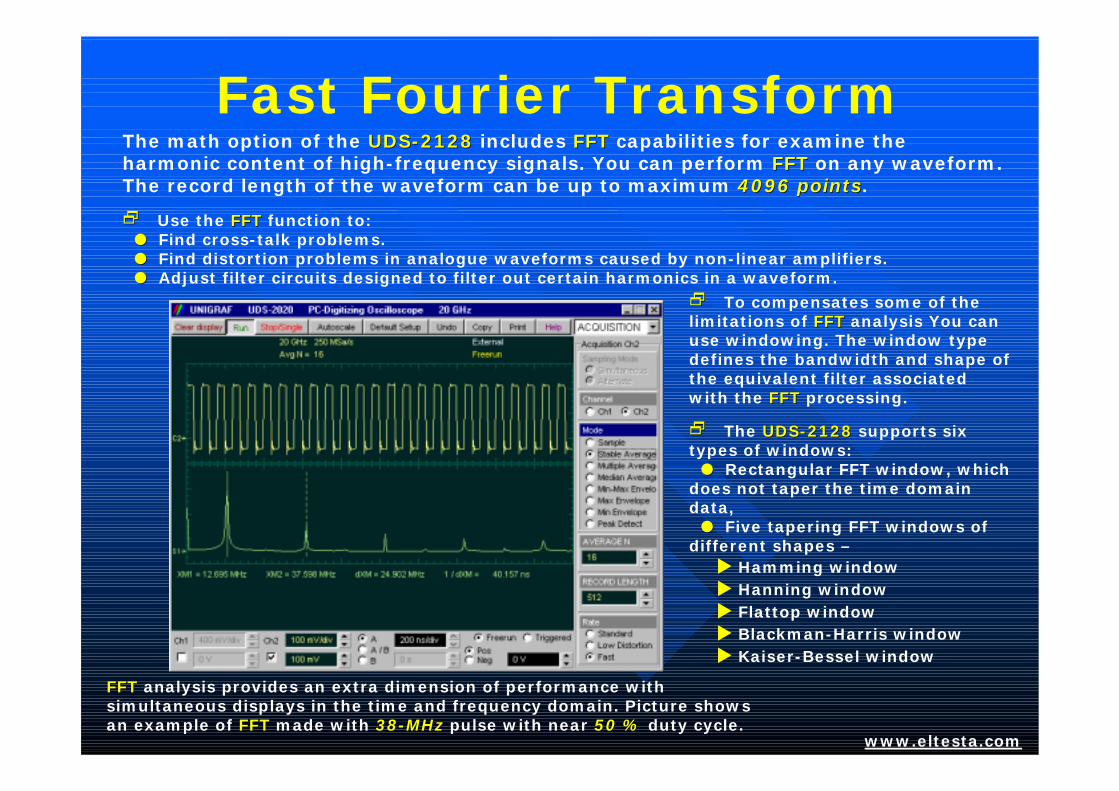
Fast Fourier Transform
FFTFFT analysis provides an extra dimension of performance with simultaneous displays in the time and frequency domain. Picture shows an example of FFTFFT made with 3838--MHzMHz pulse with near 50 %50 % duty cycle.
The math option of the UDSUDS--21282128 includes FFTFFT capabilities for examine the harmonic content of high-frequency signals. You can perform FFTFFT on any waveform. The record length of the waveform can be up to maximum 4096 points4096 points.
22 Use the FFTFFT function to:!! Find cross-talk problems.!! Find distortion problems in analogue waveforms caused by non-linear amplifiers.!! Adjust filter circuits designed to filter out certain harmonics in a waveform.
22 To compensates some of the limitations of FFTFFT analysis You can use windowing. The window type defines the bandwidth and shape of the equivalent filter associated with the FFTFFT processing.
22 The UDSUDS--21282128 supports six types of windows: !! Rectangular FFT window, which
does not taper the time domain data, !! Five tapering FFT windows of
different shapes –! Hamming window! Hanning window! Flattop window! Blackman-Harris window! Kaiser-Bessel window
www.eltesta.com

Trend FunctionTrendTrend is a math function that represents the evolution of timing parameters in line graphs whose vertical axes are the value of the parameter, and horizontal axes the order in which the values were acquired.
www.eltesta.com
22 The UDSUDS--21282128 makes period measurement of pulses
22 Trend of period measurement is displayed as a math function
22 Amplitude measurement of trend function gives evolution of period value

Vertical Histogram
An example of Vertical Histogram MeasurementVertical Histogram Measurement
A histogramhistogram is a probability distribution that shows the distribution of acquired data from a source within a user-definable histogram window.
22 The information gathered by the histogram is used to perform statistical analysis on the source. The most common use for vertical histogram is measuring and characterizing noise on displayed waveforms.
The list of histogram statistics:! ScaleScale--ScaleScale lists the display scale in hits per
division or dB per division.! OffsetOffset lists the offset in hits or dB. Offset is
the number of hits or dB at the bottom of the display, as opposed to the center of the display.
! Hits in BoxHits in Box-The total number of samples included in the histogram box.
! WaveformsWaveforms - Displays the number of waveforms that have contributed to the histogram.
! Peak HitsPeak Hits - The number of hits in the histogram’s greatest peak.
! PkPk –– PkPk - The width of histogram. ! MedianMedian - 50 % of the histogram samples are
above the median and 50% are below the median.! Mean Mean -- MeanMean is the average value of all the
points in the histogram. ! StdDevStdDev - The Standard deviation (σσσσ) value of
the histogram.! µµµµµµµµ ±±±±±±±± 11 StdDevStdDev, , µµµµµµµµ ±±±±±±±± 22 StdDevStdDev, , µµµµµµµµ ±±±±±±±± 33 StdDevStdDev - The
percentage of points that are within ±±±± 1σσσσ, ±±±± 2σσσσ, or ±±±±3σσσσ of the mean value.
www.eltesta.com

Statistical Analysis of NoiseStatistical Analysis of NoiseVertical HistogramVertical Histogram is the most common use for measuring and characterizing noise on displayed waveforms.
www.eltesta.com
Picture shows noise measurement with Vertical HistogramVertical Histogram of ECL high voltage level.
22 The UDSUDS--21282128 has a very low “noise floor” (<2 mV<2 mV of internal noise RMS), making noise measurements very accurate.
22 Sizing the histogram window to a narrow portion of time and observing a vertical histogram that measures the noise on an edge measure noise

Horizontal HistogramHorizontal Histogram
An example of Jitter MeasurementJitter Measurementwith Horizontal HistogramHorizontal Histogram
A histogramhistogram is a probability distribution that shows the distribution of acquired data from a source within a user-definable histogram window. The information gathered by the histogram is used to perform statistical analysis on the source. The most common use for horizontal histogram is measuring and characterizing jitter on displayed waveforms
www.eltesta.com
22 The list of histogram statistics:! ScaleScale--ScaleScale lists the display scale in hits per
division or dB per division.! OffsetOffset lists the offset in hits or dB. Offset is
the number of hits or dB at the bottom of the display, as opposed to the center of the display.! Hits in BoxHits in Box-The total number of samples
included in the histogram box.! WaveformsWaveforms - Displays the number of
waveforms that have contributed to the histogram.! Peak HitsPeak Hits - The number of hits in the
histogram’s greatest peak.! PkPk –– PkPk - The width of histogram. ! MedianMedian - 50 % of the histogram samples are
above the median and 50% are below the median.! Mean Mean -- MeanMean is the average value of all the
points in the histogram. ! StdDevStdDev - The Standard deviation (σσσσ) value of
the histogram.! µµµµµµµµ ±±±±±±±± 11 StdDevStdDev, , µµµµµµµµ ±±±±±±±± 22 StdDevStdDev, , µµµµµµµµ ±±±±±±±± 33 StdDevStdDev - The
percentage of points that are within ±±±± 1σσσσ, ±±±± 2σσσσ, or ±±±± 3σσσσ of the mean value.

Jitter Jitter MesurementsMesurements
EyeEye--Crossing JitterCrossing Jitter can be quantified with horizontal histogram. Two examples of NRZ Eye PatternNRZ Eye Pattern with jitter histogram
www.eltesta.com
Among other things Jitter is caused by:
! Loop bandwidth, deadLoop bandwidth, dead--band band oscillationsoscillations
Circuit instabilities
! Cabling or wiring, from distance Cabling or wiring, from distance sourcessources
Injected noise (EMI/RFI)
! From power supplies and From power supplies and oscillators, with harmonic contentoscillators, with harmonic content
Upstream reference clocks
! Random and ever changing, Random and ever changing, always always GaussianGaussian
Thermal noise 22 Types of Jitter:
!! Period Jitter!! Cycle-to-Cycle Jitter!! Delay Jitter!! Time Interval Error!! Clock Jitter!! Data Jitter

Histogram Measurements: acquiring statistically significant amount of data
100 100 wfmswfms, 1 s, 1 s
1 000 1 000 wfmswfms, 10 s, 10 s
10 000 10 000 wfmswfms, 100 s, 100 s
www.eltesta.com
22 Larger sample of data 22 Three-dimensional accumulation
22 Parametric measure-ments derived from the database use statistical technique to produce more stable, accurate results

Histogram Measurements of Eye Diagrams
The left picture demonstrates how the UDSUDS--21282128 quickly measures all parameters of vertical histogram for 1212--GbitGbitEye Diagram
www.eltesta.com
The right picture demonstrates how the UDSUDS--21282128 quickly measures all parameters of horizontal histogram for 1212--GbitGbit Eye Diagram

UDS-2128 Solutions up to 10 Gbit
! <2.5 <2.5 psps, , <2.0 <2.0 ps typps typ
Trigger Jitter, RMS
! 100 100 WfmsWfms/s/sAcquisition Speed
! 10 10 TsaTsa/s/s, equivalent
Sampling Rate
! 20 GHz20 GHzBandwidth
Key UDSUDS--21282128 Specifications for Telecom/Datacom Measurements
Histogram
Mask Margins
Mask Test
Eye Diagram
UDSUDS--21282128 Telecom/DatacomMeasurements
www.eltesta.com
The UDSUDS--21282128 provides wide range solutions for testing of 10 10 GbitGbit signals

Telecom/Datacom Industry Standards
2.500 2.500 GbGb/s/s10.51875 10.51875 GbGb/s/s Infiniband10X FC
3.187 3.187 GbGb/s/s39.81239.812 GbGb/s/s42.6569142.65691 GbGb/s/s43.0184143.01841 GbGb/s/s
DATACOMM/ELECTRICAL/OPTICAL
FC3187STM256/OC768
3.125 3.125 GbGb/s/s
9.953 9.953 GbGb/s/s10.3125 10.3125 GbGb/s/s12.5 12.5 GbGb/s/s
2.500 2.500 GbGb/s/s
1250 Mb/s1250 Mb/s
2125 Mb/s2125 Mb/s
1063 Mb/s1063 Mb/s
531 Mb/s531 Mb/s
266 Mb/s266 Mb/s
133 Mb/s133 Mb/s
XAUI
DATACOMM/ELECTRICAL/OPTICAL
10XGB Ethernet
2XGB Ethernet
GB Ethernet
DATACOMM/ELECTRICAL/OPTICAL
" IEEE 802.3ae (Gigabit Ethernet)
FC531 621.8 Mb/s621.8 Mb/sSTM4/OC12
FC10632.4882.4883232 GbGb/s/sSTM16/OC48
FC266155.5 Mb/s155.5 Mb/sSTM1/OC3
FC21259.9539.953 GbGb/s/s10.664 10.664 GbGb/s /s 10.709 10.709 GbGb/s/s12.2494512.24945 GbGb/s /s
STM64/OC192
FC13351.8 Mb/s51.8 Mb/sSTM0/OC1
DATACOMM/ELECTRICAL/OPTICAL" ANSI X3.230
(Fiber Channel)
TELECOM/OPTICAL" Bellcore GR-253-CORE and ANSI T1.106 (SONET OC-n signals)" ITU-T G.957 (SDH STM-n signals)
www.eltesta.com
UDSUDS--21282128 supports measurements of signal integrity for the following Telecom/Datacom Industry Standards

Digital Communication Measurements
www.eltesta.com
Common MeasurementsCommon Measurements
22 Bit Error Ratio (BER)Bit Error Ratio (BER)
22 Eye Diagram AnalysisEye Diagram Analysis
22 Jitter MeasurementsJitter Measurements
Error
DUT10100100
10100100
10100100
Device TestingDevice Testing
22 Protocol TestingProtocol Testing
22 Serial DeviceSerial Device
22 MUXMUX
22 DMUXDMUX
Two examples of 12-Gbps Pattern

Building Eye Diagram
22 Eye Diagram Problems with Sequential Sampling Oscilloscope:
!! It is not possible to resolve pattern dependencies!! Averaging is not available!! Input Dynamic Range is ±350 mV!! Random Noise and pattern dependent,
deterministic errors mask each other
www.eltesta.com
22 Eye DiagramEye Diagram is valuable because of comprehensive view of all signal integrity faults(except clock jitter):
!! Noise!! Jitter!! Reflections!! Ringing!! Inter-symbol interference!! Power and ground coupling
Process of building Eye Diagram includes serial acquisitions of waveform data base
3 4 521 6 7 8
Resulting eye diagram

A typical UDS-2128 Eye Diagram with Mask, Margins and Histogram
www.eltesta.com
CustomizeableMaskMask with MarginsMargins
HistogramHistogram window
2.52.5--GbGb/s/sEye DiagramEye Diagram
Using HistogramHistogram on the eye crossing to characterize jitter
HistogramHistogrammeasurement results
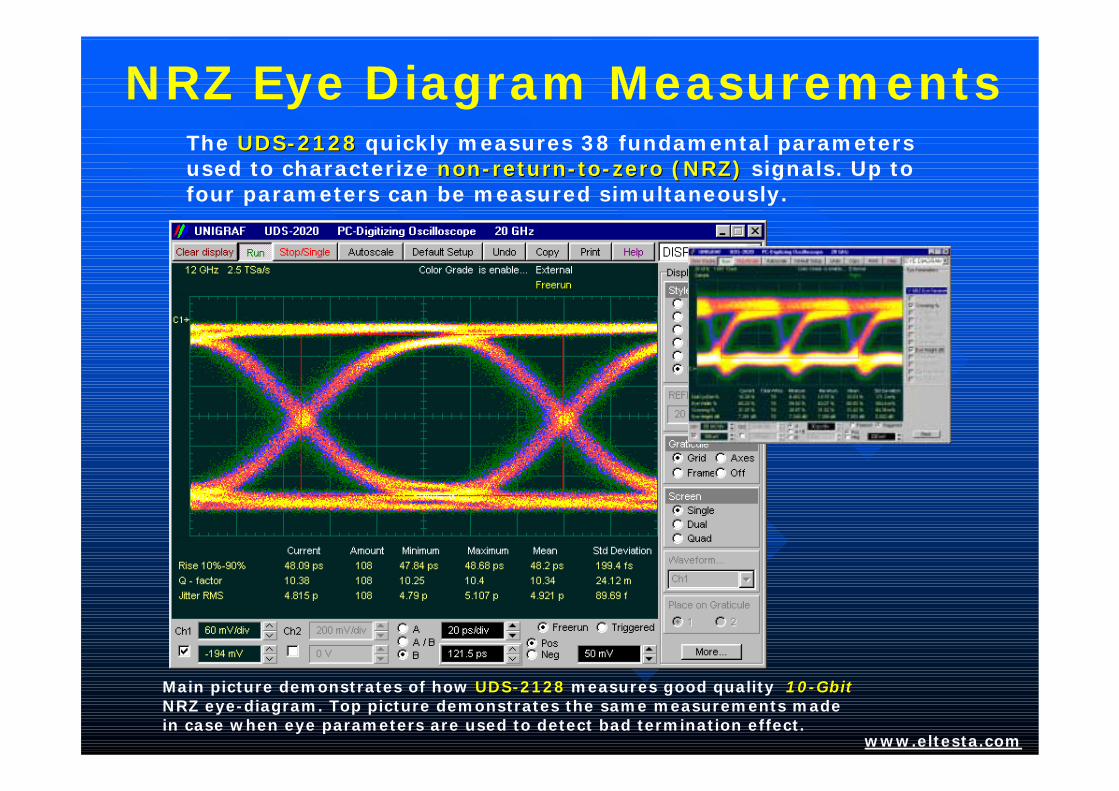
NRZ Eye Diagram MeasurementsThe UDSUDS--21282128 quickly measures 38 fundamental parameters used to characterize nonnon--returnreturn--toto--zero (NRZ)zero (NRZ) signals. Up to four parameters can be measured simultaneously.
Main picture demonstrates of how UDSUDS--21282128 measures good quality 1010--GbitGbitNRZ eye-diagram. Top picture demonstrates the same measurements made in case when eye parameters are used to detect bad termination effect.
www.eltesta.com

Examples of NRZ Measurements
www.eltesta.com
Timing measurements of 2.52.5--GbitGbit Eye Diagram
Timing measurements of 9.59.5--GbitGbit Eye DiagramCrossing measurement of high-distorted 1212--GbitGbit Eye Diagram
Timing measurements of 155155--MbitMbit Eye Diagram
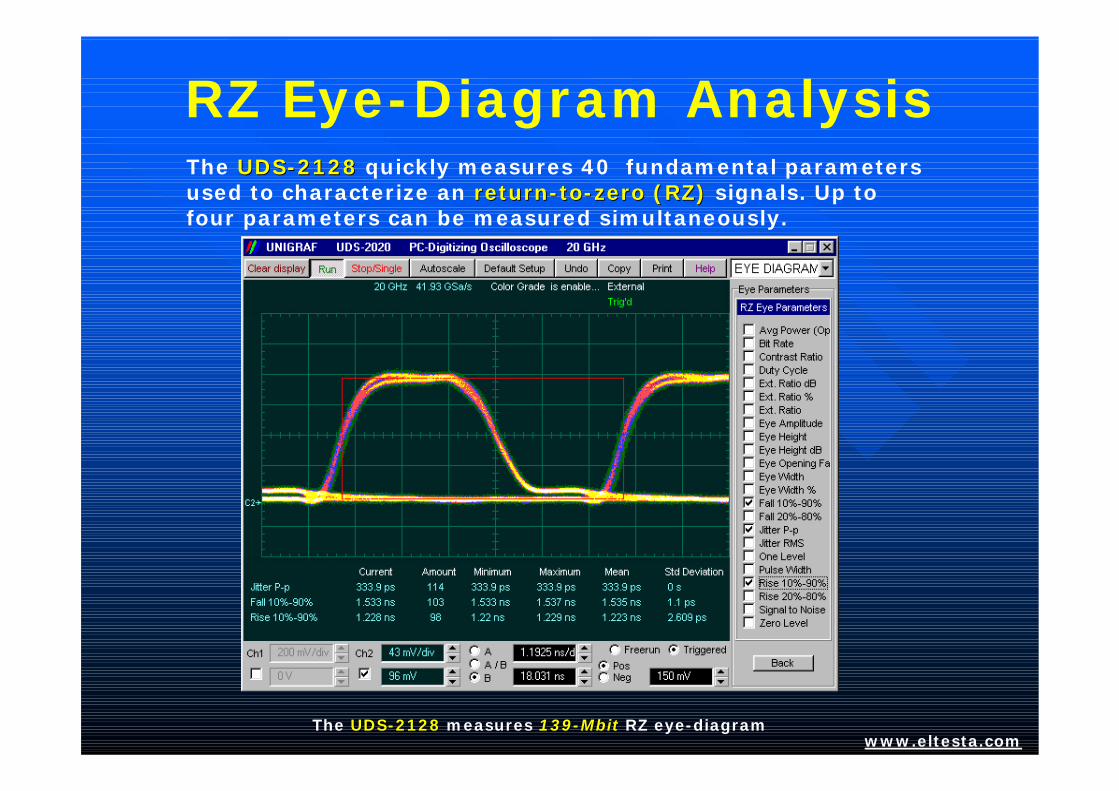
RZ Eye-Diagram AnalysisThe UDSUDS--21282128 quickly measures 40 fundamental parameters used to characterize an returnreturn--toto--zero (RZ)zero (RZ) signals. Up to four parameters can be measured simultaneously.
The UDSUDS--21282128 measures 139139--MbitMbit RZ eye-diagramwww.eltesta.com

Clock Recovery TriggeringVery high-speed oscilloscopes are not capable of triggering directly on the signal under test. Typically an external timing reference is used to synchronize the oscilloscope to the test signal. In cases where a trigger signal is not available, clock recovery modulesclock recovery modulesare available to derive a timing reference directly from the waveform to be measured.
Same 2.5 2.5 GbGb/s/s (OC(OC--48/STM48/STM--16)16) real signal from TelesteRooter communication equipment triggered on a data signal with UDXUDX--P01 P01 Head (top picture) gives 20 20 psps RMS jitter, and the more accurate recovered with UDXUDX--R02R02 Head clock signal with less then 1111 psps RMS Jitter (main picture). www.eltesta.com
The UDXUDX--R0XR0X series of clock recovery modules cover the most popular electrical lines used today. Both two modules have excellent jitter performance to ensure accurate measurement.22 The UDXUDX--R01R01 covers 622 Mbps OC12/STM4622 Mbps OC12/STM4 bit rate 22 The UDXUDX--R02R02 covers 2.4882.488 GbpsGbps OC48/STM16OC48/STM16 bit rate
22 Clock Recovery TriggerClock Recovery Triggerprovides:
! No external clock signal trigger is required
! Low frequency jitter rejection expose pattern dependent anomalies or dropouts that edge detection would miss
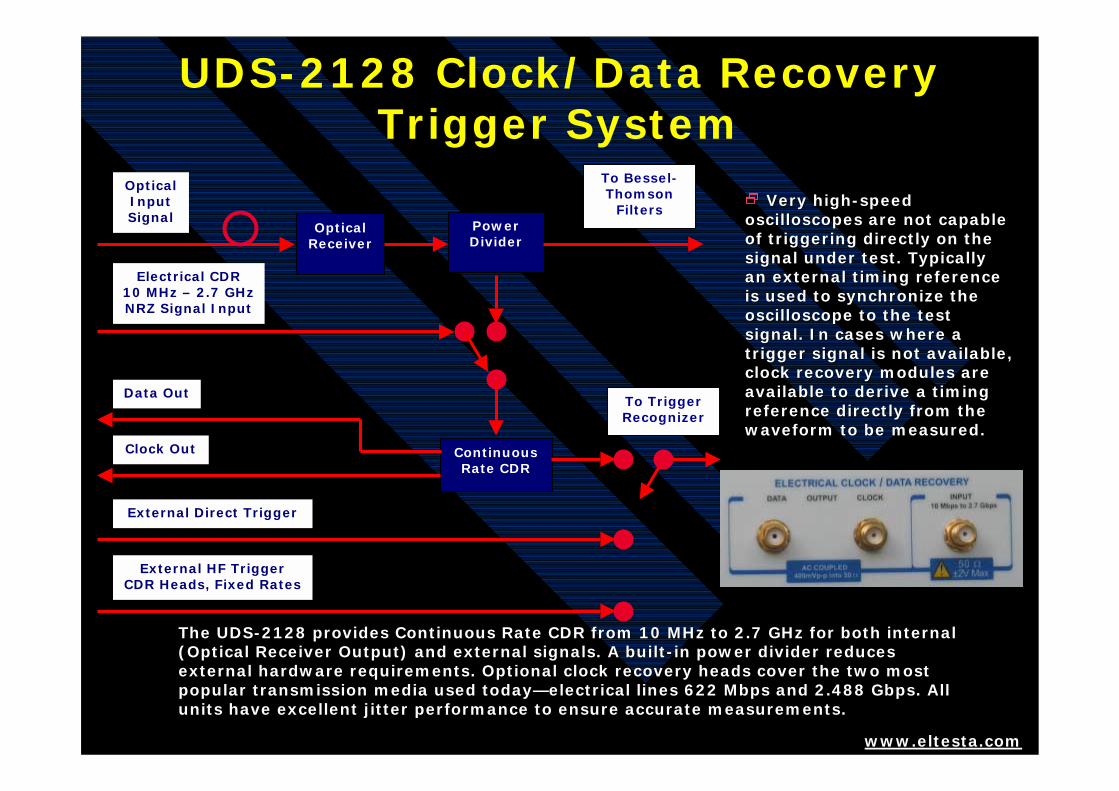
UDS-2128 Clock/Data Recovery Trigger System
2 Very highVery high--speed speed oscilloscopes are not capable oscilloscopes are not capable of triggering directly on the of triggering directly on the signal under test. Typically signal under test. Typically an external timing reference an external timing reference is used to synchronize the is used to synchronize the oscilloscope to the test oscilloscope to the test signal. In cases where a signal. In cases where a trigger signal is not available, trigger signal is not available, clock recovery modules are clock recovery modules are available to derive a timing available to derive a timing reference directly from the reference directly from the waveform to be measured. waveform to be measured.
www.eltesta.com
Optical Receiver
Optical Input Signal
Power Divider
To Bessel-Thomson
Filters
Electrical CDR10 MHz – 2.7 GHz NRZ Signal Input
Continuous Rate CDR
Data Out
Clock Out
External Direct Trigger
External HF TriggerCDR Heads, Fixed Rates
To Trigger Recognizer
The UDSThe UDS--2128 provides Continuous Rate CDR from 10 MHz to 2.7 GHz for bot2128 provides Continuous Rate CDR from 10 MHz to 2.7 GHz for both internal h internal (Optical Receiver Output) and external signals. A built(Optical Receiver Output) and external signals. A built--in power divider reduces in power divider reduces external hardware requirements. Optional clock recovery heads coexternal hardware requirements. Optional clock recovery heads cover the two most ver the two most popular transmission media used todaypopular transmission media used today——electrical lines 622 Mbps and 2.488 electrical lines 622 Mbps and 2.488 GbpsGbps. All . All units have excellent jitter performance to ensure accurate measuunits have excellent jitter performance to ensure accurate measurements. rements.

Optical and Electrical MeasurementsOptical and Electrical Measurements
www.eltesta.com
UDSUDS--212821282.5 Gbps Optical/ Electrical Source
Power Splitter
UDXUDX--R01R01 Clock Recovery Head
Equipment connections for parallel optical and electrical measurements
Top: 2.5-Gbps electrical eye-diagram.Bottom: 2.5-Gbps optical eye-diagram.
Top: 2.5-Gbps electrical eye-diagram.Bottom: 2.5-Gbps optical eye-diagram with OC-48 Bessel-Thompson Filter .
Extinction Ratio Measurements with filtered 2.5-Gbps optical eye-diagram.

OCOC--3 Laser Measurements3 Laser Measurements
Eye-Diagram Measurements with LP-Filtering: Mini-Circuits Model NLP-200
Source: Anritsu 1570A Sonet/SDH AnalyzerSignal: Optical 1,31 um, -8 dBm, OC3Trigger: Locked to signalOE-Converter: IR 10 GHz, S/N IC-0001
Source: Anritsu 1570A Sonet/SDH, Analyzer, Signal: Optical 1,55 um, -3 dBm, OC3, Trigger: Locked to data, OE-converter S/N IC-0001, 11.09.2003
www.eltesta.com
Noise measurement with No LP-Filtering

OCOC--12 Laser Measurements12 Laser Measurements
Eye-Diagram Measurements with LP-Filtering: OE-Converter: IR 10 GHz (Actually 9 GHz), S/N IC-0001LPF: Mini-Circuits Model NLP-750
Source: Anritsu 1570A Sonet/SDH AnalyzerSignal: Optical 1,31 um, -8 dBm, OC12Trigger: Locked to signal, Direct input
Source: Anritsu 1570A Sonet/SDH AnalyzerSignal: Optical 1,55 um, -3 dBm, OC12Trigger: Locked to signal, Direct inpu
www.eltesta.com
Waveform with No LP-Filtering

OCOC--48 Laser Measurements48 Laser Measurements
Eye-Diagram Measurements with LP-Filtering
LP-Filtering: Mini-Circuits Model NLP-2950 (-3 dB BW about 3 GHz)
Eye-Diagram Measurements with No LP-Filtering
www.eltesta.com
Source: Anritsu 1570A Sonet/SDH AnalyzerSignal: Optical 1,31 um, -4 dBm, OC48Trigger: 156 MHz, Direct InputOE-Converter: IR 10 GHz, S/N IC-0001
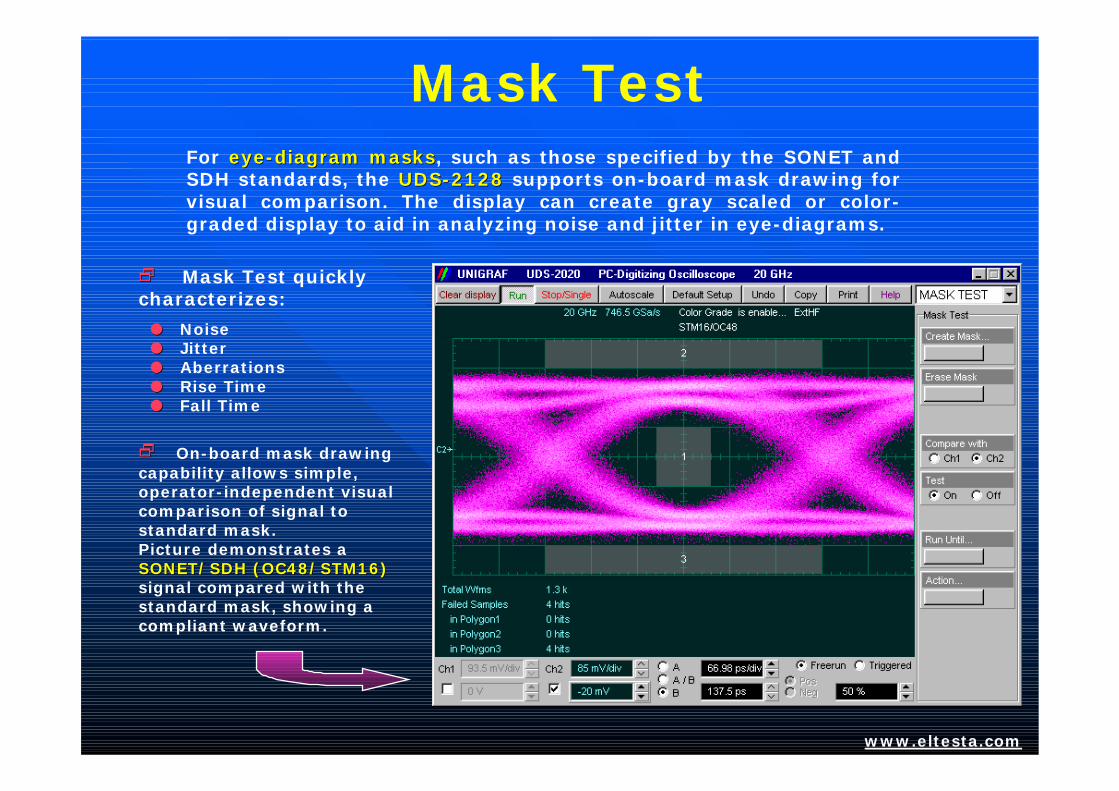
Mask TestFor eyeeye--diagram masksdiagram masks, such as those specified by the SONET and SDH standards, the UDSUDS--21282128 supports on-board mask drawing for visual comparison. The display can create gray scaled or color-graded display to aid in analyzing noise and jitter in eye-diagrams.
22 On-board mask drawing capability allows simple, operator-independent visual comparison of signal to standard mask. Picture demonstrates a SONET/SDH (OC48/STM16)SONET/SDH (OC48/STM16)signal compared with the standard mask, showing a compliant waveform.
22 Mask Test quickly characterizes:
!! Noise!! Jitter!! Aberrations!! Rise Time!! Fall Time
www.eltesta.com

Creating Custom MaskCreating Custom Mask
www.eltesta.com
Five pictures below demonstrate how UDSUDS--21282128 builds Custom MaskCustom Mask for NRZ waveform
1. Create the top Polygon of the Mask
2. Create the center Polygon of the Mask
3. Create the bottom Polygon of the Mask
4. Create full Mask 5. Perform Mask Test
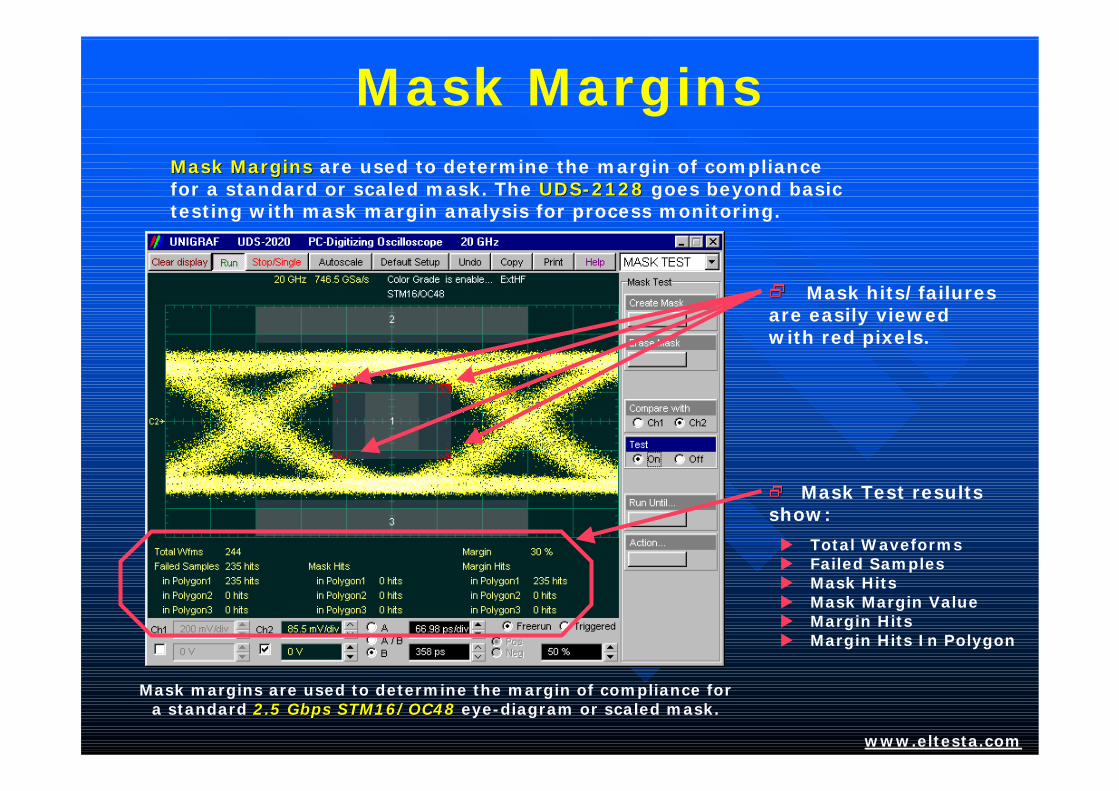
Mask MarginsMask MarginsMask Margins are used to determine the margin of compliance for a standard or scaled mask. The UDSUDS--21282128 goes beyond basic testing with mask margin analysis for process monitoring.
Mask margins are used to determine the margin of compliance for a standard 2.52.5 GbpsGbps STM16/OC48STM16/OC48 eye-diagram or scaled mask.
www.eltesta.com
22 Mask hits/failures are easily viewed with red pixels.
22 Mask Test results show:
! Total Waveforms! Failed Samples! Mask Hits! Mask Margin Value! Margin Hits! Margin Hits In Polygon

Examples of Mask Test
www.eltesta.com
Mask Test and 20-% Margin Test performed for a standard 2.52.5 GbpsGbps STM16/OC48STM16/OC48 eye-diagram.
Mask Test and 20-% Margin Test performed for a standard 9.95 9.95 GbpsGbps STM64/OC192STM64/OC192 eye-
diagram.

On-Fly Limit TestThe UDSUDS--21282128 offers fully automatic pass-fail limit testing. You can built a limit template from acquired waveforms or download a template from disk.
The UDSUDS--21282128’’ss automatic, on-the-fly limit testing makes manufacturing pass-fail testing simple.
www.eltesta.com
22 Using a reference waveform method (AutomaskAutomask), masks are constructed by adding a DELTA XDELTA X and DELTA Ytolerance around a reference waveform. This method is simple to use, though not as flexible as the polygon method.
22 Mask Test results show:
! Total Waveforms! Failed Samples! Hits In Polygon
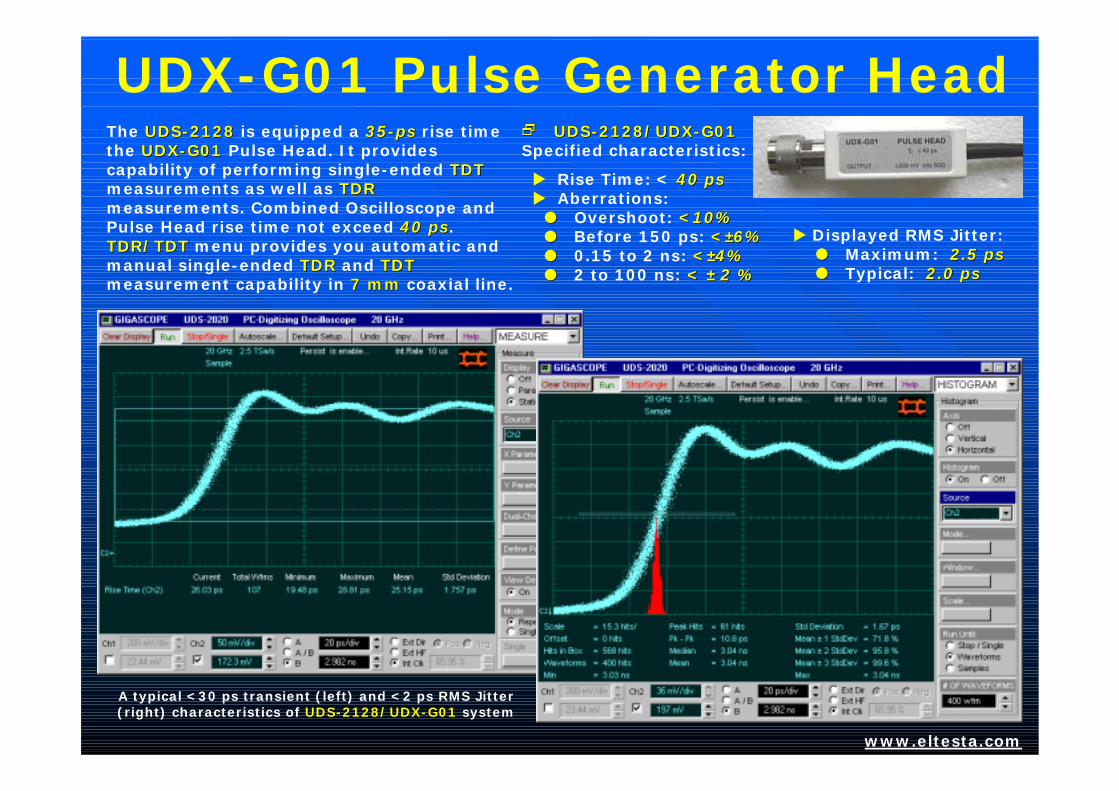
UDX-G01 Pulse Generator HeadThe UDSUDS--21282128 is equipped a 3535--psps rise time the UDXUDX--G01G01 Pulse Head. It provides capability of performing single-ended TDTTDTmeasurements as well as TDRTDRmeasurements. Combined Oscilloscope and Pulse Head rise time not exceed 4040 psps. TDR/TDTTDR/TDT menu provides you automatic and manual single-ended TDRTDR and TDTTDTmeasurement capability in 7 mm7 mm coaxial line.
A typical <30 ps transient (left) and <2 ps RMS Jitter (right) characteristics of UDSUDS--2128/UDX2128/UDX--G01G01 system
22 UDSUDS--2128/UDX2128/UDX--G01G01Specified characteristics:
! Rise Time: < 40 40 psps! Aberrations:!! Overshoot: <10%<10%!! Before 150 ps: <<±±6%6%!! 0.15 to 2 ns: <<±±4% 4% !! 2 to 100 ns: < < ±± 2 %2 %
www.eltesta.com
UDXUDX--G01G01Pulse Head
! Displayed RMS Jitter: !! Maximum: 2.5 2.5 psps!! Typical: 2.0 2.0 psps

Distributed Discontinuities
www.eltesta.com
Connector Capacitive Discontinuity
Inductance Discontinuity
Open Circuit
Volts or ρρρρ
Time or Distance
Z0 Z1 Z0 Z2 Z0
t1 t2
1
1
2ZtC =
222tZL =
0
50
100
22 Typical TDRTDR Applications:
TDR Measurement are used to characterize the signal transmission properties of:
! Printed Circuit Boards! Connectors! IC Packages! Cables and Interconnects
TDR MeasurementTDR Measurement are used to characterize the signal transmission properties

Mask Test for Impedance profileMask Test for Impedance profileUsing the AutomaskAutomask testing cabality of the UDSUDS--21282128you can perform TDRTDR go/no-go testing in impedances in circuit board runs, IC packages and cables
www.eltesta.com
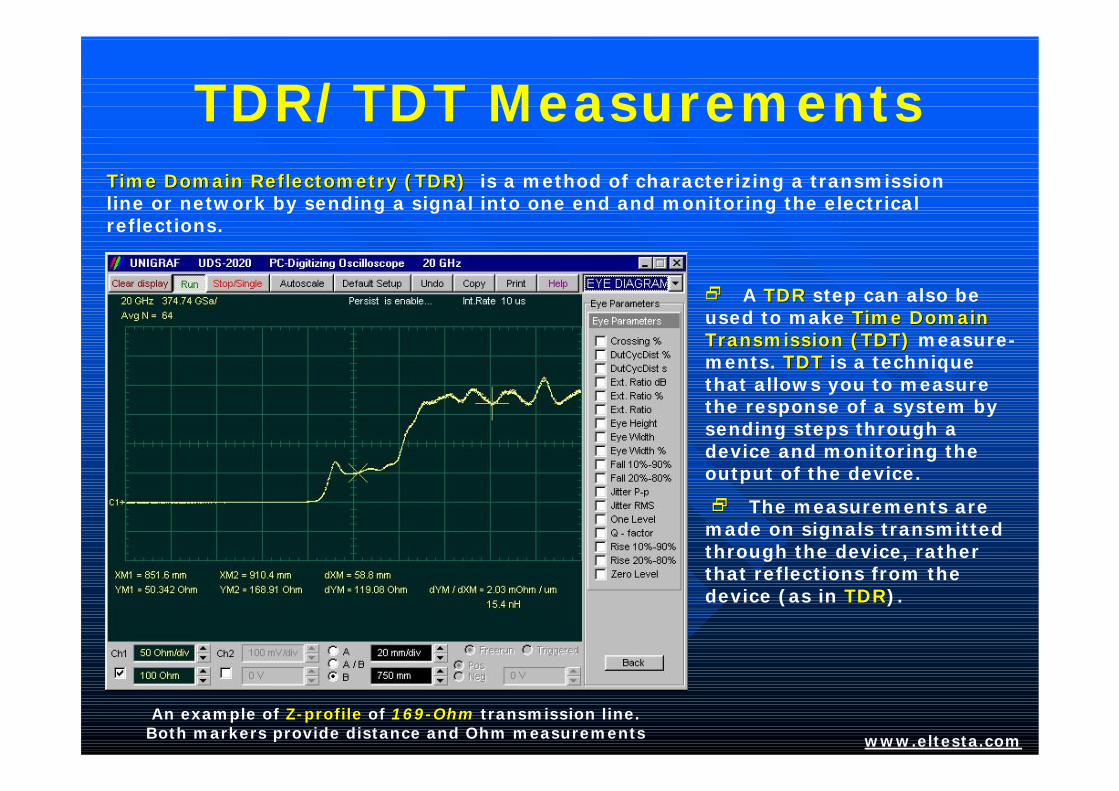
TDR/TDT MeasurementsTime Domain Time Domain Reflectometry Reflectometry (TDR) (TDR) is a method of characterizing a transmission line or network by sending a signal into one end and monitoring the electrical reflections.
22 A TDRTDR step can also be used to make Time Domain Time Domain Transmission (TDT)Transmission (TDT) measure-ments. TDTTDT is a technique that allows you to measure the response of a system by sending steps through a device and monitoring the output of the device.
22 The measurements are made on signals transmitted through the device, rather that reflections from the device (as in TDRTDR).
An example of ZZ--profileprofile of 169169--OhmOhm transmission line. Both markers provide distance and Ohm measurements www.eltesta.com
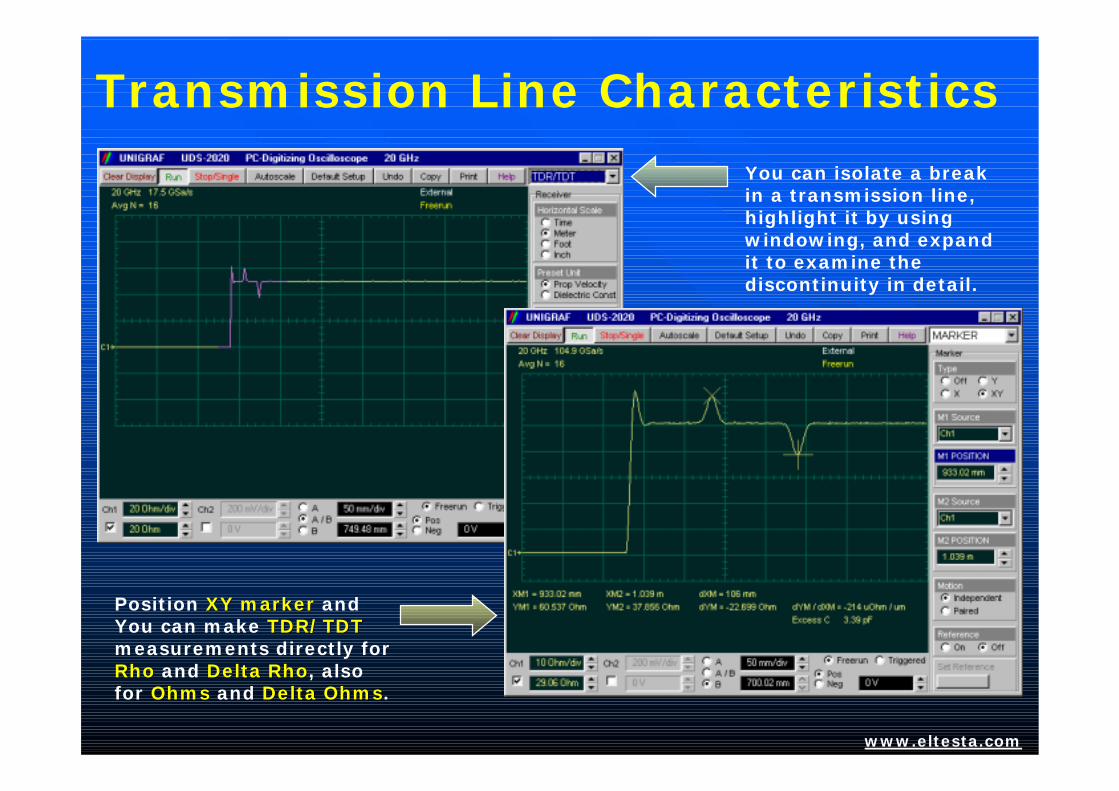
Transmission Line CharacteristicsYou can isolate a break in a transmission line, highlight it by using windowing, and expand it to examine the discontinuity in detail.
Position XY markerXY marker and You can make TDR/TDTTDR/TDTmeasurements directly for RhoRho and Delta Delta RhoRho, also for OhmsOhms and Delta OhmsDelta Ohms.
www.eltesta.com
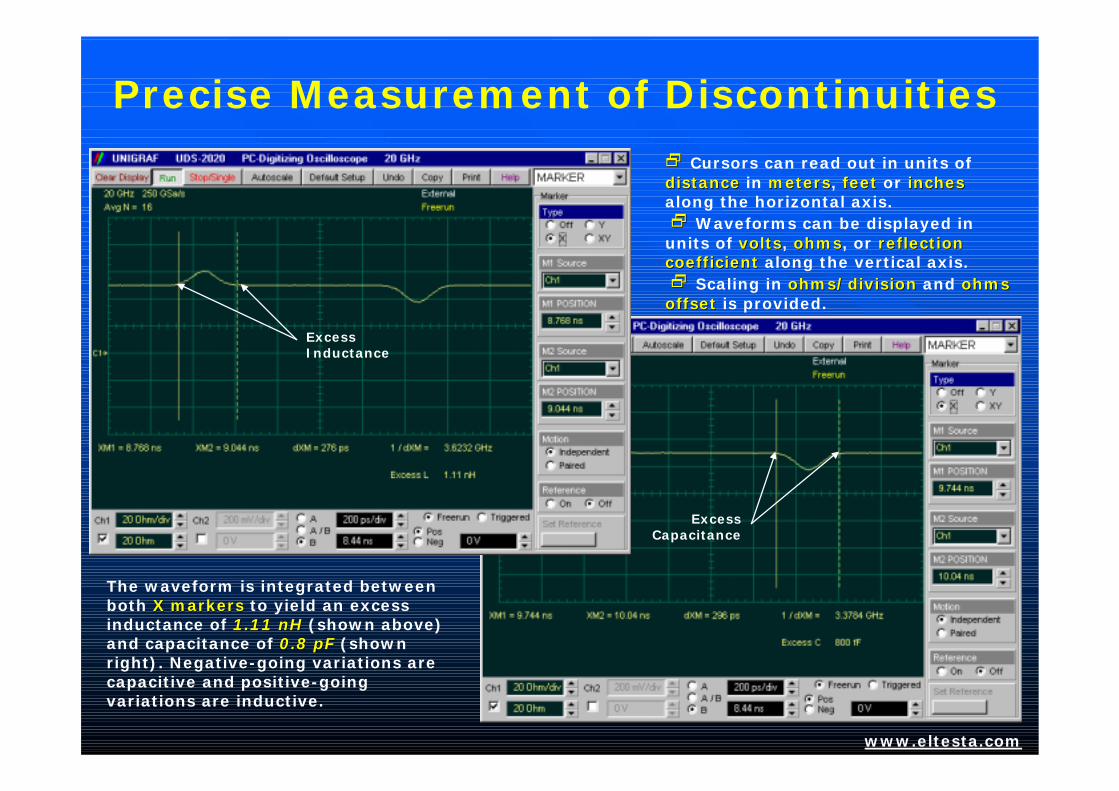
Precise Measurement of Discontinuities
www.eltesta.com
The waveform is integrated between both X markersX markers to yield an excess inductance of 1.11 1.11 nHnH (shown above) and capacitance of 0.8 0.8 pFpF (shown right). Negative-going variations are capacitive and positive-going variations are inductive.
22 Cursors can read out in units of distancedistance in metersmeters, feetfeet or inchesinchesalong the horizontal axis.22 Waveforms can be displayed in
units of voltsvolts, ohmsohms, or reflection reflection coefficientcoefficient along the vertical axis. 22 Scaling in ohms/divisionohms/division and ohms ohms offsetoffset is provided.
Excess Inductance
Excess Capacitance

BuiltBuilt--In Information System (Help)In Information System (Help)Built-in information system helps to find the information you need to use the oscilloscope effectively. After clicking the Help button the information system is displayed. The information system Window will always stay on top of the interface display, so you can refer to it while working with the oscilloscope. You can move the window around the screen or resize it to make it easier to use.
The UDSUDS--20202020 Built-in information system www.eltesta.com
22 The on-line context-sensitive Help manual provides immediate answers to your questions about using the instrument. Links on the measurement screen take you directly to the information you need.

Calibration
Calibration of the UDSUDS--21282128 has been simplified by using full auto-calibration procedure and placing all performance level menu, indicators and messages in one menu page.
www.eltesta.com
22 Calibration Status can be selected
22 Auto-calibration routine includes:
!! Channels calibration!! Time base calibration!! Calibration of distortions
22 Optical Module Auto-calibration routine includes:
!! Dark Level Compensation!! Wavelength Gain Calibration

PackagingPackaging
www.eltesta.com

Manufacturing and Test
www.eltesta.com

Marketing and Demonstration
www.eltesta.com

Specifications
TriggerTriggerTrigger Sources - External Direct, External HF, Internal Clock, Recovered Clock (optional).Direct Trigger - 100 mV p-p DC to 100 MHz, 400 mV p-p @ 1 GHz.Internal Clock Rate - 10 us to 2 ms.
TDR/TDT SystemTDR/TDT SystemChannels Single-ended with UDX-G01 Pulse Head.Polarity Positive.Displayed Rise Time< 40 ps.Amplitude - 200 mV or more.Pulse Width - 1 us or more.Displayed RMS Jitter– 2.5 ps (maximum), 2.0 ps (typical). Aberrations – Overshoot: 10%, Before 150 ps: <±6%, 150 ps to 2 ns: <±4%, 2 to 100 ns: < ± 2 %.
www.eltesta.com
Electrical ChannelsElectrical ChannelsNumber of Channels – 2.Bandwidth - 20 or 12 GHz.Rise Time (10-90%) - <17.5ps or <29.2ps.Maximum MS Noise -2mV@20GHz, [email protected] Factors - 1 mV/div to 255 mV/div.DC Difference Voltage Accuracy - ±1.6% of full vertical scale ±2mVDC Offset Range - From -1 V to 1 V.Maximum input voltage - 1.0V p-p@±1V.Maximum Safe Input Voltage - 16 dBm, or ± 2 V (dc + peak ac).Nominal Input Impedance - (50±1)Ohm.Input Connectors – SMA (f).
TTime Base (Horizontal)ime Base (Horizontal)Time Bases - Main, Intensified, two Delayed, Dual Delayed.Scale Factors - 10 ps/div to 2 ms/div.Delta Time Interval Accuracy - ±0.4% of reading ± 10 ps ± 100ppm of delay setting (typical).Time Interval Resolution - 100 fs min.Variable Delay - 1000 screen diameters of Delayed TB or 19.98 ms.
RMS Jitter – 2.0 ps + 30 ppm of delay setting (typical).Trigger Level Range - -1 V to 1 V.Trigger Hysteresis Normal, High Sensitive.Trigger Holdoff - 10 us to 30.72 ms.Clock/Data Recovery- Continuous Rate 10 Mb/s to 2.7 Gb/s Direct Trigger Input Connectors - SMA (f).
UHF Countdown Trigger with UDXUHF Countdown Trigger with UDX--T01 HeadT01 HeadCoupling – АC.Bandwidth and Sensitivity - 100 mV p-p 0.5 to 5 GHz, 200 mV p-p 5 to 10 GHz.
UHF UHF PrescaledPrescaled Trigger with UDXTrigger with UDX--P01 HeadP01 HeadCoupling – AC.Bandwidth and Sensitivity - 200 mV p-p 1 to 7 GHz, 400 mV p-p 7 to 10 GHz, 600 mV p-p 10 GHz to 12 GHz (typical).
AcquisitionAcquisitionSimultaneous Acquisition Channels - 2.ADC Resolution - 14 Bits.Digitizing Rate - DC to 100 kHz. Acquisition Modes -Sample (normal), Average, Envelope, or Peak Detect.Average - Stable, Multiple, or Median.Number of averages - From 2 to 4096.Envelope - Min, Max or both Min-Max.Peak Detect Mode – Up to 20 ps High frequency and short repetitive glitches.Data Record Length-32 to 4096 pnts/ch.
Optical ChannelOptical ChannelChannel Configuration – O/E Converter +Two Electrical Channels, or One Optical Channel+ One Electrical Channel.Fiber – MM or SM.Unfiltered Optical Bandwidth – 8 GHz.Calibrated WL - 850nm (MM), 1310nm (MM/SM), 1550nm (SM).Maximum RMS Noise - 4 uW@1310 nm/1550 nm, 5 uW@850 nm.Scale Factors - 1 uW/div to 400 uW/div.Standard Data Rates - 155.52 Mbps (OC-3/STM-1), 1.25 Gbps(GBE), 2.488 Gbps (OC-48/STM-16).Optional Data Rates - 622.08 Mbps (OC-12/STM-4), 1063 Mbps (FC1603), 2.125 Gbps (FC2125), 2.500 Gbps (Infiniband 2.5G), 3.125 Gbps (XAUI).Input Connectors – FC/PC.

Characteristics
MarkerMarkerMarker Type - X-Marker (time). Y-Marker (volts). XY-Markers (waveform markers).Marker Measurements - Absolute, Delta Volts, Time, Frequency, Slope (Volts/Time)Marker Modes – Independent or Paired.Ratiometric measurements-Between measured and reference values. Results in ratiometric units as: %, dB, and Degrees.
MathematicsMathematicsWaveform Math - Up to 4 math waveforms can be defined and displayed.Math Operators - Add, Subtract, Multiply, Divide, Invert, Absolute, Exponentiation (e), Exponentiation (10), Logarithm (e), Logarithm (10), Differentiate, Integrate, Inverse FFT, Linear Interpolation, Sin(x)/x Interpolation, Smoothing, Trend.Operands - Any channel, waveform memory, math function, spectrum, or constant can be selected as a source for one of twooperands.
www.eltesta.com
Channel (Vertical)Channel (Vertical)Attenuation – Range: 0.00001:1 to 1 mln :1. Units: Ratio or dB. Scale: Volt, Watt, Ampere, or Unknown.
Time Base (Horizontal)Time Base (Horizontal)Display Units - Time or Bit Period.
DisplayDisplayDisplay Resolution - Full: 640H x 480V, Data: 501H x 257V.Display Style - Dots, Vectors, Variable Persistence (100 ms to 20 s), Infinite Persistence, Variable Gray Scaling (1 to 200 s), Infinite Gray Scaling, Variable Color Grading (1 to 200 s), Infinite Color Grading.Graticule - Full Grid, Axes, Frame, Off.Screen - Single, Dual, Quad.Display Format - YT, XY or both YT & XY.
Save/RecallSave/RecallManagement - Store and recall setups, waveforms, data base and screen images.Operating System - MS Windows®95/98/ME/NT4/2000/XP..Waveform Save/Recall - Up to 4 wfms may be stored into Wfm Mem (M1-M4).Save/Recall to DiskSave/Recall SetupsAutoscale
MeasureMeasureAutomated Measure - Up to 10 measurements, or 4 statistics measurements simultaneously. Parameters - 39 automatic measurements available.Amplitude Measurements - Maximum, Minimum, Peak-Peak, Top, Base, Amplitude, Middle, Mean, dc RMS, ac RMS, Area, Cycle Middle, Cycle Mean, Cycle dc RMS, Cycle ac RMS, Cycle Area, Pos. Overshoot, Neg. Overshoot, Gain. Timing Measurements - Period, Frequency, Pos Width, NegWidth, Rise Time, Fall Time, Pos Duty Cycle, Neg Duty Cycle, Pos Crossing, Neg Crossing, Burst Width, Cycles, Time@Maximum, Time@Minimum, Delay.FFT Measurements - FFT Magnitude, FFT Delta Magnitude, THD, FFT Frequency, FFT Delta Frequency. Statistics - Display minimum, maximum, mean and standard deviation on any waveform measurements.Top-Base Definition - Histogram, Min/Max, or User Defined (in absolute voltage)Thresholds - Settable in percentage, voltage or divisions. Standard thresholds are 10-50-90 % or 20-50-80 %.Margins - Any region may be isolated for measurement using vertical bars.Measurement Mode - Rep or Single-shotLimit TestLimit TestTest - Up to ten automatic measurements can be compared to user-defined test boundaries.On failure actions - Beep, Save failed waveform to disk or Stop acquisition.

Characteristics (cont.)EyeEye--DiagramDiagram
UDS-2128 automatically characterizes NRZ and RZ eye pattern.Measurement Set - Crossing %, Duty Cycle Distortion (%, s), Extinction Ratio (dB, %, ratio), Eye High, Eye Width, Fall Time (10%-90%, 20%-80%), Jitter (P-p, RMS), One Level, Q-factor, Rise Time (10%-90%, 20%-80%), Zero Level.
www.eltesta.com
FFTFFTFFT - Up to two fast Fourier transforms can be run simultaneously.FFT Windows - Rectangular, Hamming, Hanning, Flattop, Blackman-Harris and Kaiser-Bessel.Marker FFT Measurements - Frequency, delta freq, magnitude, and delta magnit.Automated FFT Measurements - FFT Magnitude, FFT Delta Magnitude, THD, FFT Frequency, and FFT Delta Frequency.
ZoomZoomZoom feature - Memories, functions, and spectrums can be expanded and positioned in both vertical and horizontal axes. Complex Scale - Magnitude, Phase, Magnitude + Phase, Real, Imaginary, and Real + Imaginary.Vertical expanding and positioning -Up to 10 mln. divisions or 1 mln. screens.Horizontal expanding and positioning –Up to 640 divisions or 64 screens.
HistogramHistogramHistogram Axis - Vertical, or Horizontal over any region of the signal (Window).Histogram Measurement Set - Scale, Hits in Box, Offset, Peak Hits, Pk-Pk, Median, Mean, Standard Deviation, Mean ±1 Std Dev, Mean ± 2 Std Dev, Mean ± 3 Std Dev.
Mask TestMask TestMask Test - Up to eight polygons. Masks can be loaded from disk, created automatically or manually.Mask Creation-Standard Mask, Automask, Mask saved on disk, Create new mask, Edit any mask.Standard Mask – SONET, ITU G.703, ANSI T1/102Automask Creation -Masks are created automatically for single-valued voltage signals. Automask specifies both delta X and delta Y tolerances.Data collected during test - Total No of waveforms, No of failed samples, No of hits within each polygon boundary
TDR/TDT SystemTDR/TDT SystemVertical Scaling – Volts, Percent reflection or Ohms. Horizontal Scaling - Time or Distance (meters or foots). Velocity or Dielectric Constant can be entered.TDR/TDT Cursor Measurements - Reads out the percent reflection, impedance, time, and distance, Excess C/L.
Environmental CharacteristicsEnvironmental CharacteristicsTemperature - Operating:+5 °C to +40°C. Non-operating: -40 °C to + 50 °C.Humidity – Operating: Up to 85% relative humidity (non-condensing) at +25 °C.
Power RequirementsPower RequirementsVoltage - 110±15 VAC or 220±30 VAC.Frequency - 48 to 66 Hz single phase.Power - 70 VA maximum.
Physical CharacteristicsPhysical CharacteristicsDimensions:
Width (with handle) - 270 mmWidth (without handle) - 255 mmHeight - 109 mmDepth (with handle) - 427 mmDepth (without handle) - 377 mm
WeightNet - 6.5 kg, Shipping - 12.0 kg.

UDS-2000 Family of Wide-Bandwidth PC-Sampling Oscilloscopes
The UDSUDS--2020 2020 oscilloscope
www.eltesta.com
The UDSUDS--2030 2030 oscilloscope and a 30-GHz sampler
Eltesta Eltesta offers a wide range of wide bandwidth PC-Sampling Oscilloscopes for electrical and optical signals to cover your measurement needs.

The End
Thank You for Your time
Questions?
Application Notes available @ www.eltesta.com
www.eltesta.com