welcome to ooredoo · •post period: on april 22 ooredoo and rocket internet announced a strategic...
TRANSCRIPT

Ooredoo Group
Capital Markets Day 2014
Finance Update, Ajay Bahri, OG CFO
May 12, 2014

2 | | CMD 201412 May 2014
Key financial milestones since our last CMD in Feb’13
Rebranding
& Ticker
Change
Capital Market
activities
Legal change of name from “Qatar Telecom” to “Ooredoo” came in to effect in July’13 and
share ticker changed to “ORDS” from “QTEL”
Rebranding: Qatar, Maldives, Tunisia, Myanmar and Algeria
Asiacell IPO February 2013, with shares now trading on the ISX. The fully subscribed
share offer was the largest ever in Iraq and the biggest equity offering in the Middle East
since 2008
New US$1 billion Revolving Credit Facility (RCF) signed on April 2013, used partly to
refinance US$ 1.25 billion RCF due in May 2013
Inaugural US $1.25 Bn Sukuk issued in Dec’13. The issue was 4 times oversubscribed
M&A
Credit Ratings
Ooredoo Myanmar license officially awarded in February 2014, funding from internal
sources
Investment grade credit ratings maintained (Moody’s “A2”, S&P “A-”, Fitch “A+”)
S&P downgrade due to increased exposure to “higher risk” markets

3 | | CMD 201412 May 2014
Group results: Key Q1’2014 highlights
A satisfactory start to 2014 in a challenging competitive environment
• Strong customer growth of 6.3% yoy to 96.7 million as Ooredoo captures a growing share of our markets by offering
leading-edge telecoms services delivered across world-leading broadband networks
• Group revenue decreased by 3.4% yoy in a challenging operating environment and Foreign Exchange impact from
Indonesia; partially offset by strong growth in data revenues. Excluding FX impact revenue would increase by 1.3%
YoY
• Robust results in Qatar, Oman and Algeria during the quarter; operating environment remains tough with persistent price
competition in Iraq, Kuwait and Indonesia
• EBITDA reduced by 8.5% to QAR 3,378 million reflecting the current competitive challenges in our markets, FX impact and
initial investment for the new network in Myanmar. Excluding FX impact and Myanmar start up cost EBITDA would
decrease by 1.4% YoY
• Net profit for the first quarter up by 9.7% impacted by positive FX trends in Indonesia compared to December 2013
Strategic developments
• Ooredoo subsidiary Wataniya Group completed Bravo divestment to STC in January. Bravo operates a “Push to Talk”
technology-based business which is not core to the Ooredoo Group’s technology platform strategy
• Ooredoo subsidiary Indosat completed the sale of its shares in Tower Bersama for approximately US $122m
• Post period: On April 22 Ooredoo and Rocket Internet announced a strategic partnership to develop online businesses
in Asia. eCommerce is adjacent to our traditional core business and a significant growth opportunity in the region.

4 | | CMD 201412 May 2014
Customers(in thousands)
Revenues(in QAR million)
Customer growth
continuing across key
operations…
…translating into
steady revenues…
EBITDA margin(% of Revenue )
…cost optimization
initiatives offset margin
pressure partially …
Net profit attributable
to shareholders of
Ooredoo(in QAR million)
…resulting in strong
bottom-line results
despite increased
competition
7,461 7,969
8,384 8,103
Q1'11 Q1'12 Q1'13 Q1'14
+7%+5% - 3%
3,550
3,843 3,690
3,378
48% 48%44% 42%
Q1'11 Q1'12 Q1'13 Q1'14
+8%-4%
-8%
75,579
84,421
90,969 96,660
Q1'11 Q1'12 Q1'13 Q1'14
+12%
+8%
+6%
Successful group performance
811
711
808
887
Q1'11 Q1'12 Q1'13 Q1'14
+10%
+14%
-12%

5 | | CMD 201412 May 2014
Consolidated revenue 8,103 -3.4%
EBITDA 3,378 -8.5%
Net profit attributable to Ooredoo
shareholders887 +9.7%
Earnings per share
(in Qatari Riyals)2.77 +10%
Market capitalization
(as of 31 March 2014)44,108 +21%
Capital expenditure1,946 +45%
Group results: 2014 Q1 performance summary
Q1 2014 /
Q1 2013QAR Millions
3 months ended
March 2014
2014 Annual
Guidance
0 to +3%
-3 to -1%
-
-
-
9,000 –
10,000

6 | | CMD 201412 May 2014
Case study: Performance at Wataniya Kuwait
Notes: (1) GSM, GPRS, EDGE, WCDMA, HSDPA; (2) Three month average compared to USD; (3) Subscriber market share;
Source: IMF, Wireless Intelligence, Ooredoo
Customer growth (in ‘000s)
Others 68%
Wataniya, 32%
Q1’13 Q1’14
Wataniya 33% 32%
Others 67% 68%
1,929 1,980
2,220
Q1 2012 Q1 2013 Q1 2014
63
1 67
8
66
3
57
6
58
3
54
1
254
217
194
115 141
126
0%
20%
40%
60%
0
200
400
600
800
1000
Q4'12 Q1'13 Q2'13 Q3'13 Q4'13 Q1'14
Revenue
EBITDA
EBITDA %
Revenue & EBITDA (in millions QAR) Market share evolution3
• Consumer and B2B revenue weak, various new products
launched. Organization is working towards stabilization of
the revenue in a highly competitive market.
• As a result of modernization and intense communication
campaign network quality perception improved
• Apple certified network, iPhone sales started in March
• MNP customer loss significantly reduced but still a
concern.
• EBITDA margin maintained at 24% despite drop in
revenue.
• Cost optimization initiatives are on track.
Ku
wa
it
Pop : 3.9M (2013 est.)
Pop growth: 2.8%
Mob. penetration: 174%
GDP per capita: US$ 45,050
F/X 3M ‘13 vs. 3M ‘122: +1%
Operation: Mobile1
Effective Stake: 92.1%
Position: 2/3
Q1 Blended ARPU: QAR 76.5
Wa
tan
iya
Customers: 2.3%; Revenue 6.7%; EBITDA: 3.7%; Capex: 8.5%
Key developments Operator importance to group

7 | | CMD 201412 May 2014
Case study: Performance at Ooredoo Algeria
Note: (1) GSM, GPRS, EDGE; (2) Three month average compared to USD; (3) Subscriber market share; (4) 71% is held via NMTC and a 9% stake is held via Ooredoo QSC;
Source: IMF, Wireless Intelligence, Ooredoo
Customer growth (in ‘000s)
Others 67%
Ooredoo Algeria 33%
Q1’13 Q1’14
Ooredoo Algeria 31% 33%
Others 69% 67%
8,517
9,2479,929
Q1 2012 Q1 2013 Q1 2014
93
0
92
6
98
1
97
2
10
05
11
04
36
1
37
1
42
7
40
3
38
3
42
7
0%
20%
40%
60%
0
200
400
600
800
1000
1200
1400
1600
1800
2000
Q4'12 Q1'13 Q2'13 Q3'13 Q4'13 Q1'14
Revenue
EBITDA
EBITDA %
Revenue & EBITDA (in millions QAR) Market share evolution3
Alg
eri
a
Pop : 37.0M (2013 est.)
Pop growth: 1.5%
Mob. penetration: 89%
GDP per capita: US$ 5,789
F/X 3M ‘13 vs. 3M ‘122: +1%
Operation: Mobile1
Effective Stake: 74.4%4
Position: 2/3
Q1 Blended ARPU: QAR 36
• Very healthy revenue growth driven by increase in
customer numbers and strong postpaid business
• Revenue market share increased due to higher 3G ARPU
• Market research indicates good brand awareness of new
Ooredoo brand
• 3G roll out stays ahead of competition (10 wilayas
(counties) launched in Dec’13, additional 9 wilayas
launched in Jan’14)
Ne
djm
a
Customers: 10.3%; Revenue: 13.6%; EBITDA: 12.6%; Capex: 18.0%
Key developments Operator importance to group

8 | | CMD 201412 May 2014
In 2014, we will focus on achieving bigger efficiencies
Source: Group Strategy; Group Finance; MC Strategy Workshop, 9 Feb 2014
Cost efficiencies are the greatest value creation lever
Cost Optimizing:
- Focused Initiative to drive Performance Gap
Savings
- OPCOs to provide detailed plans
- Achievements to be monitored
Network Sharing:
- Expand on existing network sharing
agreements across key markets

9 | | CMD 201412 May 2014
NetworksOperations &
Service Delivery
Billing &
Customer Care
Brand &
AdvertisingDistribution
Admin & Back Office Functions
Cost optimization: 2013 benchmark study identified more than $500M in addressable savings
Leading efficiency improvement opportunities identified by AT Kearney:
• Network outsourcing
• Fixed network strategy
• Network sharing
• IT shared services
• IT transformation
• Shared services and outsourcing
• Credit & collection
• Call center outsourcing or
offshoring

10 | | CMD 201412 May 2014
Cost Optimization: Actual savings achieved in 2012 and 2013
50
4 218 21
82
28
205
70
314
29 33
81
11
241
Iraq Tunisia Algeria Kuwait Nawras Indosat Qatar Total
Savings achieved in Key Opcos (US $m)
2012 2013

11 | | CMD 201412 May 2014
* In QAR mill
6,942 6,575
7,316
9,298
26%21% 22%
27%
12M'10 12M'11 12M'12 12M'13
-5%
+11%
+27%
Capital expenditures: Network modernization continues
Guidance for 2014: QAR 9,000-10,000 mill. including Myanmar
12 | | CMD 201412 May 2014
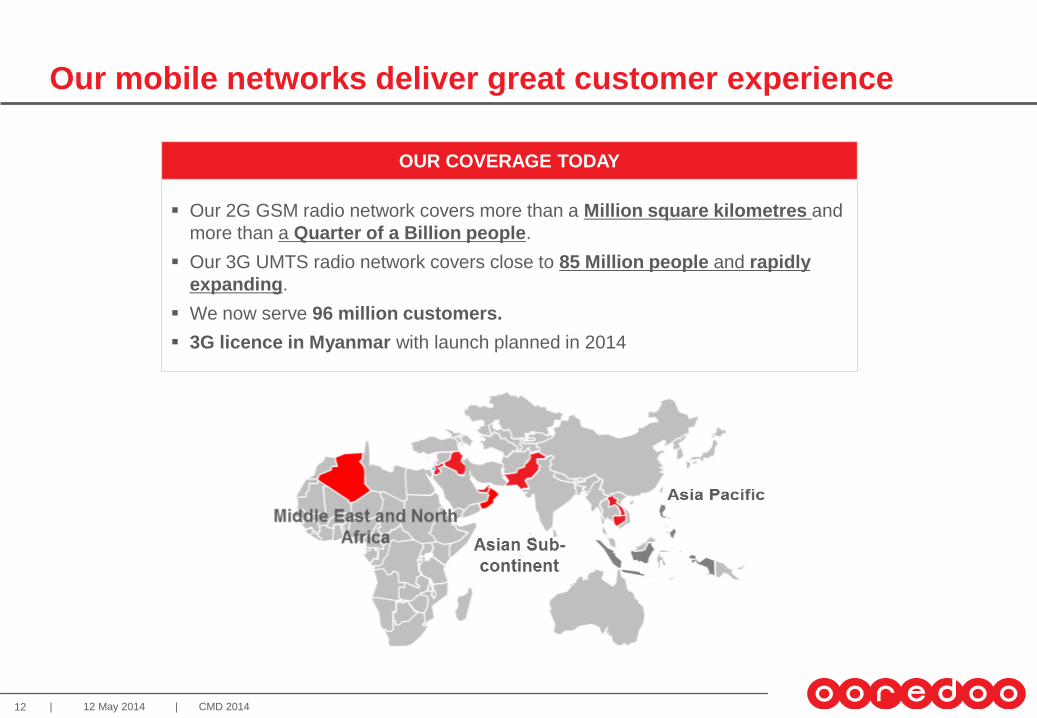
Our 2G GSM radio network covers more than a Million square kilometres and
more than a Quarter of a Billion people.
Our 3G UMTS radio network covers close to 85 Million people and rapidly
expanding.
We now serve 96 million customers.
3G licence in Myanmar with launch planned in 2014
Our mobile networks deliver great customer experience
OUR COVERAGE TODAY
13 | | CMD 201412 May 2014
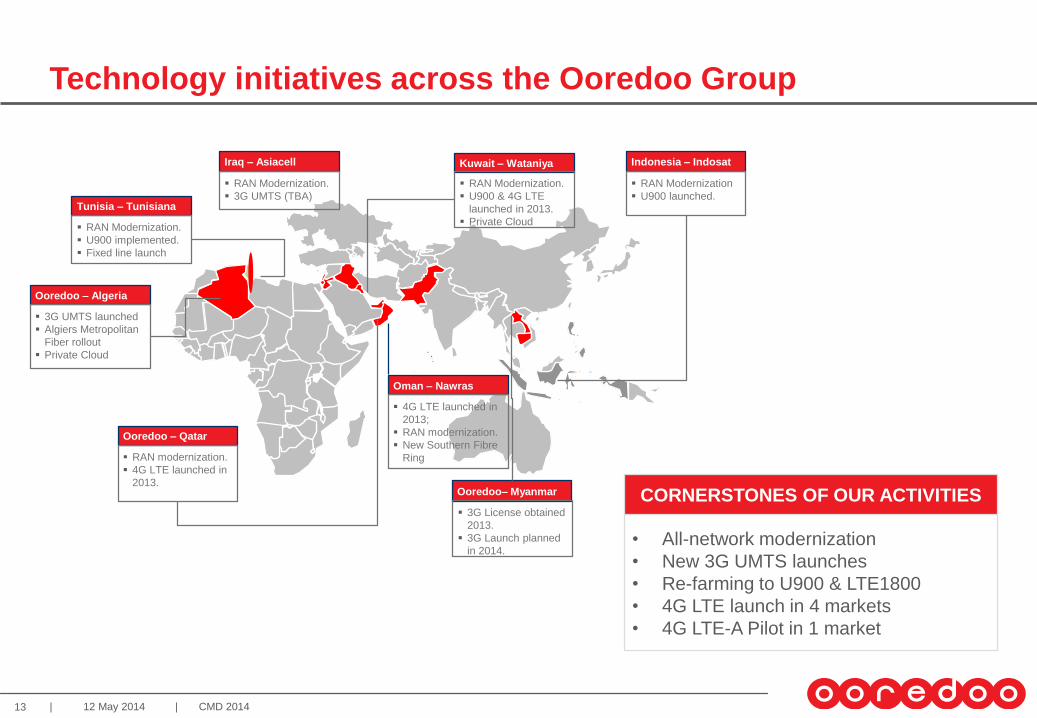
Technology initiatives across the Ooredoo Group
• All-network modernization
• New 3G UMTS launches
• Re-farming to U900 & LTE1800
• 4G LTE launch in 4 markets
• 4G LTE-A Pilot in 1 market
CORNERSTONES OF OUR ACTIVITIES
Ooredoo – Qatar
RAN modernization.
4G LTE launched in
2013.
Indonesia – Indosat
RAN Modernization
U900 launched.
Iraq – Asiacell
RAN Modernization.
3G UMTS (TBA)
Kuwait – Wataniya
RAN Modernization.
U900 & 4G LTE
launched in 2013.
Private Cloud
Tunisia – Tunisiana
RAN Modernization.
U900 implemented.
Fixed line launch
Oman – Nawras
4G LTE launched in
2013;
RAN modernization.
New Southern Fibre
Ring
Ooredoo – Algeria
3G UMTS launched
Algiers Metropolitan
Fiber rollout
Private Cloud
Ooredoo– Myanmar
3G License obtained
2013.
3G Launch planned
in 2014.

14 | | CMD 201412 May 2014
Key financial issues
Foreign Exchange risk
FX hedging policy implemented throughout the Group
Appropriate hedging levels achieved; in some emerging markets no suitable hedging instrument
available or cost prohibitive
Leverage levels
Leverage maintained within Board guidance of 1.5x – 2.5x (Net Debt to EBITDA) now at 2.2x.
Investment grade credit rating maintained (Moody’s “A2”, S&P “A-”, Fitch “A+”); S&P downgrade
due to increased exposure to “higher risk” markets
Debt refinancing risk
Ooredoo QSC refinancing requirements in 2014 addressed pro-actively
Available cash will be used to repay USD900mn bond due in June 2014
USD500mn Islamic credit due in May 2014 is being extended for another year
Interest Rate risk
Ooredoo solidified long-term fixed rates and reduces exposure to floating interest rate risk at
Group level
Diversification of funding sources
Diverse funding tool-box available to Ooredoo and access to diversified global market investors
Inaugural Sukuk issuance of USD1.25bn in Dec 2013 using innovative Islamic structure based on
air-time vouchers

15 | | CMD 201412 May 2014
Ooredoo Q.S.C. only – debt profile (US$ m)
Note: (1) This includes additional 10bps utilization margin
(2) This includes additional 30bps utilization margin
Total outstanding debt as 31 March 2014 at Ooredoo Q.S.C. level US$ 9,750 million
Leverage maintained within Board guidance of 1.5x – 2.5x. Debt headroom available for growth.
Prudent asset liability management – refinancing requirements due in 2014 being addressed.
Low long-term fixed rates locked in and conservative debt maturity profile.
Loan Type
(in USD mn)Amount Usage Rate Maturity
Dual Tranche
RCF¹750 750 Libor + 155 bps 26 May 2015
QNB QAR3bn RCF 823 0 QAR ratesAvailable till
31 Jan 2015
QIB Commodity
Murabaha Facility500 500 Libor + 95bps 15 May 2014
USD1bn RCF2 1,000 1000 Libor + 115bps 31 Mar 2017
Total 3,037 2,250
Bonds/Sukuk (in USD mn)Issue
Amount
Interest/
Profit RateMaturity Listed in
Fixed Rate Bonds due 2014 900 6.500% 10 Jun 2014 LSE
Fixed Rate Bonds due 2016 1,000 3.375% 14 Oct 2016 LSE
Fixed Rate Bonds due 2019 600 7.875% 10 Jun 2019 LSE
Fixed Rate Bonds due 2021 1,000 4.750% 16 Feb 2021 LSE
Fixed Rate Bonds due 2023 1,000 3.250% 21 Feb 2023 ISE
Fixed Rate Bonds due 2025 750 5.000% 19 Oct 2025 LSE
Fixed Rate Bonds due 2028 500 3.875% 31 Jan 2028 ISE
Fixed Rate Bonds due 2043 500 4.500% 31 Jan 2043 ISE
Sukuk due 2018 1,250 3.039% 3 Dec 2018ISE
Total 7,500
500750
1000
900
10001250
600
1000 1000750
500 500
0
500
1,000
1,500
2014 2015 2016 2017 2018 2019 2020 2021 2022 2023 2024 2025 2028 2043
Bonds & SukukLoans

16 | | CMD 201412 May 2014
MSCI upgrade & Ooredoo share liquidity
Qatar Exchange will be formally upgraded into the MSCI Emerging Market (MSCI EM) Index, to take effect on
May 30th, 2014.
Market expectations are that Ooredoo Q.S.C. meets all the criteria for its inclusion into the new MSCI EM index. The
full list of constituents will be announced by MSCI on May 14th, 2014.
Ooredoo Q.S.C. uniquely has no Foreign Ownership Limit (FOL) however, management is aware of the Ooredoo
share liquidity issue raised by equity investors.
Discussions with key shareholders are on-going to consider solutions to address the share liquidity issue.
Actions being discussed include:
- Increase of the “free float” via a secondary placement, locally or internationally
- Revival of the existing GDR on the London Stock Exchange with meaningful size
- Establishing sponsored market makers on the Qatar Exchange known as “Liquidity Providers”

17 | | CMD 201412 May 2014
Ooredoo (parent company Ooredoo Q.S.C.) and the group of companies which it forms part of (“Ooredoo Group”) cautions investors that certain
statements contained in this document state Ooredoo Group management's intentions, hopes, beliefs, expectations, or predictions of the future
and, as such, are forward-looking statements.
Ooredoo Group management wishes to further caution the reader that forward-looking statements are not historical facts and are only estimates
or predictions. Actual results may differ materially from those projected as a result of risks and uncertainties including, but not limited to:
– Our ability to manage domestic and international growth and maintain a high level of customer service
– Future sales growth
– Market acceptance of our product and service offerings
– Our ability to secure adequate financing or equity capital to fund our operations
– Network expansion
– Performance of our network and equipment
– Our ability to enter into strategic alliances or transactions
– Cooperation of incumbent local exchange carriers in provisioning lines and interconnecting our equipment
– Regulatory approval processes
– Changes in technology
– Price competition
– Other market conditions and associated risks
This presentation does not constitute an offering of securities or otherwise constitute an invitation or inducement to any person to underwrite,
subscribe for or otherwise acquire or dispose of securities in any company within the Ooredoo Group.
The Ooredoo Group undertakes no obligation to update publicly or otherwise any forward-looking statements, whether as a result of future
events, new information, or otherwise.
Disclaimer
Thank you
2014 1H Results – August 2014 TBDUpcoming
events
Website: ooredoo.com
Email: [email protected]
Twitter: @OoredooIR
Follow us