welcome to modeling transactional data for sap business ... · the process steps for creating an...
TRANSCRIPT

Welcome to Modeling Transactional Data for SAP Business One version for SAP HANA.
In this course, we use the Modeler perspective in the SAP HANA Studio to model calculationviews for transactional data in the semantic layer of the SAP Business One version for SAPHANA. We will choose the option to create a calculation view as a cube with a star schema.
1

At the end of this unit, you will be able to model views of transaction data for SAP BusinessOne.

We have created dimensions for business partners and for dates, now we will tie them togetherwith the transactional data in an calculation view for our invoice transactions
The calculation view will be built using a star schema cube based on the OINV table of the A/Rinvoice transaction. That table will form the data foundation for the cube.
3

HANA Calculation Views that are created as a cube with a star schema have a similar structureto cubes in a data warehouse. They are comprised of a data foundation joined to master datadimensions. The data foundation is a fact table containing transactional data. As we sawearlier, the dimensions for master data are separate reusable views. This structure allows us tocreate selection of measures (sometimes referred to as key figures) and attributes of relateddimensions for our reports.
However, unlike cubes in a traditional data warehouse, these views only contain the data tablesand views with the relationships between them. All queries, calculation and aggregation is doneat runtime. Because of their structure, star schema cubes are very efficient and fast forreporting.
In our business example, we will be creating a view for the A/R invoice transaction. The datafoundation will contain transactional information from the OINV table. The data foundation willbe linked in a star schema to the views we just made for business partner information anddates.
4

The process steps for creating an cube with a star schema are similar to the steps for creatingdimension reuse views.• First we set parameters for the view – such as the name and description. Choose to create
a calculation view as a cube with a star join.• Then we select the tables. In our case, we will select the OINV table. The OINV table will
make up our data foundation. Then we select the measures and attributes we need foroutput from the data foundation.
• We add our dimensions to a star join. We set the properties for each join.• We select the attributes and measures for output that will be used for reporting. When we
select the attributes for business partner and posting date, they will bring in the attributeviews that we have created earlier. If we need any calculated measures, we can definethem at this point. Calculated measures can be very useful because they are calculatedafter all the data is aggregated by predefined conditions.
• As always, we save and activate the view.• Then we can preview the data for our view. At this point, we will be able to see everything
we will need for analysis of invoices.
5
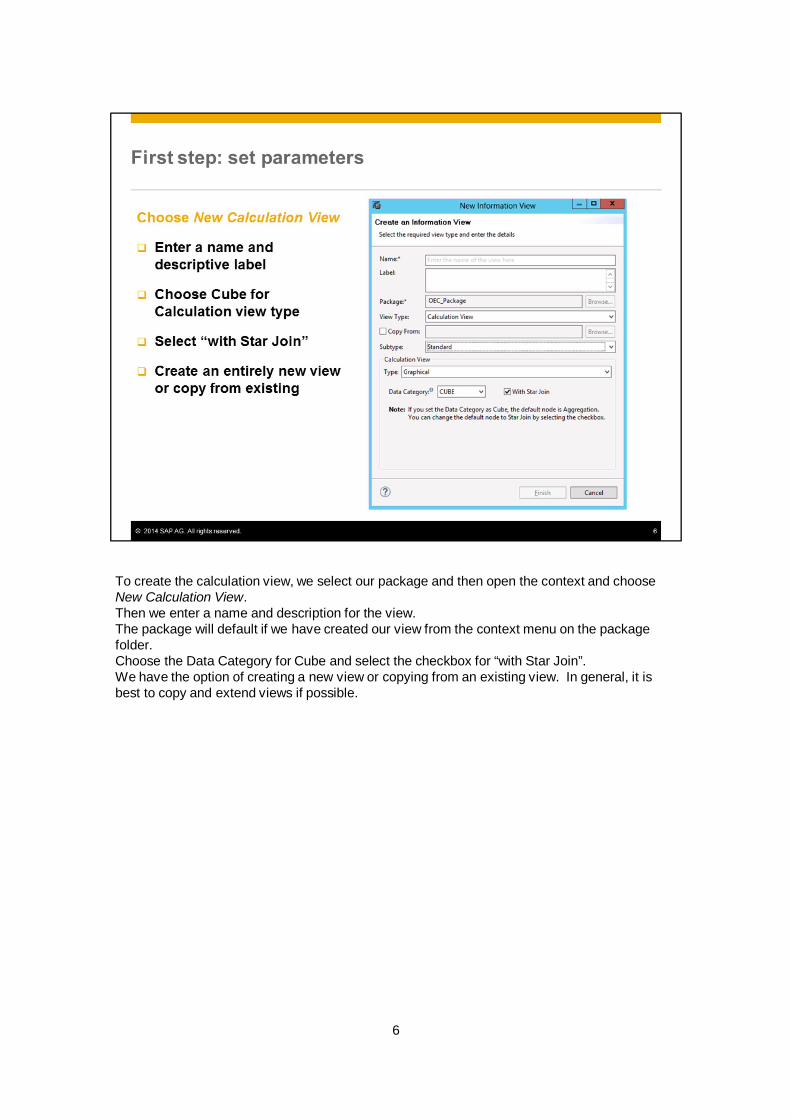
To create the calculation view, we select our package and then open the context and chooseNew Calculation View.Then we enter a name and description for the view.The package will default if we have created our view from the context menu on the packagefolder.Choose the Data Category for Cube and select the checkbox for “with Star Join”.We have the option of creating a new view or copying from an existing view. In general, it isbest to copy and extend views if possible.
6
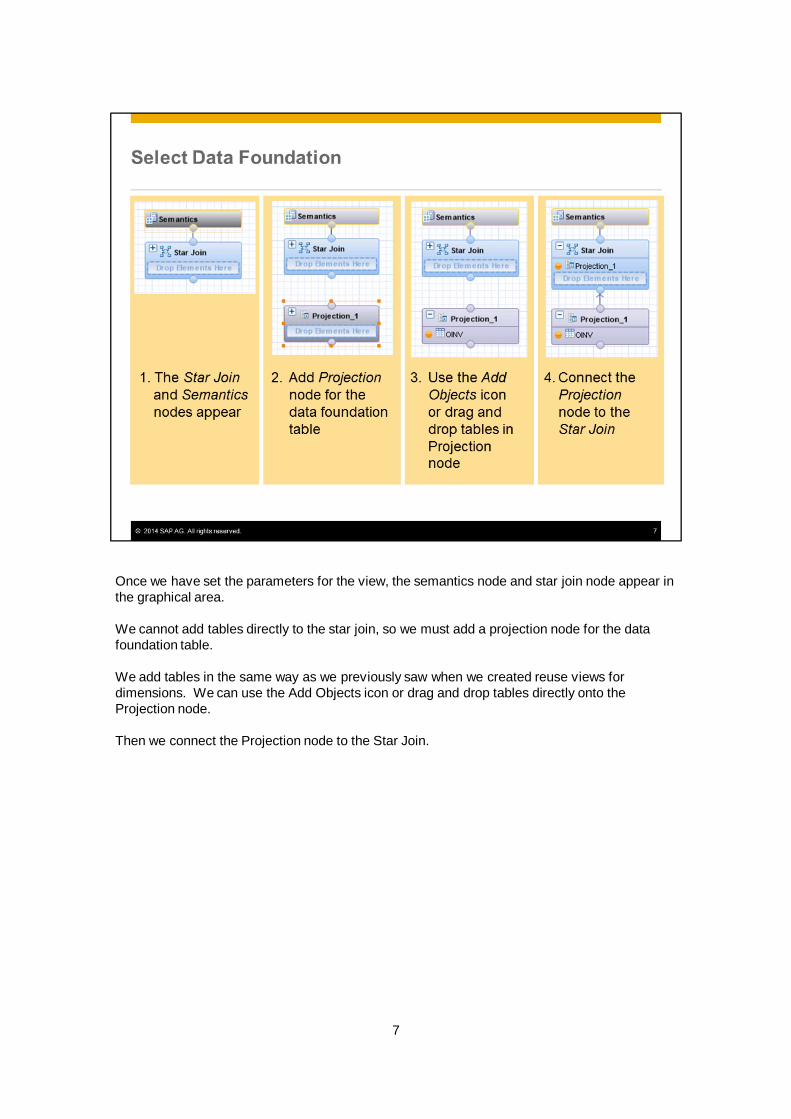
Once we have set the parameters for the view, the semantics node and star join node appear inthe graphical area.
We cannot add tables directly to the star join, so we must add a projection node for the datafoundation table.
We add tables in the same way as we previously saw when we created reuse views fordimensions. We can use the Add Objects icon or drag and drop tables directly onto theProjection node.
Then we connect the Projection node to the Star Join.
7
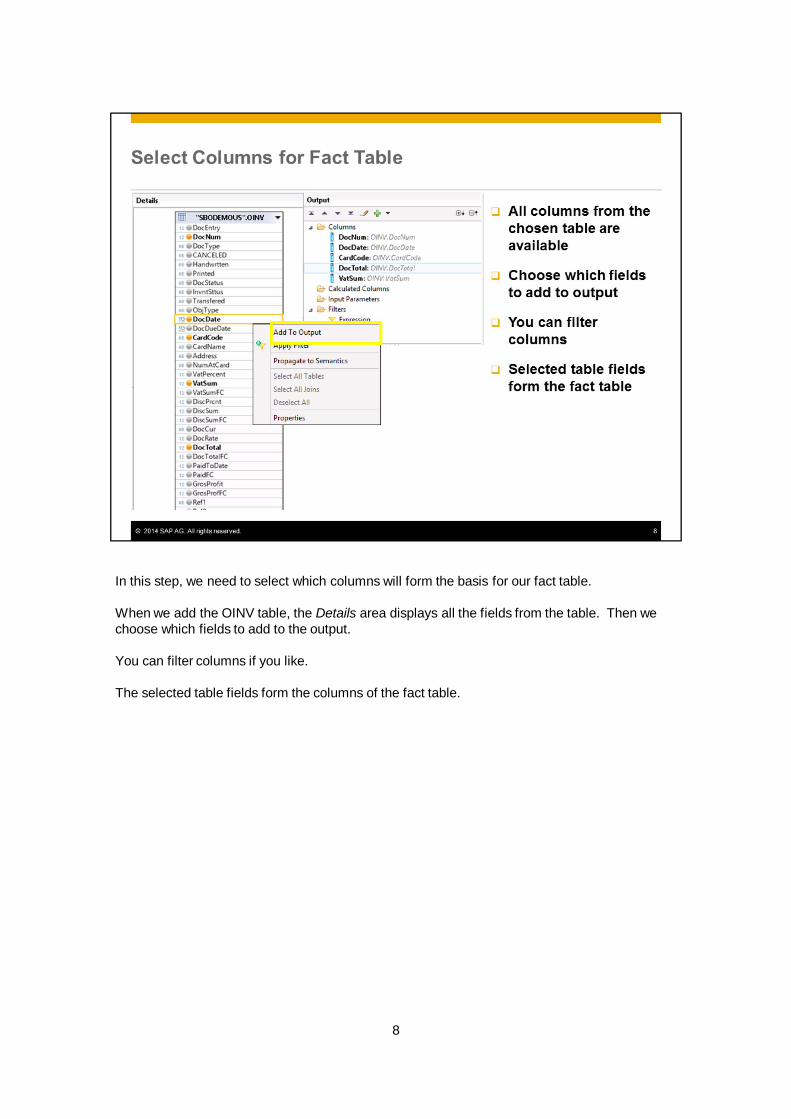
In this step, we need to select which columns will form the basis for our fact table.
When we add the OINV table, the Details area displays all the fields from the table. Then wechoose which fields to add to the output.
You can filter columns if you like.
The selected table fields form the columns of the fact table.
8
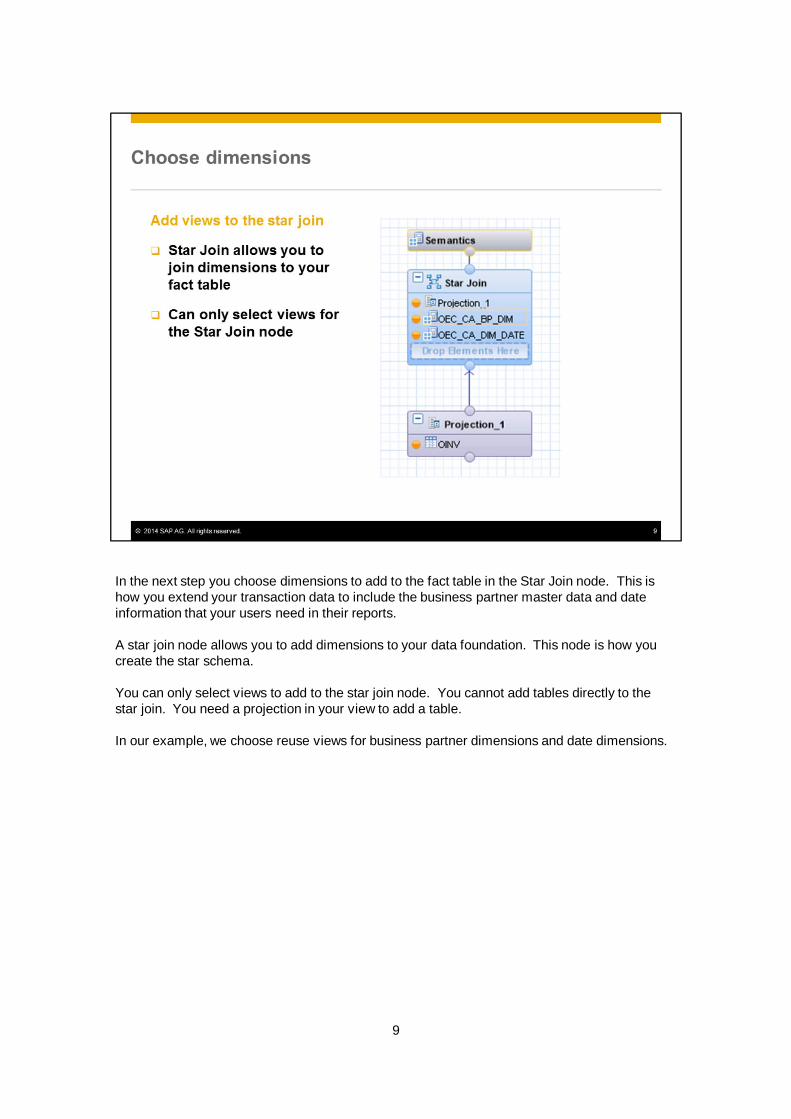
In the next step you choose dimensions to add to the fact table in the Star Join node. This ishow you extend your transaction data to include the business partner master data and dateinformation that your users need in their reports.
A star join node allows you to add dimensions to your data foundation. This node is how youcreate the star schema.
You can only select views to add to the star join node. You cannot add tables directly to thestar join. You need a projection in your view to add a table.
In our example, we choose reuse views for business partner dimensions and date dimensions.
9

In the Details area of the Star Join, you draw the joins between the fact table and the views thatmake up your master data dimensions. Then you set the properties for each join.
The transactional fact table should be the left/inner table. You can think of it as the central table.The central table is where the measures come from. The central table determines the primarykey.
You can set specific join properties as needed. Joins in the data foundation generally follow thesame idea as joins to attribute views.As a general rule, analytic views use left outer joins with a cardinality of N:1 from the fact tableto the attribute views and tables on the right. The cardinality must be decreased going from thecenter of the star schema to the outside.
You have the option of using referential joins where referential integrity can be ensured with acardinality of N:1. However, use referential joins with caution because they assume that foreach row in the left table there is at least one join partner in the right table and that holds true inboth directions at all times. If this is not the case, then referential joins have the possibility ofgiving incorrect calculations when referential integrity is not met.
10
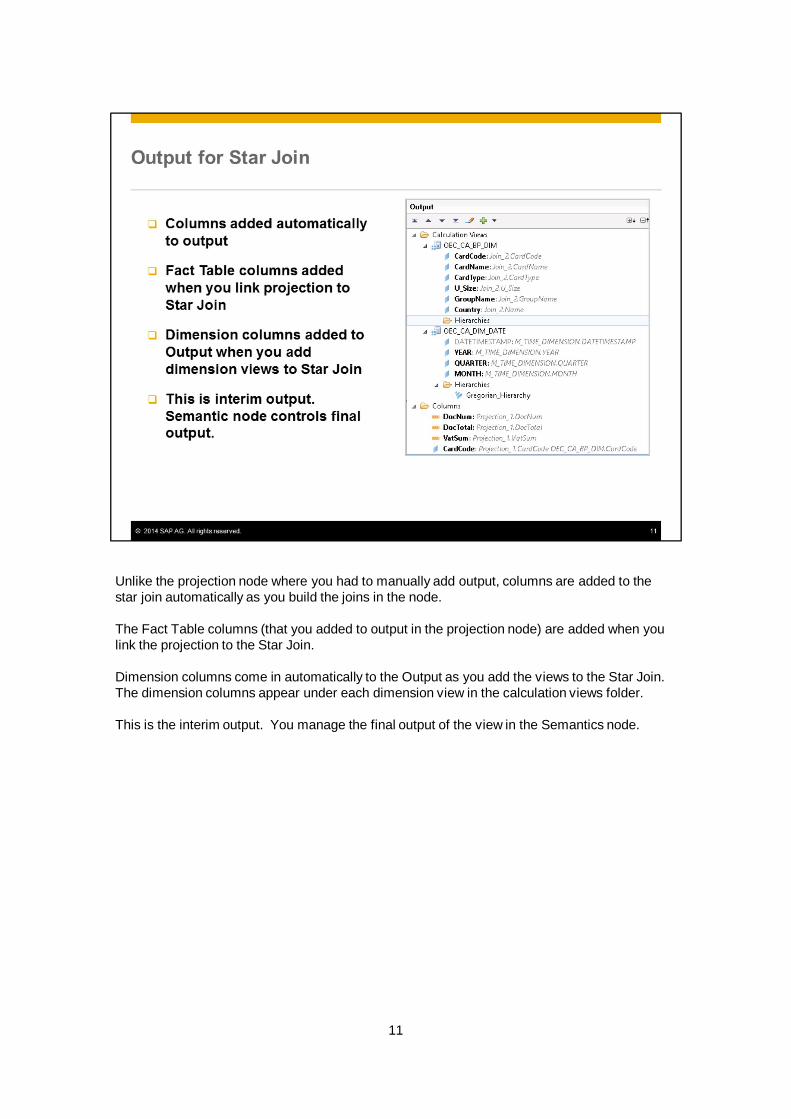
Unlike the projection node where you had to manually add output, columns are added to thestar join automatically as you build the joins in the node.
The Fact Table columns (that you added to output in the projection node) are added when youlink the projection to the Star Join.
Dimension columns come in automatically to the Output as you add the views to the Star Join.The dimension columns appear under each dimension view in the calculation views folder.
This is the interim output. You manage the final output of the view in the Semantics node.
11

We have a column for sales revenue totals and a column for the VAT tax amount. Most usersdon’t want to do their own math to figure out the net sales amount. What can we do to maketheir life easier when they run reports?
The answer is to create a calculate column.
12
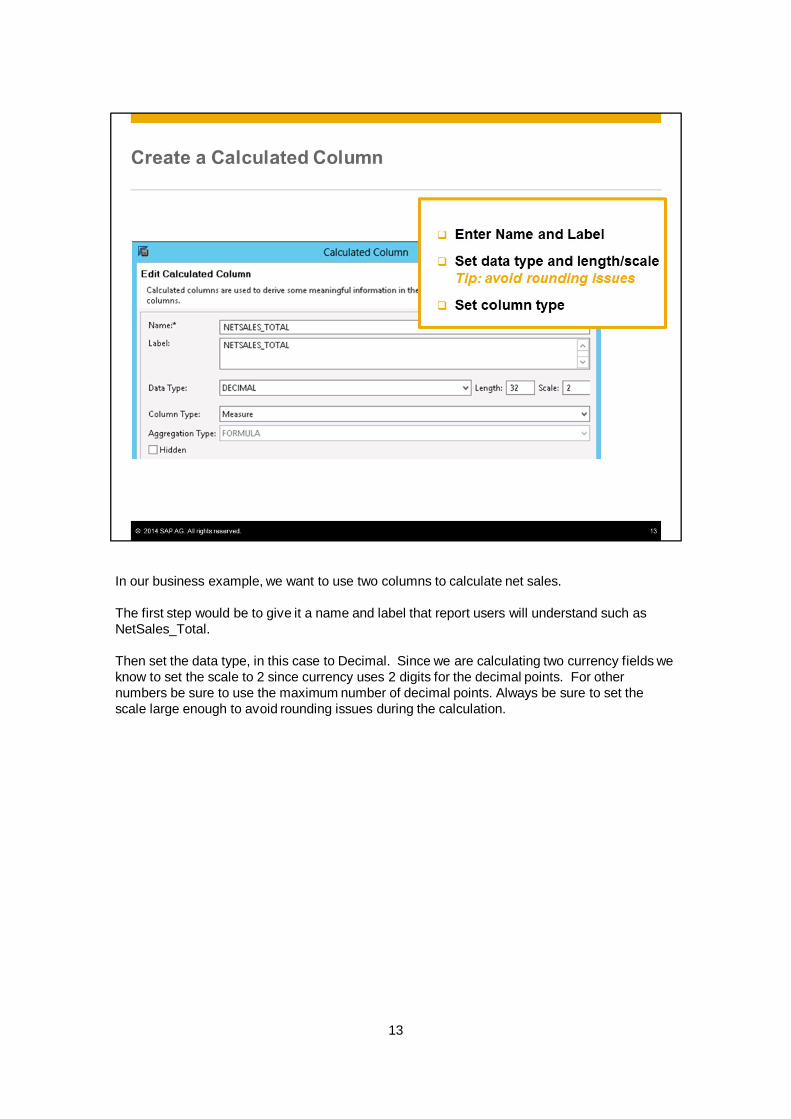
In our business example, we want to use two columns to calculate net sales.
The first step would be to give it a name and label that report users will understand such asNetSales_Total.
Then set the data type, in this case to Decimal. Since we are calculating two currency fields weknow to set the scale to 2 since currency uses 2 digits for the decimal points. For othernumbers be sure to use the maximum number of decimal points. Always be sure to set thescale large enough to avoid rounding issues during the calculation.
13

You can write the formula freehand, but it may be easier and avoid mistakes if you use theobjects provided in the Elements, Operators and Functions areas. Then once you finish theformula, use the button to Validate Syntax.
A best practice is to wait until the last step in aggregation to do any calculated columns. Forexample, if we will be reporting on this cube directly, it’s a good place to have a calculatedcolumn. However, if we plan to use this cube as an interim step (a reuse view) before anothercalculation view, then it is better to wait to set up the calculated column in the final query view.
14
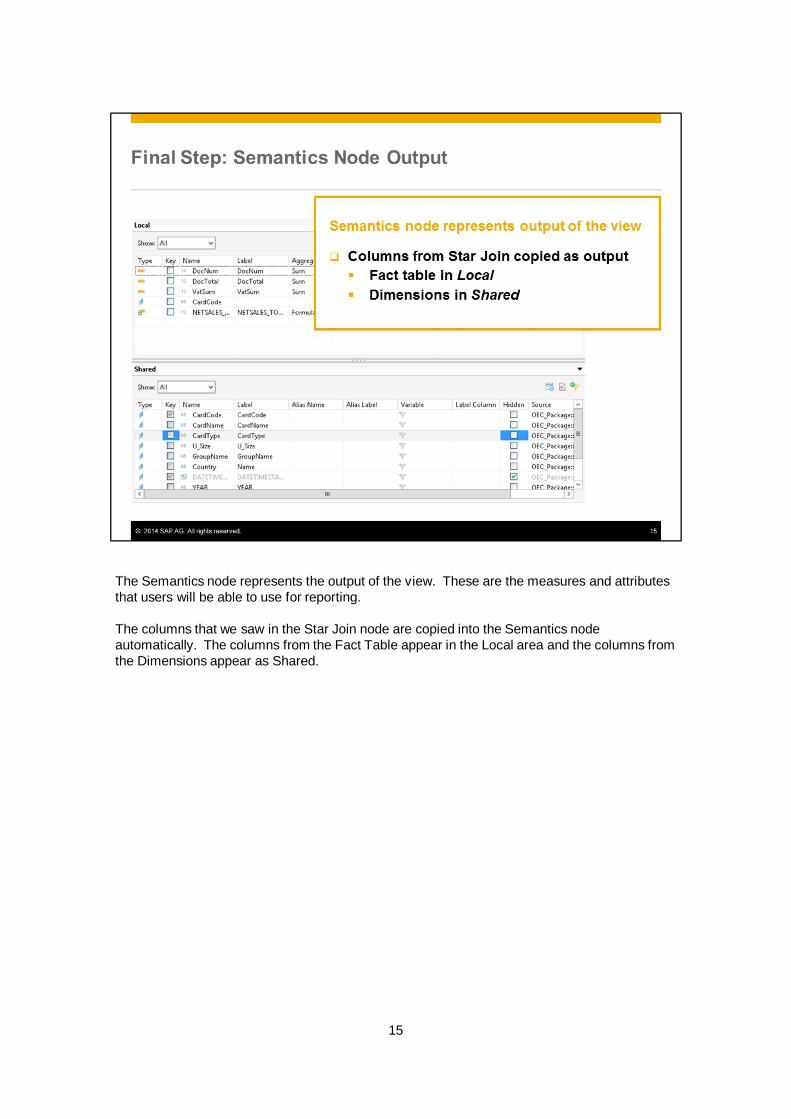
The Semantics node represents the output of the view. These are the measures and attributesthat users will be able to use for reporting.
The columns that we saw in the Star Join node are copied into the Semantics nodeautomatically. The columns from the Fact Table appear in the Local area and the columns fromthe Dimensions appear as Shared.
15
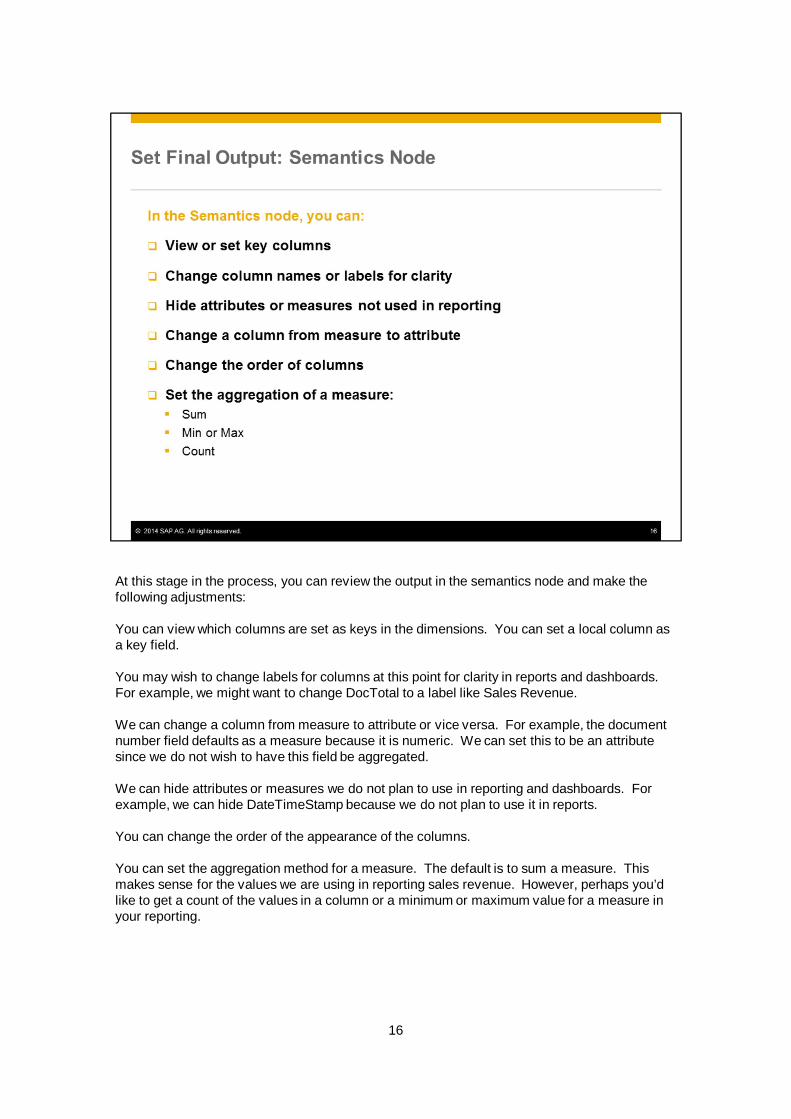
At this stage in the process, you can review the output in the semantics node and make thefollowing adjustments:
You can view which columns are set as keys in the dimensions. You can set a local column asa key field.
You may wish to change labels for columns at this point for clarity in reports and dashboards.For example, we might want to change DocTotal to a label like Sales Revenue.
We can change a column from measure to attribute or vice versa. For example, the documentnumber field defaults as a measure because it is numeric. We can set this to be an attributesince we do not wish to have this field be aggregated.
We can hide attributes or measures we do not plan to use in reporting and dashboards. Forexample, we can hide DateTimeStamp because we do not plan to use it in reports.
You can change the order of the appearance of the columns.
You can set the aggregation method for a measure. The default is to sum a measure. Thismakes sense for the values we are using in reporting sales revenue. However, perhaps you’dlike to get a count of the values in a column or a minimum or maximum value for a measure inyour reporting.
16
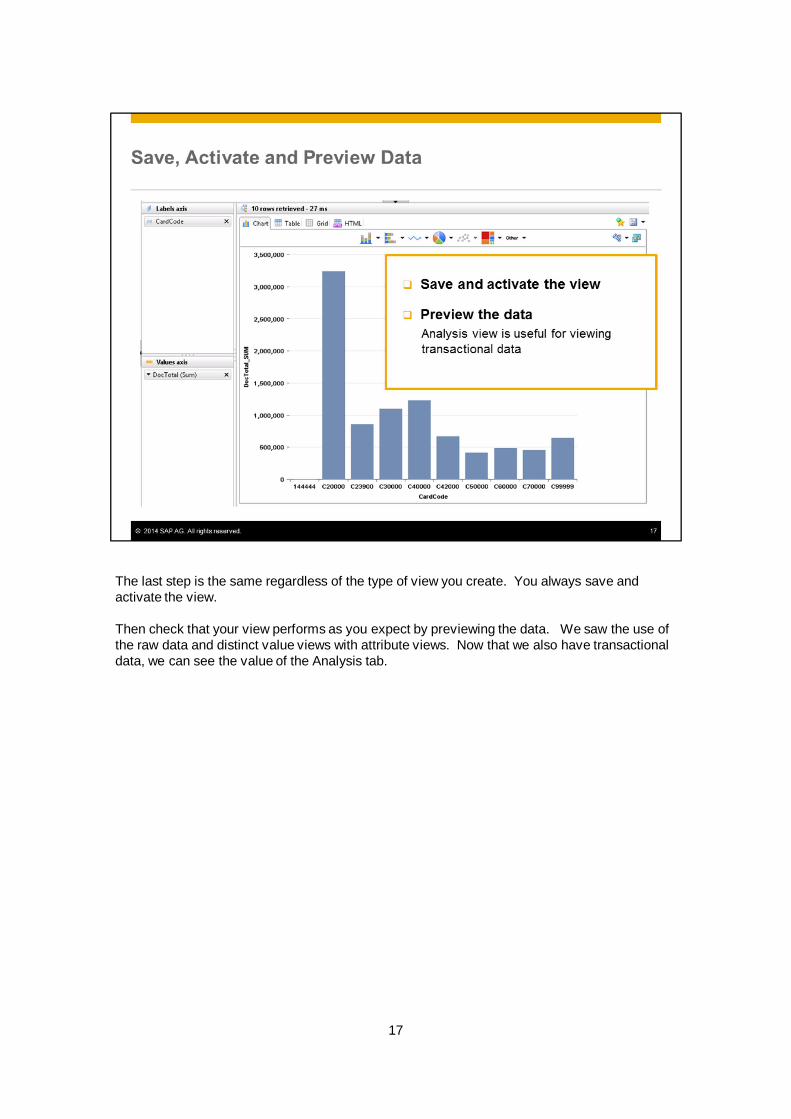
The last step is the same regardless of the type of view you create. You always save andactivate the view.
Then check that your view performs as you expect by previewing the data. We saw the use ofthe raw data and distinct value views with attribute views. Now that we also have transactionaldata, we can see the value of the Analysis tab.
17
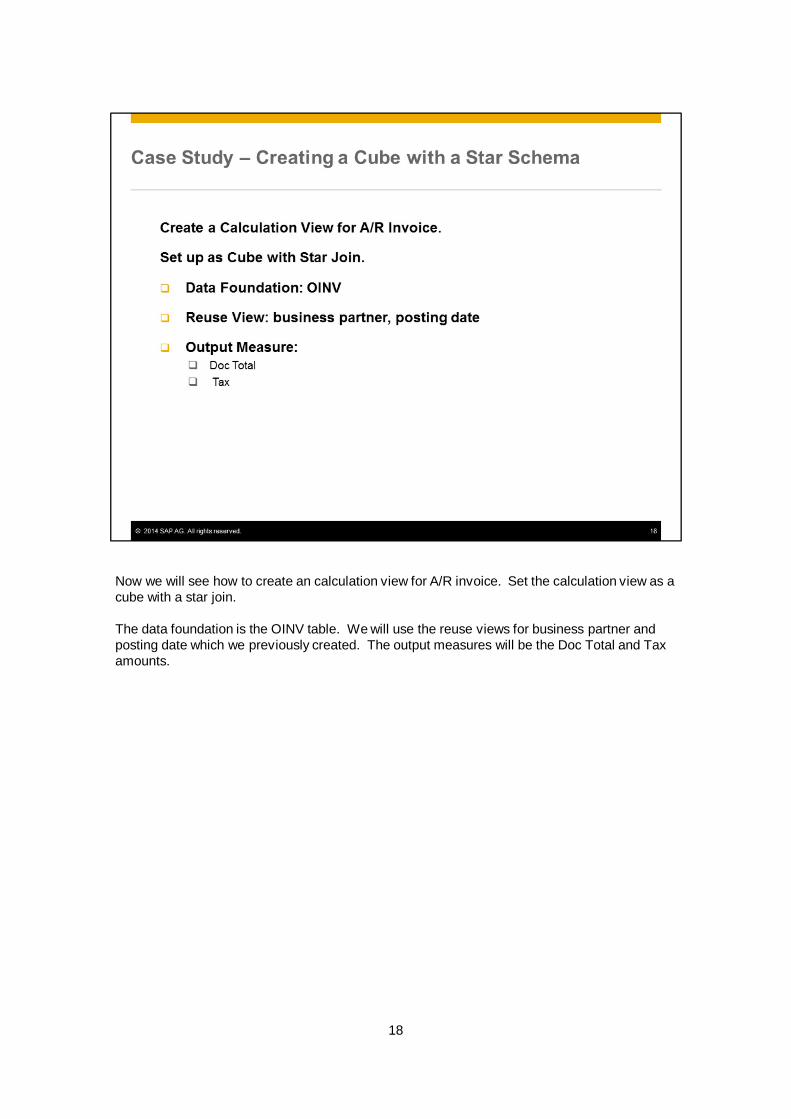
Now we will see how to create an calculation view for A/R invoice. Set the calculation view as acube with a star join.
The data foundation is the OINV table. We will use the reuse views for business partner andposting date which we previously created. The output measures will be the Doc Total and Taxamounts.
18

Key points about modeling transactional data.• Model transactional data by creating a calculation view as a cube with a star join.• A cube with a star join is composed of a data foundation (fact table) joined to dimensions.
This creates a star schema. Star schemas are very efficient due to their structure.• Add a projection node to add the transactional table. Tables can only be added to
projections and not directly to a star join node.• Choose table fields to be the columns for output. This creates the fact table in the projection
node.• Link the projection node to the star join node.• Add reuse views into the star join to create the dimensions. Set the properties for each join.• If needed you can create any calculated columns in the star join output. Always create any
calculated columns in your query views rather than in reuse views. Calculated columnsshould come after aggregation and directly in the query view you plan to use for reporting.
• The semantics node represents the out put of the view. Make any final changes for output inthis node.
• As always save and activate the view, then preview the results.
This concludes the topic on modeling SAP Business One transactional data as a cube with astar schema. Thank you for your time.
20

21