weekly projects update - w/e 8th july
TRANSCRIPT
Weekly Waste Projects Update – week ending 8th
July 2016
Weekly Waste Projects Update: week ending 8th
July 2016 Source: AcuComm Business Database
01
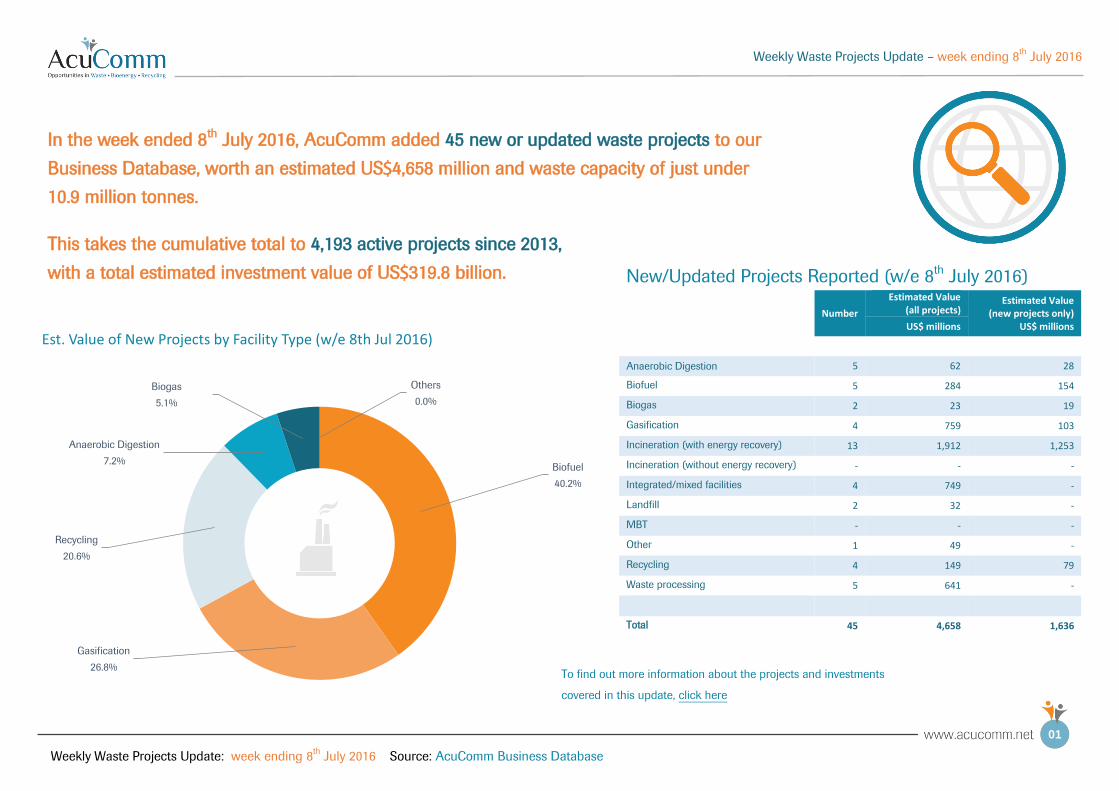
New/Updated Projects Reported (w/e 8th July 2016)
Number
Estimated Value (all projects)
Estimated Value (new projects only)
US$ millions US$ millions
Anaerobic Digestion 5 62 28
Biofuel 5 284 154
Biogas 2 23 19
Gasification 4 759 103
Incineration (with energy recovery) 13 1,912 1,253
Incineration (without energy recovery) - - -
Integrated/mixed facilities 4 749 -
Landfill 2 32 -
MBT - - -
Other 1 49 -
Recycling 4 149 79
Waste processing 5 641 -
Total 45 4,658 1,636
In the week ended 8th July 2016, AcuComm added 45 new or updated waste projects to our
Business Database, worth an estimated US$4,658 million and waste capacity of just under
10.9 million tonnes.
This takes the cumulative total to 4,193 active projects since 2013,
with a total estimated investment value of US$319.8 billion.
Biofuel
40.2%
Gasification
26.8%
Recycling
20.6%
Anaerobic Digestion
7.2%
Biogas
5.1%
Others
0.0%
Est. Value of New Projects by Facility Type (w/e 8th Jul 2016)
To find out more information about the projects and investments
covered in this update, click here
Weekly Waste Projects Update – week ending 8th
July 2016
Weekly Waste Projects Update: week ending 8th
July 2016 Source: AcuComm Business Database
02
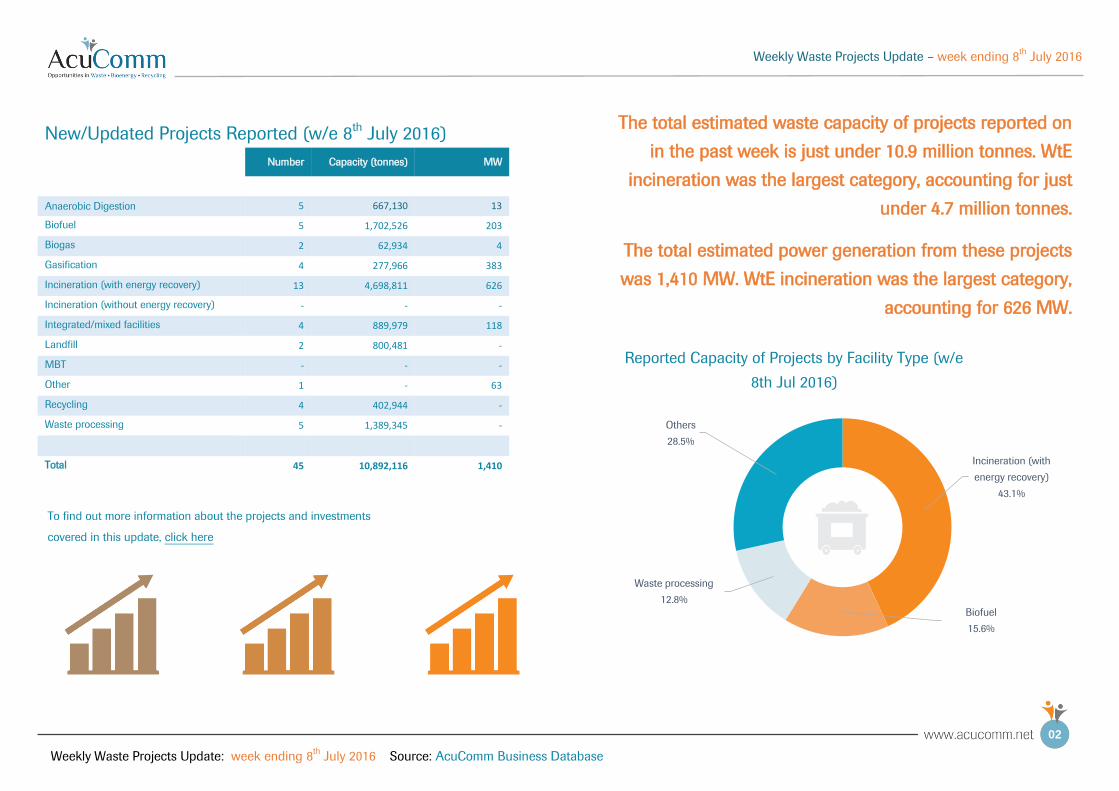
New/Updated Projects Reported (w/e 8th July 2016)
Number Capacity (tonnes) MW
Anaerobic Digestion 5 667,130 13
Biofuel 5 1,702,526 203
Biogas 2 62,934 4
Gasification 4 277,966 383
Incineration (with energy recovery) 13 4,698,811 626
Incineration (without energy recovery) - - -
Integrated/mixed facilities 4 889,979 118
Landfill 2 800,481 -
MBT - - -
Other 1 - 63
Recycling 4 402,944 -
Waste processing 5 1,389,345 -
Total 45 10,892,116 1,410
The total estimated waste capacity of projects reported on
in the past week is just under 10.9 million tonnes. WtE
incineration was the largest category, accounting for just
under 4.7 million tonnes.
The total estimated power generation from these projects
was 1,410 MW. WtE incineration was the largest category,
accounting for 626 MW.
Incineration (with
energy recovery)
43.1%
Biofuel
15.6%
Waste processing
12.8%
Others
28.5%
Reported Capacity of Projects by Facility Type (w/e
8th Jul 2016)
To find out more information about the projects and investments
covered in this update, click here
Weekly Waste Projects Update – week ending 8th
July 2016
Weekly Waste Projects Update: week ending 8th
July 2016 Source: AcuComm Business Database
03
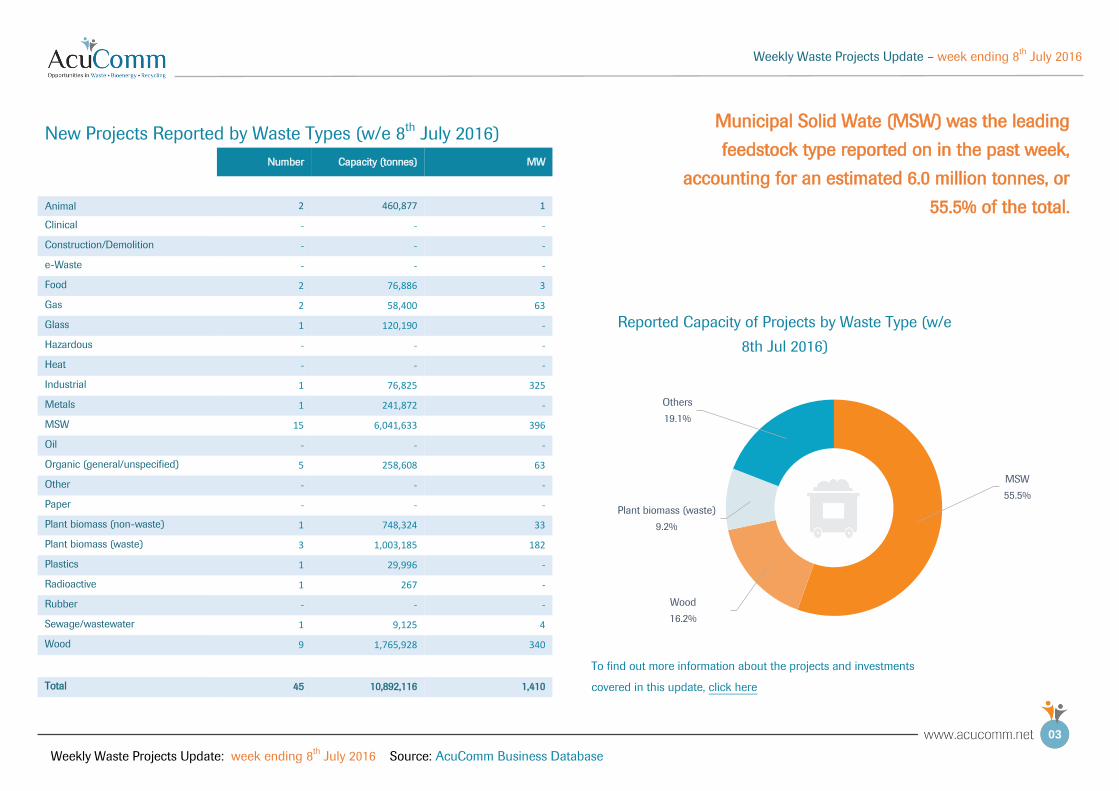
New Projects Reported by Waste Types (w/e 8th July 2016)
Number Capacity (tonnes) MW
Animal 2 460,877 1
Clinical - - -
Construction/Demolition - - -
e-Waste - - -
Food 2 76,886 3
Gas 2 58,400 63
Glass 1 120,190 -
Hazardous - - -
Heat - - -
Industrial 1 76,825 325
Metals 1 241,872 -
MSW 15 6,041,633 396
Oil - - -
Organic (general/unspecified) 5 258,608 63
Other - - -
Paper - - -
Plant biomass (non-waste) 1 748,324 33
Plant biomass (waste) 3 1,003,185 182
Plastics 1 29,996 -
Radioactive 1 267 -
Rubber - - -
Sewage/wastewater 1 9,125 4
Wood 9 1,765,928 340
Total 45 10,892,116 1,410
Municipal Solid Wate (MSW) was the leading
feedstock type reported on in the past week,
accounting for an estimated 6.0 million tonnes, or
55.5% of the total.
MSW
55.5%
Wood
16.2%
Plant biomass (waste)
9.2%
Others
19.1%
Reported Capacity of Projects by Waste Type (w/e
8th Jul 2016)
To find out more information about the projects and investments
covered in this update, click here
Weekly Waste Projects Update – week ending 8th
July 2016
Weekly Waste Projects Update: week ending 8th
July 2016 Source: AcuComm Business Database
04
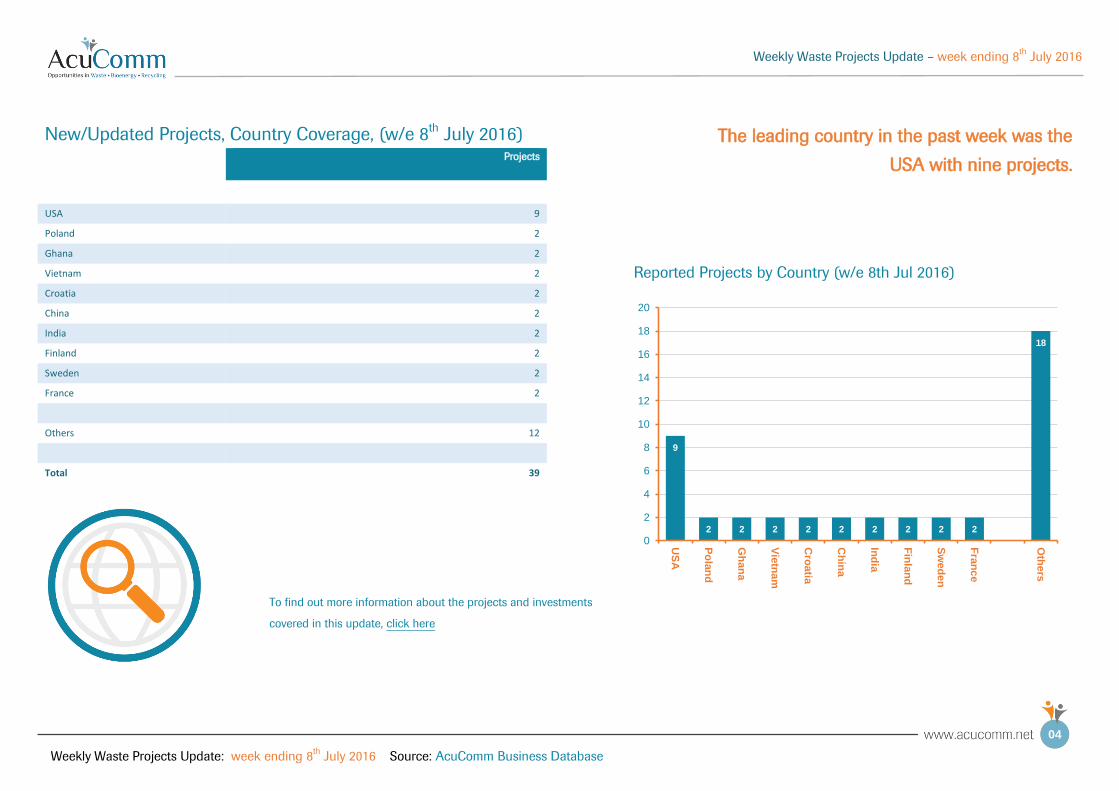
New/Updated Projects, Country Coverage, (w/e 8th July 2016)
Projects
USA 9
Poland 2
Ghana 2
Vietnam 2
Croatia 2
China 2
India 2
Finland 2
Sweden 2
France 2
Others 12
Total 39
The leading country in the past week was the
USA with nine projects.
9
2 2 2 2 2 2 2 2 2 0
18
0
2
4
6
8
10
12
14
16
18
20
US
A
Po
lan
d
Gh
an
a
Vie
tna
m
Cro
atia
Ch
ina
Ind
ia
Fin
lan
d
Sw
ed
en
Fra
nc
e
Oth
ers
Reported Projects by Country (w/e 8th Jul 2016)
To find out more information about the projects and investments
covered in this update, click here
Weekly Waste Projects Update – week ending 8th
July 2016
Weekly Waste Projects Update: week ending 8th
July 2016 Source: AcuComm Business Database
05
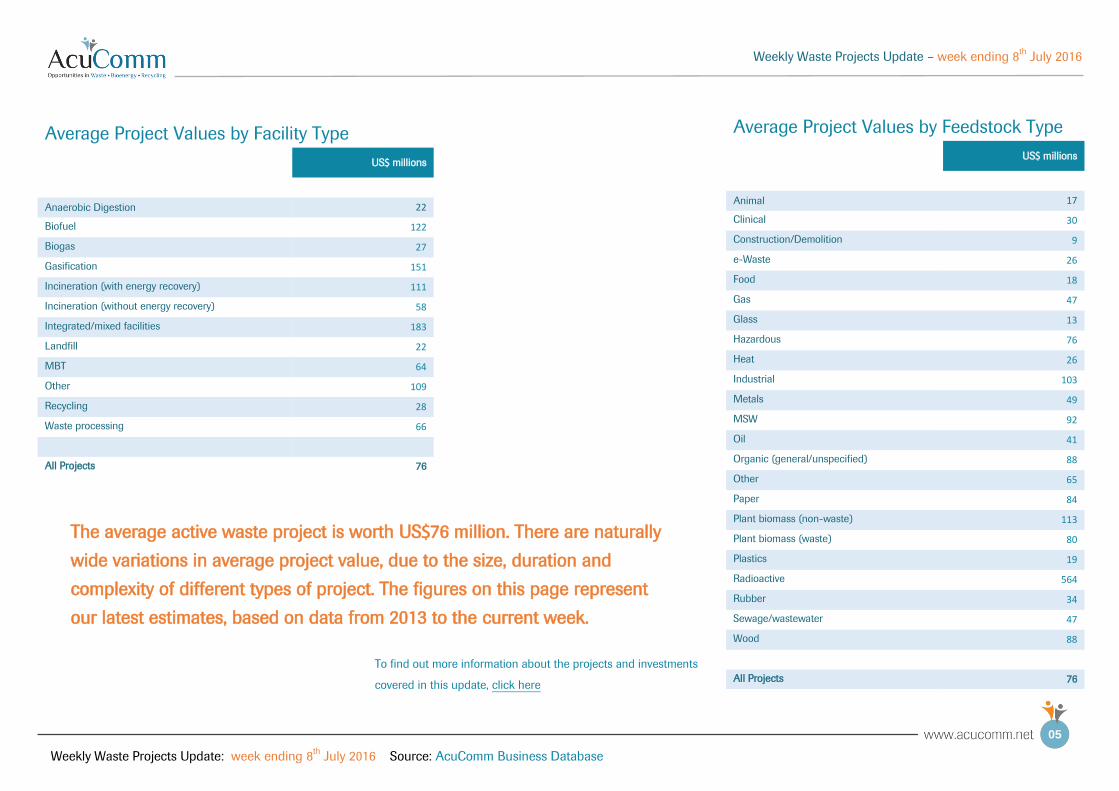
Average Project Values by Facility Type
US$ millions
Anaerobic Digestion 22
Biofuel 122
Biogas 27
Gasification 151
Incineration (with energy recovery) 111
Incineration (without energy recovery) 58
Integrated/mixed facilities 183
Landfill 22
MBT 64
Other 109
Recycling 28
Waste processing 66
All Projects 76
Average Project Values by Feedstock Type
US$ millions
Animal 17
Clinical 30
Construction/Demolition 9
e-Waste 26
Food 18
Gas 47
Glass 13
Hazardous 76
Heat 26
Industrial 103
Metals 49
MSW 92
Oil 41
Organic (general/unspecified) 88
Other 65
Paper 84
Plant biomass (non-waste) 113
Plant biomass (waste) 80
Plastics 19
Radioactive 564
Rubber 34
Sewage/wastewater 47
Wood 88
All Projects 76
The average active waste project is worth US$76 million. There are naturally
wide variations in average project value, due to the size, duration and
complexity of different types of project. The figures on this page represent
our latest estimates, based on data from 2013 to the current week.
To find out more information about the projects and investments
covered in this update, click here
Weekly Waste Projects Update – week ending 8th
July 2016
Weekly Waste Projects Update: week ending 8th
July 2016 Source: AcuComm Business Database
06
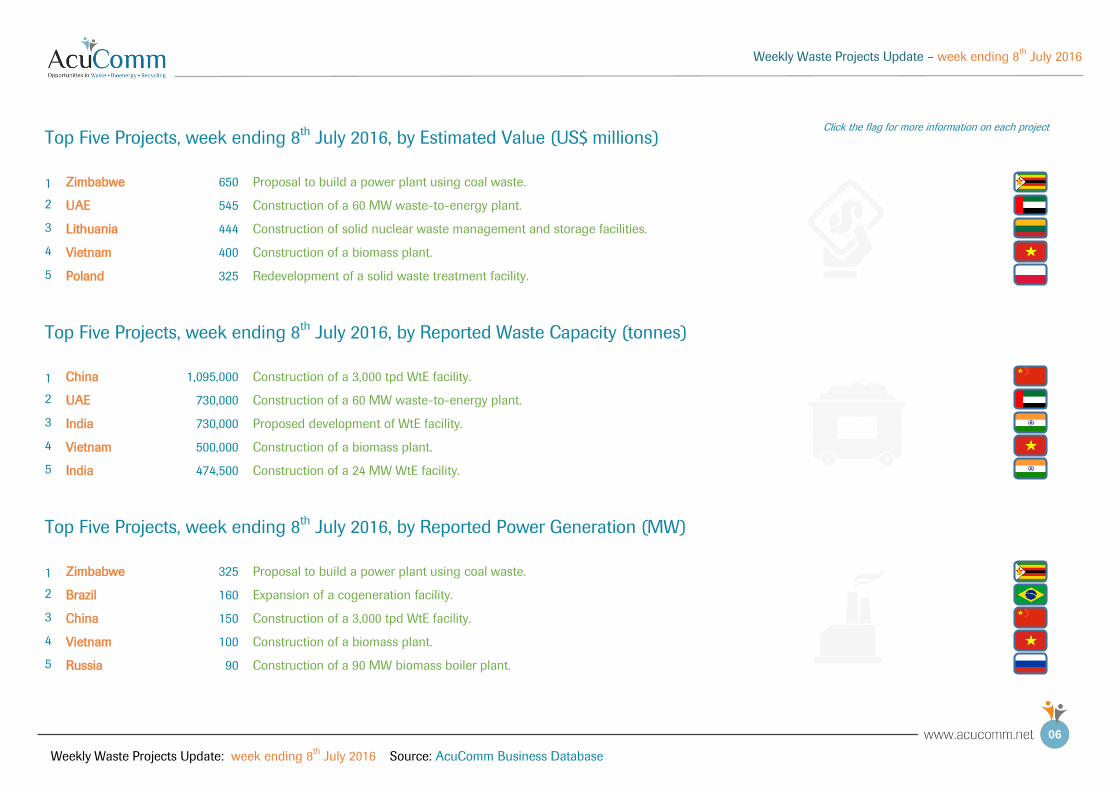
Top Five Projects, week ending 8th July 2016, by Estimated Value (US$ millions) Click the flag for more information on each project
1 Zimbabwe 650 Proposal to build a power plant using coal waste.
2 UAE 545 Construction of a 60 MW waste-to-energy plant.
3 Lithuania 444 Construction of solid nuclear waste management and storage facilities.
4 Vietnam 400 Construction of a biomass plant.
5 Poland 325 Redevelopment of a solid waste treatment facility.
Top Five Projects, week ending 8th July 2016, by Reported Waste Capacity (tonnes)
1 China 1,095,000 Construction of a 3,000 tpd WtE facility.
2 UAE 730,000 Construction of a 60 MW waste-to-energy plant.
3 India 730,000 Proposed development of WtE facility.
4 Vietnam 500,000 Construction of a biomass plant.
5 India 474,500 Construction of a 24 MW WtE facility.
Top Five Projects, week ending 8th July 2016, by Reported Power Generation (MW)
1 Zimbabwe 325 Proposal to build a power plant using coal waste.
2 Brazil 160 Expansion of a cogeneration facility.
3 China 150 Construction of a 3,000 tpd WtE facility.
4 Vietnam 100 Construction of a biomass plant.
5 Russia 90 Construction of a 90 MW biomass boiler plant.
Weekly Waste Projects Update – week ending 8th
July 2016
Weekly Waste Projects Update: week ending 8th
July 2016 Source: AcuComm Business Database
07