webinar on asset management (part 2 of 3) · city of columbus august, 2010 august 26, 2010 kevin...
TRANSCRIPT
City of Columbus
August, 2010
August 26, 2010Kevin Campanella,DPU Assistant Directorand Asset Manager
Webinar on Asset Management(Part 2 of 3)

City of Columbus
August, 2010
Columbus DPU –Customers and Assets
Department of Public Utilities
DOSDDivision of Sewerage and Drainage
DOPWDivision of Power and Water
• 370 circuit miles (distribution)
• 1,330 street light miles• 55,000 street lights
•2 WWTPs, 480 MGD total•6,000 miles of sewers and storm drains
Serve over 1 million customers with sewer, water• 3 WTPs, 240 MGD total • 3,700 miles of water mains
Serve 13,000 electric customers

City of Columbus
August, 2010
Drivers forComprehensive AM Implementation
• DOSD: SSO Consent Order (2002) based on draft CMOM language
• AM approach used to address CMOM requirements• AM approach brought structure and results
– Preventive maintenance cleaning– Predictive maintenance CCTV– Large sewer condition assessment– Revamped FOG program– Performance tracking
Columbus’ Annual Wet-weather Overflows
City of Columbus
August, 2010
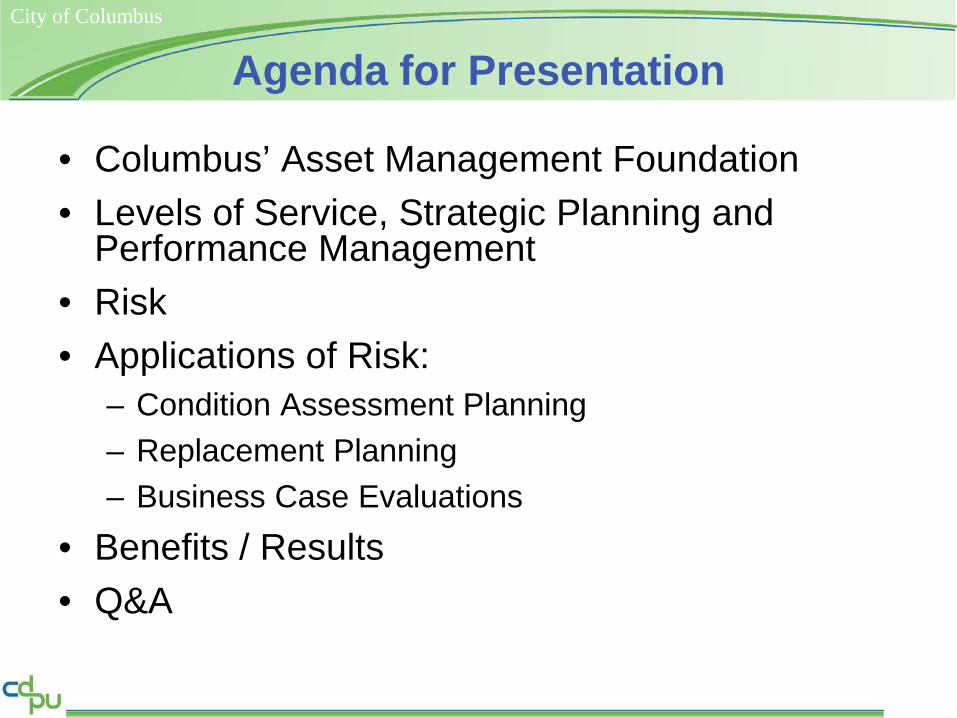
Agenda for Presentation
• Columbus’ Asset Management Foundation• Levels of Service, Strategic Planning and
Performance Management• Risk• Applications of Risk:
– Condition Assessment Planning– Replacement Planning– Business Case Evaluations
• Benefits / Results• Q&A

City of Columbus
August, 2010
Columbus DPU’sAM Program Foundation

City of Columbus
August, 2010
DPU’s EAM Journey
City of Columbus
August, 2010
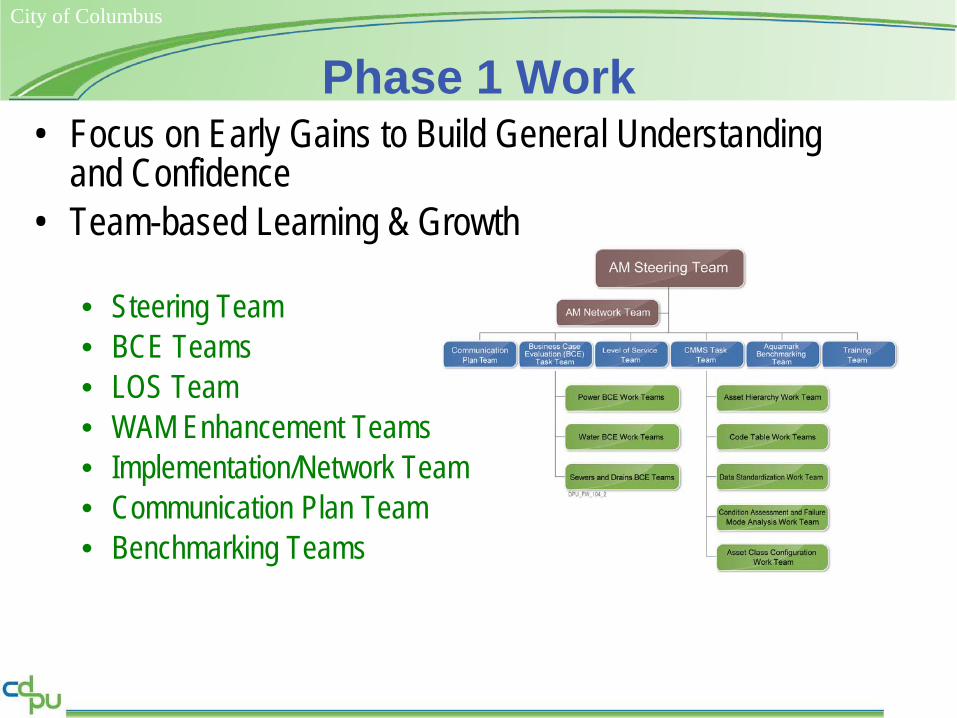
Phase 1 Work• Focus on Early Gains to Build General Understanding
and Confidence• Team-based Learning & Growth
• Steering Team• BCE Teams• LOS Team• WAM Enhancement Teams• Implementation/Network Team• Communication Plan Team• Benchmarking Teams

City of Columbus
August, 2010

City of Columbus
August, 2010
“Blue Ribbon Panel”

City of Columbus
August, 2010
AquaMarkBenchmarking “Functions”

City of Columbus
August, 2010
Participants
Benchmarking Team

City of Columbus
August, 2010
Benchmarking Team, cont’d

City of Columbus
August, 2010
Benchmarking Team, cont’d

City of Columbus
August, 2010
DPU to North AmericaPerformance Comparisons

City of Columbus
August, 2010
16 Improvement Initiatives
1. Risk Framework
2. Levels of Service
3. Performance Management
4. Strategic Plan
5. Project Delivery
6. Asset Management Plans
7. Procedures/Standards
8. Procurement Process
9. Operations Optimization
10. Strategic Maintenance
11. Org. Development
12. Technology Systems
13. Business Plans
14. Quality Management
15. Knowledge Management
16. Efficiency Improvements

City of Columbus
August, 2010
AM Definition
Asset Management is a business model comprised of an integrated set of processes that minimize the life-cycle costof owning, operating, and maintaining assets, at an acceptable level of risk, while continuously delivering established levels of service.
• Levels of Service
• Cost
• Risk

City of Columbus
August, 2010
Levels of Service (LOS), Strategic Planning, and
Performance Management

City of Columbus
August, 2010
Definitions
• Service Level: A measure of the effectiveness of a particular activity or service area perceived by customers.
• Performance Measure: A measure of a service or activity used to compare actual performance against a standard or other target. Key performance indicators are measures of how well a utility is conducting its duties (inward focus)

City of Columbus
August, 2010
Sample Service Levels (Wastewater)
• Treatment facilities meets all permit requirements
• Number of customers reporting odors from the wastewater system per year
• Number of overflows on customer’s property, reaching receiving waters, etc. per year
• Number of back-ups of sewerage within customers’ premises (“flooding”) per year

City of Columbus
August, 2010
Sample Performance Measures(Wastewater)
• Volume of chemicals used at WWTPs• Number of manhole and sewer inspections• Ratio of Total Backlog: New Work Orders per
Month• Length of sewer pipes cleaned per month• Volume of debris removed from sewers per
month

City of Columbus
August, 2010
Levels of Service andPerformance Management Framework
Targets Responsibility
Analysis and Strategic
Adjustment
Performance Communication
City*StatStaff Meetings
SWABCouncil
Etc.
ServiceLevels
CIPWorkflows
Business Processes
Cascading Performance Measures,
Targets
SOPs, Data, Performance
Tracking

City of Columbus
August, 2010
DOSD Performance Management Framework
Target: 1/10 years
Responsible: Administrator/Director
Responsible: Sewer System Maintenance Manager
PM Cleaning Focus
Responsible: Power Cleaning Manager
Total Cleaning Target:1,900,000 feet/year
Responsible: Supervisors, Field
crews
WIBs(#/yr)
WWMP, PDB,Sewer Cleaning,I/I Reduction, etc.
Determine appropriate ratios of Preventive Maintenance,
Emergency, Planned, and Cyclical Cleaning
Crew AssignmentsPerform Cleaning
Data Capture and EntryM2M Reporting

City of Columbus
August, 2010
WIBs in Sewershed 51
DOSD Service Level Example: WIB
City of Columbus
August, 2010
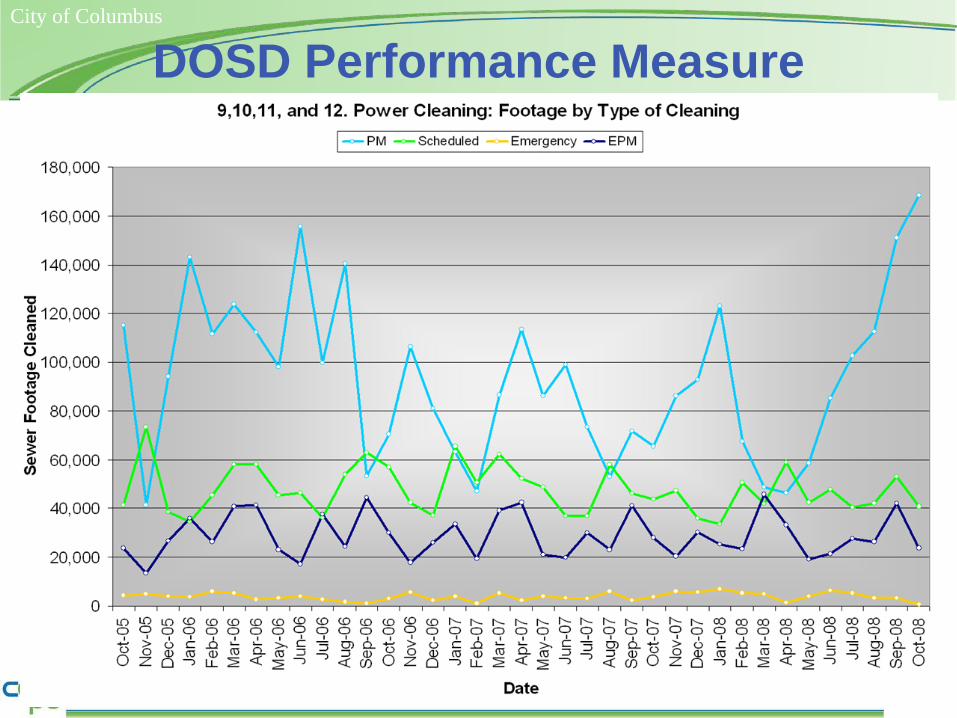
DOSD Performance Measure

City of Columbus
August, 2010
• Enhanced customer service focus• Greater staff understanding of service levels
and their relationship to day-to-day activities• Alignment between customer expectations
and DPU’s mission, strategic plan, services provided
• WIB Example: Reduced WIBs and cost savings for customers!
Expected Benefits

City of Columbus
August, 2010
• Selected and defined 30 LOS across the organization
• Assigned ownership, data collection responsibilities
• Collecting data, reviewing benchmarks• Target setting in Fall, 2010
Achievements to Date - LOS

City of Columbus
August, 2010
LOS Selection Process
Line of Business: Customer Service

City of Columbus
August, 2010
• Annual report to stakeholders / customers
• Present a transparent picture of utility performance
• Include narrative to describe the relevance and implications of each measure
• Future formation of “citizen advisory committees”
LOS Future Reporting Templates
0
5
10
15
20
25
30
2003 2004 2005 2006 2007
Breaks and Leaks Per 100 Miles Per Year
Water Distribution
Current Performance Trends and Issues
• Stable performance driven by rehabilitation and renewal program of 100 miles per year.
• Continued focus on oldest cast iron pipe and worst served areas.
• 2007 performance impacted by spike of 75 third party damage incidents during downtown light rail construction .

City of Columbus
August, 2010
Risk
City of Columbus
August, 2010
“How do you manage risk?”
City of Columbus
August, 2010
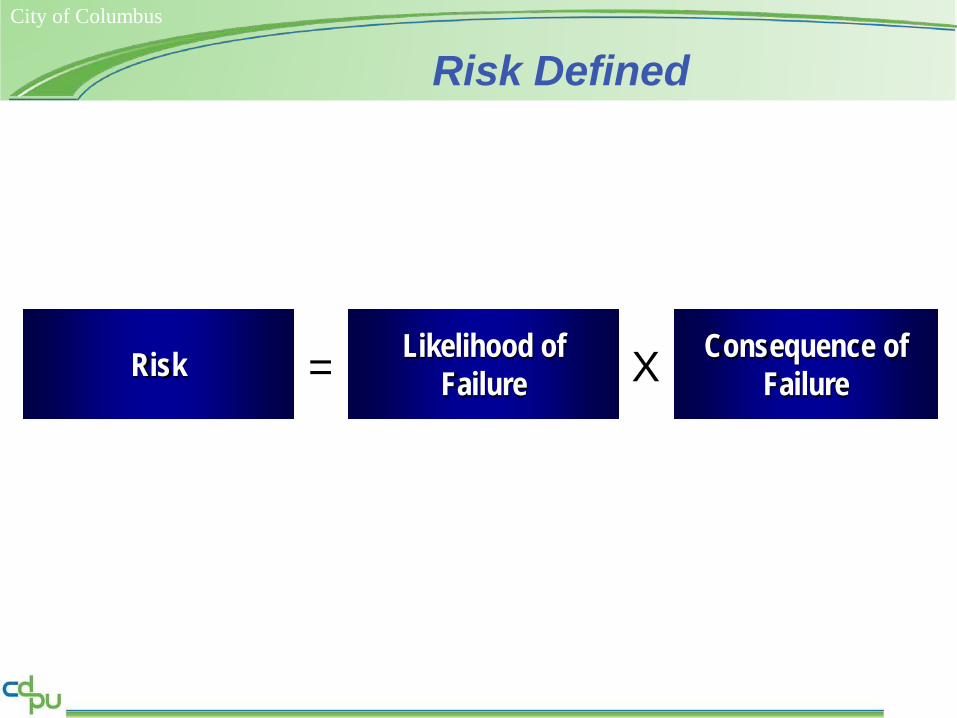
Risk Defined
Likelihood of Failure
Consequence of FailureXRisk =

City of Columbus
August, 2010
Example of Risk Cost: Car Towing
• Average frequency of needing a tow for your make/model of car: 8 years
• Average towing bill: $240• Annualized risk cost = $240 x 1/8 = $30

City of Columbus
August, 2010
Consequences ($)
Like
lihoo
d of F
ailur
e
L M H
Managing Risk
H
M
L
Concentrate your effortsOn highest risk assets

City of Columbus
August, 2010
Risk “Signature” Asset-Based Decisions
Consequences of Failure
Economic Based
Strategy
Condition Monitoring
Based StrategyLi
kelih
ood
of F
ailu
re
Runto Failure / Reactive
Mode
City of Columbus
August, 2010
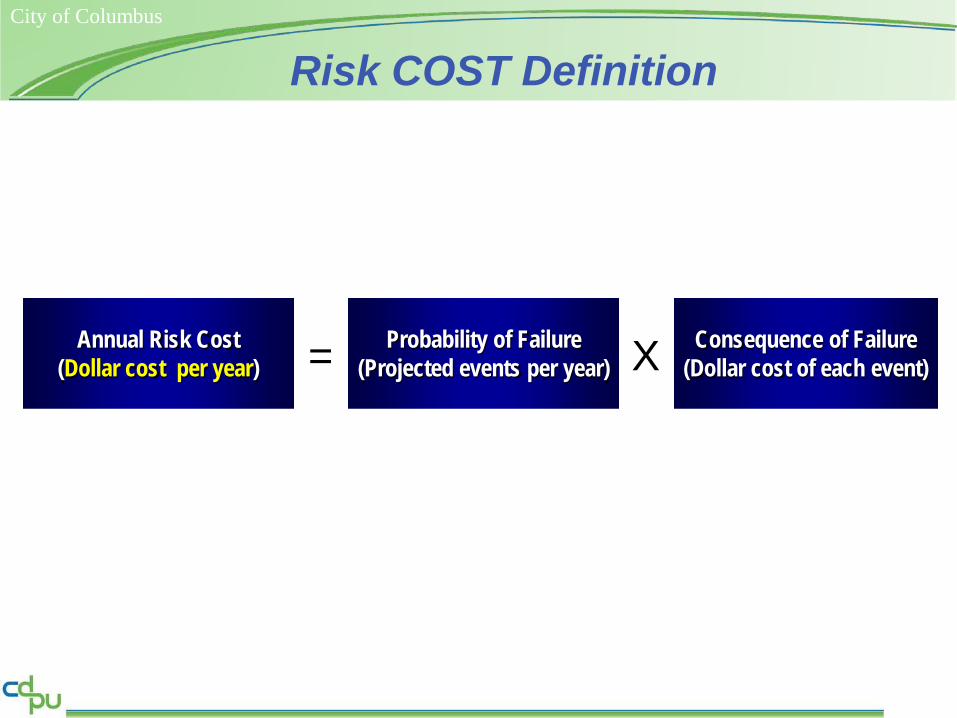
Risk COST Definition
Probability of Failure(Projected events per year)
Consequence of Failure(Dollar cost of each event)XAnnual Risk Cost
(Dollar cost per year) =

City of Columbus
August, 2010
An agency is attempting to decide whether to proactively or reactively clean a segment of sewer
With no cleaning, failure would involve one basement backup every 10 years
Cost per basement backup is $10,000
Example ofRisk Cost Calculation
Probability of Failure(10% per year)
Consequence of Failure($10,000 per event)XAnnual Risk Cost =Annual Risk Cost
($1,000 per year)

City of Columbus
August, 2010
Risk Application:Prioritizing Large Diameter Condition Assessment and
Cleaning Program

City of Columbus
August, 2010
• Satisfy Consent Order• Establish a comprehensive sewer PM Program
– Sewer Shed Based PM progressing (small diameter)– Large Diameter Pipes addressed under this effort
• Gather inspection data • Identify and prioritize R&R projects• Identify cleaning to yield increased capacity
Program Goals
Large Diameter PipeRisk Management Program

City of Columbus
August, 2010

City of Columbus
August, 2010
Risk Factor Examples
• Likelihood of Structural Failure– Material, Age, Tributary Wastewater
Characteristics
• Likelihood of Operational Failure– Slope/Velocity, Debris in Tributary Area, Time
Since Last Cleaning, Capacity Limitations
• Consequences of Failure– Depth, Diameter, Access, Overflow Potential,
Proximity to Structures, Water, RR, etc.

City of Columbus
August, 2010
Alum Creek Interceptor Sewer
Trunk Sewer Sections Pipe
Mat
eria
l
Slop
e / V
elocit
y
Age
Susp
ecte
d D
efici
encie
s
Sate
llite
s
Pum
p St
atio
ns
Tota
l Deb
ris D
epos
ition
Dia
met
er
Aver
age D
epth
Loca
tion
(weig
htin
g fa
ctor
)
Land
Use
Acce
ssib
ility
DSR
Fre
quen
cy
WIB
Fre
quen
cy
Tota
l Con
sequ
ence
of F
ailu
re
Age
Pipe
Mat
eria
l
H2S
Pro
ne
Tota
l Lik
eliho
od o
f Fai
lure
TOTA
LLa
st Cl
eane
d (Y
ear)
42 inch Section 3 3 5 0 0 0 11 1 1 3 3 5 0 0 14 5 3 0 8 33
48 inch Section 3 3 5 2 0 0 13 1 1 2 3 5 0 0 12 5 3 0 8 33
60 inch Section 3 3 5 4 0 0 15 2 1 4 3 3 0 0 18 5 3 0 8 41
* Field knowledge that will affect this program includes knowledge of areas prone to debris or areas not prone to debris** Conclusions from Last Cleaning should include an indication of whether or not Condition Assessment was Performed and if so, what pipe conditions were encountered. Please not if TV logs/tapes are av
Likelihood of Structural Failure FactorsConsequence of Failure FactorsFactors That Contribute to Debris Deposition

City of Columbus
August, 2010
Likelihood of Failure vs. Consequence of Failure
43.5, 14
5
10
15
20
8 23 38 53Consequence of Failure Score
Like
lihoo
d of
Fail
ure S
core
Sewer System Evaluation Results

City of Columbus
August, 2010
Progress on LargeDiameter Sewer Inspection Program
• Cost savings of over $5 million achieved to date by inspecting before cleaning (using sonar technology)
• Inspected nearly 30 miles of large-diameter sewers
• Identified significant structural defects that would have otherwise been undetected
• Condition data and cost estimates used to quantify risks of defects and compare risk-costs to the cost of mitigation projects

City of Columbus
August, 2010
Risk Application:Prioritizing Water Main
Replacement

City of Columbus
August, 2010
Columbus WaterDistribution System
Miles of Water Main 3,665 total miles 3,399 miles </= 16”
Materials 53% Ductile Iron 31% Cast Iron
Size 65% is 6” to 8” pipe
Age 75% installed since 1970

City of Columbus
August, 2010
System Wide Breaks for50-Yr Main Replacement Planning
System Wide – Preliminary Target: 20 breaks / 100 miles / year
System Break Rate 2003-2007(breaks / 100 miles / year)

City of Columbus
August, 2010
Evaluate Water MainsCompared to Service Level Targets
• Analyze break data– Different pipe materials– Different diameters– Era of Installation
• Identify “Worst Performers”

City of Columbus
August, 2010
Develop Pipe Classes andEstimate Remaining Service Life
Over 30 Pipe Classes Identified: Material, Size, and Installation Era
Pipe Effective Service Life: Estimated based on break rate
targets and system wide impacts

City of Columbus
August, 2010
Develop Water Main Prioritizationto Achieve Service Level Targets
• Pipe Condition: Score 1 - 5:– Age relative to effective life– Break rate relative to service levels
• Pipe Criticality: Score 1 - 5:– Pipe size, location, critical customer
• Priority = Condition x Criticality

City of Columbus
August, 2010
Estimate Annual ReplacementRequired to Achieve Service Levels
• Apply pipe priority scoring• Locate pipes on GIS• Evaluate replacement
options• Develop cost projections

City of Columbus
August, 2010
“What If” Scenarios can TestFunding Strategies Versus Service Level Targets
Funding Levels: $15M to $30M

City of Columbus
August, 2010
Business Case Evaluations (BCE)

City of Columbus
August, 2010
Business Case Evaluation
• BCE is a decision making process• In private sector businesses, projects must
benefit the “bottom line”• For municipal utilities, decisions are made
based on Level of Service, Cost, and Risk– Project costs must be lower than the value of
increased service levels or reduction in cost or risk-cost

City of Columbus
August, 2010
BCE Purposes: Utility Sustainability
• BCE’s support utility sustainability by:– Filtering unneeded projects out of the CIP– Ensuring CIP has better value for customers– Enhancing prioritization of projects– Providing transparency in decision-making

City of Columbus
August, 2010
Costs IncludeTriple Bottom Line Values
• Triple Bottom Line:– Financial Costs/Benefits– Social Costs/Benefits– Environmental Costs/Benefits
• In a BCE, assigning dollar values to TBL costs allows for more consistent, less subjective decision making

City of Columbus
August, 2010
Example of Multi-criteria Analysis
Consider a sewer replacement project that is evaluating open-cut versus tunneling construction methods
Alternative Cost
Non-monetary factors score (traffic delay)
Open Cut $150,000 1 (very bad)
Tunneling $200,000 5 (great)

City of Columbus
August, 2010
Example ofApplication of TBL Cost
Alternative CostTBL Social Cost of
a Traffic Delay
Open Cut $150,000 $100,000
Tunneling $200,000 $5,000
1,000 vehicles/day delayed, average delay 15 minutes, construction takes 10 days, assume that the average vehicle would pay $10 to avoid a 15 minute delay:
(1,000 vehicles/day) x (10 days) x ($10/vehicle) = $100,000

City of Columbus
August, 2010
TBL Examples: Financial
Criteria
1 Initial capital costs for design / construction
2 Depreciation or allowance for R&R (based on expected life)
3 Ongoing annual O&M costs
4 Asset Disposal / Salvage Value

City of Columbus
August, 2010
TBL Examples: Social
Criteria
1 Service level improvement/reduction (interruptions, leaks, power quality, backups, customer complaints, etc.)
2 Impact on community economic development
3 Traffic disruption
4 Impact on public / DPU health and safety
5 Other public nuisance (noise, aesthetics, etc.)
Other categories to consider for the future include: potential property damage, affordability, public image. Service level categories can be broken down in further detail.
City of Columbus
August, 2010
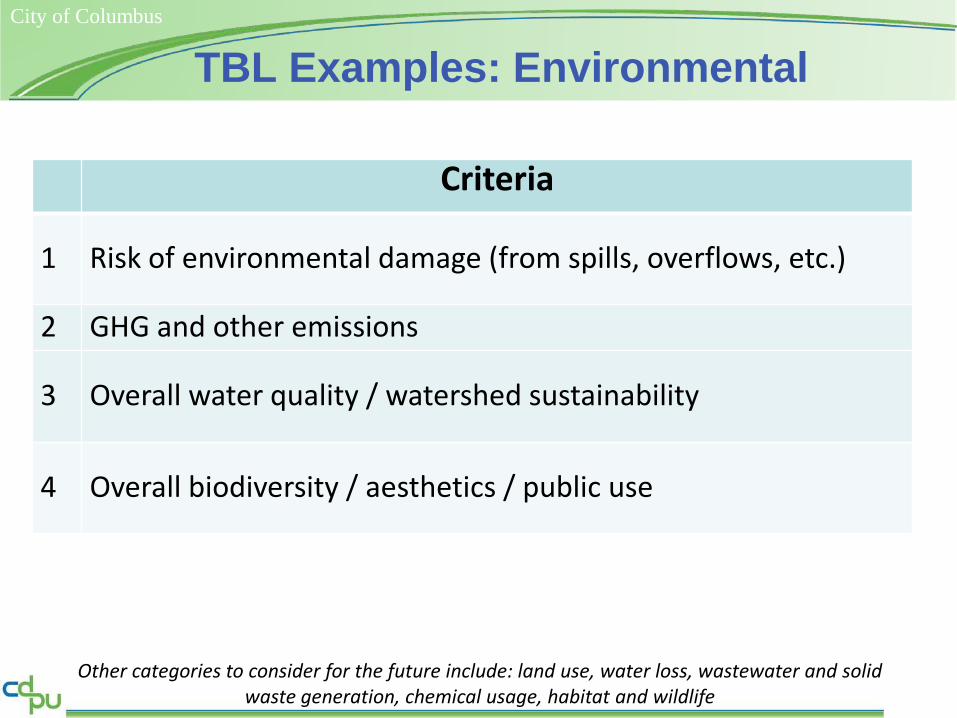
TBL Examples: Environmental
Criteria
1 Risk of environmental damage (from spills, overflows, etc.)
2 GHG and other emissions
3 Overall water quality / watershed sustainability
4 Overall biodiversity / aesthetics / public use
Other categories to consider for the future include: land use, water loss, wastewater and solid waste generation, chemical usage, habitat and wildlife
City of Columbus
August, 2010
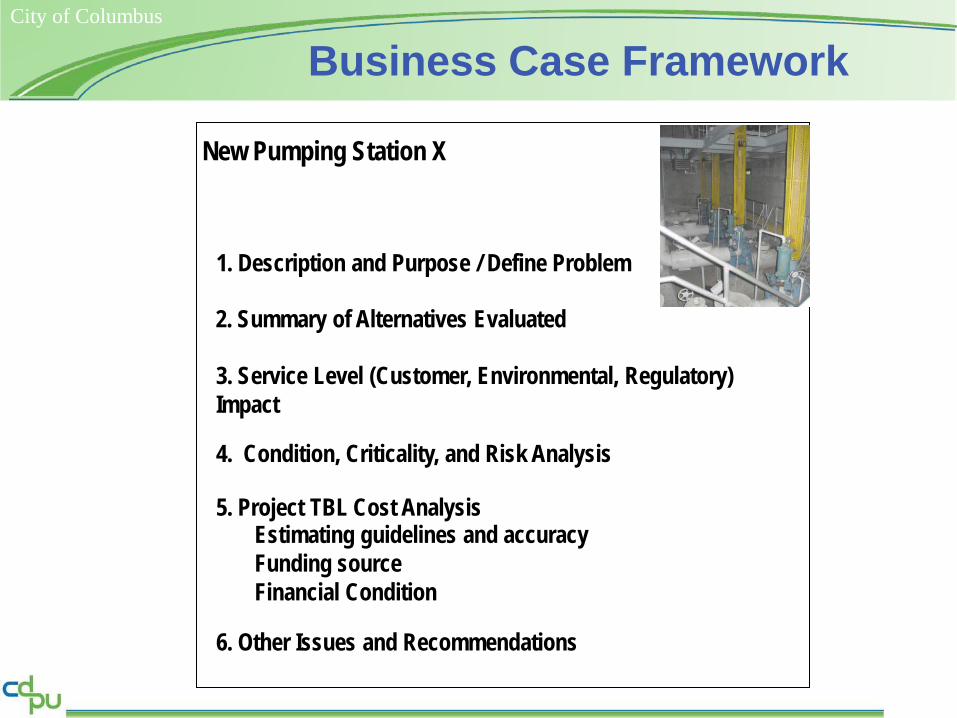
Business Case Framework
New Pumping Station X
1. Description and Purpose / Define Problem
3. Service Level (Customer, Environmental, Regulatory) Impact
5. Project TBL Cost Analysis Estimating guidelines and accuracyFunding sourceFinancial Condition
4. Condition, Criticality, and Risk Analysis
6. Other Issues and Recommendations
2. Summary of Alternatives Evaluated

City of Columbus
August, 2010
BCE Pilot Process
• 10 pilot BCEs were conducted in 2009 –Pilot process goals:– Collect lessons learned– Improve the process– Understand resource demands– Set realistic thresholds for future BCEs
• Targeting full implementation by late 2011

City of Columbus
August, 2010
BCE Case Study:
Addressing the Risk of Aging Transformers at a
Water Treatment Plant

City of Columbus
August, 2010
• Two 5 MVA Transformers (primary and backup)
• Both Installed in 1969• If both fail, 32k customers
lose water service• Upgrade necessary by
2015 – plant expansion• Transformers have good
maintenance history
Plant staff: “We should replace the transformers now!”
Dublin Rd. WTP Transformers

City of Columbus
August, 2010
Transformer Failure Rate
0
10
20
30
40
50
60
70
80
90
100
0 10 20 30 40 50 60 70 80 90 100
Year
Failu
re R
ate
Transformers are 40 yrs. old: Likelihood of
Failure estimated at 10%/year
Transformer Failure Rate Curve

City of Columbus
August, 2010
Scenario Item Cost Cumulative Probability1 Risk Cost
#1Replace One Transformer
$500,000 0.09 $45,000
#2Replace One Transformer
$500,000 0.005 $2,500
#3Social Damage –1 day
$9,280,000 0.00375 $34,800
#4
Replace Two Transformers
$1,875,000
0.00125
$2,344
Emergency Repair/Cleanup
$250,000 $313
Social Damage –14 days
$129,920,000 $162,400
Total $247,356
1 The cumulative probability (CP) is the product of the probabilities (e.g. Scenario #2, CP = 10% x 10% x 50% = 0.005)
#4
#1
#2
#3 #4
#1
#2
#3
Risk Diagram

City of Columbus
August, 2010

City of Columbus
August, 2010

City of Columbus
August, 2010
$0.0
$0.2
$0.4
$0.6
$0.8
$1.0
$1.2
$1.4
$1.6
$1.8
$2.0
1 2 3 4 5 6
Mill
ion
s
Alternative
20
-yr
Net
Pre
sen
t V
alu
e (
NP
V)
Capital Cost Risk Cost
Alternatives#1 Status Quo#2 On-l ine Monitoring Sensor#3 Blast Wal l#4 Replace Now#5 Mobi le Unit#6 HCWP
Expected Life-cycle Costs

City of Columbus
August, 2010
Final Ranking of Alternatives
1. On-line Monitoring2. Blast Wall3. Spare from HCWTP4. Mobile Unit5. Replace Now6. Do Nothing
Original 2 Options

City of Columbus
August, 2010
Early Growing Pains with BCEs
• Risk diagram, statistical methods, and life-cycle costing are not commonly understood or practiced
• TBL: difficult to conceptualize and trust assignment of $ values to “externalities”
• Roles: Let your SMEs be SMEs, not economists or statisticians
• When data is not available, ownership of assumptions (e.g. TBL values) is important

City of Columbus
August, 2010
Benefits Exceed BCE Results
• Staff realized defining the problem is critical• BCEs fostered collaboration• BCEs offered a practical application of risk,
lifecycle cost analysis, and triple bottom line• Decision making is more data driven• Staff more comfortable making assumptions
when data is not available

City of Columbus
August, 2010
Conclusions / Results
City of Columbus
August, 2010
Conclusions and Results
• AM Implementation can be comprehensive or can be implemented in phases
• AM is a change in how people think, and can takes time and solid commitment
• AM can bring results quickly, and results can take on many shapes
• AM is developing rapidly – learn from others’ experiences

City of Columbus
August, 2010
For more information, contact:
Kevin Campanella, PE Assistant Director – Asset Management
Department of Public Utilities - City of Columbus mail: Director's Office - 4th Floor, 910 Dublin Road, Columbus, OH
email: [email protected] phone: 614-645-7117
Questions?