webinar #2 may 28, 2014 commuter corridors study welcome!
TRANSCRIPT

Webinar #2
May 28, 2014
Commuter Corridors Study
Welcome!
Agenda
• Welcome and Introductions• Review of Project Status• Review of Detailed Evaluation Process• Review of Each Corridor’s Recommended
Alternatives and Detailed Analysis Results • Next Steps
2

What is the Purpose of the Study?
• Analyze transportation options in three corridors identified in the region’s 2005 Fixed Guideway Study:– Between Edmond and Downtown OKC– Between Midwest City/TAFB and
Downtown OKC– Between Norman and Downtown OKC
• Generate a “locally preferred alternative” for each corridor
• Corridors connect at Santa Fe Station in downtown OKC
Project Sponsors:• Association of Central Oklahoma
Governments (ACOG)• Del City; Edmond; Midwest City;
Moore; Norman; Oklahoma City
Consultant Lead:• URS Corporation 3

Regional Transit Dialogue (RTD)
4
• Initiated by ACOG in cooperation with local partners in spring 2009
• Engages locally elected officials, policy stakeholders, private sector leaders, and general public
• Designed to define how transit can serve the Central Oklahoma region in the future
• Builds on recommendations from Fixed Guideway Study
• Guides CentralOK!go Commuter Corridors Study– Considers public input from workgroups and
public open houses– Makes final study recommendations
Study Process Overview and Status
5
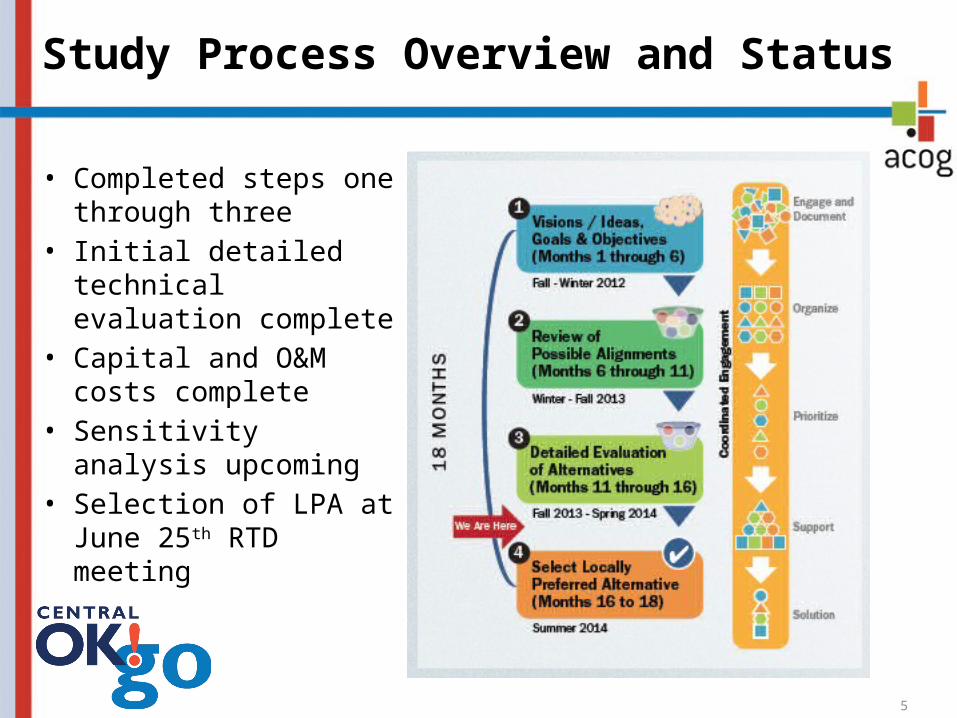
• Completed steps one through three
• Initial detailed technical evaluation complete
• Capital and O&M costs complete
• Sensitivity analysis upcoming
• Selection of LPA at June 25th RTD meeting

Approach to Reaching Locally Preferred Alternative (LPA)
6
Publ
ic/S
take
hold
er S
entim
ent
Tech
nica
l Eva
luati
on (d
etai
led) Capital and O
&M
Costs
LPA
Detailed Evaluation Process
7
• Purpose: Evaluate recommended alternatives to identify the most technically viable alternative in each corridor
• Evaluation criteria based on RTD/workgroup identified goals and objectives– Enhance Regional Mobility– Support Economic Development and Shape Growth– Provide a Balanced and Coordinated Multimodal System– Technical Feasibility added
• Scoring and Ranking– Normalizing/balancing adjustment– Weighting applied to each criterion– Negative scores subtracted from positive scores to determine
“total points” for each alternative
Review of Recommended Alternatives and Detailed Analysis Results: North Corridor
8

9
North Corridor Recommended Alternatives
• N1 (Commuter Rail)– 7 Stations– Uses Existing BNSF ROW– 100% Dedicated ROW
• N2 (LRT/Streetcar/BRT)– 12 Stations– Uses Arterials and BNSF– 100% Dedicated ROW
• N3 (LRT/Streetcar/BRT)– 12 Stations– Uses Arterials and Broadway
Extension– 100% Dedicated ROW
• N7 (Streetcar/BRT)– 11 Stations– Uses Arterials– No Dedicated ROW (i.e., shares
lanes with other vehicles)

Detailed Evaluation Results – North Corridor
10
0
5
10
15
20
25
30
35
40
45
50
55
Enhance Regional Connectivity
Support Economic Development and Shape Growth
Provide a Balanced & Coordinated Multimodal System
Technical Feasibility
N1 (CR) N2 (BRT) N2 (LRT) N2 (SC) N3 (BRT) N3 (LRT) N3 (SC) N7 (BRT) N7 (SC)

Preliminary Ridership Estimates – North Corridor
Alternative Daily Ridership
Annual Ridership
N1 (Commuter Rail) 1,970 600,000
N2 (BRT/LRT/Streetcar) 3,300 1,008,000
N3 (BRT/LRT/Streetcar) 3,300 1,008,000N7 (BRT/Streetcar) 370 114,000
11
Source: Alliance Transportation Group, 2014.
• Ridership likely under-reported
• Model showing short commuter rail trips
• LRT Mode – Ridership threshold not met
• Potential to capture LRT ridership through Streetcar extension
• Sensitivity Analysis upcoming • Assumes “gold standard” investments

Assumptions:
• Capital costs developed using cost per mile approach (urban, suburban, rural)
• Alternatives N1 & N2: Assumes BNSF willing to share ROW and accommodate schedule frequency
• Alternative N1: Assumes construction of single track plus some additional station and passing sidings
• Enhanced local bus service necessary for all alternatives at additional cost
• Operate seven days per week
• Operating hours: 5:30am – 10:30pm (weekdays); 7:00am – 9:00pm (weekends)
• Headways: 15 min (peak); 30 min (off-peak)
Capital and O&M Costs – North Corridor
12
Alternative Capital Costs (mil) Annualized Capital Costs (mil) Annualized O&M Costs (mil)
N1 (Commuter Rail) $260 – $360 $18.1 $3.8
N2 (LRT) $720 – $980 $48.7 $5.3
N2 (Streetcar) $610 – $830 $41.6 $4.2
N2 (BRT) $510 – $690 $34.2 $3.2
N3 (LRT) $920 – $1,240 $62.2 $5.3
N3 (Streetcar) $790 – $1,070 $53.3 $4.2
N3 (BRT) $600 – $820 $40.4 $3.2
N7 (Streetcar) $550 – $750 $37.8 $5.7
N7 (BRT) $50 – $70 $3.5 $4.3
Source: URS, 2014.

Detailed Evaluation Results and Costs – Side-by-Side Comparison
13
0
5
10
15
20
25
30
35
40
45
50
55
Enhance Regional ConnectivitySupport Economic Development and Shape GrowthProvide a Balanced & Coordinated Multimodal SystemTechnical Feasibility
N1 (CR)
N2 (BRT)
N2 (LRT)
N2 (SC)
N3 (BRT)
N3 (LRT)
N3 (SC)
N7 (BRT)
N7 (SC)
N1 (CR)
N2 (BRT)
N2 (LRT)
N2 (SC)
N3 (BRT)
N3 (LRT)
N3 (SC)
N7 (BRT)
N7 (SC)
$0
$10
$20
$30
$40
$50
$60
$70
Annualized O&M Cost (mil)Annualized Capital Cost (mil)

URS Team’s Observations
• High-capacity transit warranted in the region• LRT probably not warranted• Model suggests transit is more competitive for shorter trips• Trips are going to Downtown OKC but pass-through trips
are low• Detailed analysis trend consistent with ridership numbers;
criteria is weighted toward ridership inputs• Commuter rail scores lower for population and activity
centers, but higher for technical feasibility and environmental/social
• North Corridor– Navigating across I-44 presents engineering challenges except for
CR that uses existing track– Potential to extend streetcar north to NW 63rd or CR on BNSF
ROW to gain benefit but not the full cost of N2 14

15
Review of Recommended Alternatives and Detailed Analysis Results: South Corridor

16
South Corridor Recommended Alternatives
• S1 (Commuter Rail)– 9 Stations– Uses Existing BNSF ROW– 100% Dedicated ROW
• S2 (Streetcar/BRT)– 11 Stations– Uses Arterials and BNSF– 100% Dedicated ROW
• S4 (Streetcar/BRT)– 12 Stations– Uses Arterials and IH-35– 100% Dedicated ROW

Detailed Evaluation Results – South Corridor
17
S1 (CR) S2 (BRT) S2 (SC) S4 (BRT) S4 (SC)0
5
10
15
20
25
30
35
40
45
50
Technical FeasibilityProvide a Balanced & Coordinated Multimodal SystemSupport Economic Development and Shape GrowthEnhance Regional Connectivity

Preliminary Ridership Estimates – South Corridor
Alternative Daily Ridership
Annual Ridership
S1 (Commuter Rail) 3,060 932,000
S2 (BRT/Streetcar) 3,810 1,161,000
S4 (BRT/Streetcar) 4,270 1,302,000
18
Source: Alliance Transportation Group, 2014.
• Ridership likely under-reported
• Model showing short commuter rail trips
• Sensitivity Analysis upcoming
• Assumes “gold standard” investments

Capital and O&M Costs – South Corridor
19
Alternative Capital Costs (mil)
Annualized Capital Costs (mil)
Annualized O&M Costs (mil)
S1 (Commuter Rail) $310 – $410 $21.5 $5.3
S2 (Streetcar) $640 – $860 $43.5 $4.5
S2 (BRT) $510 – $690 $34.2 $3.4
S4 (Streetcar) $850 – $1,150 $57.3 $4.5
S4 (BRT) $600 – $820 $40.6 $3.4
Source: URS, 2014.
Assumptions:
• Capital costs developed using cost per mile approach (urban, suburban, rural)
• Alternatives S1 & S2: Assumes BNSF willing to share ROW and accommodate schedule frequency
• Alternative S1: Assumes construction of single track plus some additional station and passing sidings
• Enhanced local bus service necessary for all alternatives at additional cost
• Operate seven days per week
• Operating hours: 5:30am – 10:30pm (weekdays); 7:00am – 9:00pm (weekends)
• Headways: 15 min (peak); 30 min (off-peak)

Detailed Evaluation Results and Costs – Side-by-Side Comparison
20
S1 (CR) S2 (BRT) S2 (SC) S4 (BRT) S4 (SC)0
5
10
15
20
25
30
35
40
45
50
Technical Feasibility
Provide a Balanced & Coordinated Multimodal System
Support Economic Development and Shape Growth
Enhance Regional Connectivity
S1 (CR) S2 (BRT) S2 (SC) S4 (BRT) S4 (SC)$0
$10
$20
$30
$40
$50
$60
$70
Annualized O&M Cost (mil)Annualized Capital Cost (mil)
URS Team’s Observations
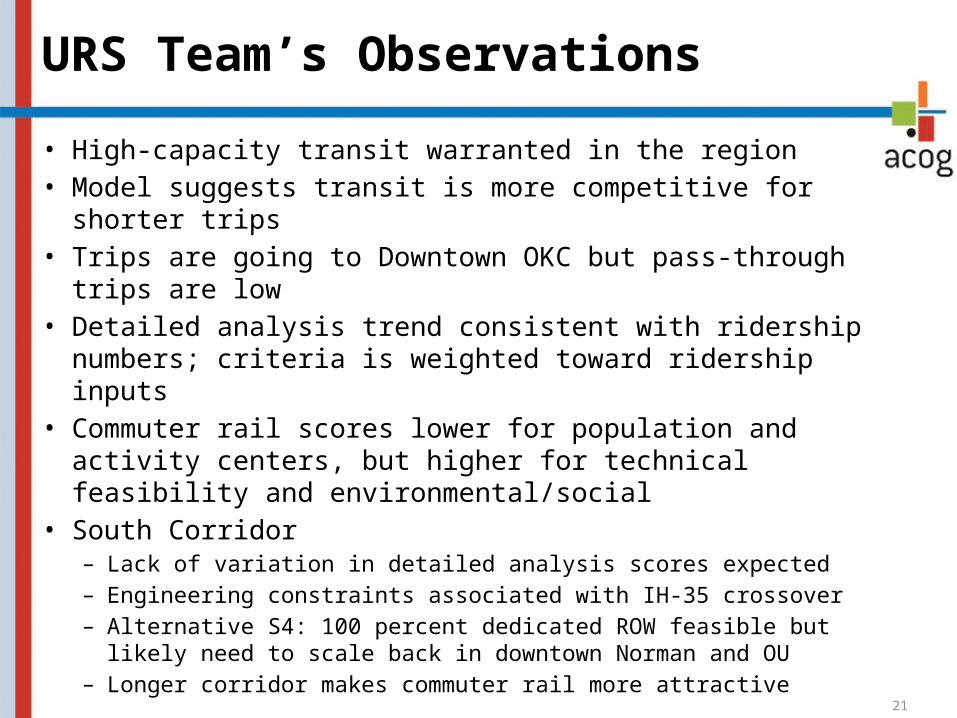
• High-capacity transit warranted in the region• Model suggests transit is more competitive for shorter trips• Trips are going to Downtown OKC but pass-through trips are
low• Detailed analysis trend consistent with ridership numbers;
criteria is weighted toward ridership inputs• Commuter rail scores lower for population and activity
centers, but higher for technical feasibility and environmental/social
• South Corridor– Lack of variation in detailed analysis scores expected– Engineering constraints associated with IH-35 crossover– Alternative S4: 100 percent dedicated ROW feasible but likely need
to scale back in downtown Norman and OU– Longer corridor makes commuter rail more attractive 21

22
Review of Recommended Alternatives and Detailed Analysis Results: East Corridor

23
East Corridor Recommended Alternatives
E1 (Commuter Rail)• 6 Stations• Uses Existing UP
and Abandoned ROW
• 100% Dedicated ROW
E5 (LRT/Streetcar/BRT)
• 7 Stations• Uses Arterials
and Abandoned ROW
• 50% Dedicated ROW
E6 (Streetcar/BRT)
• 10 Stations
• Uses Arterials
• No Dedicated ROW (i.e., Mixed-Flow)

24
Detailed Evaluation Results – East Corridor
E1 (CR) E5 (BRT) E5 (LRT) E5 (SC) E6 (BRT) E6 (SC)0
10
20
30
40
50
Technical FeasibilityProvide a Balanced & Coordinated Multimodal SystemSupport Economic Development and Shape GrowthEnhance Regional Connectivity

Preliminary Ridership Estimates – East Corridor
Alternative Daily Ridership
Annual Ridership
E1 (Commuter Rail) 1,150 352,000
E5 (BRT/LRT/Streetcar) 260 80,200
E6 (BRT/Streetcar) 270 82,700
25
Source: Alliance Transportation Group, 2014.
• Ridership likely under-reported
• Disparity between E1 and E5/E6 ridership likely due to travel time differences
• Sensitivity Analysis upcoming
• Assumes “gold standard” investments

Alternative Capital Costs (mil)
Annualized Capital Costs (mil)
Annualized O&M Costs (mil)
E1 (Commuter Rail) $200 - $280 $14.1 $3.4E5 (LRT) $370 - $510 $25.5 $3.8E5 (Streetcar) $320 - $440 $21.9 $3.0
E5 (BRT) $140 - $200 $9.8 $2.3
E6 (Streetcar) $430 - $580 $29.0 $4.2
E6 (BRT) $40 - $60 $3.1 $3.2
Capital and O&M Costs – East Corridor
26
Source: URS, 2014.
Assumptions:
• Capital costs developed using cost per mile approach (urban, suburban, rural)
• Alternative E1: Assumes UP willing to share ROW and accommodate schedule frequency
• Alternative E1: Assumes construction of single track plus some additional station and passing sidings
• Enhanced local bus service necessary for all alternatives at additional cost
• Operates seven days per week
• Operating hours: 5:30am – 10:30pm (weekdays); 7:00am – 9:00pm (weekends)
• Headways: 15 min (peak); 30 min (off-peak)
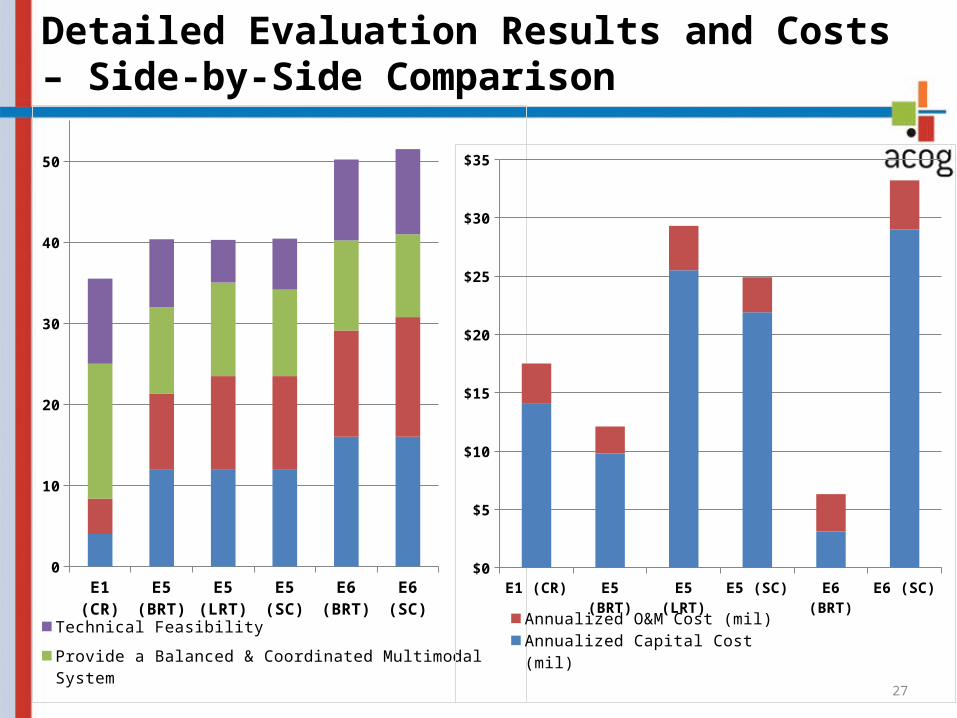
Detailed Evaluation Results and Costs – Side-by-Side Comparison
27
E1 (CR) E5 (BRT) E5 (LRT) E5 (SC) E6 (BRT) E6 (SC)0
10
20
30
40
50
Technical FeasibilityProvide a Balanced & Coordinated Multimodal SystemSupport Economic Development and Shape GrowthEnhance Regional Connectivity
E1 (CR) E5 (BRT) E5 (LRT) E5 (SC) E6 (BRT) E6 (SC)$0
$5
$10
$15
$20
$25
$30
$35
Annualized O&M Cost (mil)
Annualized Capital Cost (mil)

URS Team’s Observations
28
• High-capacity transit warranted in the region• Trips are going to Downtown OKC but pass-through trips
are low• East Corridor
– Opportunity to use abandoned rail ROW– High exchange of ridership between Air Depot area in Midwest City
and downtown OKC– Ridership results indicate high value placed on travel time in the
corridor– Service to Tinker AFB riders challenging and harder to predict– Alternative E1: Engineering constraints – Alternative E1 option on Reno should be considered

Next Steps in CentralOK!go Study
29
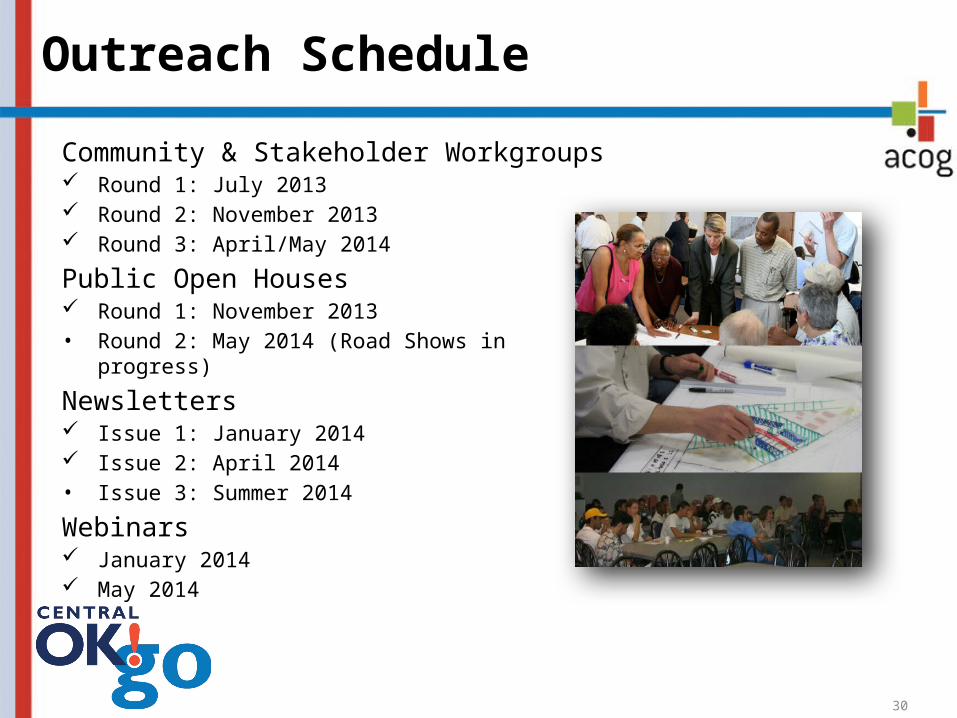
Outreach Schedule
Community & Stakeholder Workgroups Round 1: July 2013 Round 2: November 2013 Round 3: April/May 2014
Public Open Houses Round 1: November 2013 • Round 2: May 2014 (Road Shows in progress)
Newsletters Issue 1: January 2014 Issue 2: April 2014• Issue 3: Summer 2014
Webinars January 2014 May 2014
30

Public Outreach – Road Shows
31
• “Road Shows” in nine locations:– May Fair Arts Festival – Norman– University of Central Oklahoma – Edmond– University of Oklahoma – Norman– Rose State College – Midwest City– Touch-a-Truck – Edmond– Premiere on Film Row – Oklahoma City– Old Town Farmers Market – Moore– Edmond Jazz and Blues Festival – Edmond– Made in Oklahoma Wine, Beer, and Food
Festival – Midwest City
• Surveys completed
• Upcoming Road ShowSaturday May 31st, 11:00 PM to 3:00 PM
Made in Oklahoma Wine, Beer and Food Festival
Reed Center, 5800 Will Rogers Road, Midwest City

Proposed Next Steps
May Public Outreach: “Road Shows”• Provide results of detailed technical
analysis and capital and O&M costs
• Receive feedback on results as well as preferred alternatives
May 30th RTD Work Session• Finish review of North Corridor
• Review East and South Corridors
• Review technical recommendation for each corridor
• Consider public & stakeholder feedback
• Identify preliminary LPAs
June 25th RTD Meeting• Formalize LPA for each corridor
32
Identify Screen Detail Refine

We need your input and your help!
• Complete the survey– www.surveymonkey.com/s/CentralOKgoWebinar– Visit project website: centralokgo.org– Sign up for our mailing list– Stay current on project updates
• Tell your friends, family, and co-workers
• Stay engaged and help us plan for high-capacity transit in Central Oklahoma!
33
Commuter Corridors Study
Thank you for your attendance!
Any Questions or Comments?
Webinar #2
May 28, 2014