weathering of aromatic polyester coatings - pure - … · weathering of aromatic polyester coatings...
TRANSCRIPT

Weathering of aromatic polyester coatings
Malanowski, P.
DOI:10.6100/IR639672
Published: 01/01/2009
Document VersionPublisher’s PDF, also known as Version of Record (includes final page, issue and volume numbers)
Please check the document version of this publication:
• A submitted manuscript is the author's version of the article upon submission and before peer-review. There can be important differencesbetween the submitted version and the official published version of record. People interested in the research are advised to contact theauthor for the final version of the publication, or visit the DOI to the publisher's website.• The final author version and the galley proof are versions of the publication after peer review.• The final published version features the final layout of the paper including the volume, issue and page numbers.
Link to publication
Citation for published version (APA):Malanowski, P. (2009). Weathering of aromatic polyester coatings Eindhoven: Technische UniversiteitEindhoven DOI: 10.6100/IR639672
General rightsCopyright and moral rights for the publications made accessible in the public portal are retained by the authors and/or other copyright ownersand it is a condition of accessing publications that users recognise and abide by the legal requirements associated with these rights.
• Users may download and print one copy of any publication from the public portal for the purpose of private study or research. • You may not further distribute the material or use it for any profit-making activity or commercial gain • You may freely distribute the URL identifying the publication in the public portal ?
Take down policyIf you believe that this document breaches copyright please contact us providing details, and we will remove access to the work immediatelyand investigate your claim.
Download date: 06. Jun. 2018
Weathering of aromatic polyester coatings
PROEFSCHRIFT
ter verkrijging van de graad van doctor aan de Technische Universiteit Eindhoven, op gezag van de Rector Magnificus, prof.dr.ir. C.J. van Duijn, voor een
commissie aangewezen door het College voor Promoties in het openbaar te verdedigen
op maandag 26 januari 2009 om 16.00 uur
door
Przemysław Malanowski
geboren te Golub-Dobrzyń, Polen

Dit proefschrift is goedgekeurd door de promotoren: prof.dr. R.A.T.M. van Benthem en prof.dr. G. de With Copromotor: dr. J. Laven Przemysław Malanowski Weathering of aromatic polyester coatings Eindhoven University of Technology, 2009 A catalogue record is available from Eindhoven University of Technology Library ISBN: 978-90-386-1489-2 An electronic copy of this Thesis is available at the website of the Library of the Eindhoven University of Technology. http:/w3.tue.nl/en/services/library/digilib/publications from tue/dissertations/ The research described in this Thesis forms part of the research program of the Dutch Polymer Institute (DPI), Coating Technology Area, Project # 419. Cover design: Przemysław Malanowski and Paul Verspaget Printed at the Universiteitsdrukkerij, Eindhoven University of Technology
Table of Contents 1 General Introduction 1
1.1 Introduction 2 1.2 Mechanism of photodegradation 2
1.2.1 Initiation 3 1.2.2 Propagation 5 1.2.3 Termination 6
1.3 Photostabilization of polymers 7 1.4 Photodegradation as a surface effect 8 1.5 Exposure conditions 10
1.5.1 Outdoor weathering 10 1.5.2 Laboratory weathering 11
1.6 Aim and outline of the thesis 13 2 Molecular mechanism of photolysis and photooxidation of poly(neopentyl isophthalate) 19
2.1 Introduction 20 2.2 Experimental 22 2.3 Results and discussion 24
2.3.1 ATR-FTIR analysis 24 2.3.2 SEC analysis 26 2.3.3 MALDI-ToF MS analysis 27 2.4 Mechanism of photolysis and photooxidation 33 2.4.1 Norrish type I photocleavage, case A 34 2.4.2 Norrish type I photocleavage, case B 36 2.4.3 Norrish type I photocleavage, case C 36 2.4.4 Hydrogen abstraction from the polymer backbone
followed by oxidation reactions 38 2.4.5 Final remarks 40 2.5 Conclusions 41 3 Photodegradation of poly(neopentyl isophthalate) in laboratory and outdoor conditions 43
3.1 Introduction 44 3.2 Experimental 46 3.3 Results 48
3.3.1 ATR-FTIR analysis 48 3.3.2 SEC analysis 50 3.3.3 MALDI-ToF MS analysis 53
3.4 Discussion 57 3.5 Comparison of relative photodegradation rates of PNI as obtained experimentally and as predicted from calculated number of absorbed
photons 62 3.6 Conclusions 64

4 Photodegradation of polyester based on isophthalate and terephthalate units 67
4.1 Introduction 68 4.2 Experimental 69 4.3 Results 71
4.3.1 ATR-FTIR analysis 71 4.3.2 SEC analysis 74 4.3.3 Thickness loss 77 4.3.4 MALDI-ToF MS analysis 78
4.4 Mechanism of the photolysis and photooxidation of PNI and PNT 81 4.5 Conclusions 84
5 Mechanism of crosslinking of poly(neopentyl phthalate) during photodegradation 87
5.1 Introduction 88 5.2 Experimental 89 5.3 Results and Discussion 92
5.3.1 PNI aged in the UVACUBE 92 5.3.1.1 Gel fraction 92 5.3.1.2 Gel morphology 93 5.3.1.3 Chemical characterization of the gel 95 5.3.1.4 Mechanism of crosslinking 101
5.3.2 PNI and PNT aged in the Suntest XXL+ 103 5.4 Conclusions 105
6 Correlations between chemical and physical changes of polyester coatings under UV irradiation 107
6.1 Introduction 108 6.2 Experimental 109 6.3 Results 113
6.3.1 PNI exposed in the UVACUBE 113 6.3.1.1 Chemical characterization 113 6.3.1.2 Surface hardness 118 6.3.1.3 Discussion 120
6.3.2 PNI and PNT exposed in the Suntest XXL+ 121 6.3.2.1 Chemical characterization 121 6.3.2.2 Surface hardness 123 6.3.2.3 Discussion 124
6.4 Conclusions 127 Appendix 6.1 129
7 Epilogue 131 Summary 135 Acknowledgments 137 Curriculum Vitae 139

1
General Introduction

Chapter 1
2
1.1 Introduction Man-made organic coatings are indispensible for enhancing the quality of
human life. Such organic coatings are thin, often pigmented layers of a polymer
network applied on a substrate. The main part of an organic coating is the polymeric
binder which consists of a polymer having reactive groups (resin) and often a
crosslinker. The most commonly used resins in coating technology are acrylics,
polyesters, alkyds and epoxides[1,2]. Coatings are mainly used for protection and
decoration of goods made of wood, metal and plastic. They can be applied indoors
(furniture, interior of buildings, electronic devices, etc.) and outdoors (cars, airplanes,
bridges, exterior of buildings, etc.). One of the essential characteristics of a coating is
its resistance to the influence of the environment in which it is used. This is especially
important when coatings are used outdoors. In this case resistance to the environment
can be defined as a “weathering durability”.
In outdoor conditions, many factors simultaneously influence the life time of
polymeric coatings. The combined action of UV radiation, heat and moisture can
cause changes in the chemical structure of the polymers[3-6]. Degradation of polymers
outdoors is usually referred to as “weathering”. UV radiation is known to be the
dominant factor affecting durability of polymeric coatings. Degradation caused by
UV radiation, is usually named “photodegradation”. The chemical reactions taking
place such as chain scission, crosslinking and oxidation influence the physical
properties of the coatings[7-10] and ultimately may lead to cracking, gloss loss,
blistering and delamination[11,12]. Such a degraded coating can not maintain its
protective and decorative functions anymore. Study of the photodegradation
phenomena is essential to better understand and subsequently improve the weathering
stability of polymeric coatings.
1.2 Mechanism of photodegradation According to Rabek “Photodegradation (chain scission and/or crosslinking)
occurs by the activation of the polymer macromolecule provided by absorption of a
photon of light by the polymer”[3]. A polymer macromolecule can be activated by
light to its excited singlet (S*) and/or triplet (T*) states. If the energy of the absorbed
UV light is sufficiently high (at least higher than the bond energy) the chemical bond
may break down (photolysis) and two radicals are formed. In an inert atmosphere,
General Introduction
3
radicals can either recombine or abstract hydrogen from the polymer backbone. In the
presence of oxygen, photooxidation takes place. The latter process consists of three
main steps. (1) The Initiation step involves free radical formation. In the (2)
Propagation step, the free polymer radicals react with oxygen. Polymer oxy- and
peroxy-radicals as well as polymer secondary radicals are formed. Rearrangements
and chain scissions can take place. The last step (3) Termination involves
recombination of different radicals. These three steps will be discussed in detail
below.
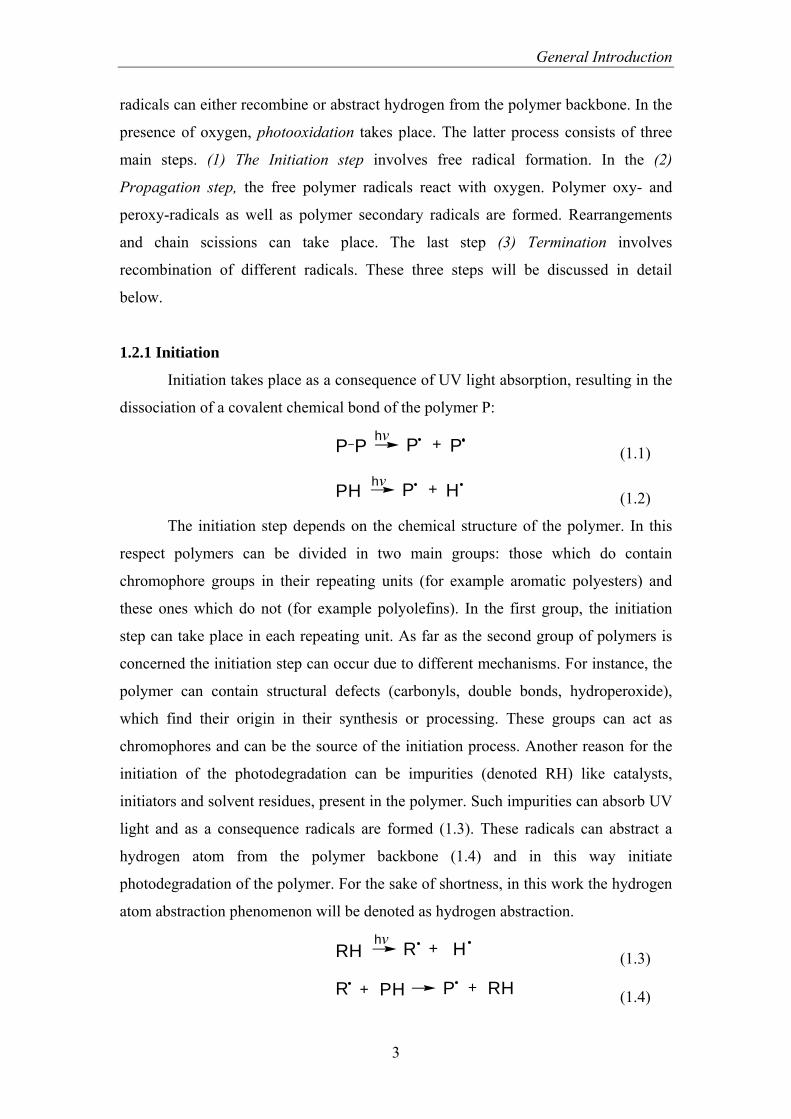
1.2.1 Initiation
Initiation takes place as a consequence of UV light absorption, resulting in the
dissociation of a covalent chemical bond of the polymer P:
P P P + Phv (1.1)
PH P + Hhv (1.2)
The initiation step depends on the chemical structure of the polymer. In this
respect polymers can be divided in two main groups: those which do contain
chromophore groups in their repeating units (for example aromatic polyesters) and
these ones which do not (for example polyolefins). In the first group, the initiation
step can take place in each repeating unit. As far as the second group of polymers is
concerned the initiation step can occur due to different mechanisms. For instance, the
polymer can contain structural defects (carbonyls, double bonds, hydroperoxide),
which find their origin in their synthesis or processing. These groups can act as
chromophores and can be the source of the initiation process. Another reason for the
initiation of the photodegradation can be impurities (denoted RH) like catalysts,
initiators and solvent residues, present in the polymer. Such impurities can absorb UV
light and as a consequence radicals are formed (1.3). These radicals can abstract a
hydrogen atom from the polymer backbone (1.4) and in this way initiate
photodegradation of the polymer. For the sake of shortness, in this work the hydrogen
atom abstraction phenomenon will be denoted as hydrogen abstraction.
R + HRHhv
(1.3)
P +R RH+ PH (1.4)

Chapter 1
4
A common chromophore, which often participates in the initiation of
photodegradation, is the carbonyl (C=O) group, either present as a ketone, aldehyde
or ester group. This group can be present in the polymer structure both as a part of the
repeating unit (polyester) or as a defect (polyolefins). It can also be part of an
impurity. Absorption of UV light by molecules containing carbonyl group leads
mainly to two reactions types, the Norrish reaction of type I and II.
• The Norrish type I reaction is a photocleavage of the bond in α-position to the
carbonyl generating two radicals: acyl and alkyl. The acyl radical can
subsequently undergo decarbonylation:
CH2 C CH2 CH2 C CH2hv
+
CH2 CO CH2++
OO
CH2 C CH2
O *Excited state
(1.5)
• The Norrish type II reaction is a non-radical intramolecular process, in which
the hydrogen is transferred from the γ-position to the oxygen of the carbonyl.
This results in decomposition into a molecule with an unsaturated end group
and a molecule that contains, after enol/keto tautomerization, a carbonyl end
group:
CH2 CH2
CH +CHH
CO
CH2 CH2 CH
OH
CH3 CH
O
(1.6)

General Introduction
5
1.2.2 Propagation
The most important process in the propagation step is the reaction of a
polymer alkyl radical with oxygen which results in polymer peroxy radical formation:
P POO+ O2 (1.7)
In the next step a polymer peroxy radical abstracts hydrogen, giving rise to a polymer
hydroperoxide and a new polymer alkyl radical:
POO POOH+ PH + P (1.8)
Decomposition of hydroperoxide is presumed to take place as a result of energy
transfer from an excited carbonyl or aromatic group (donor D*) to a hydroperoxide
group (acceptor). This leads to polymer oxy and hydroxyl radicals:
Dhv D*
(1.9)
D* + POOH D *+ POOH (1.10)
PO + OH*POOH (1.11)
Each of these radicals can initiate a chain of reactions (1.12, 1.13). A polymer oxy
radical can undergo a number of different reactions. One of them is hydrogen
abstraction (1.12).
PH POH + PPO + (1.12)
PH H2O+POH + (1.13)
If the oxy radical will be formed on the polymer chain, β-scission can occur, resulting
in a carbonyl end group and a polymer alkyl radical:
CH2 CH CH2 CH2 CH CH2+
OO (1.14)

Chapter 1
6
An interesting phenomenon is the „cage effect”. Alkoxy and hydroxyl radicals
created during decomposition of hydroperoxide can not easily escape from the cage
formed by entangled macromolecules. Thus, a reaction with a neighboring point of
the polymer chain is very probable. Usually it leads to the formation of the carbonyl
group and water.
C
O
OH
hvC
O
OH
C
O
O
H
C
O
+ H2OHHH
(1.15)
1.2.3 Termination
The termination step can be one of a number of recombination steps of
different radicals:
P PP + P (1.16)
POPP + PO (1.17)
POOPP + POO (1.18)
POOPPO + PO (1.19)
POHP + OH (1.20)
Recombination of radicals may lead both to linear (1.21) and to crosslinked (1.22-
1.23) structures. The crosslinking can have a chain coupling (1.22) or a grafting
character (1.23). The crosslinking due to the chain coupling leads, in the initial stage,
to larger but still soluble molecules (sol, 1.22A). Extensive crosslinking due to this
mechanism leads to insoluble material (gel, 1.22B) formation. The crosslinking due to
grafting (1.23) does not lead to insoluble material.

General Introduction
7
(1.21)
AB
(1.22)
(1.23)
1.3 Photostabilization of polymers The compounds which are used for the retardation and elimination of
photochemical processes in polymers are usually referred to as “stabilizers”[5,13,14].
They can be classified according to the mechanism of stabilization: UV screening,
UV absorption, exited state deactivation (quenching) and free radical scavenging.
UV screeners protect a polymer by reflecting the harmful UV light. Carbon
black, titanium dioxide TiO2, iron oxides (Fe2O2, Fe3O4), chromic (III) oxide (Cr2O3)
and zinc oxide (ZnO) are examples of UV screeners[13].
The mechanism of stabilization by UV absorbers involves absorption of UV
light and a subsequent quick dissipation of absorbed energy in the form of harmless
long wavelength radiation. In order to be effective, these stabilizers should have high
absorption coefficients in the range of 290 – 400 nm. Since each UV absorber has its
specific absorption spectrum, different combinations of them can be used for optimal
efficiency. Derivatives of hydroxyphenylbenzotriazole, hydroxyphenylbenzophenone
and hydroxyphenyl-s-triazines are used as UV absorbers.
Deactivation or quenching of excited states (singlet and/or triplet) of
chromophoric groups can also avoid bond scission. Usually the energy of the excited
Chapter 1
8
state is transferred to a quencher molecule which may dissipate the energy to a
harmless form. Transition metal chelates can be used as quenchers[14].
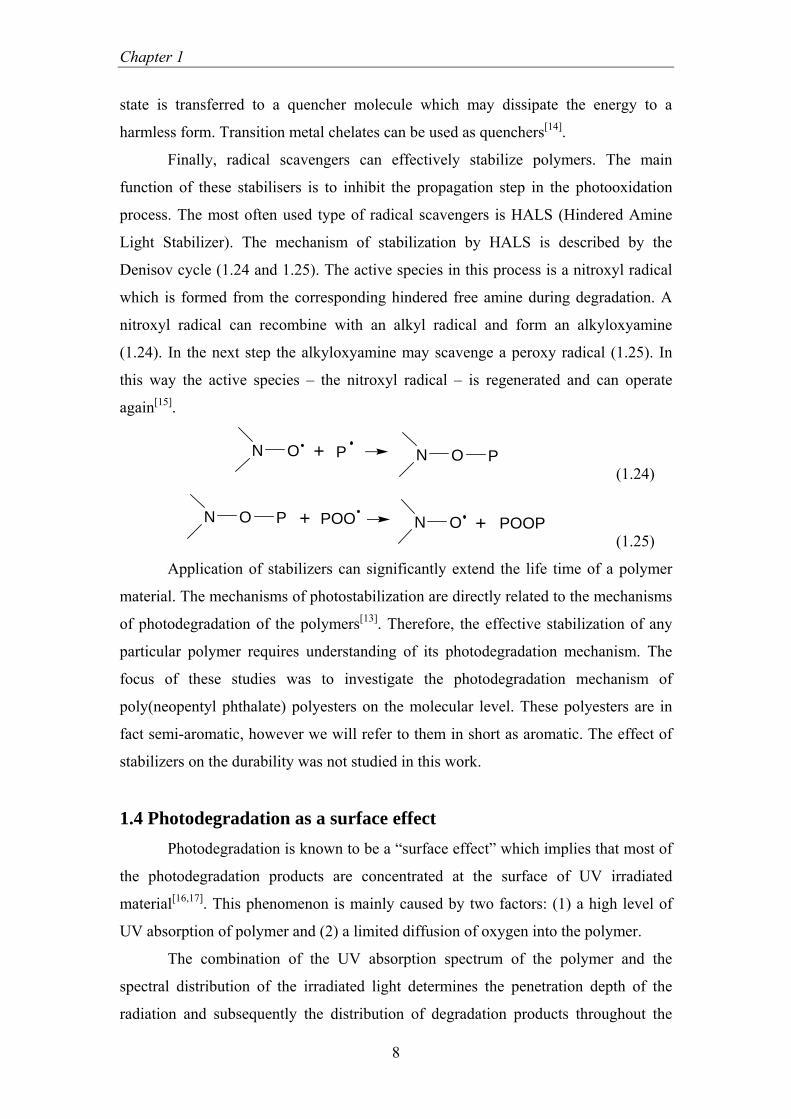
Finally, radical scavengers can effectively stabilize polymers. The main
function of these stabilisers is to inhibit the propagation step in the photooxidation
process. The most often used type of radical scavengers is HALS (Hindered Amine
Light Stabilizer). The mechanism of stabilization by HALS is described by the
Denisov cycle (1.24 and 1.25). The active species in this process is a nitroxyl radical
which is formed from the corresponding hindered free amine during degradation. A
nitroxyl radical can recombine with an alkyl radical and form an alkyloxyamine
(1.24). In the next step the alkyloxyamine may scavenge a peroxy radical (1.25). In
this way the active species – the nitroxyl radical – is regenerated and can operate
again[15].
N O P+ N O P (1.24)
N O P + POO N O POOP+ (1.25)
Application of stabilizers can significantly extend the life time of a polymer
material. The mechanisms of photostabilization are directly related to the mechanisms
of photodegradation of the polymers[13]. Therefore, the effective stabilization of any
particular polymer requires understanding of its photodegradation mechanism. The
focus of these studies was to investigate the photodegradation mechanism of
poly(neopentyl phthalate) polyesters on the molecular level. These polyesters are in
fact semi-aromatic, however we will refer to them in short as aromatic. The effect of
stabilizers on the durability was not studied in this work.
1.4 Photodegradation as a surface effect Photodegradation is known to be a “surface effect” which implies that most of
the photodegradation products are concentrated at the surface of UV irradiated
material[16,17]. This phenomenon is mainly caused by two factors: (1) a high level of
UV absorption of polymer and (2) a limited diffusion of oxygen into the polymer.
The combination of the UV absorption spectrum of the polymer and the
spectral distribution of the irradiated light determines the penetration depth of the
radiation and subsequently the distribution of degradation products throughout the
General Introduction
9
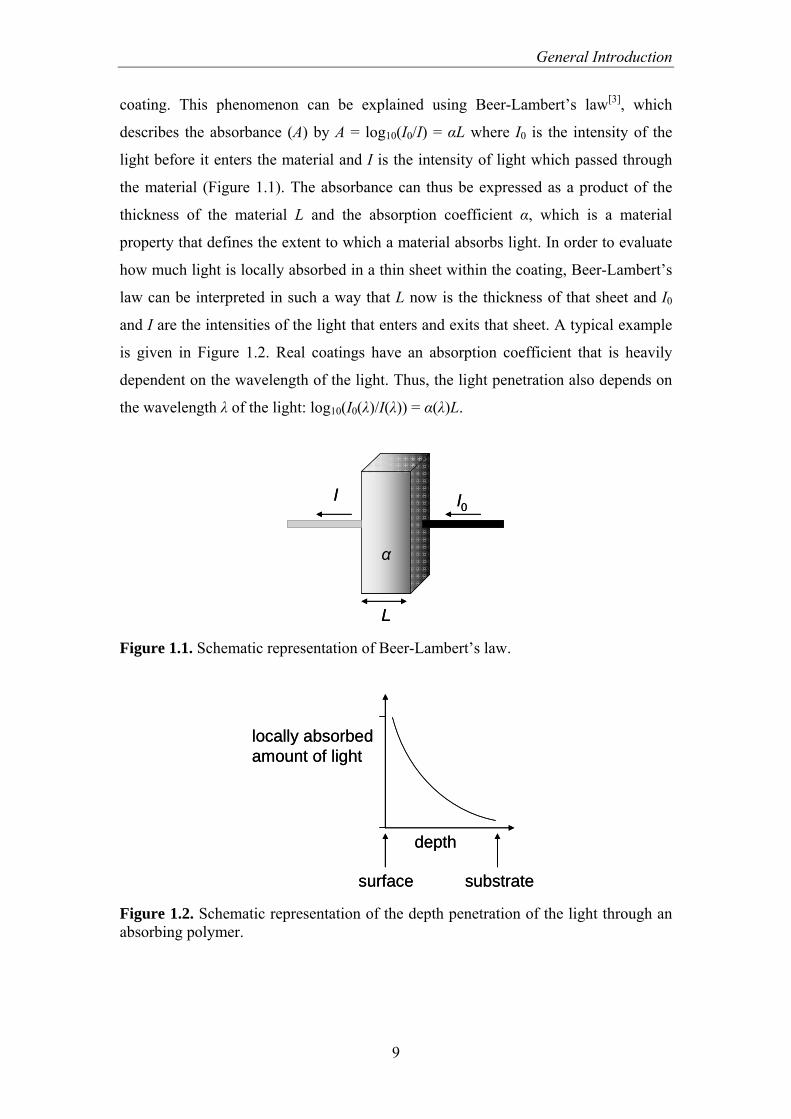
coating. This phenomenon can be explained using Beer-Lambert’s law[3], which
describes the absorbance (A) by A = log10(I0/I) = αL where I0 is the intensity of the
light before it enters the material and I is the intensity of light which passed through
the material (Figure 1.1). The absorbance can thus be expressed as a product of the
thickness of the material L and the absorption coefficient α, which is a material
property that defines the extent to which a material absorbs light. In order to evaluate
how much light is locally absorbed in a thin sheet within the coating, Beer-Lambert’s
law can be interpreted in such a way that L now is the thickness of that sheet and I0
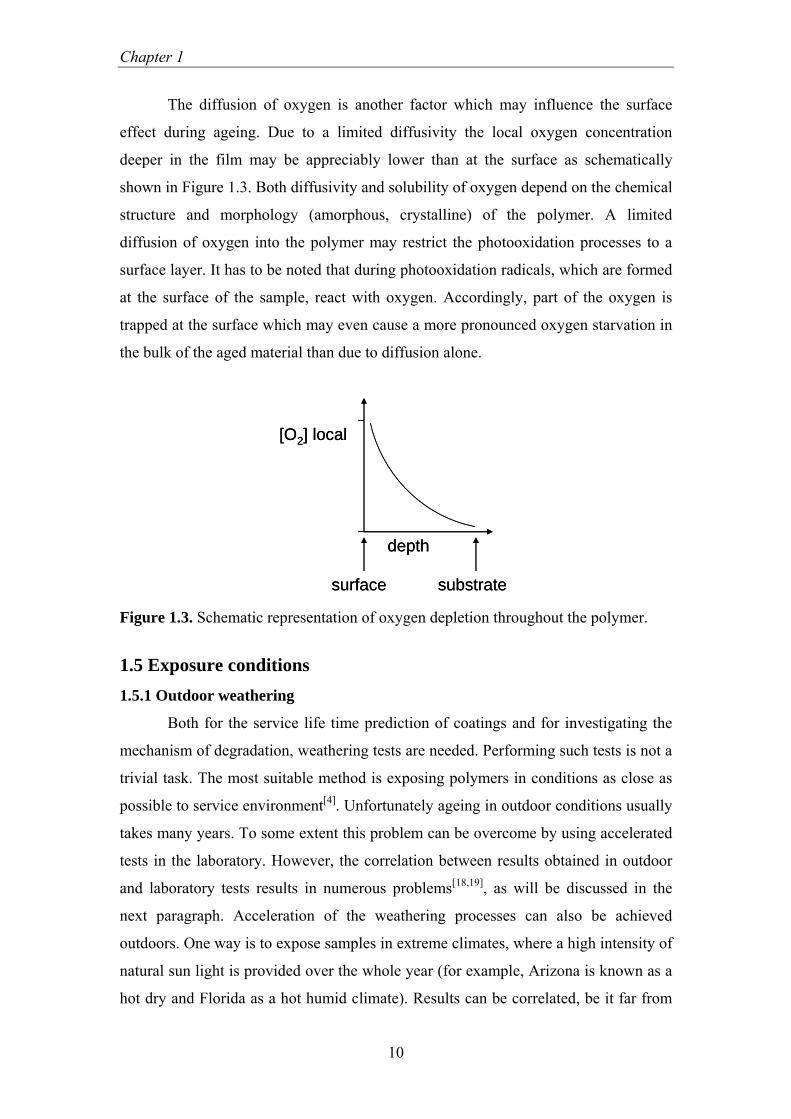
and I are the intensities of the light that enters and exits that sheet. A typical example
is given in Figure 1.2. Real coatings have an absorption coefficient that is heavily
dependent on the wavelength of the light. Thus, the light penetration also depends on
the wavelength λ of the light: log10(I0(λ)/I(λ)) = α(λ)L.
I0
L
I
α
I0
L
I
α
Figure 1.1. Schematic representation of Beer-Lambert’s law.
depth
surface
locally absorbed amount of light
substrate
depth
surface
locally absorbed amount of light
substrate Figure 1.2. Schematic representation of the depth penetration of the light through an absorbing polymer.
Chapter 1
10
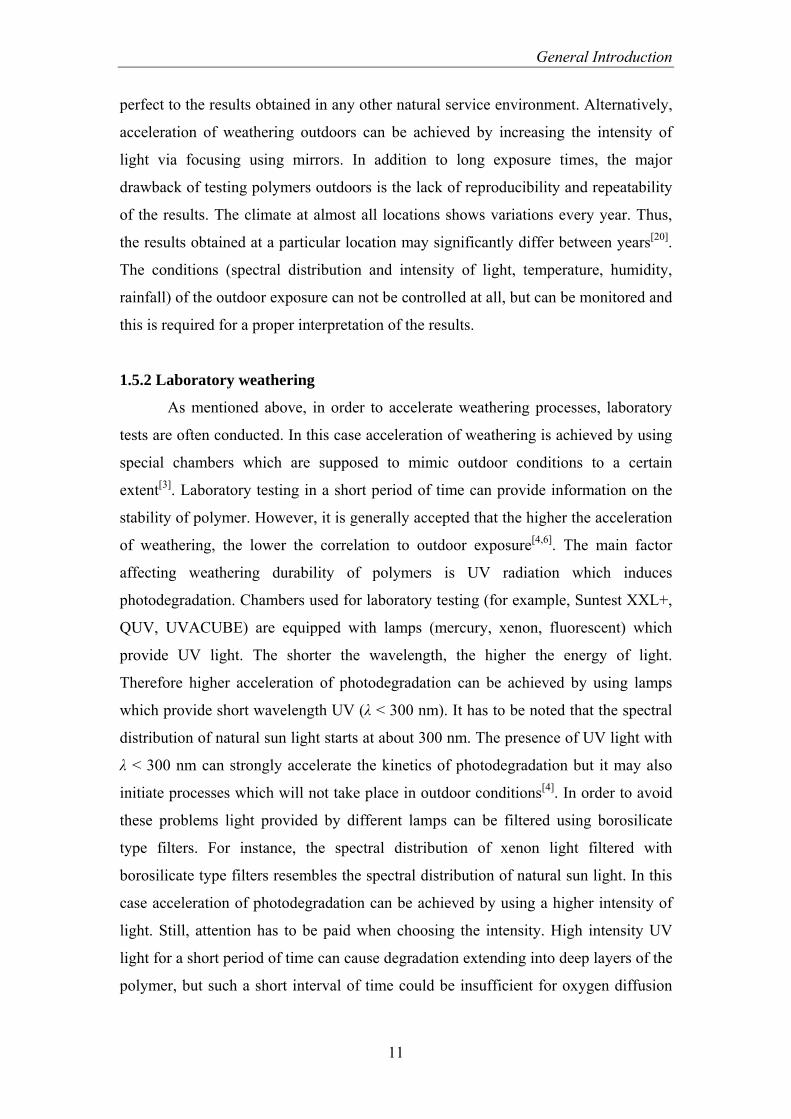
The diffusion of oxygen is another factor which may influence the surface
effect during ageing. Due to a limited diffusivity the local oxygen concentration
deeper in the film may be appreciably lower than at the surface as schematically
shown in Figure 1.3. Both diffusivity and solubility of oxygen depend on the chemical
structure and morphology (amorphous, crystalline) of the polymer. A limited
diffusion of oxygen into the polymer may restrict the photooxidation processes to a
surface layer. It has to be noted that during photooxidation radicals, which are formed
at the surface of the sample, react with oxygen. Accordingly, part of the oxygen is
trapped at the surface which may even cause a more pronounced oxygen starvation in
the bulk of the aged material than due to diffusion alone.
[O2] local
depth
surface substrate
[O2] local
depth
surface substrate Figure 1.3. Schematic representation of oxygen depletion throughout the polymer.
1.5 Exposure conditions 1.5.1 Outdoor weathering
Both for the service life time prediction of coatings and for investigating the
mechanism of degradation, weathering tests are needed. Performing such tests is not a
trivial task. The most suitable method is exposing polymers in conditions as close as
possible to service environment[4]. Unfortunately ageing in outdoor conditions usually
takes many years. To some extent this problem can be overcome by using accelerated
tests in the laboratory. However, the correlation between results obtained in outdoor
and laboratory tests results in numerous problems[18,19], as will be discussed in the
next paragraph. Acceleration of the weathering processes can also be achieved
outdoors. One way is to expose samples in extreme climates, where a high intensity of
natural sun light is provided over the whole year (for example, Arizona is known as a
hot dry and Florida as a hot humid climate). Results can be correlated, be it far from
General Introduction
11
perfect to the results obtained in any other natural service environment. Alternatively,
acceleration of weathering outdoors can be achieved by increasing the intensity of
light via focusing using mirrors. In addition to long exposure times, the major
drawback of testing polymers outdoors is the lack of reproducibility and repeatability
of the results. The climate at almost all locations shows variations every year. Thus,
the results obtained at a particular location may significantly differ between years[20].
The conditions (spectral distribution and intensity of light, temperature, humidity,
rainfall) of the outdoor exposure can not be controlled at all, but can be monitored and
this is required for a proper interpretation of the results.
1.5.2 Laboratory weathering
As mentioned above, in order to accelerate weathering processes, laboratory
tests are often conducted. In this case acceleration of weathering is achieved by using
special chambers which are supposed to mimic outdoor conditions to a certain
extent[3]. Laboratory testing in a short period of time can provide information on the
stability of polymer. However, it is generally accepted that the higher the acceleration
of weathering, the lower the correlation to outdoor exposure[4,6]. The main factor
affecting weathering durability of polymers is UV radiation which induces
photodegradation. Chambers used for laboratory testing (for example, Suntest XXL+,
QUV, UVACUBE) are equipped with lamps (mercury, xenon, fluorescent) which
provide UV light. The shorter the wavelength, the higher the energy of light.
Therefore higher acceleration of photodegradation can be achieved by using lamps
which provide short wavelength UV (λ < 300 nm). It has to be noted that the spectral
distribution of natural sun light starts at about 300 nm. The presence of UV light with
λ < 300 nm can strongly accelerate the kinetics of photodegradation but it may also
initiate processes which will not take place in outdoor conditions[4]. In order to avoid
these problems light provided by different lamps can be filtered using borosilicate
type filters. For instance, the spectral distribution of xenon light filtered with
borosilicate type filters resembles the spectral distribution of natural sun light. In this
case acceleration of photodegradation can be achieved by using a higher intensity of
light. Still, attention has to be paid when choosing the intensity. High intensity UV
light for a short period of time can cause degradation extending into deep layers of the
polymer, but such a short interval of time could be insufficient for oxygen diffusion

Chapter 1
12
(needed for photooxidation). In this case, reactions can take place in deeper layers of
the material which probably will not occur in outdoor conditions or vice versa.
Acceleration of the weathering process can also be achieved by increased
temperature. Usually laboratory weathering tests are performed at elevated
temperatures. Unfortunately the increased temperature can influence the chemical
pathway of the photodegradation processes[21]. For example, the ratio between some
reactions taking place can be changed which at the end will influence the final
performance. The temperature of ageing relative to the glass transition temperature Tg
of the polymer plays also an important role for the diffusion of oxygen. The diffusion
of oxygen in to the deeper layers of the polymer is especially limited at a temperature
below Tg of the polymer. In this case the photooxidation will mainly take place at the
surface. On the other hand, in accelerated tests at temperatures above Tg oxygen may
more rapidly diffuse to the bulk and photooxidation will proceed also in the bulk.
Another important factor for laboratory weathering tests is humidity. It is
known that in some cases the presence of water accelerates the photodegradation
processes of polymers. Additionally, by a hydrolysis mechanism water can promote
the decomposition of some polymers. In accelerated weathering chambers usually the
humidity level can be controlled and additionally water spray imitating rainfall can be
provided at regular intervals.
It is clear from the above mentioned examples that the selection of the proper
parameters like the spectral distribution and intensity of light, the temperature and the
humidity level are crucial for obtaining realistic results.
Laboratory weathering has some important advantages over outdoor exposure.
For instance, in laboratory weathering tests the light exposure is continuous while
outdoors the sun light is absent at night. As mentioned in the previous paragraph, the
major drawback of outdoor weathering tests is the lack of reproducibility and
repeatability. However, because of controlled conditions (light intensity, temperature,
humidity) the results obtained in laboratory weathering show better reproducibility
and repeatability as compared to results obtained outdoors. This is an important aspect
for systematic studies of weathering processes.
General Introduction
13
1.6 Aim and outline of the thesis The aim of this thesis is to investigate the molecular mechanism of
photodegradation of aromatic polyester coatings, which is essential for a better
understanding of the overall ageing process of such coatings and ultimately for
improving their weathering stability. Another important aspect addressed in this work
is to compare the established mechanisms under different degradation conditions.
Finally, the influence of the chemical reactions taking place during ageing on some
physical properties, in particular hardness will be discussed.
Aromatic polyesters are widely used in the field of coating technology.
Thermally or UV cured aromatic polyesters form excellent coatings which are used
for protective and decorative purposes. Advantages like good mechanical properties
and low cost make these polymers very attractive in coating applications. On the other
hand, most aromatic polyester coatings exhibit rather modest resistance to weathering.
Absorption of UV light causes chain scission which leads to the decomposition of the
polymer[22-26]. The chemical reactions taking place influence the physical properties of
coatings and ultimately may lead to cracking, gloss loss and blistering.
In recent years it was shown that polyesters based on isophthalic acid (IPA)
show a higher resistance to weathering as compared to these based on terephthalic
acid (TPA)[27]. In this thesis the main work was done on poly(neopentyl isophthalate)
(PNI) and some experiments were also performed on poly(neopentyl terephthalate)
(PNT). Investigation of the degradation of organic coatings is a complicated process.
In most cases chemical changes taking place during UV exposure are studied using
overall spectroscopic techniques such as FTIR and UV[28,29]. Since organic coatings
consist of polymer networks, the application of molecular analytical techniques such
as chromatography and mass spectrometry was limited. More importantly
spectroscopic techniques, like IR, do not provide detailed molecular information and
some of the products of the photodegradation may not be detected, e.g. if they have
low IR absorbance or other IR absorption bands are strongly overlapping. Thus, a
more detailed characterization of the molecular mechanism of photodegradation is
required. In order to study the mechanism of the degradation on the molecular level,
in this thesis, non-crosslinked coatings were investigated. In this work MALDI-ToF
MS was used as an important additional technique to study the mechanisms of
photodegradation on the molecular level. This technique provides detailed structural
Chapter 1
14
information on the degradation products, which allows establishing precise
mechanisms of the degradation[30-32]. The changes in the size of molecules were
investigated with SEC. Formation of functional groups was studied with FTIR
spectroscopy. The changes in the mechanical properties of UV exposed coatings were
measured with nanoindentation.
As laboratory UV exposure tools two systems were used: the UVACUBE and
the Suntest XXL+. The UVACUBE apparatus is equipped with a high pressure
mercury lamp emitting radiation in the range of 254 to 600 nm. This device is
equipped with a thermostatic box covered with quartz glass, which allows performing
ageing experiments with different atmospheres (air/nitrogen) and temperature. The
Suntest XXL+ is equipped with xenon lamps of which the light emitted is filtered
with daylight filters (λ > ~300 nm). The spectral distribution of the light provided by
the Suntest XXL+ nearly resembles the spectral distribution of natural light. Outdoor
exposure was performed in Poland.
In Chapter 2 the photodegradation of poly(neopentyl isophthalate) (PNI)
coatings exposed in the UVACUBE apparatus (λ > ~254 nm) is studied. This system
highly accelerates the polymer photodegradation. The mechanism of the
photodegradation is investigated with ATR-FTIR, SEC and MALDI-ToF MS. As a
result of this investigation, a mechanism of the photolysis and photooxidation is
proposed.
Chapter 3 describes the photodegradation of PNI coatings both exposed in the
Suntest XXL+ (λ > ~300 nm) and aged in outdoor conditions. The mechanism of the
photodegradation is studied with ATR-FTIR, SEC and MALDI-ToF MS. The
mechanism of photolysis and photooxidation of PNI obtained in both Suntest XXL+
and outdoors is compared to the mechanisms obtained under highly accelerated
conditions (UVACUBE: λ > ~254 nm). In particular, two aspects of degradation of
polymers are discussed. First, the influence of the wavelength (λ > ~254 nm and λ >
~300 nm) on the mechanism of degradation is addressed. Secondly, the comparison
between laboratory and outdoor exposure in respect to the mechanism is discussed.
The comparison of the mechanism of photodegradation and overall UV
stability of poly(neopentyl isophthalate) (PNI) and poly(neopentyl terephthalate)
(PNT) coatings as exposed in the Suntest XXL+ (λ > ~300 nm) light is presented in
Chapter 4.

General Introduction
15
In Chapter 5 the mechanism of crosslinking as a result of the UV exposure is
investigated. In this respect the insoluble part of photodegradation (gel) is collected
and first studied with ATR-FTIR. Secondly, the gel is decomposed by methanolysis
and the products of this reaction is studied with LC-MS. As a result a mechanism of
photocrosslinking is proposed.
In Chapter 6 the influence the chemical reactions taking place during
photodegradation have on the physical properties (hardness) of polyester coatings is
discussed. UV exposure is carried out in different atmospheres (air and nitrogen), in
order to distinguish oxygen dependent chemical reactions and their influence on the
mechanical properties. As a result an explanation for the hardness increase as a result
of ageing is proposed. In this chapter a typical weathering pathway – chemical
reactions taking place during ageing leading to physical changes and finally to
macroscopic failure, namely cracking – is presented.
Chapter 1
16
References 1. Brock T, Groteklaes M, Mischke P. European coatings handbook, Hannover,
Vincentz Verlag, 2000.
2. Tracton AA. Coating technology handbook, 3rd ed. London: Taylor & Francis,
2006
3. Rabek JF. Polymer photodegradation - mechanisms and experimental methods,
1st ed. UK: Chapman and Hall, London, 1995.
4. White JR, Turnbull A. J Mater Sci 1994;29:584-613.
5. Pospisil J, Nespurek S. Prog Polym Sci 2000;25:1261-1335.
6. Baljit S, Sharma N. Polym Degrad Stab 2008;93:561-584.
7. Nowicki M, Richter A, Wolf B, Kaczmarek H. Polymer 2003;44:6599-6606.
8. Skaja A, Fernando D, Croll S. J Coat Technol Res 2006;3(1):41-51.
9. Gu X, Nguyen T, Sung LP, VanLandingham MR, Fasolka MJ, Martin JW,
Jean YC, Nguyen D, Chang NK, Wu TY. J Coat Technol Res 2004;1(3):191-200.
10. White JR. C R Chim 2006;9:1396-1408.
11. Oosterbroek M, Lammers RJ, van der Ven LGJ, Perera DY. J Coat Technol
1991;67(797):55-60.
12. Tavares AC, Gulmine JV, Lepienski CM, Akcelrud L. Polym Degrad Stab
2003;81:367-373.
13. Allen NS, Chirinsi-Padron A, Henman TJ. Polym Degrad Stab 1985;13:31-76.
14. Rabek JF. Mechanisms of photophysical processes and photochemical reactions in
polymers. Chichester: Wiley, 1987
15. Gijsman P, Hennekens J, Tummers D. Polym Degrad Stab 1993;39:225-233.
16. Gu X, Michaels CA, Drzal PL, Jasmin J, Martin D, Nguyen T, Martin JW.
J Coat Technol Res 2007;4(4):389-399.
17. Mailhot B, Bussière PO, Rivaton A, Morlat-Thérias S, Gardette JL.
Macromol Rapid Commun 2004;25:436-440.
18. Martin JW, Nguyen T, Byrd E, Dickens B, Embree N. Polym Degrad Stab
2002;75:193-210.
19. Nguyen T, Martin J, Byrd E, Embree N. Polym Degrad Stab 2002;77:1-16.
20. Martin J. Cosi Coating Science International 2008.
21. Kockott D. Angew Makromol Chem 1985;137:1.
22. Rivaton A. Polym Degrad Stab 1993;41:283-296.

General Introduction
17
23. Rivaton A. Polym Degrad Stab 1993;41:297-310.
24. Day M, Wiles DM. J Appl Polym Sci 1972;16:175-189.
25. Day M, Wiles DM. J Appl Polym Sci 1972;16:191-202.
26. Day M, Wiles DM. J Appl Polym Sci 1972;16:203-215.
27. Focus on Powder Coatings, 2005;1:5-6.
28. Skaja AD, Croll SG. Polym Degrad Stab 2003;79:123-131.
29. Maetens D. Prog Org Coat 2007;58:172-179.
30. Carroccio S, Puglisi C, Montaudo G. Macromolecules 2004;37:6037-6049.
31. Carroccio S, Rizzarelli P, Puglisi C, Montaudo G. Macromolecules
2004;37:6576 6586.
32. Carroccio S, Rizzarelli P, Scaltro G, Puglisi C. Polymer 2008;49:3371-3381.

Chapter 1
18
2
Molecular mechanism of photolysis and
photooxidation of poly(neopentyl isophthalate)
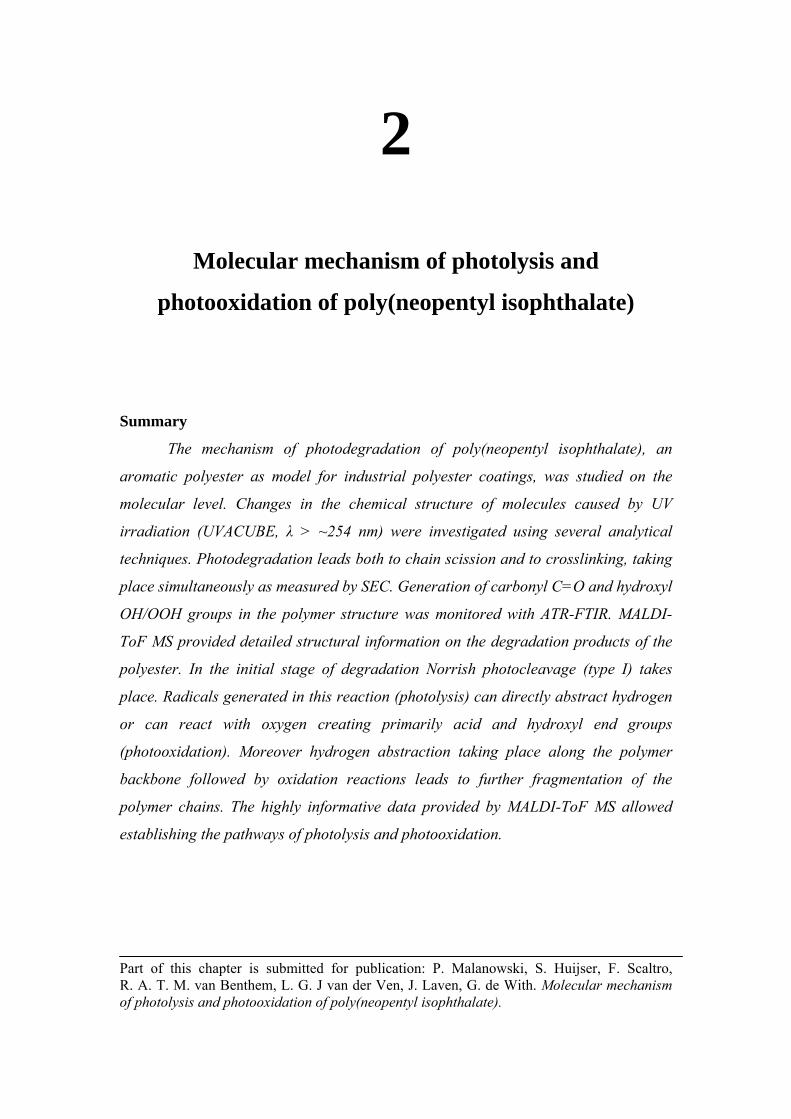
Summary
The mechanism of photodegradation of poly(neopentyl isophthalate), an
aromatic polyester as model for industrial polyester coatings, was studied on the
molecular level. Changes in the chemical structure of molecules caused by UV
irradiation (UVACUBE, λ > ~254 nm) were investigated using several analytical
techniques. Photodegradation leads both to chain scission and to crosslinking, taking
place simultaneously as measured by SEC. Generation of carbonyl C=O and hydroxyl
OH/OOH groups in the polymer structure was monitored with ATR-FTIR. MALDI-
ToF MS provided detailed structural information on the degradation products of the
polyester. In the initial stage of degradation Norrish photocleavage (type I) takes
place. Radicals generated in this reaction (photolysis) can directly abstract hydrogen
or can react with oxygen creating primarily acid and hydroxyl end groups
(photooxidation). Moreover hydrogen abstraction taking place along the polymer
backbone followed by oxidation reactions leads to further fragmentation of the
polymer chains. The highly informative data provided by MALDI-ToF MS allowed
establishing the pathways of photolysis and photooxidation.
Part of this chapter is submitted for publication: P. Malanowski, S. Huijser, F. Scaltro, R. A. T. M. van Benthem, L. G. J van der Ven, J. Laven, G. de With. Molecular mechanism of photolysis and photooxidation of poly(neopentyl isophthalate).

Chapter 2
20
2.1 Introduction Organic coatings are thin, often pigmented layers of a polymer network applied
on a substrate. They are used for protection against corrosion and weathering as well
as for decoration purposes. The main part of a organic coating is the polymeric binder
which consists of a polymer having reactive groups (resin) and often a crosslinker.
Most commonly resins used in coating technology are acrylics, polyesters, alkyds and
epoxies.
Many factors simultaneously influence the life time of a coating. The
combined action of UV radiation, heat and moisture can cause changes in the
chemical structure of polymer networks. Such chemical changes influence the
physical properties of coatings and consequently lead to failure (cracking, gloss loss,
blistering, etc.) and reduction of life-time. The most important factor affecting
degradation is UV radiation[1,2].
Photodegradation of polyesters like poly(ethylene terephthalate) PET and
poly(butylene terephthalate) PBT has been extensively investigated[3-10]. Day and
Wiles studied photochemical degradation of PET[4-6]. Mainly based on the analysis of
volatile products (CO and CO2) and FTIR it was suggested that UV absorption by the
aromatic ester group induced Norrish (type I and II) photocleavage. Later, Rivaton
studied photodegradation of PBT using FTIR supported with chemical
derivatization[7,8]. The data obtained confirmed the Norrish (type I and II)
photocleavage and resulted in proposing more advanced mechanisms of the
photodegradation of the aromatic polyester. However, IR does not provide detailed
molecular information. Moreover, some of the products of the photodegradation may
not be detected e.g. if they have low absorbance, or other absorbances are strongly
overlapping. Thus, more detailed characterization of the molecular mechanism of
photodegradation is still required.
Among industrially used polyester coatings, those based on neopentyl glycol
and phthalic acid isomers, especially isophthalic acid, exhibit the best outdoor
durability[11]. Although those polyester coatings are widely used in outdoor
application, mainly because of their superior mechanical properties, improvement of
their outdoor durability, at least up to the level of e.g. acrylic coatings, is still very
desirable. This explains the industrial interest in investigations of the mechanisms of
degradation in such polyesters, yet only a few papers have been published on this

Molecular mechanism of photolysis and photooxidation of PNI
21
topic up to now[11,12]. Interestingly, in poly(neopentyl isophthalate) PNI only Norrish
type I photocleavage is possible due to the absence of β-H in the neopentyl glycol
moiety, making this polymer very suitable for a model study on a molecular level.
Investigation of the degradation of organic coatings is a complicated process.
In most cases chemical changes taking place during UV exposure are studied using
overall spectroscopic techniques such as FTIR and UV[11,12]. Since organic coatings
consist of polymer networks, the application of molecular analytical techniques such
as chromatography and mass spectrometry has been limited. Here, we report on the
photolysis and photooxidation of non-crosslinked poly(neopentyl isophthalate) PNI
coatings aged in the UVACUBE (λ > ~254 nm). The mechanism of degradation is
investigated using several analytical techniques: ATR-FTIR, SEC and MALDI-ToF
MS. The most valuable information with respect to the mechanism of degradation is
provided by MALDI-ToF MS. This technique allows studying individual polymer
chains as a function of exposure time. In recent years the successful application of this
technique to study the mechanisms of (thermal and photo) degradation of polymers
has been demonstrated[13-15], including PBT[16]. In the present work, MALDI-ToF MS
is used to study photodegradation of poly(neopentyl isophthalate) PNI. In addition,
the interpretation of complicated (isotope overlapping) MALDI-ToF MS data was
made possible by in-house-developed software[17] for the isotope distribution
calculation, resulting in detailed structural information on the products of the
photodegradation. Based on these highly informative MALDI-ToF MS data as well as
on supportive FTIR and SEC data, the mechanisms of photolysis and photooxidation
are being proposed.
The main purpose of this chapter is to investigate the molecular mechanisms
leading to fragmentation of the polymer. The mechanism of photocrosslinking, which
is the other process simultaneously taking place during the photodegradation, will be
studied in Chapter 5.
Chapter 2
22
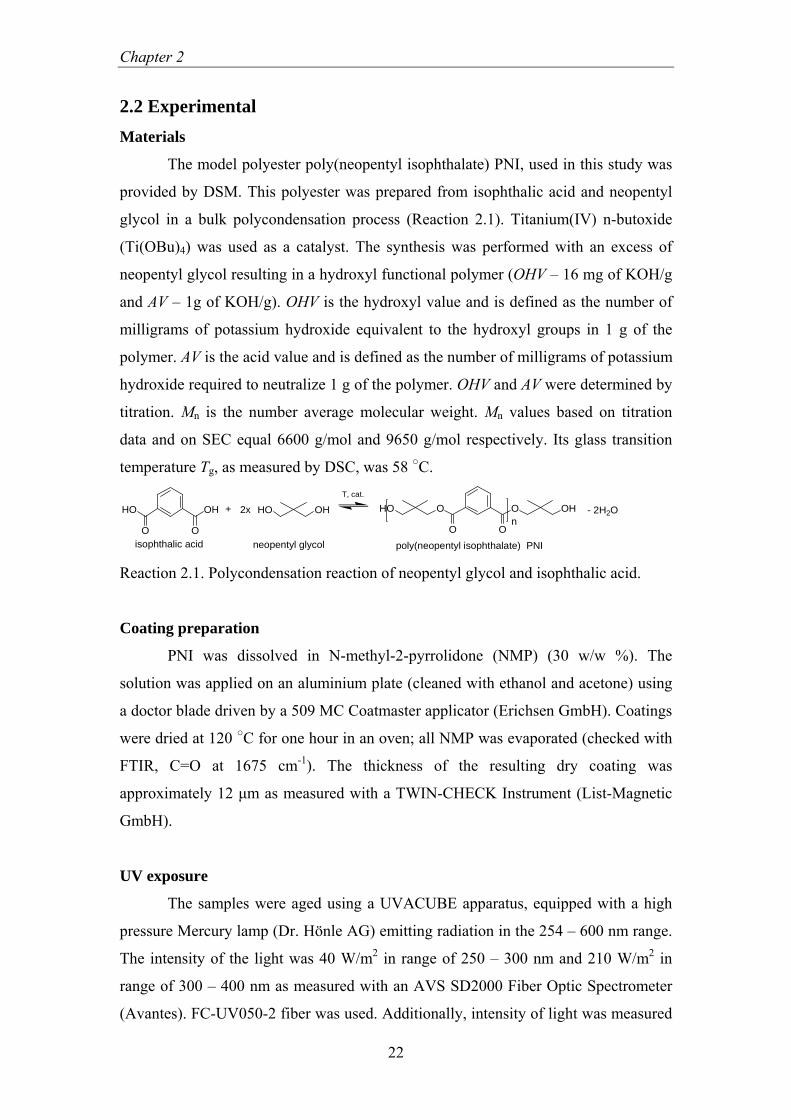
2.2 Experimental Materials
The model polyester poly(neopentyl isophthalate) PNI, used in this study was
provided by DSM. This polyester was prepared from isophthalic acid and neopentyl
glycol in a bulk polycondensation process (Reaction 2.1). Titanium(IV) n-butoxide
(Ti(OBu)4) was used as a catalyst. The synthesis was performed with an excess of
neopentyl glycol resulting in a hydroxyl functional polymer (OHV – 16 mg of KOH/g
and AV – 1g of KOH/g). OHV is the hydroxyl value and is defined as the number of
milligrams of potassium hydroxide equivalent to the hydroxyl groups in 1 g of the
polymer. AV is the acid value and is defined as the number of milligrams of potassium
hydroxide required to neutralize 1 g of the polymer. OHV and AV were determined by
titration. Mn is the number average molecular weight. Mn values based on titration
data and on SEC equal 6600 g/mol and 9650 g/mol respectively. Its glass transition
temperature Tg, as measured by DSC, was 58 ○C.
O O
OO
OHn
OO
HO OHHO OH+
isophthalic acid neopentyl glycol poly(neopentyl isophthalate) PNI
- 2H2O
T, cat.
HO2x
Reaction 2.1. Polycondensation reaction of neopentyl glycol and isophthalic acid.
Coating preparation
PNI was dissolved in N-methyl-2-pyrrolidone (NMP) (30 w/w %). The
solution was applied on an aluminium plate (cleaned with ethanol and acetone) using
a doctor blade driven by a 509 MC Coatmaster applicator (Erichsen GmbH). Coatings
were dried at 120 ○C for one hour in an oven; all NMP was evaporated (checked with
FTIR, C=O at 1675 cm-1). The thickness of the resulting dry coating was
approximately 12 μm as measured with a TWIN-CHECK Instrument (List-Magnetic
GmbH).
UV exposure
The samples were aged using a UVACUBE apparatus, equipped with a high
pressure Mercury lamp (Dr. Hönle AG) emitting radiation in the 254 – 600 nm range.
The intensity of the light was 40 W/m2 in range of 250 – 300 nm and 210 W/m2 in
range of 300 – 400 nm as measured with an AVS SD2000 Fiber Optic Spectrometer
(Avantes). FC-UV050-2 fiber was used. Additionally, intensity of light was measured
Molecular mechanism of photolysis and photooxidation of PNI
23
using a UV Power Puck (EIT Inc.) in the ranges of UVA (400 W/m2) and UVB (150
W/m2). The UVACUBE was equipped with a thermostatic box (68 ○C) covered by a
quartz glass in which the PNI coatings were placed. All experiments were performed
in dry air atmosphere. Exception to this rule is one experiment performed in dry
nitrogen atmosphere. The distance from samples to the lamp was 20 cm. Samples (5
cm × 5 cm) were exposed to UV light for either 10 or 20 hours.
Analytical methods
Attenuated Total Reflectance Fourier Transform Infrared Spectroscopy (ATR-
FTIR) was performed using a BioRad Excalibur FTS3000MX spectrometer equipped
with a diamond crystal (Golden Gate). Spectra of the surface of the PNI coatings were
recorded in the range of 4000 – 650 cm-1 with a resolution of 4 cm-1. For ATR-FTIR
spectroscopy a small piece was cut from the coated panel and pressed on the ATR
crystal. Spectra in the range of 2300 – 3700 cm-1 were normalized to the peak at
2967 cm-1 (CH3 antisymmetric stretching) and in the range of 1500 – 1900 cm-1 to the
peak at 1716 cm-1 (C=O stretching).
Size exclusion chromatography (SEC) was carried out using a WATERS 2695
separation module and a Model 2414 refractive index detector at 40 ○C. The injection
volume used was 50 µL. The column set consisted of a Polymer Laboratories PLgel
guard column (5 µm particles, 50 × 7.5 mm), followed by two PLgel mixed-C
columns (5 µm particles, 300 × 7.5 mm). The columns were calibrated at 40 ○C using
polystyrene standards (Polymer Laboratories, M = 580 up to M = 7.1*106 g/mol).
Tetrahydrofuran (Biosolve, stabilised with BHT) was used as eluent at a flow rate of
1.0 ml/min. Prior the SEC analysis, the polyester was removed from the substrate and
dissolved in THF. In case of aged polyester the insoluble (crosslinked gel) part of the
polymer was removed by filtration (0.2 µm PTFE filter) and the soluble part
(concentration ~5 mg/ml in THF) was analyzed. Data acquisition and processing were
performed using WATERS Empower 2 software. Chromatograms were scaled to the
maximum peak height.
Matrix assisted laser desorption ionization time of flight mass spectra
(MALDI-ToF MS) were recorded in reflector mode using a Voyager-DE STR
instrument. Trans-2-[3-(4-tert-Butylphenyl)-2-methyl-2-propenylidene] malononitrile
was used as a matrix. Samples were prepared by mixing matrix, potassium
trifluoroacetate and polymer sample in a volume ratio 4:1:4, with THF as a solvent.
Chapter 2
24
Prior to the MALDI-ToF MS test, polyester was removed from the substrate and
dissolved in THF. In the case of the aged polyester the insoluble (crosslinked gel) part
of the degradation was removed by filtration. The soluble part was analyzed. Copol
analysis program by B. B. P. Staal was used to calculate isotopic distributions[17].
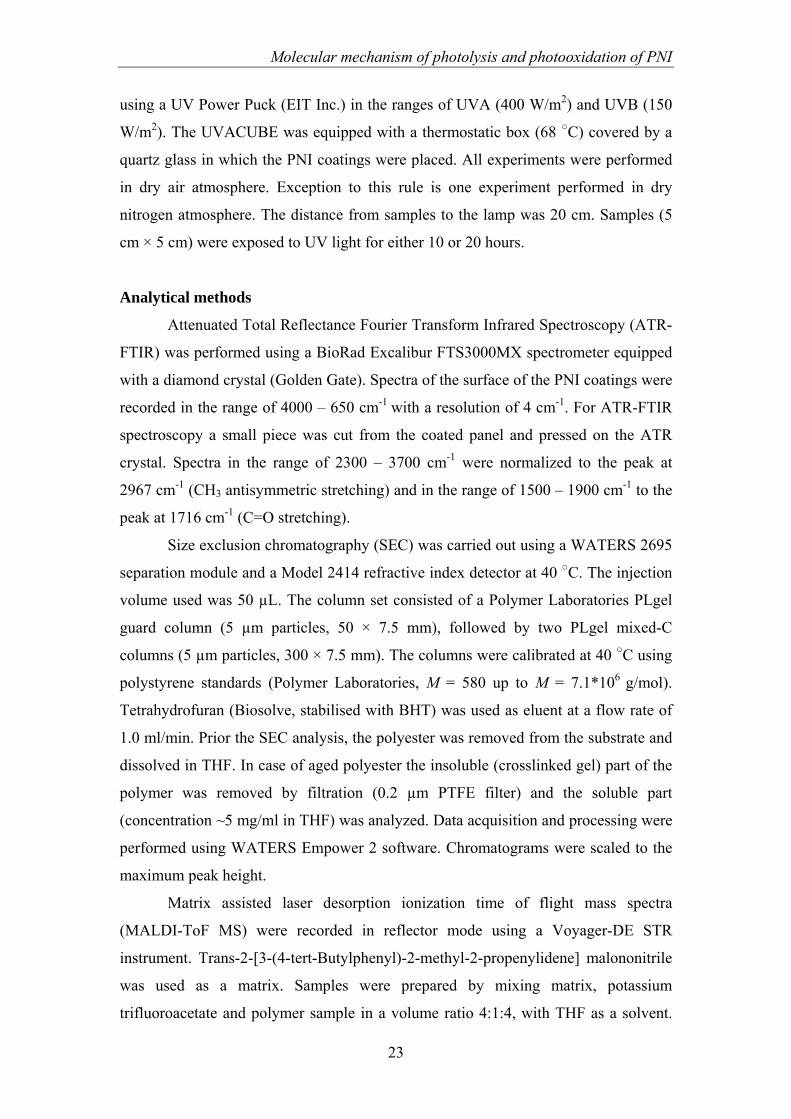
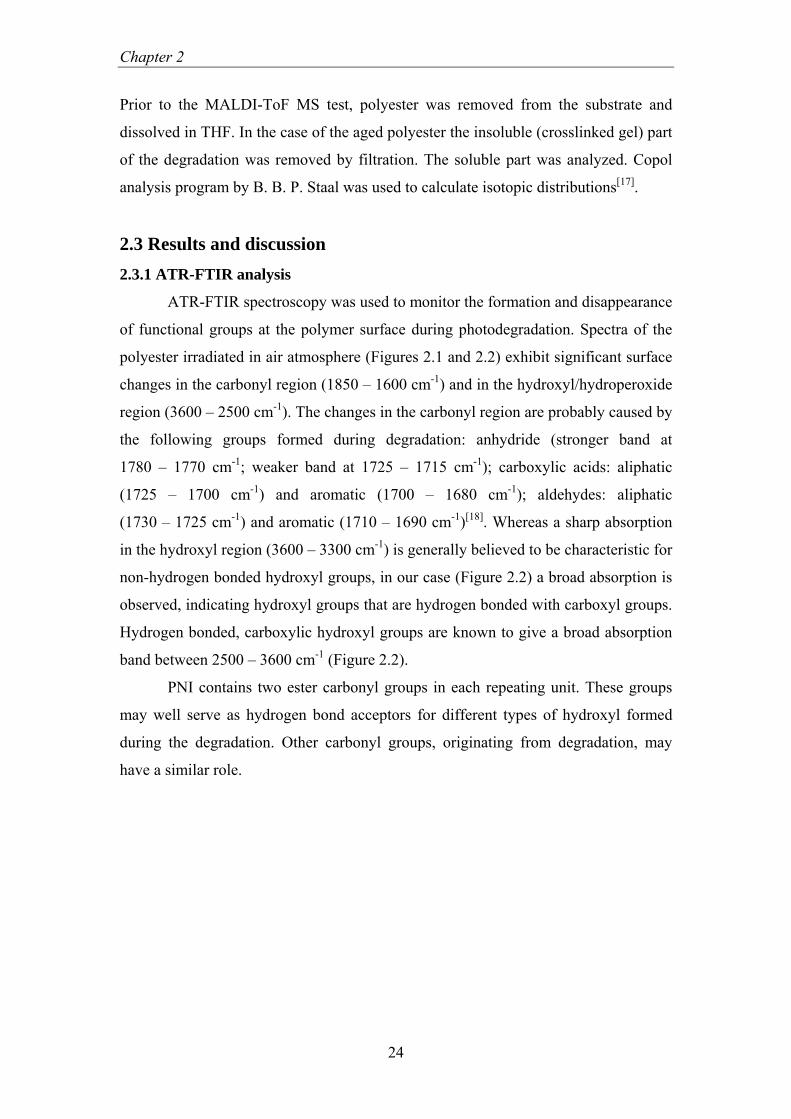
2.3 Results and discussion 2.3.1 ATR-FTIR analysis
ATR-FTIR spectroscopy was used to monitor the formation and disappearance
of functional groups at the polymer surface during photodegradation. Spectra of the
polyester irradiated in air atmosphere (Figures 2.1 and 2.2) exhibit significant surface
changes in the carbonyl region (1850 – 1600 cm-1) and in the hydroxyl/hydroperoxide
region (3600 – 2500 cm-1). The changes in the carbonyl region are probably caused by
the following groups formed during degradation: anhydride (stronger band at
1780 – 1770 cm-1; weaker band at 1725 – 1715 cm-1); carboxylic acids: aliphatic
(1725 – 1700 cm-1) and aromatic (1700 – 1680 cm-1); aldehydes: aliphatic
(1730 – 1725 cm-1) and aromatic (1710 – 1690 cm-1)[18]. Whereas a sharp absorption
in the hydroxyl region (3600 – 3300 cm-1) is generally believed to be characteristic for
non-hydrogen bonded hydroxyl groups, in our case (Figure 2.2) a broad absorption is
observed, indicating hydroxyl groups that are hydrogen bonded with carboxyl groups.
Hydrogen bonded, carboxylic hydroxyl groups are known to give a broad absorption
band between 2500 – 3600 cm-1 (Figure 2.2).
PNI contains two ester carbonyl groups in each repeating unit. These groups
may well serve as hydrogen bond acceptors for different types of hydroxyl formed
during the degradation. Other carbonyl groups, originating from degradation, may
have a similar role.
Molecular mechanism of photolysis and photooxidation of PNI
25
Wavenumber (cm-1)
20h10h
0h
1900 1800 1700 1600
Abso
rban
ce (a
.u.)
Wavenumber (cm-1)
20h10h
0h
1900 1800 1700 1600
Abso
rban
ce (a
.u.)
Figure 2.1. ATR-FTIR spectra (region of C=O band) of the PNI coating surface after UV-irradiation for 0, 10 and 20 hours. Normalized to the peak at 1716 cm-1.
3600 3200 2800 2400
Abs
orba
nce
(a.u
.)
Wavenumber (cm-1)
20h10h
0h
3600 3200 2800 2400
Abs
orba
nce
(a.u
.)
Wavenumber (cm-1)
20h10h
0h
Figure 2.2. ATR-FTIR spectra (region of OH and OOH band) of the PNI coating surface after UV-irradiation for 0, 10 and 20 hours. Normalized to the peak at 2967 cm-1.

Chapter 2
26
2.3.2 SEC analysis
It was noted, when trying to dissolve the exposed polyester coatings in THF
for SEC analysis, that some non-soluble material had been formed. We ascribe this to
a photo-induced crosslinking reaction (gel formation) as has also been reported by
others [5]. The results of the analysis of this gel will be presented in Chapter 5. For the
present study, the insoluble part of the sample is removed by filtration. Size Exclusion
Chromatography was performed to determine changes in molecular weight. Figure 2.3
shows SEC chromatograms of the polyester aged for 0, 10 and 20 hours. As can be
seen, molecules both with higher and lower molecular weight are formed during UV
exposure. Photodegradation leads to break-down of the polymer chains.
Simultaneously some of the radicals formed during this process may recombine and
form crosslinked molecules. During this process a high molecular weight sol fraction
(crosslinked molecules, still soluble) is formed first. Further crosslinking leads to gel
(insoluble crosslinked molecules) formation.
10 11 12 13 14 15 16 17 18 19Time (min)
Sca
led
dete
ctor
resp
onse
(a.u
.)
0h
10h20h
10 11 12 13 14 15 16 17 18 19Time (min)
Sca
led
dete
ctor
resp
onse
(a.u
.)
0h
10h20h
Figure 2.3. SEC chromatograms of PNI UV-irradiated for 0, 10 and 20 hours.
Molecular mechanism of photolysis and photooxidation of PNI
27
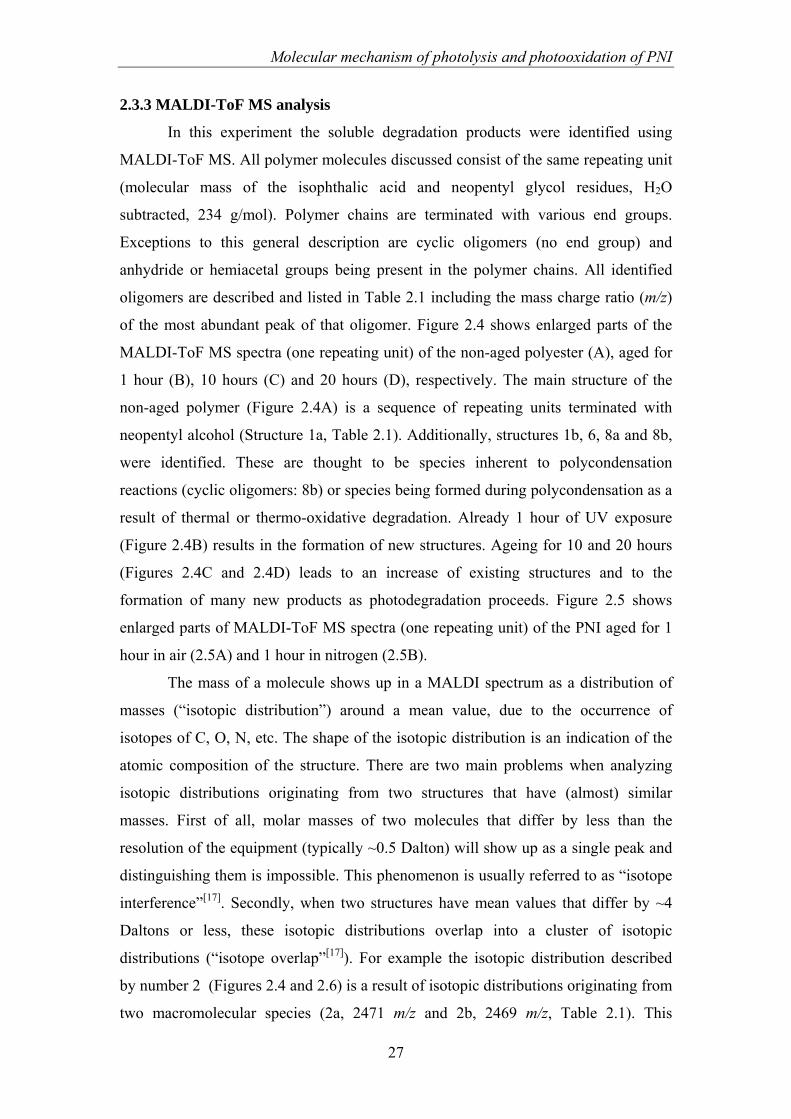
2.3.3 MALDI-ToF MS analysis
In this experiment the soluble degradation products were identified using
MALDI-ToF MS. All polymer molecules discussed consist of the same repeating unit
(molecular mass of the isophthalic acid and neopentyl glycol residues, H2O
subtracted, 234 g/mol). Polymer chains are terminated with various end groups.
Exceptions to this general description are cyclic oligomers (no end group) and
anhydride or hemiacetal groups being present in the polymer chains. All identified
oligomers are described and listed in Table 2.1 including the mass charge ratio (m/z)
of the most abundant peak of that oligomer. Figure 2.4 shows enlarged parts of the
MALDI-ToF MS spectra (one repeating unit) of the non-aged polyester (A), aged for
1 hour (B), 10 hours (C) and 20 hours (D), respectively. The main structure of the
non-aged polymer (Figure 2.4A) is a sequence of repeating units terminated with
neopentyl alcohol (Structure 1a, Table 2.1). Additionally, structures 1b, 6, 8a and 8b,
were identified. These are thought to be species inherent to polycondensation
reactions (cyclic oligomers: 8b) or species being formed during polycondensation as a
result of thermal or thermo-oxidative degradation. Already 1 hour of UV exposure
(Figure 2.4B) results in the formation of new structures. Ageing for 10 and 20 hours
(Figures 2.4C and 2.4D) leads to an increase of existing structures and to the
formation of many new products as photodegradation proceeds. Figure 2.5 shows
enlarged parts of MALDI-ToF MS spectra (one repeating unit) of the PNI aged for 1
hour in air (2.5A) and 1 hour in nitrogen (2.5B).
The mass of a molecule shows up in a MALDI spectrum as a distribution of
masses (“isotopic distribution”) around a mean value, due to the occurrence of
isotopes of C, O, N, etc. The shape of the isotopic distribution is an indication of the
atomic composition of the structure. There are two main problems when analyzing
isotopic distributions originating from two structures that have (almost) similar
masses. First of all, molar masses of two molecules that differ by less than the
resolution of the equipment (typically ~0.5 Dalton) will show up as a single peak and
distinguishing them is impossible. This phenomenon is usually referred to as “isotope
interference”[17]. Secondly, when two structures have mean values that differ by ~4
Daltons or less, these isotopic distributions overlap into a cluster of isotopic
distributions (“isotope overlap”[17]). For example the isotopic distribution described
by number 2 (Figures 2.4 and 2.6) is a result of isotopic distributions originating from
two macromolecular species (2a, 2471 m/z and 2b, 2469 m/z, Table 2.1). This
Chapter 2
28
phenomenon complicates the interpretation of the data. In order to overcome the
problem of isotope overlap and to identify the products of degradation, in-house-
developed software was used[17]. This program calculates the isotopic distributions for
given (expected) chemical structures and compares them to the experimental data.
The usefulness of this software has been already proven in the investigation of the
chemical composition and the topology of poly(lactide-co-glycolide)[19]. In our
experiment ultimately 15 isotopic distributions were found representing 28 molecules.
The same isotopic distributions were found in different repeating units from 1000 m/z
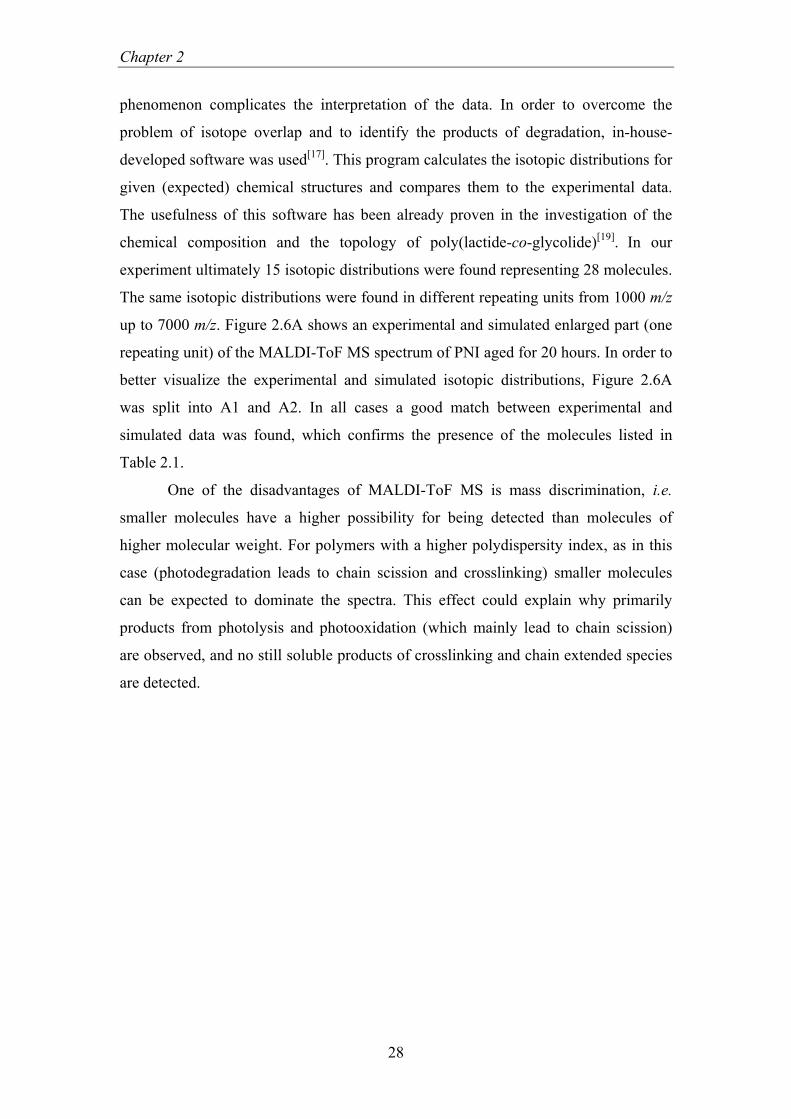
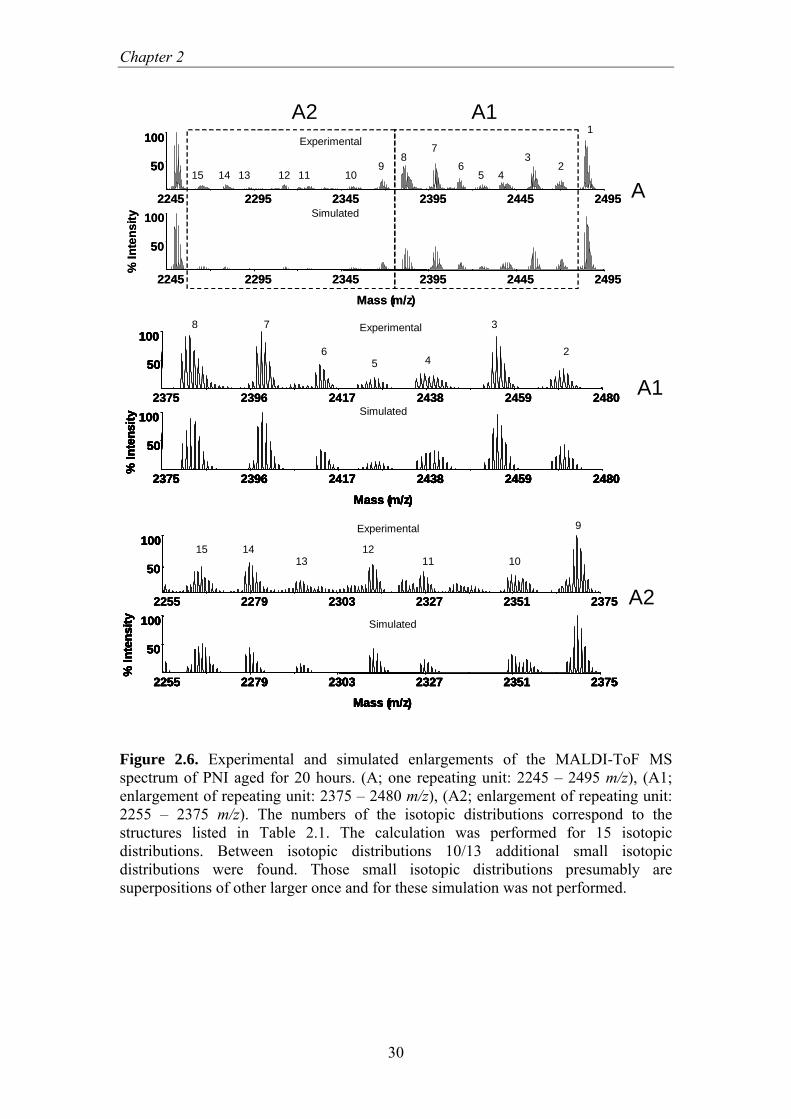
up to 7000 m/z. Figure 2.6A shows an experimental and simulated enlarged part (one
repeating unit) of the MALDI-ToF MS spectrum of PNI aged for 20 hours. In order to
better visualize the experimental and simulated isotopic distributions, Figure 2.6A
was split into A1 and A2. In all cases a good match between experimental and
simulated data was found, which confirms the presence of the molecules listed in
Table 2.1.
One of the disadvantages of MALDI-ToF MS is mass discrimination, i.e.
smaller molecules have a higher possibility for being detected than molecules of
higher molecular weight. For polymers with a higher polydispersity index, as in this
case (photodegradation leads to chain scission and crosslinking) smaller molecules
can be expected to dominate the spectra. This effect could explain why primarily
products from photolysis and photooxidation (which mainly lead to chain scission)
are observed, and no still soluble products of crosslinking and chain extended species
are detected.

Molecular mechanism of photolysis and photooxidation of PNI
29
2245 2295 2345 2395 2445 2495Mass (m/z)
40
100
% In
tens
ity
2245 2295 2345 2395 2445 2495
40
100
2245 2295 2345 2395 2445 2495
40
100
2245 2295 2345 2395 2445 2495
40
100
2245 2295 2345 2395 2445 2495Mass (m/z)
40
100
% In
tens
ity
2245 2295 2345 2395 2445 2495
40
100
2245 2295 2345 2395 2445 2495
40
100
2245 2295 2345 2395 2445 2495
40
100
1
1
23
45
678
9101112131415
2
3
467
8
1
6
8
1
68 A
B
C
D
37
Figure 2.4. Enlarged parts of MALDI-ToF MS spectra (one repeating unit) of PNI non aged (A), aged for 1 hour (B), 10 hours (C) and 20 hours (D). The numbers of the isotopic distributions correspond to the structures listed in Table 2.1.
2245 2295 2345 2395 2445 2495
Mass (m/z)
50
100
%In
tens
ity
2245 2295 2345 2395 2445 2495
50
100
83
1
6
83
1
6
2245 2295 2345 2395 2445 2495
Mass (m/z)
50
100
%In
tens
ity
2245 2295 2345 2395 2445 2495
Mass (m/z)
50
100
%In
tens
ity
2245 2295 2345 2395 2445 2495
50
100
2245 2295 2345 2395 2445 2495
50
100
83
1
6
83
1
6
A
B
7
7
Figure 2.5. Enlarged parts of MALDI-ToF MS spectra (one repeating unit) of PNI aged for 1 hour in air (A) and aged for 1 hour in nitrogen (B). The numbers of the isotopic distributions correspond to the structures listed in Table 2.1.
Chapter 2
30
2245 2295 2345 2395 2445 2495Mass (m/z)
50
100
% In
tens
ity
2245 2295 2345 2395 2445 2495
50
100
50
100
2245 2295 2345 2395 2445 2495Mass (m/z)
50
100
% In
tens
ity
2245 2295 2345 2395 2445 2495
50
100
2245 2295 2345 2395 2445 2495Mass (m/z)
50
100
% In
tens
ity
2245 2295 2345 2395 2445 2495
50
100
50
100
2 3
456
78
91011 12 13 15 14
A
A2 A11
Experimental
Simulated
2375 2396 2417 2438 2459 2480
Mass (m/z)
50
100
% In
tens
ity
2375 2396 2417 2438 2459 2480
50
100
2375 2396 2417 2438 2459 2480
Mass (m/z)
50
100
% In
tens
ity
50
100
2375 2396 2417 2438 2459 2480
Mass (m/z)
50
100
% In
tens
ity
2375 2396 2417 2438 2459 2480
50
100
2375 2396 2417 2438 2459 2480
Mass (m/z)
50
100
% In
tens
ity
2375 2396 2417 2438 2459 2480
50
100
2375 2396 2417 2438 2459 2480
Mass (m/z)
50
100
% In
tens
ity
2375 2396 2417 2438 2459 2480
Mass (m/z)
50
100
% In
tens
ity
50
1002
3
456
7 8
A1
Experimental
Simulated
2255 2279 2303 2327 2351 2375Mass (m/z)
50
100
% In
tens
ity
2255 2279 2303 2327 2351 2375
50
100
2255 2279 2303 2327 2351 2375Mass (m/z)
50
100
% In
tens
ity
50
100
2255 2279 2303 2327 2351 2375Mass (m/z)
50
100
% In
tens
ity
2255 2279 2303 2327 2351 2375
50
100
2255 2279 2303 2327 2351 2375Mass (m/z)
50
100
% In
tens
ity
2255 2279 2303 2327 2351 2375
50
100
2255 2279 2303 2327 2351 2375Mass (m/z)
50
100
% In
tens
ity
2255 2279 2303 2327 2351 2375Mass (m/z)
50
100
% In
tens
ity
50
1009
101112
13 15 14
A2
Experimental
Simulated
Figure 2.6. Experimental and simulated enlargements of the MALDI-ToF MS spectrum of PNI aged for 20 hours. (A; one repeating unit: 2245 – 2495 m/z), (A1; enlargement of repeating unit: 2375 – 2480 m/z), (A2; enlargement of repeating unit: 2255 – 2375 m/z). The numbers of the isotopic distributions correspond to the structures listed in Table 2.1. The calculation was performed for 15 isotopic distributions. Between isotopic distributions 10/13 additional small isotopic distributions were found. Those small isotopic distributions presumably are superpositions of other larger once and for these simulation was not performed.

Molecular mechanism of photolysis and photooxidation of PNI
31
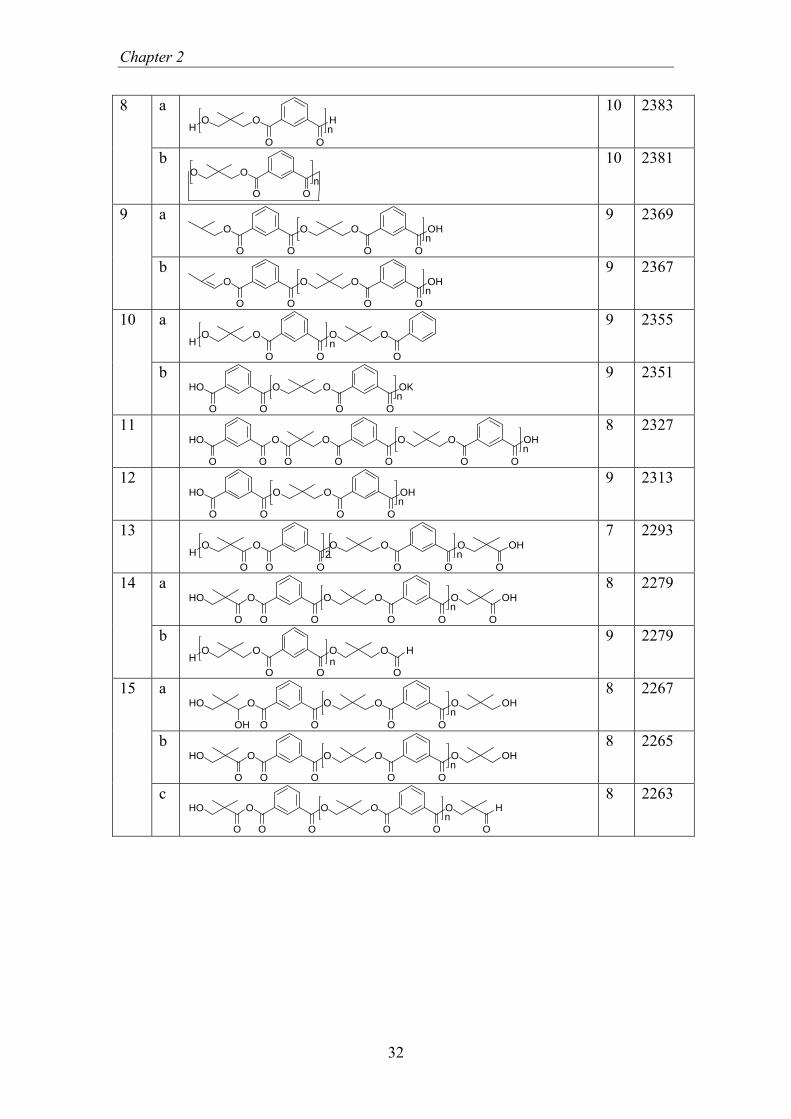
Table 2.1. Structures of the molecules identified with MALDI-ToF MS.
Isotopic distribu- tion number
Structure n M*K+
(most abundant peak)
a OO
O O
On
OHH
10 2485 1
b OO
O O
On
H
OH
10 2483
a OO
O O
On OHH
10 2471 2
b OO
O O
OnH
10 2469
a OO
O O
OnH
10 2455 3
b OO
O O
OnH
10 2453
a OO
O O
On
OO
OHO
9 2441
b OO
O O
On
OO
O9 2439
4
c OKO
O O
OnH
10 2437
a OO
O O
On
OO
OO
OO
HO
O
OH
O
8 2427
b OO
O O
On
OO
O9 2425
5
c OO
O O
On
OO
O9 2423
6 OO
O O
OnH
10 2413
a OHO
O O
OnH
10 2399 7
b OHO
O O
On
OO
OH
O
9 2397
Chapter 2
32
a HO
O O
OnH
10 2383 8
b O
O O
On
10 2381
a OHO
O O
On
OO
O9 2369 9
b OHO
O O
On
OO
O9 2367
a O
O
On
OO
OOH
9 2355 10
b OKO
O O
On
OO
HO9 2351
11 OHO
O O
On
OO
OO
OO
HO
O
8 2327
12 OHO
O O
On
OO
HO9 2313
13 OO
O O
On
OO
OO OH
OO2H
7 2293
a OO
O O
On
OO
OHO OH
OO
8 2279 14
b OO
O
O O
OOn
HH
9 2279
a OO
O O
On
OO
OHO OH
OH
8 2267
b OO
O O
On
OO
OHO OH
O
8 2265
15
c OO
O O
On
OO
OHO H
O O
8 2263
Molecular mechanism of photolysis and photooxidation of PNI
33
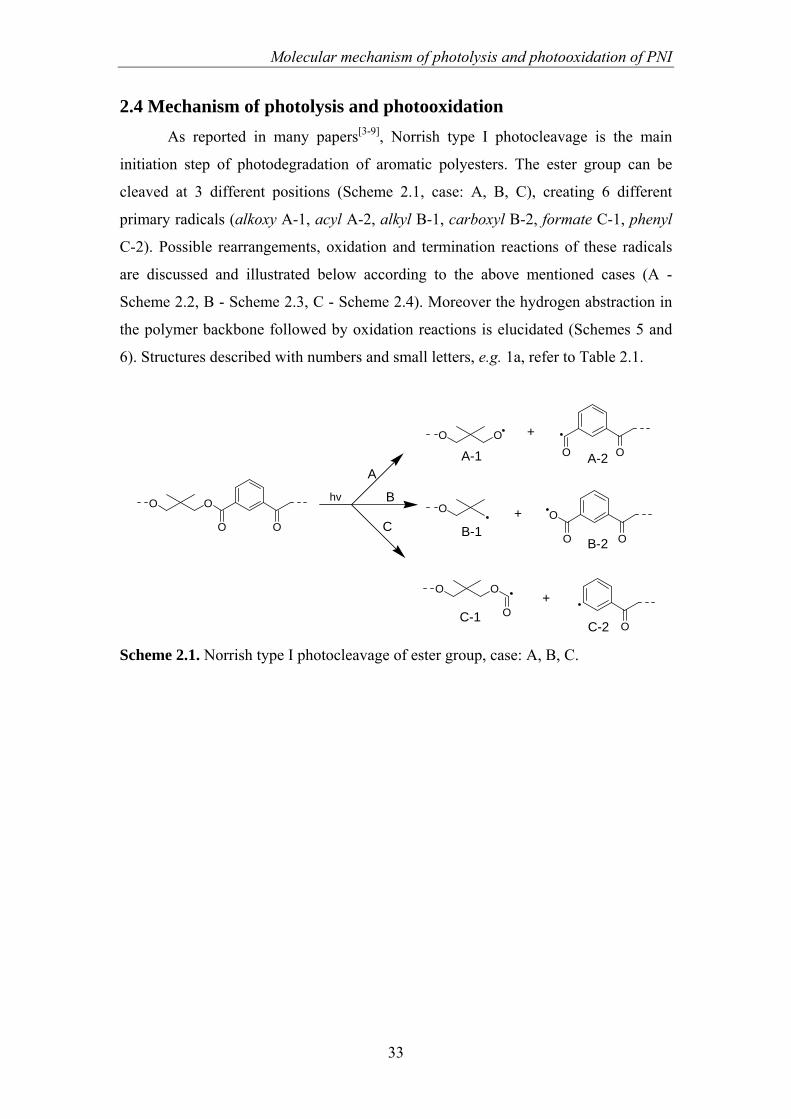
2.4 Mechanism of photolysis and photooxidation As reported in many papers[3-9], Norrish type I photocleavage is the main
initiation step of photodegradation of aromatic polyesters. The ester group can be
cleaved at 3 different positions (Scheme 2.1, case: A, B, C), creating 6 different
primary radicals (alkoxy A-1, acyl A-2, alkyl B-1, carboxyl B-2, formate C-1, phenyl
C-2). Possible rearrangements, oxidation and termination reactions of these radicals
are discussed and illustrated below according to the above mentioned cases (A -
Scheme 2.2, B - Scheme 2.3, C - Scheme 2.4). Moreover the hydrogen abstraction in
the polymer backbone followed by oxidation reactions is elucidated (Schemes 5 and
6). Structures described with numbers and small letters, e.g. 1a, refer to Table 2.1.
O
O O
O
OOO O
O
OO
O
O O
OO
A
B
C
A-1 A-2
B-1B-2
C-1C-2
+
+
+
hv
Scheme 2.1. Norrish type I photocleavage of ester group, case: A, B, C.
Chapter 2
34
2.4.1 Norrish type I photocleavage, case A (Scheme 2.2)
Due to Norrish type I photocleavage of the ester group, in case A (Schemes
2.1 and 2.2) an alkoxy radical A-1 (•O–CH2–) and an acyl radical A-2 (–C•=O) are
formed.
Alkoxy radical A-1
The alkoxy radical A-1 can be rearranged by formaldehyde elimination
(Scheme 2.2) to the tertiary alkyl radical A-3 (–•C<). Hydrogen abstraction by this
alkyl radical leads to the formation of an isobutyl end group (Structures 3a, 4a, 4b, 5b,
5c and 9a). Alternatively the tertiary alkyl radical A-3 can disproportionate (Scheme
2.2) to an isobutene end group (Structures 3b, 5c and 9b). The presence of isobutyl
and isobutene end groups was indicated by MALDI already after 1 hour of irradiation
both in air and nitrogen conditions (clustered isotopic distribution 3, Figure 2.4 and
2.5), proving that the photocleavage according to case A takes place.
Furthermore the tertiary alkyl radical A-3 can also undergo oxidation
processes (Scheme 2.2) resulting in the formation of a tertiary butanol (Structures 2a
and 4a). To this end for example, the tertiary alkyl A-3 first reacts with oxygen to
form a peroxy radical, which after hydrogen abstraction forms a hydroperoxide.
Decomposition of the hydroperoxide followed by hydrogen abstraction leads to the
formation of the tertiary butanol end group.
The alkoxy radical A-1 formed due to photocleavage, case A (Schemes 2.1
and 2.2) can also abstract hydrogen (Scheme 2.2) and form a neopentyl glycol end
group (Structure 1a). Since this end group is also present in the virgin polymer, this
does not lead to a new isotopic distribution in the MALDI spectrum. However, the
broad band formed in the hydroxyl/hydroperoxide region of the ATR-FTIR spectra
(Figure 2.2) suggests that hydroxyl groups are formed.
Acyl radical A-2
The Norrish type I photocleavage of the ester group, case A (Schemes 2.1 and
2.2) leads also to an acyl radical A-2 formation. After hydrogen abstraction of this
radical a phthalaldehyde end group is formed (Structure 8a). This structure together
with a cyclic oligomer (Structure 8b) is represented by the clustered isotopic
distribution 8 (Figures 2.4 and 2.6) and was identified already before ageing.
Although this isotopic distribution seems to rise in comparison to the isotopic
distribution 1 (representing virgin polymer, Figure 2.4), it can not be concluded
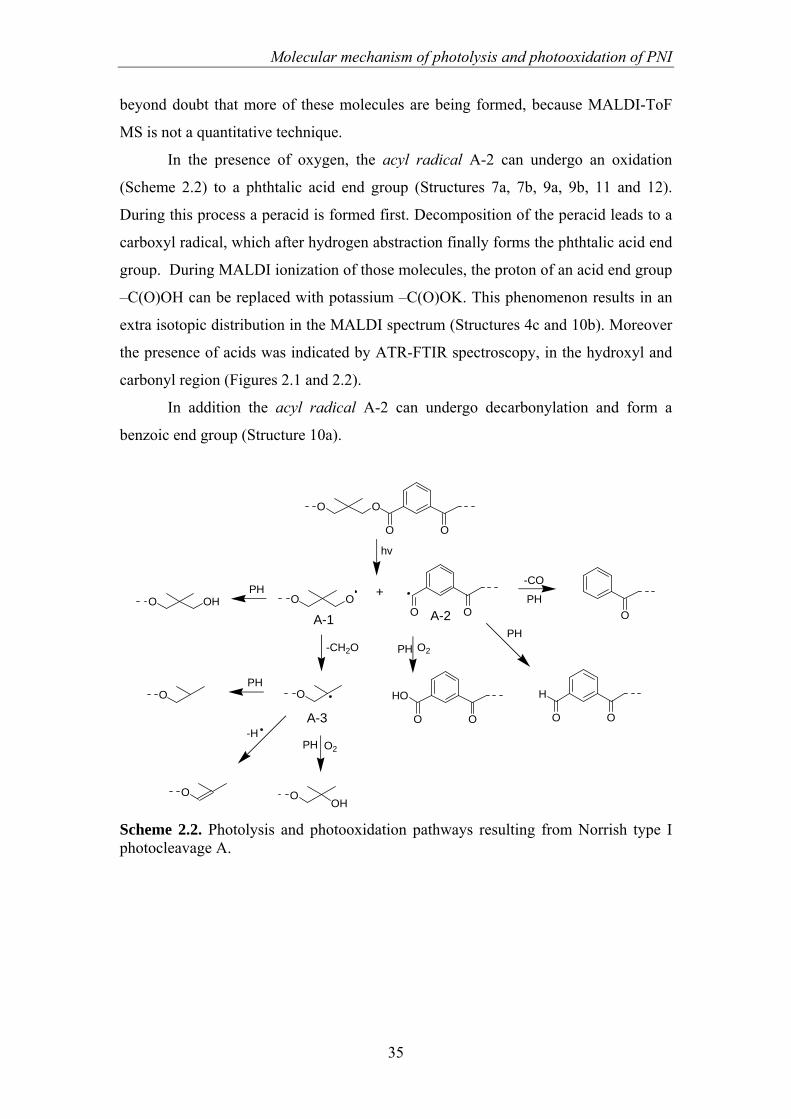
Molecular mechanism of photolysis and photooxidation of PNI
35
beyond doubt that more of these molecules are being formed, because MALDI-ToF
MS is not a quantitative technique.
In the presence of oxygen, the acyl radical A-2 can undergo an oxidation
(Scheme 2.2) to a phthtalic acid end group (Structures 7a, 7b, 9a, 9b, 11 and 12).
During this process a peracid is formed first. Decomposition of the peracid leads to a
carboxyl radical, which after hydrogen abstraction finally forms the phthtalic acid end
group. During MALDI ionization of those molecules, the proton of an acid end group
–C(O)OH can be replaced with potassium –C(O)OK. This phenomenon results in an
extra isotopic distribution in the MALDI spectrum (Structures 4c and 10b). Moreover
the presence of acids was indicated by ATR-FTIR spectroscopy, in the hydroxyl and
carbonyl region (Figures 2.1 and 2.2).
In addition the acyl radical A-2 can undergo decarbonylation and form a
benzoic end group (Structure 10a).
O
O O
O
OHO OOO O O
O
O
OO
HO
OO
HO
OOH
+PH
hv
-CO
O2-CH2O
A-1 A-2
A-3
PH
PH
O2
PH
PH
PH
-H
Scheme 2.2. Photolysis and photooxidation pathways resulting from Norrish type I photocleavage A.
Chapter 2
36
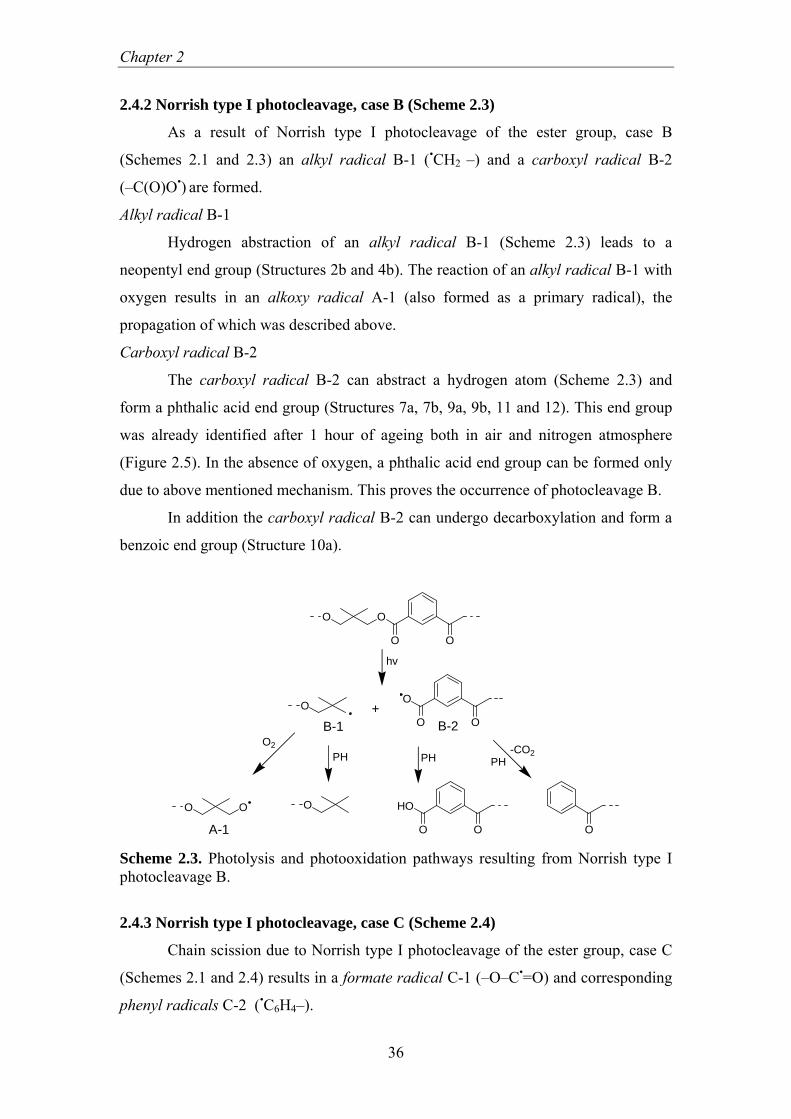
2.4.2 Norrish type I photocleavage, case B (Scheme 2.3)
As a result of Norrish type I photocleavage of the ester group, case B
(Schemes 2.1 and 2.3) an alkyl radical B-1 (•CH2 –) and a carboxyl radical B-2
(–C(O)O•) are formed.
Alkyl radical B-1
Hydrogen abstraction of an alkyl radical B-1 (Scheme 2.3) leads to a
neopentyl end group (Structures 2b and 4b). The reaction of an alkyl radical B-1 with
oxygen results in an alkoxy radical A-1 (also formed as a primary radical), the
propagation of which was described above.
Carboxyl radical B-2
The carboxyl radical B-2 can abstract a hydrogen atom (Scheme 2.3) and
form a phthalic acid end group (Structures 7a, 7b, 9a, 9b, 11 and 12). This end group
was already identified after 1 hour of ageing both in air and nitrogen atmosphere
(Figure 2.5). In the absence of oxygen, a phthalic acid end group can be formed only
due to above mentioned mechanism. This proves the occurrence of photocleavage B.
In addition the carboxyl radical B-2 can undergo decarboxylation and form a
benzoic end group (Structure 10a).
O
O O
O
OO
OO O
O
O
OO
HO
+
O2
hv
-CO2
B-1 B-2
PH PH
O
PH
A-1 Scheme 2.3. Photolysis and photooxidation pathways resulting from Norrish type I photocleavage B.
2.4.3 Norrish type I photocleavage, case C (Scheme 2.4)
Chain scission due to Norrish type I photocleavage of the ester group, case C
(Schemes 2.1 and 2.4) results in a formate radical C-1 (–O–C•=O) and corresponding
phenyl radicals C-2 (•C6H4–).

Molecular mechanism of photolysis and photooxidation of PNI
37
Formate radical C-1
A formate radical C-1 can undergo decarbonylation or decarboxylation
(Scheme 2.4). The first reaction leads to the formation of CO and an alkoxy radical
A-1, the second to the formation of CO2 and an alkyl radical B-1. The hydrogen
abstraction of a formate radical C-1 would lead to the formation of a formate end
group (Structure 14b). The m/z ratio of 2279 seems to correspond to this structure.
However, it can also be attributed to, for example, oligomers terminated with a pivalic
acid end group and also containing an anhydride (Structure 14a).
Phenyl radical C-2
As was illustrated in Scheme 2.1, case C and Scheme 2.4, the phenyl radical
C-2 can be formed by photocleavage of the ester group. It can be also formed by
decarbonylation of the acyl (Scheme 2.2) or by decarboxylation of the carboxyl
radicals (Scheme 2.3). Phenyl radicals C-2 can abstract hydrogen (Schemes 2.2, 2.3
and 2.4) and form a benzoic end group (Structure 10a).
Although several of the possible photocleavage C products could be attributed
to isotopic distributions observed in the MALDI-ToF MS spectra, these isotopic
distributions could also be explained on the basis of photocleavage A and B and/or
oxidation reactions from them. Hence there is no direct proof for the occurrence of
photocleavage C.
O
O O
O
OO
OOO
O
O
+
hv
-CO
C-1 C-2
A-1
O
B-1
-CO2
OO
O
PHPH
Scheme 2.4. Photolysis and photooxidation pathways resulting from Norrish type I photocleavage C.

Chapter 2
38
2.4.4 Hydrogen abstraction from the polymer backbone followed by oxidation
reactions (Schemes 2.5 and 2.6)
The impact of hydrogen abstraction of all above mentioned processes is
considerable. As was shown, polymer-free radicals and later formed oxy- and peroxy-
radicals can abstract hydrogen. The by far most labile hydrogen atoms on the
polyester backbone are located in the α-position of the ester group. Macromolecular
alkyl radicals (Scheme 2.5), (–C•H–O–C(O)–) result from hydrogen abstraction on
those positions. Such macroalkyl radicals can react with oxygen. First a peroxyradical
is formed, which in turn, by hydrogen abstraction creates hydroperoxide. This
hydroperoxide can undergo a homolysis reaction and the macroalkoxy radical (–
C(O•)H–O–C(O)–) is formed (Scheme 2.5). The above described reaction can take
place in each repeating unit of the polymer. A macroalkoxy radical can undergo at
least tree different reactions.
First, macroalkoxy radical (–C(O•)H–O–C(O)–) can convert into an anhydride
(Scheme 2.5) (–C(O)–O–C(O)–) through a cage reaction (Structures 5a, 11, 13, 14a,
15b and 15c). Later such macromolecular anhydrides can undergo a Norrish I
photocleavage reaction similar to those described above for the original polyester
structure[8].
If the above described cage reaction would take place at the end group of a
hydroxyl functional polymer chain (Scheme 2.6) (methylene group next to the alcohol
group –CH2–OH), a pivalic acid end group would be formed (Structures 5a, 13 and
14a). Both reactions (anhydride and pivalic acid formation) result in the same change
in mass (+14 Da) with respect to structure 1a. Taking the average molecular weight of
the polyester (6600 g/mol, by titration) and the mass of a repeating cluster (234
g/mol) into account the average ratio of the repeating units to the end groups is
approximately 14 to 1. In this respect the probability of formation of anhydride is
much higher than that of a pivalic acid through a cage reaction mentioned before.
An independent proof of the presence of macromolecular anhydride groups
(Scheme 2.5) is the formation of this moiety in the molecules both terminated with
phthalic acid, where no confusion with pivalic acid is possible (Structure 11).
The macroalkoxy radical (–C(O•)H–O–C(O)–) can also undergo a β-scission
reaction (Scheme 2.5). As a consequence a carboxyl radical B-2 and an pivalic
aldehyde are formed (Structures 1b, 7b and 15c). Since some traces of a pivalic
aldehyde were already detected before UV irradiation it is difficult to evaluate if this

Molecular mechanism of photolysis and photooxidation of PNI
39
reaction really takes place. It is known that aldehyde in this conditions can easy
undergo oxidation to acid (Scheme 2.5), (Structures 5a, 13 and 14a).
Finally, a macroalkoxy radical can abstract hydrogen and form a hemiacetal
(Scheme 2.5), (Structure 15a).
O
O O
O
O
O O
O
O
O O
O
O
O
O O
O
O
H
O
O O
O
O
O
O O
O
OH
O
O
OH
O2
PH O2
cage reaction
β -scision+
P
OH
H2O Scheme 2.5. The hydrogen abstraction from the polymer backbone followed by oxidation reactions.
O OH O OH
O
O2
Scheme 2.6.
In many of the mechanisms proposed in this paper, a macromolecular
hydroperoxide as intermediate species is proposed. Although we have successfully
identified most of the products, we could not find direct evidence of hydroperoxides
in the MALDI spectra. This is probably due to their low UV and thermal stability. As
intermediate products, hydroperoxides, are known to accumulate only in very low
concentration[8].

Chapter 2
40
2.4.5 Final remarks
In this investigation we have successfully identified products of the photolysis
and photooxidation of poly(neopentyl isophthalate) using MALDI-ToF MS. The
interpretation of complicated (isotope overlapping) MALDI-ToF MS data was
supported with in-house-developed software for the isotope distribution calculation,
resulting in detailed structural information on the products of the photodegradation.
This technique allowed studying individual polymer chains as a function of exposure
time.
Based on highly informative data obtained, it is confirmed that the Norrish
type I photocleavage of the ester group takes place first. In the initial stage, radicals
which are formed in this reaction (directly, or after rearrangement) abstract hydrogen
from a neighboring segment and form new end groups. For instance, isobutyl and
isobutene end groups (Structures 3a and 3b) were identified after 1 hour of irradiation.
UV exposure of PNI for 1 hour under nitrogen resulted in formation of the same
clustered isotopic distribution 3 attributed to isobutyl and isobutene end groups. This
additionally confirms our interpretation of the data and proves that in the initial stage
of degradation direct photocleavage followed by a hydrogen abstraction takes place.
The products of oxidation are being observed in the later stages.
The primary radicals and later formed oxy- and peroxy- radicals can abstract
hydrogen. The most labile hydrogen atoms on the polyester backbone are present in
the α-position of the ester group. Oxidation processes taking place in the polymer
backbone can directly (β-scission) or indirectly (anhydride) lead to further
fragmentation of polymer chain.
As shown above there are two mechanisms leading to fragmentation of
polymer chain. Direct Norrish type I photocleavage of aromatic ester and oxidation of
the polymer backbone taking place respectively.
Norrish type I photocleavage can take place at three different positions of an
aromatic ester group. Based on the bond dissociation energies of a model compound
(ethyl benzoate), Day and Wiles suggested that the photocleavages A (88 kcal/mole)
and B (84 kcal/mole) are more favorable then photocleavage C (102 kcal/mole)[6]
(Scheme 2.1). The experimental data obtained in this chapter can confirm that
photocleavages A and B are most predominant during degradation of PNI.

Molecular mechanism of photolysis and photooxidation of PNI
41
2.5 Conclusions In this chapter, the molecular mechanism of the photolysis and photooxidation
of an non-crosslinked poly(neopentyl isophthalate) (PNI), applied as a thin coating
on an aluminium plate and aged in the UVACUBE (λ > ~254 nm) was studied.
Information on the changes in the size of the molecules was obtained by SEC.
Both an increase and a decrease of molar weight were observed, indicating that
crosslinking and chain scission take place simultaneously during photodegradation.
ATR-FTIR was used to detect groups such as C=O and OH/OOH generated in
the polymer structure due to the break-down of polymer chain by photooxidation.
Anhydrides and acids were clearly identified in the range of 1800 – 1600 cm-1.
Moreover, the formation of a very broad band in the range of 3600 – 2500 cm-1
indicates the presence of different types of OH groups (alcohol, carboxyl and
hydroperoxide).
MALDI-ToF MS revealed the molecular structure of the degradation products
from the very first reactions taking place. It has been demonstrated that Norrish type I
photocleavage reactions takes place, in accordance with the earlier published bond
dissociations energies of the possible pathways. Radicals formed from those
photocleavages can abstract hydrogens and form mainly isobutyl and phthalic acid
end groups, which are observed in MALDI in early stages of degradation. Reactions
of the above mentioned radicals with oxygen lead to acid and alcohol groups, and
these photooxidation products are observed in MALDI in later stages of
photodegradation.
Hydrogen abstraction from the polymer backbone plays an important role in
photodegradation too. Radicals formed in the α-position to the ester due to hydrogen
abstraction may react with oxygen. The alkoxy radical formed as a consequence of
this process can rearrange to anhydride (via a cage reaction), which possibly later
breaks down e.g. by hydrolysis. The alkoxy radical may also directly decompose via
β-scission. These reactions taking place along the polymer backbone account for
oxidation induced decomposition of polymer.
In general, the data obtained with MALDI-ToF MS and supported by SEC and
ATR-FTIR allowed to establish mechanisms of the photolysis and photooxidation on
a molecular level leading to a considerably improved understanding of the
degradation processes of aromatic polyesters.

Chapter 2
42
References 1. Rabek JF. Polymer photodegradation - mechanisms and experimental methods,
1st ed. London:Chapman and Hall, 1995.
2. White JR, Turnbull A. J Mater Sci 1994;29:584-613.
3. Marcotte FB, Campbell D, Cleaveland JA, Turner DT. J Polym Sci
1967;5:481-501.
4. Day M, Wiles DM. J Appl Polym Sci 1972;16:175-189.
5. Day M, Wiles DM. J Appl Polym Sci 1972;16:191-202.
6. Day M, Wiles DM. J Appl Polym Sci 1972;16:203-215.
7. Rivaton A. Polym Degrad Stab 1993;41:283-296.
8. Rivaton A. Polym Degrad Stab 1993;41:297-310.
9. Grossetete T, Rivaton A, Gardette JL, Hoyle CE, Ziemer M, Fagerburg DR,
Clauberg H. Polymer 2000;41:3541-3554.
10. Tabankia MH, Gardette JL. Polym Degrad Stab 1986;14:351-365.
11. Maetens D. Prog Org Coat 2007;58:172-179.
12. Skaja AD, Croll SG. Polym Degrad Stab 2003;79:123-131.
13. Carroccio S, Rizzarelli P, Puglisi C, Montaudo G. Macromolecules
2004;37:6576-6586.
14. Carroccio S, Puglisi C, Montaudo G. Macromolecules 2004;37:6037-6049.
15. Carroccio S, Puglisi C, Montaudo G. Macromolecules 2005;38:6863-6870.
16. Carroccio S, Rizzarelli P, Scaltro G, Puglisi C. Polymer 2008;49:3371-3381
17. Staal BBP. Ph.D. Thesis. University of Technology Eidhoven, 2005, ISBN
90-386-2816-1, http://alexandria.tue.nl/extra2/200510293.pdf.
18. Lin-Vien D, Colthup NB, Fateley WG, Grasselli JG. The Handbook of Infrared
and Raman Characteristics Frequencies of Organic Molecules, Academic Pres,
1990.
19. Huijser S, Staal BBP, Huang J, Duchateau R, Koning CE. Angew Chem
2006;118:4210-4214.
3
Photodegradation of poly(neopentyl isophthalate) in
laboratory and outdoor conditions
Summary In this Chapter the mechanism of photodegradation of poly(neopentyl
isophthalate) (PNI) in laboratory (Suntest XXL+, λ > ~300 nm) and outdoor
conditions is studied. Changes in the chemical composition were studied with ATR-
FTIR, SEC and MALDI-ToF MS. Results were compared with data presented in
Chapter 2, on PNI coatings that were aged in the UVACUBE (λ > ~254 nm). Two
aspects of photodegradation of polymers are addressed: the influence of different
wavelengths and the comparison of laboratory and outdoor exposure regarding the
mechanism of degradation. It was found that under short (λ > ~254 nm) and long (λ >
~300 nm) wavelength irradiation similar products of degradation are formed.
However, the presence of short wavelength radiation dramatically accelerates the
overall rate of photodegradation of PNI as shown by experiments and energy
absorption calculations. The exposure of PNI in laboratory and outdoor conditions
resulted in similar degradation products in the initial stage of ageing.

Chapter 3
44
3.1 Introduction Aromatic polyesters are widely used in the field of coating technology.
Thermally or UV cured aromatic polyesters form excellent coatings which are used
for protective and decorative purposes. Advantages like good mechanical properties
and low cost make these polymers very attractive in coating applications. On the other
hand, most aromatic polyester coatings exhibit rather modest resistance to weathering.
Absorption of UV light causes chain scission which leads to the decomposition of the
polymer. The chemical reactions taking place influence the physical properties of
coatings and ultimately may lead to cracking, gloss loss and blistering[1-3]. Such a
degraded coating can not maintain the protective and decorative functions anymore.
Investigation of the degradation mechanisms of polyesters is essential for a better
understanding of ageing processes and, subsequently, for improving their weathering
stability.
A great deal of information on the photodegradation of polyesters like
poly(ethylene terephthalate) PET and poly(butylene terephthalate) PBT is
available[4-9]. Norrish (type I and II) photocleavage has been considered as the main
initiation step. The radicals formed in this chain scission reaction either abstract
hydrogen or undergo oxidation processes. In addition, recombination of radicals may
also lead to crosslinking reactions.
The previous studies, however, were mainly focused on polyesters based on
the terephthalate (TPA) unit. In recent years it has been demonstrated that
replacement of TPA by its isomer, isophthalate (IPA) in the polyester backbone
considerably extends the life time of the polyester coating[10]. The superior
performance of IPA coatings under weathering is attributed to the lower absorption of
UV light as compared to polyesters based on TPA[11]. Yet the mechanism of
photodegradation of polyesters based on IPA, like poly(neopentyl isophthalate) (PNI)
has not been studied extensively. The understanding of these phenomena is essential
for a further improvement of weathering stability of polyester coatings. Moreover the
mechanisms of degradation of polymers are usually studied with overall spectroscopic
techniques such as FTIR and UV. In recent years the application of analytical
techniques for molecular structure determination like MALDI-ToF MS gained
increasing interest when studying the mechanisms of (thermal and photo)
degradation[12,13]. This technique provides detailed structural information on the

Photodegradation of PNI in laboratory and outdoor conditions
45
degradation products, which allows establishing precise mechanisms of the
degradation.
In Chapter 2 the photodegradation of non-crosslinked poly(neopentyl
isophthalate) (PNI) coatings exposed in the UVACUBE apparatus (λ > ~254 nm) was
studied. It had been reported in literature that the presence of irradiation below
approximately 300 nm can not only strongly accelerate the photodegradation but may
also influence its mechanism[1,2]. The chemical effects of photodegradation were
studied with ATR-FTIR, SEC and MALDI-ToF MS. As a result of this investigation,
a mechanism of the photolysis and photooxidation was proposed.
In this chapter we report on the photodegradation of non-crosslinked PNI
coatings both aged in Suntest XXL+ (λ > ~300 nm) and aged in outdoor conditions.
The spectral distribution of the light provided by the Suntest XXL+ nearly resembles
the spectral distribution of natural light[§,14]. The mechanism of the photodegradation
is studied with ATR-FTIR, SEC and MALDI-ToF MS. MALDI-ToF mass
spectrometry is used to establish the mechanism of photolysis and photooxidation on
the molecular level, and to compare it with the previously reported mechanisms under
highly accelerated conditions (UVACUBE: λ > ~254 nm). In particular, two aspects
of degradation of polymers will be discussed. First, the influence of the wavelength (λ
> ~254 nm and λ > ~300 nm) on the mechanism of degradation will be addressed.
Secondly, a comparison of laboratory with outdoor exposure regarding the
mechanism will be discussed. The mechanism of photocrosslinking reactions will be
discussed in Chapter 5.
§ The Suntest XXL+ is equipped with Xenon lamps and daylight filters. The spectral power distribution (SPD) of the light provided starts at about 300 nm. However, it is possible that a small fraction of the light below 300 nm, down to about 285 nm, is present in the SPD. Due to the very low intensity of this light a precise quantitative measurement is difficult. However, since some polymers strongly absorb below 300 nm this small fraction may lead to a significant absorption. In view of the uncertainties involved, in this work, the light below approximately 300 nm is not taken into account.

Chapter 3
46
3.2 Experimental Materials
A model polyester based on neopentyl glycol isophthalic acid (PNI) was used
in this study. The polyester was prepared in a bulk polycondensation with Titanium
(IV) n-butoxide (Ti(OBu)4) as a catalyst. Synthesis was performed with an excess of
neopentyl glycol resulting in a hydroxyl functional polymer. Hydroxyl value (OHV) is
16 mg of KOH/g and acid value (AV) is 1 mg of KOH/g. The number average
molecular weight (Mn) based on titration data equals 6600 g/mol, and as measured
using SEC equals 9650 g/mol. The glass transition temperature Tg, as measured by
DSC, was 58 ○C.
Coating preparation
Polyester coatings were prepared according to the following procedure. First,
PNI was dissolved in N-methyl-2-pyrrolidone (30 w/w %) and then applied on
aluminium plates using a doctor blade driven by a 509 MC Coatmaster applicator
(Erichsen GmbH). The thickness of the resulting dry coating was approximately 12
μm as measured with a TWIN-CHECK Instrument (List-Magnetic GmbH). Coatings
were dried in an air circulation oven at 120 ºC for one hour; all NMP was evaporated
(checked with FTIR, C=O at 1675 cm-1).
Weathering conditions
PNI coatings were aged using a Suntest XXL+ (ATLAS), equipped with
xenon lamps. The light emitted by xenon lamps was filtered with daylight filters (λ >
~300 nm). The intensity of light was 60 W/m2 in the wavelength range of 300 – 400
nm. The chamber temperature was 45 ºC and the temperature of the black standard
was 70 ºC. The relative humidity was 25%. Polyester coatings were aged for up to
10,000 hours, which corresponds to approximately 15 months.
Outdoor exposure was performed in Poland (2005 – 2007) for 17,000 hours
which corresponds to about 2 years. Samples were suspended vertically, oriented to
the south.
In this discussion we will use the word UVACUBE to refer to exposure to
light of a high pressure Mercury lamp (Dr. Hönle AG) emitting radiation in 254 – 600
nm in the usual set up of a UVACUBE equipment. The intensity of the light was 40
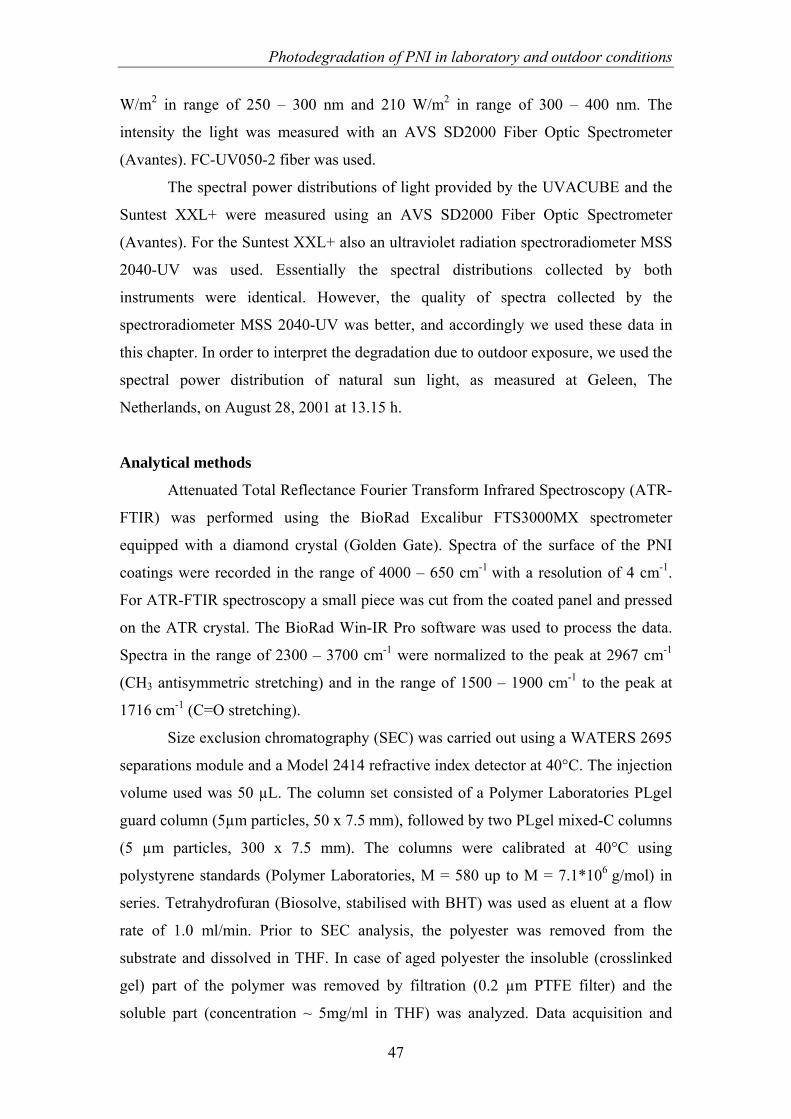
Photodegradation of PNI in laboratory and outdoor conditions
47
W/m2 in range of 250 – 300 nm and 210 W/m2 in range of 300 – 400 nm. The
intensity the light was measured with an AVS SD2000 Fiber Optic Spectrometer
(Avantes). FC-UV050-2 fiber was used.
The spectral power distributions of light provided by the UVACUBE and the
Suntest XXL+ were measured using an AVS SD2000 Fiber Optic Spectrometer
(Avantes). For the Suntest XXL+ also an ultraviolet radiation spectroradiometer MSS
2040-UV was used. Essentially the spectral distributions collected by both
instruments were identical. However, the quality of spectra collected by the
spectroradiometer MSS 2040-UV was better, and accordingly we used these data in
this chapter. In order to interpret the degradation due to outdoor exposure, we used the
spectral power distribution of natural sun light, as measured at Geleen, The
Netherlands, on August 28, 2001 at 13.15 h.
Analytical methods
Attenuated Total Reflectance Fourier Transform Infrared Spectroscopy (ATR-
FTIR) was performed using the BioRad Excalibur FTS3000MX spectrometer
equipped with a diamond crystal (Golden Gate). Spectra of the surface of the PNI
coatings were recorded in the range of 4000 – 650 cm-1 with a resolution of 4 cm-1.
For ATR-FTIR spectroscopy a small piece was cut from the coated panel and pressed
on the ATR crystal. The BioRad Win-IR Pro software was used to process the data.
Spectra in the range of 2300 – 3700 cm-1 were normalized to the peak at 2967 cm-1
(CH3 antisymmetric stretching) and in the range of 1500 – 1900 cm-1 to the peak at
1716 cm-1 (C=O stretching).
Size exclusion chromatography (SEC) was carried out using a WATERS 2695
separations module and a Model 2414 refractive index detector at 40°C. The injection
volume used was 50 µL. The column set consisted of a Polymer Laboratories PLgel
guard column (5µm particles, 50 x 7.5 mm), followed by two PLgel mixed-C columns
(5 µm particles, 300 x 7.5 mm). The columns were calibrated at 40°C using
polystyrene standards (Polymer Laboratories, M = 580 up to M = 7.1*106 g/mol) in
series. Tetrahydrofuran (Biosolve, stabilised with BHT) was used as eluent at a flow
rate of 1.0 ml/min. Prior to SEC analysis, the polyester was removed from the
substrate and dissolved in THF. In case of aged polyester the insoluble (crosslinked
gel) part of the polymer was removed by filtration (0.2 µm PTFE filter) and the
soluble part (concentration ~ 5mg/ml in THF) was analyzed. Data acquisition and
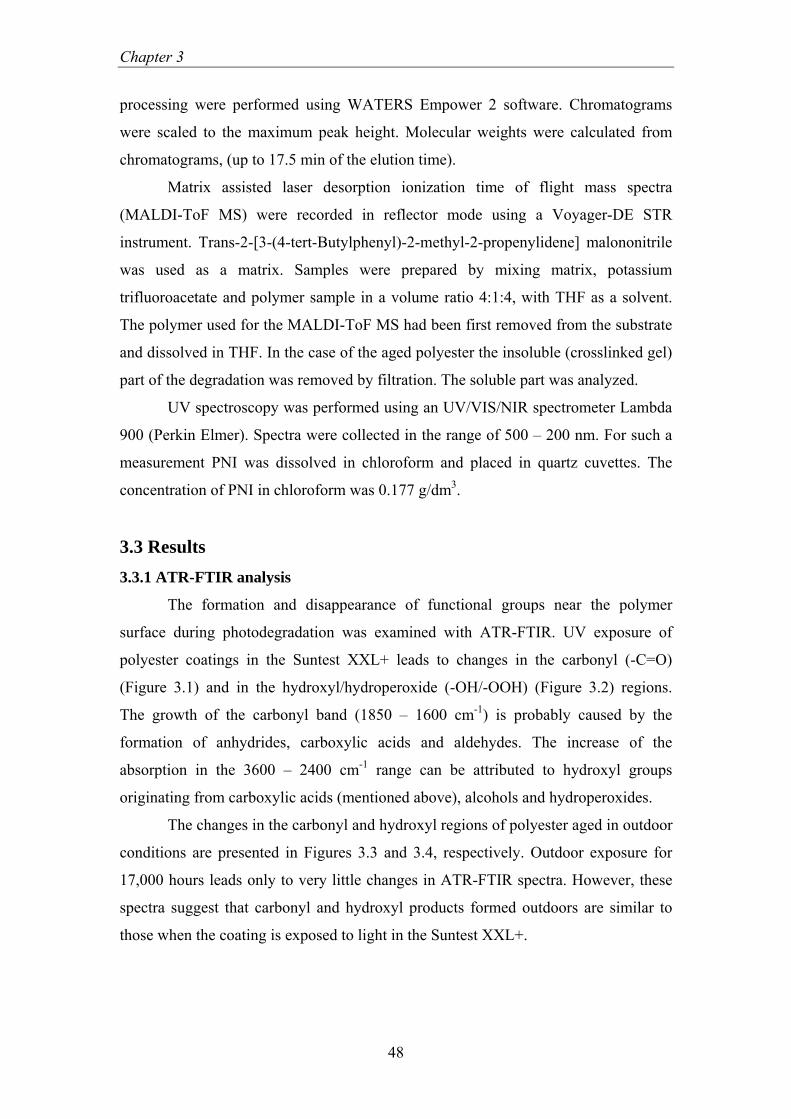
Chapter 3
48
processing were performed using WATERS Empower 2 software. Chromatograms
were scaled to the maximum peak height. Molecular weights were calculated from
chromatograms, (up to 17.5 min of the elution time).
Matrix assisted laser desorption ionization time of flight mass spectra
(MALDI-ToF MS) were recorded in reflector mode using a Voyager-DE STR
instrument. Trans-2-[3-(4-tert-Butylphenyl)-2-methyl-2-propenylidene] malononitrile
was used as a matrix. Samples were prepared by mixing matrix, potassium
trifluoroacetate and polymer sample in a volume ratio 4:1:4, with THF as a solvent.
The polymer used for the MALDI-ToF MS had been first removed from the substrate
and dissolved in THF. In the case of the aged polyester the insoluble (crosslinked gel)
part of the degradation was removed by filtration. The soluble part was analyzed.
UV spectroscopy was performed using an UV/VIS/NIR spectrometer Lambda
900 (Perkin Elmer). Spectra were collected in the range of 500 – 200 nm. For such a
measurement PNI was dissolved in chloroform and placed in quartz cuvettes. The
concentration of PNI in chloroform was 0.177 g/dm3.
3.3 Results 3.3.1 ATR-FTIR analysis
The formation and disappearance of functional groups near the polymer
surface during photodegradation was examined with ATR-FTIR. UV exposure of
polyester coatings in the Suntest XXL+ leads to changes in the carbonyl (-C=O)
(Figure 3.1) and in the hydroxyl/hydroperoxide (-OH/-OOH) (Figure 3.2) regions.
The growth of the carbonyl band (1850 – 1600 cm-1) is probably caused by the
formation of anhydrides, carboxylic acids and aldehydes. The increase of the
absorption in the 3600 – 2400 cm-1 range can be attributed to hydroxyl groups
originating from carboxylic acids (mentioned above), alcohols and hydroperoxides.
The changes in the carbonyl and hydroxyl regions of polyester aged in outdoor
conditions are presented in Figures 3.3 and 3.4, respectively. Outdoor exposure for
17,000 hours leads only to very little changes in ATR-FTIR spectra. However, these
spectra suggest that carbonyl and hydroxyl products formed outdoors are similar to
those when the coating is exposed to light in the Suntest XXL+.
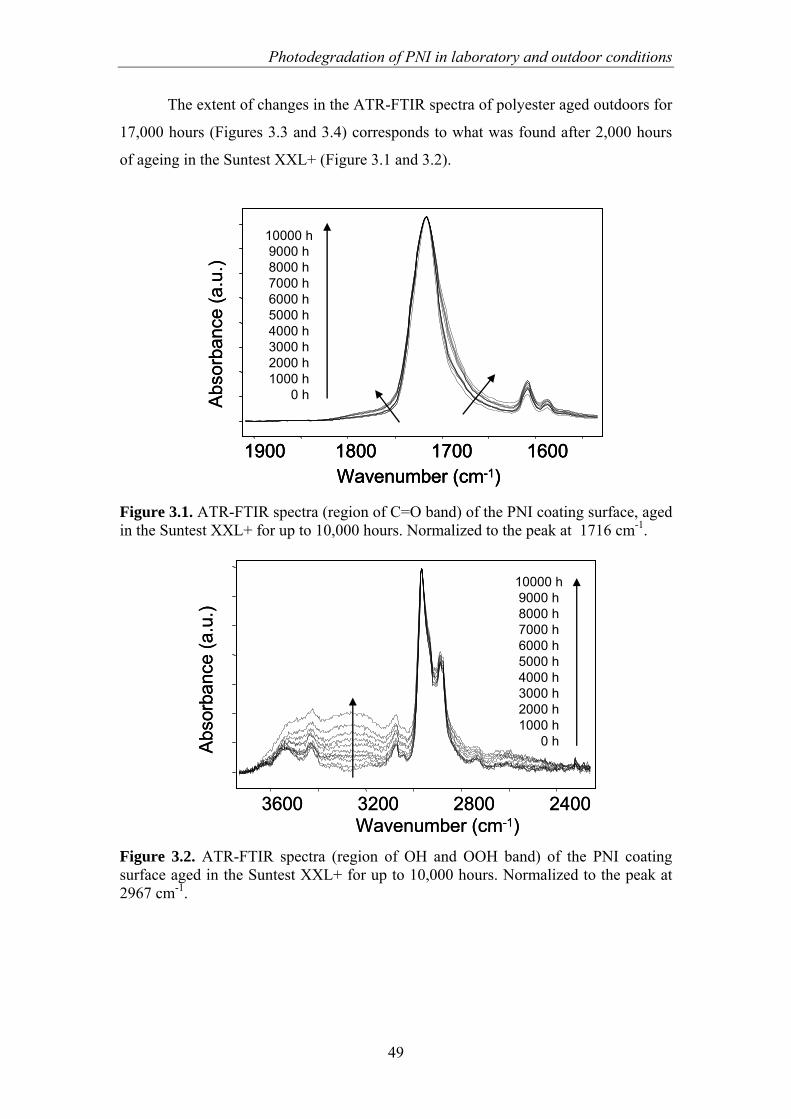
Photodegradation of PNI in laboratory and outdoor conditions
49
The extent of changes in the ATR-FTIR spectra of polyester aged outdoors for
17,000 hours (Figures 3.3 and 3.4) corresponds to what was found after 2,000 hours
of ageing in the Suntest XXL+ (Figure 3.1 and 3.2).
Abs
orba
nce
(a.u
.)
Wavenumber (cm-1)1900 1800 1700 1600
10000 h9000 h8000 h7000 h6000 h5000 h4000 h3000 h2000 h1000 h
0 hAbs
orba
nce
(a.u
.)
Wavenumber (cm-1)1900 1800 1700 1600
10000 h9000 h8000 h7000 h6000 h5000 h4000 h3000 h2000 h1000 h
0 h
Wavenumber (cm-1)1900 1800 1700 1600
10000 h9000 h8000 h7000 h6000 h5000 h4000 h3000 h2000 h1000 h
0 h
Figure 3.1. ATR-FTIR spectra (region of C=O band) of the PNI coating surface, aged in the Suntest XXL+ for up to 10,000 hours. Normalized to the peak at 1716 cm-1.
3600 3200 2800 2400Wavenumber (cm-1)
Abs
orba
nce
(a.u
.)
10000 h9000 h8000 h7000 h6000 h5000 h4000 h3000 h2000 h1000 h
0 h
3600 3200 2800 2400Wavenumber (cm-1)
Abs
orba
nce
(a.u
.)
10000 h9000 h8000 h7000 h6000 h5000 h4000 h3000 h2000 h1000 h
0 h
Figure 3.2. ATR-FTIR spectra (region of OH and OOH band) of the PNI coating surface aged in the Suntest XXL+ for up to 10,000 hours. Normalized to the peak at 2967 cm-1.
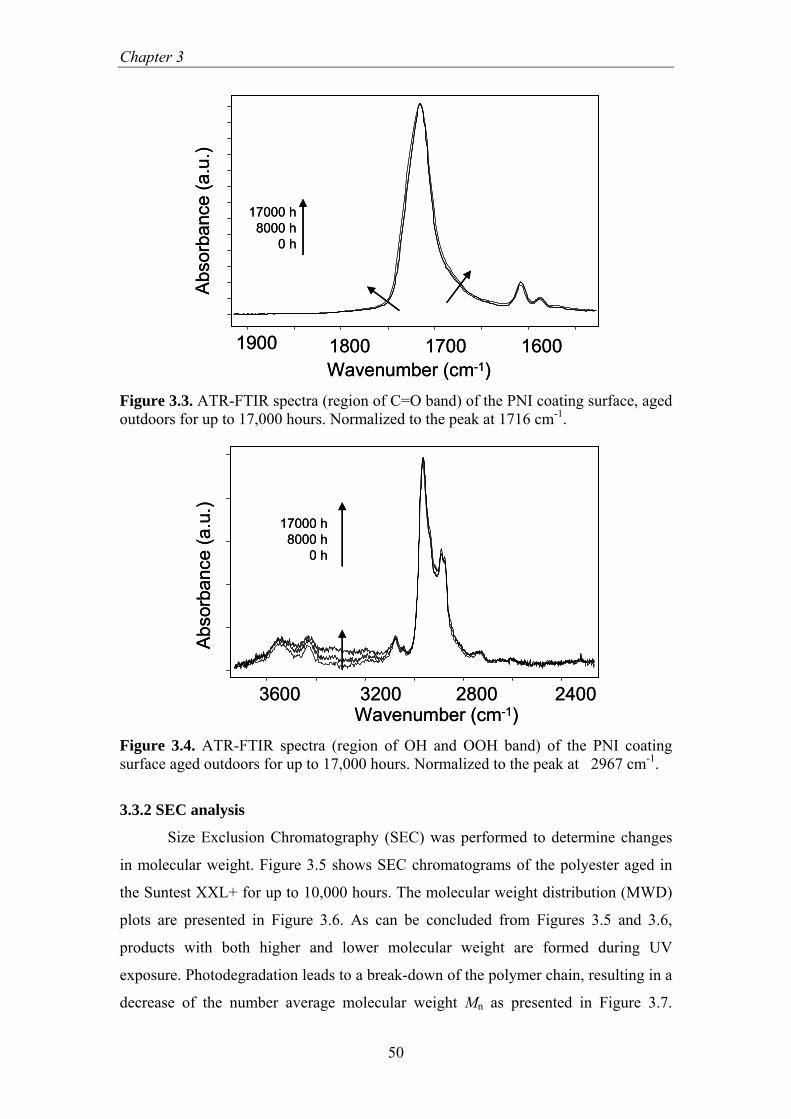
Chapter 3
50
1900 1800 1700 1600Wavenumber (cm-1)
Abs
orba
nce
(a.u
.)17000 h
8000 h0 h
1900 1800 1700 1600Wavenumber (cm-1)
Abs
orba
nce
(a.u
.)17000 h
8000 h0 h
Figure 3.3. ATR-FTIR spectra (region of C=O band) of the PNI coating surface, aged outdoors for up to 17,000 hours. Normalized to the peak at 1716 cm-1.
3600 3200 2800 2400Wavenumber (cm-1)
Abso
rban
ce (a
.u.)
17000 h8000 h
0 h
3600 3200 2800 2400Wavenumber (cm-1)
Abso
rban
ce (a
.u.)
17000 h8000 h
0 h
Figure 3.4. ATR-FTIR spectra (region of OH and OOH band) of the PNI coating surface aged outdoors for up to 17,000 hours. Normalized to the peak at 2967 cm-1.
3.3.2 SEC analysis
Size Exclusion Chromatography (SEC) was performed to determine changes
in molecular weight. Figure 3.5 shows SEC chromatograms of the polyester aged in
the Suntest XXL+ for up to 10,000 hours. The molecular weight distribution (MWD)
plots are presented in Figure 3.6. As can be concluded from Figures 3.5 and 3.6,
products with both higher and lower molecular weight are formed during UV
exposure. Photodegradation leads to a break-down of the polymer chain, resulting in a
decrease of the number average molecular weight Mn as presented in Figure 3.7.
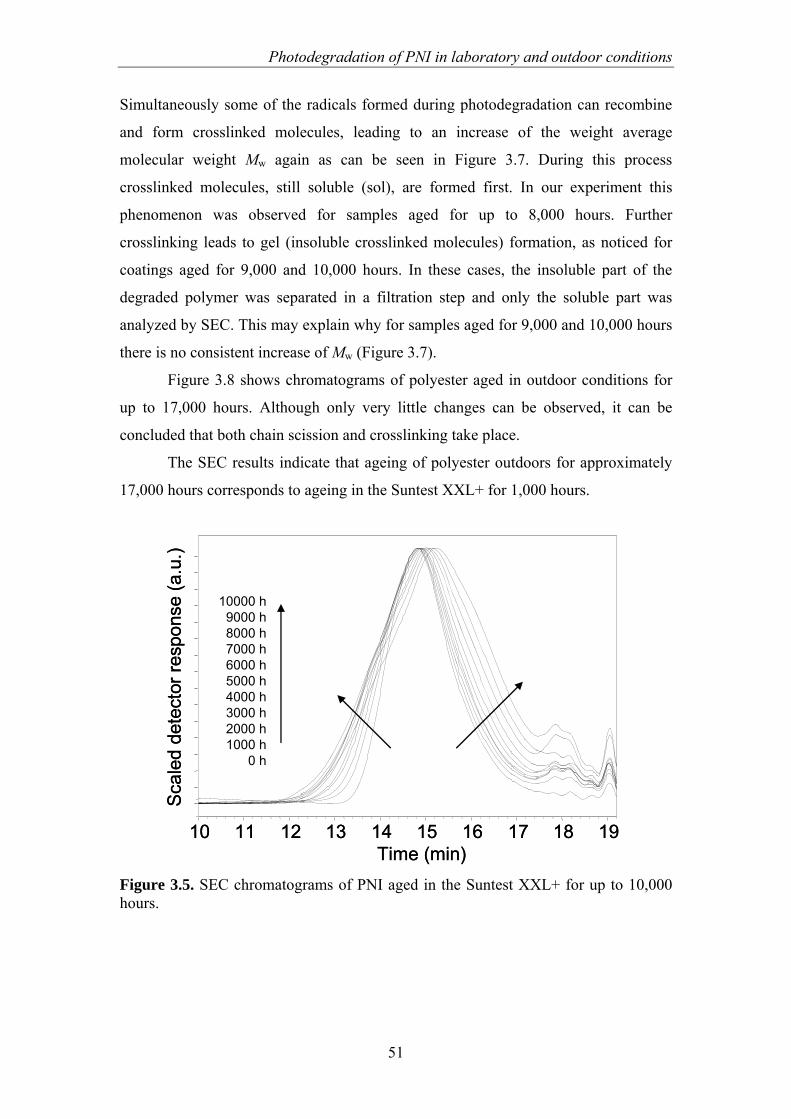
Photodegradation of PNI in laboratory and outdoor conditions
51
Simultaneously some of the radicals formed during photodegradation can recombine
and form crosslinked molecules, leading to an increase of the weight average
molecular weight Mw again as can be seen in Figure 3.7. During this process
crosslinked molecules, still soluble (sol), are formed first. In our experiment this
phenomenon was observed for samples aged for up to 8,000 hours. Further
crosslinking leads to gel (insoluble crosslinked molecules) formation, as noticed for
coatings aged for 9,000 and 10,000 hours. In these cases, the insoluble part of the
degraded polymer was separated in a filtration step and only the soluble part was
analyzed by SEC. This may explain why for samples aged for 9,000 and 10,000 hours
there is no consistent increase of Mw (Figure 3.7).
Figure 3.8 shows chromatograms of polyester aged in outdoor conditions for
up to 17,000 hours. Although only very little changes can be observed, it can be
concluded that both chain scission and crosslinking take place.
The SEC results indicate that ageing of polyester outdoors for approximately
17,000 hours corresponds to ageing in the Suntest XXL+ for 1,000 hours.
Sca
led
dete
ctor
resp
onse
(a.u
.)
Time (min)10 11 12 13 14 15 16 17 18 19
10000 h9000 h8000 h7000 h6000 h5000 h4000 h3000 h2000 h1000 h
0 h
Sca
led
dete
ctor
resp
onse
(a.u
.)
Time (min)10 11 12 13 14 15 16 17 18 19
10000 h9000 h8000 h7000 h6000 h5000 h4000 h3000 h2000 h1000 h
0 h
Figure 3.5. SEC chromatograms of PNI aged in the Suntest XXL+ for up to 10,000 hours.
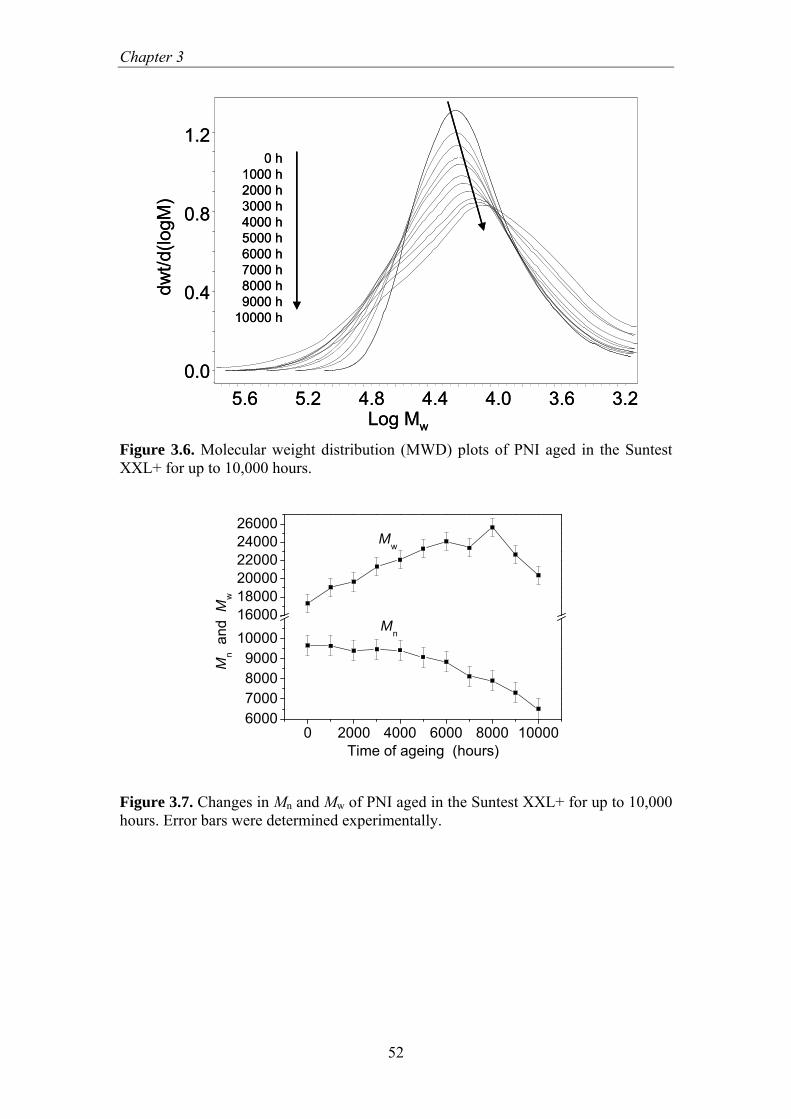
Chapter 3
52
dwt/d
(logM
)
0.0
0.4
0.8
1.2
Log Mw
3.23.64.04.44.85.25.6
0 h1000 h2000 h3000 h4000 h5000 h6000 h7000 h8000 h9000 h
10000 h
dwt/d
(logM
)
0.0
0.4
0.8
1.2
Log Mw
3.23.64.04.44.85.25.6
0 h1000 h2000 h3000 h4000 h5000 h6000 h7000 h8000 h9000 h
10000 h
Figure 3.6. Molecular weight distribution (MWD) plots of PNI aged in the Suntest XXL+ for up to 10,000 hours.
0 2000 4000 6000 8000 100006000700080009000
10000160001800020000220002400026000
Mw
Mn
Mn
and
Mw
Time of ageing (hours)
Figure 3.7. Changes in Mn and Mw of PNI aged in the Suntest XXL+ for up to 10,000 hours. Error bars were determined experimentally.

Photodegradation of PNI in laboratory and outdoor conditions
53
17000 h8000 h
0 h
Scal
ed d
etec
tor r
espo
nse
(a.u
.)
Time (min)10 11 12 13 14 15 16 17 18 19
17000 h8000 h
0 h
Scal
ed d
etec
tor r
espo
nse
(a.u
.)
Time (min)10 11 12 13 14 15 16 17 18 19
Figure 3.8. SEC chromatograms of PNI aged outdoors for up to 17,000 hours.
3.3.3 MALDI-ToF MS analysis
Structural information of the products of photolysis and photooxidation of PNI
were obtained with MALDI-ToF MS. All the structures found consist of a sequence
of repeating units (molecular mass of the isophthalic acid and neopentyl glycol, H2O
subtracted, is 234 g/mol), terminated with various end groups. All identified
oligomers are described and listed in Table 2.1, Chapter 2, where each one was given
an identifier consisting of a number and optionally small letter e.g. 1a. Figure
3.9A – F shows parts of the MALDI-ToF-MS spectra (one repeating unit) of the non-
aged polyester (A), aged in Suntest XXL+ for 2,000 hours (B), 4,000 hours (C), 6,000
hours (D), 8,000 hours (E) and 10,000 hours (F). The main structure of the non-aged
polymer (Figure 3.9A) is a sequence of repeating units terminated with neopentyl
glycol (Structure 1a). In addition, structures 1b, 6, 8a and 8b were identified. These
are presumably species inherent in polycondensation reactions (e.g. cyclic oligomers:
8b) or species being formed during polycondensation as a result of thermal or thermo-
oxidative degradation reactions. Ageing for 2,000 hour results in the formation of
other structures indicated in Figure 3.9B with numbers 3 and 7. Further ageing leads
to a further increase of structures 3 and 7 and also to the formation of many new
products (see Figure 3.9C – F). Figure 3.9G shows one repeating unit of the MALDI-
ToF MS spectra of polyester aged in outdoor conditions for 17,000 hours. It can be
Chapter 3
54
concluded that ageing of polyester outdoors for 17,000 hours results in the formation
of structures similar to those after exposure in the Suntest XXL+ for about 2,000
hours (Figure 3.9B).
Any molecular structure shows up in the MALDI-ToF MS spectrum as an
“isotopic distribution” One of the problems associated with the analysis of MALDI-
ToF MS data is the “isotope overlap”. The presence of two or more molecules with a
small difference in mass (2 – 4 Daltons) results in overlapping of isotope distributions
(“clustered isotopic distribution”). This phenomenon complicates the identification of
products. In the previous chapter, in-house-developed software[15] to overcome this
problem was successfully applied. That program calculates the isotopic distributions
for given (expected) chemical structures and compares them with the experimental
data. Figure 3.10 compares parts of MALDI-ToF MS spectra of polyester aged for 20
hours in the UVACUBE (A) (previously obtained) and of polyester aged for 8,000
hours in the Suntest XXL+ (B). In both cases the same 15 (clustered) isotopic
distributions were found representing 28 molecules (Table 2.1). The same isotopic
distributions were found when analyzing other repeating units from 1,000 m/z up to
7,000 m/z. In order to better visualize isotopic distributions, enlarged parts of the two
MALDI spectra presented in Figure 3.10 were split into two parts. In all cases a good
match in isotopic distribution between UVACUBE and Suntest XXL+ was found.
This confirms that under both accelerated degradation conditions the same molecules
are formed. Figure 3.9H shows one repeating unit of polyester aged in the
UVACUBE for 1 hour (previously obtained). Ageing of polyester for 1 hour in the
UVACUBE results in formation of products described with numbers 3 and 7. The
same structures were identified after ageing for 2,000 hours in the Suntest XXL+
(3.9B) and 17,000 hours in outdoor conditions (3.9G).

Photodegradation of PNI in laboratory and outdoor conditions
55
1
2245 2295 2345 2395 2445 2495
50
100
2245 2295 2345 2395 2445 2495
50
100
68
68 3
0 h
2000 h Suntest XXL+
7
A
B
2245 2295 2345 2395 2445 2495
50
100
2245 2295 2345 2395 2445 2495
50
1001
68
1
68 3
4000 h Suntest XXL+
6000 h Suntest XXL+
7
7
32
2459
C
D
1
68
1
68
3
8000 h Suntest XXL+
10000 h Suntest XXL+
7
7
3
2
245
9
2245 2295 2345 2395 2445 2495
50
100
2245 2295 2345 2395 2445 2495
50
100
45
1015
12
111314
91015 12 111314
E
F
2245 2295 2345 2395 2445 2495
50
100
683
7
C
1
17000 h Outdoor
2245 2295 2345 2395 2445 2495
50
100
683
7
G
1
2245 2295 2345 2395 2445 2495
50
100
683
7
C
1
17000 h Outdoor
2245 2295 2345 2395 2445 2495
50
100
683
7
G
1
% In
tens
ity
Mass (m/z)2245 2295 2345 2395 2445 2495
50
100
H6
837
1
1 h UVACUBE
2245 2295 2345 2395 2445 2495
50
100
H6
837
1
1 h UVACUBE
1
1
2245 2295 2345 2395 2445 2495
50
100
2245 2295 2345 2395 2445 2495
50
100
68
68 3
0 h
2000 h Suntest XXL+
7
A
B
2245 2295 2345 2395 2445 2495
50
100
2245 2295 2345 2395 2445 2495
50
1001
68
1
68 3
4000 h Suntest XXL+
6000 h Suntest XXL+
7
7
32
2459
C
D
2245 2295 2345 2395 2445 2495
50
100
2245 2295 2345 2395 2445 2495
50
1001
68
1
68 3
4000 h Suntest XXL+
6000 h Suntest XXL+
7
7
32
2459
C
D
1
68
1
68
3
8000 h Suntest XXL+
10000 h Suntest XXL+
7
7
3
2
245
9
2245 2295 2345 2395 2445 2495
50
100
2245 2295 2345 2395 2445 2495
50
100
45
1015
12
111314
91015 12 111314
E
F
1
68
1
68
3
8000 h Suntest XXL+
10000 h Suntest XXL+
7
7
3
2
245
9
2245 2295 2345 2395 2445 2495
50
100
2245 2295 2345 2395 2445 2495
50
100
45
1015
12
111314
91015 12 111314
E
F
2245 2295 2345 2395 2445 2495
50
100
683
7
C
1
17000 h Outdoor
2245 2295 2345 2395 2445 2495
50
100
683
7
G
1
2245 2295 2345 2395 2445 2495
50
100
683
7
C
1
17000 h Outdoor
2245 2295 2345 2395 2445 2495
50
100
683
7
G
1
% In
tens
ity
Mass (m/z)2245 2295 2345 2395 2445 2495
50
100
H6
837
1
1 h UVACUBE
2245 2295 2345 2395 2445 2495
50
100
H6
837
1
1 h UVACUBE
% In
tens
ity
Mass (m/z)2245 2295 2345 2395 2445 2495
50
100
H6
837
1
1 h UVACUBE
2245 2295 2345 2395 2445 2495
50
100
H6
837
1
1 h UVACUBE
1
Figure 3.9. Enlarged parts of MALDI-ToF MS spectra (one repeating unit) of PNI non-aged (A), aged in the Suntest XXL+ for 2,000 hours (B), 4,000 hours (C), 6,000 hours (D), 8,000 hours (E) and 10,000 hours (F), aged outdoors for 17,000 hours (G) and in the UVACUBE for 1 hour (H). The numbers of the isotopic distributions correspond to the structures listed in Table 2.1 of Chapter 2.

Chapter 3
56
2245 2295 2345 2395 2445 2495Mass (m/z)
50
100
%In
tens
ity
2245 2295 2345 2395 2445 2495
50
1001
68
1
68
3
20 h UVACUBE
8000 h Suntest XXL+
7
7
2
245
9
45
1015 12111314
91015 12 111314
A
B
3
2 1
2375 2396 2417 2438 2459 2480
50
100
2375 2396 2417 2438 2459 2480
50
100
6
87
24
5
3
A
B
1
2255 2279 2303 2327 2351 2375
50
100
2255 2279 2303 2327 2351 2375
50
1009
1015
12 1113
14
A
B
2
2245 2295 2345 2395 2445 2495Mass (m/z)
50
100
%In
tens
ity
2245 2295 2345 2395 2445 2495
50
1001
68
1
68
3
20 h UVACUBE
8000 h Suntest XXL+
7
7
2
245
9
45
1015 12111314
91015 12 111314
A
B
3
2 1
2375 2396 2417 2438 2459 2480
50
100
2375 2396 2417 2438 2459 2480
50
100
6
87
24
5
3
A
B
1
2375 2396 2417 2438 2459 2480
50
100
2375 2396 2417 2438 2459 2480
50
100
6
87
24
5
3
A
B
1
2255 2279 2303 2327 2351 2375
50
100
2255 2279 2303 2327 2351 2375
50
1009
1015
12 1113
14
A
B
2
2255 2279 2303 2327 2351 2375
50
100
2255 2279 2303 2327 2351 2375
50
1009
1015
12 1113
14
A
B
2
Figure 3.10. Enlarged parts of MALDI-ToF MS spectra (one repeating unit 2245 – 2495 m/z) of PNI, aged for 20 hours in the UVACUBE (A) and for 8,000 hours in the Suntest XXL+ (B). (A1, B1; enlargement of repeating unit: 2375 – 2480 m/z), (A2, B2; enlargement of repeating unit: 2255 – 2375 m/z). The numbers of the isotopic distributions correspond to the structures listed in Table 2.1 of Chapter 2.
Photodegradation of PNI in laboratory and outdoor conditions
57
3.4 Discussion In Chapter 2 the photodegradation of PNI exposed to light in the UVACUBE
(λ > 254 nm) was reported. Mechanisms of photolysis and photooxidation were
proposed. This chapter reports on the photodegradation of PNI exposed to light in the
Suntest XXL+ (λ > ~300 nm) and in outdoor conditions. Based on the data obtained
two aspects of degradation of polymers are addressed.
The first aspect concerns the influence of the wavelength (UVACUBE: λ >
~254 nm and Suntest XXL+: λ > ~300 nm) on the mechanism of degradation. As it
has been reported, the presence of the irradiation below approximately 300 nm, which
is practically not present in realistic (outdoor) conditions, can strongly accelerate the
kinetics of photodegradation. However, it can also influence the individual steps of
the mechanism of degradation and may cause reactions which will not take place in
outdoor conditions[1,2]. The mechanism of photodegradation was studied with three
analytical techniques (ATR-FTIR, SEC and MALDI-ToF MS). Figure 3.11 shows
changes in the ATR-FTIR spectrum (carbonyl region) of PNI exposed for 20 hours in
the UVACUBE and 10,000 hours in the Suntest XXL+. It can be concluded that under
both accelerated degradation conditions similar carbonyl groups are formed. Figure
3.12 shows SEC chromatograms of PNI aged for 20 hours in the UVACUBE and
10,000 hours in the Suntest XXL+. In both cases chain scission and crosslinking take
place. It was mentioned that extensive crosslinking leads to gel (insoluble fraction)
formation. In case of ageing in the UVACUBE some gel was formed already in the
very early stages of exposure (5 hours) and continues to grow. Exposure for 20 hours
resulted in a rise of the gel fraction to approximately 23%. In case of exposure in the
Suntest XXL+ system, extensive fragmentation of the polyester takes place, before
gel formation. The maximum of the peak in the chromatogram (Figure 3.12) shifts
towards lower molecular weight. The first indication of a gel was noticed after 9,000
hours of exposure and after 10,000 hours the gel fraction was approximately 5%. The
data on SEC and gel fraction indicate a higher crosslinking / chain scission ratio for
PNI exposed in the UVACUBE as compared to the Suntest XXL+. As discussed
below, in the UVACUBE most UV light is absorbed in the top layer of the coating
whereas in the Suntester XXL+ it is presumed to be also transmitted to deeper layers
of the coating. This will lead to a higher concentration of radicals in the top layer of
the coating in the UVACUBE. If crosslinking is a recombination reaction between
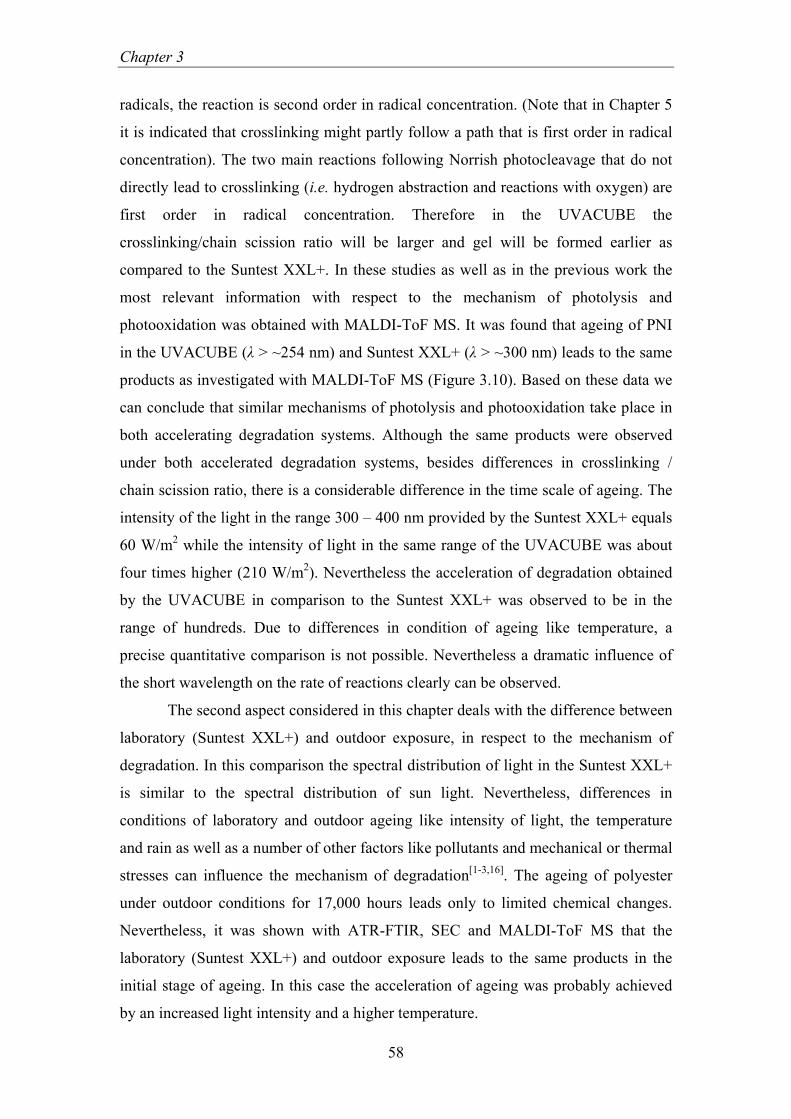
Chapter 3
58
radicals, the reaction is second order in radical concentration. (Note that in Chapter 5
it is indicated that crosslinking might partly follow a path that is first order in radical
concentration). The two main reactions following Norrish photocleavage that do not
directly lead to crosslinking (i.e. hydrogen abstraction and reactions with oxygen) are
first order in radical concentration. Therefore in the UVACUBE the
crosslinking/chain scission ratio will be larger and gel will be formed earlier as
compared to the Suntest XXL+. In these studies as well as in the previous work the
most relevant information with respect to the mechanism of photolysis and
photooxidation was obtained with MALDI-ToF MS. It was found that ageing of PNI
in the UVACUBE (λ > ~254 nm) and Suntest XXL+ (λ > ~300 nm) leads to the same
products as investigated with MALDI-ToF MS (Figure 3.10). Based on these data we
can conclude that similar mechanisms of photolysis and photooxidation take place in
both accelerating degradation systems. Although the same products were observed
under both accelerated degradation systems, besides differences in crosslinking /
chain scission ratio, there is a considerable difference in the time scale of ageing. The
intensity of the light in the range 300 – 400 nm provided by the Suntest XXL+ equals
60 W/m2 while the intensity of light in the same range of the UVACUBE was about
four times higher (210 W/m2). Nevertheless the acceleration of degradation obtained
by the UVACUBE in comparison to the Suntest XXL+ was observed to be in the
range of hundreds. Due to differences in condition of ageing like temperature, a
precise quantitative comparison is not possible. Nevertheless a dramatic influence of
the short wavelength on the rate of reactions clearly can be observed.
The second aspect considered in this chapter deals with the difference between
laboratory (Suntest XXL+) and outdoor exposure, in respect to the mechanism of
degradation. In this comparison the spectral distribution of light in the Suntest XXL+
is similar to the spectral distribution of sun light. Nevertheless, differences in
conditions of laboratory and outdoor ageing like intensity of light, the temperature
and rain as well as a number of other factors like pollutants and mechanical or thermal
stresses can influence the mechanism of degradation[1-3,16]. The ageing of polyester
under outdoor conditions for 17,000 hours leads only to limited chemical changes.
Nevertheless, it was shown with ATR-FTIR, SEC and MALDI-ToF MS that the
laboratory (Suntest XXL+) and outdoor exposure leads to the same products in the
initial stage of ageing. In this case the acceleration of ageing was probably achieved
by an increased light intensity and a higher temperature.

Photodegradation of PNI in laboratory and outdoor conditions
59
Finally, the ageing under all three degradation conditions (UVACUBE,
Suntest XXL+ and outdoor) was compared using MALDI-ToF MS. The identification
of the same products confirms similar mechanisms of degradation taking place in the
initial stage of ageing for all three cases.
The differences in speed of degradation are mainly determined by a
combination of spectral power distribution of the light source and the absorbance by
the polymer. Figure 3.13 shows the UV absorption of poly(neopentyl isophthalate)
while Figure 3.14 presents the spectral power distributions of light in the Suntest
XXL+, UVACUBE and collected outdoors. PNI absorbs UV light in the UVACUBE,
Suntest XXL+ and outdoors. However it is clear that in case of the UVACUBE the
UV absorption is much higher if compared with the Suntest XXL+ and natural sun
light. As a consequence, Norrish photocleavage and subsequent similar secondary
reactions can occur in each of the three methods of ageing. The presence of high
energy light in the range of 250 – 290 nm (which is strongly absorbed by PNI) in the
spectral distribution of the UVACUBE can explain the much higher rate of
photodegradation in the UVACUBE as compared to the Suntest XXL+ and outdoor
conditions.
As explained in Chapter 1, photodegradation is known to be a “surface effect”
which implies that usually products of photodegradation are concentrated in the top
layers of the polymer. The relationship between UV absorption of the polymer and the
spectral distribution of the light has a strong impact on the penetration depth of the
light and subsequently on the distribution of degradation products throughout the
coating. Based on the absorption coefficient of PNI it was calculated that the first 3
μm of the coating absorbs ~85% of the light in the range of 254 – 290 nm. This
strongly suggests that in case of ageing in the UVACUBE most of the products of the
photodegradation are probably located in the top 3 – 4 μm of the coating. On the
contrary, only ~5% of the light at 300 nm is absorbed by the first 3 μm of the coating.
This suggests that in the case of ageing in the Suntester XXL+ and outdoors products
of the photodegradation are not especially located in the top but also in deeper layers
of the PNI coating. The experimental data obtained with SEC of PNI aged in the
UVACUBE and Suntest XXL+ confirms this. However, it has to be reminded that in
this situation the oxygen diffusion can influence the distribution profile of
photooxidation products too.
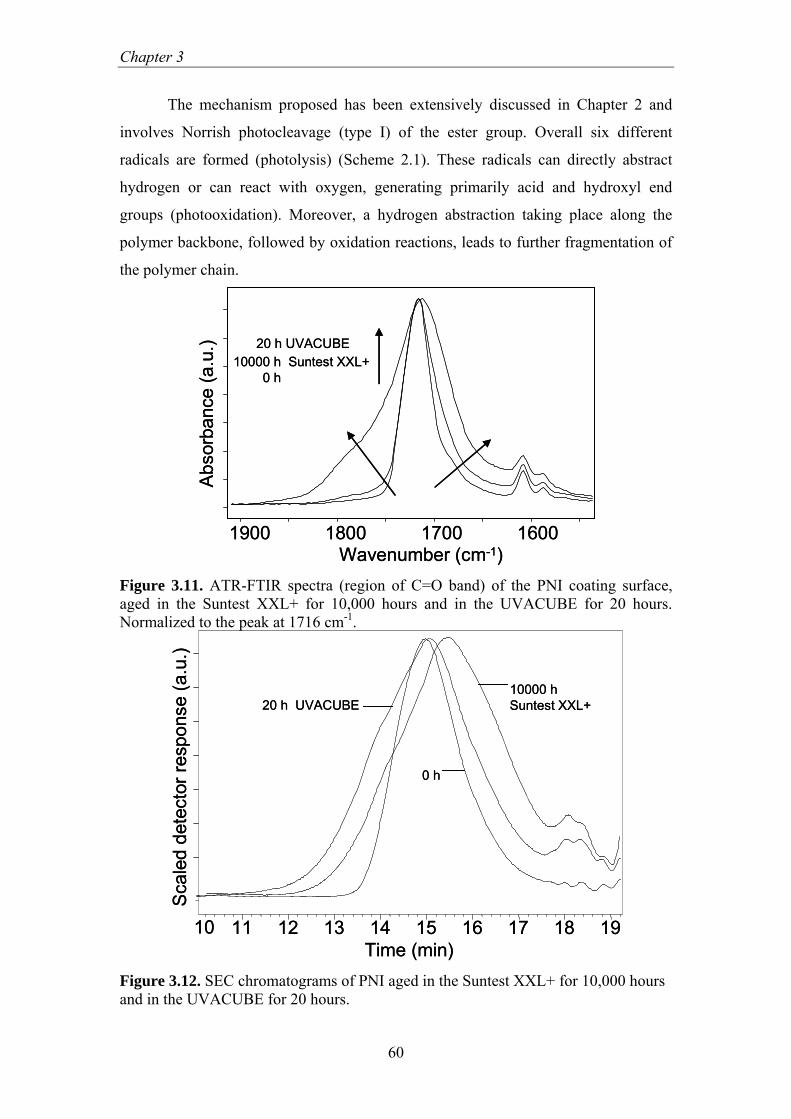
Chapter 3
60
The mechanism proposed has been extensively discussed in Chapter 2 and
involves Norrish photocleavage (type I) of the ester group. Overall six different
radicals are formed (photolysis) (Scheme 2.1). These radicals can directly abstract
hydrogen or can react with oxygen, generating primarily acid and hydroxyl end
groups (photooxidation). Moreover, a hydrogen abstraction taking place along the
polymer backbone, followed by oxidation reactions, leads to further fragmentation of
the polymer chain.
1900 1800 1700 1600Wavenumber (cm-1)
Abs
orba
nce
(a.u
.) 20 h UVACUBE 10000 h Suntest XXL+
0 h
1900 1800 1700 1600Wavenumber (cm-1)
Abs
orba
nce
(a.u
.) 20 h UVACUBE 10000 h Suntest XXL+
0 h
Figure 3.11. ATR-FTIR spectra (region of C=O band) of the PNI coating surface, aged in the Suntest XXL+ for 10,000 hours and in the UVACUBE for 20 hours. Normalized to the peak at 1716 cm-1.
0 h
10000 h Suntest XXL+ 20 h UVACUBE
Sca
led
dete
ctor
resp
onse
(a.u
.)
Time (min)10 11 12 13 14 15 16 17 18 19
0 h
10000 h Suntest XXL+ 20 h UVACUBE
Sca
led
dete
ctor
resp
onse
(a.u
.)
Time (min)10 11 12 13 14 15 16 17 18 19
Figure 3.12. SEC chromatograms of PNI aged in the Suntest XXL+ for 10,000 hours and in the UVACUBE for 20 hours.
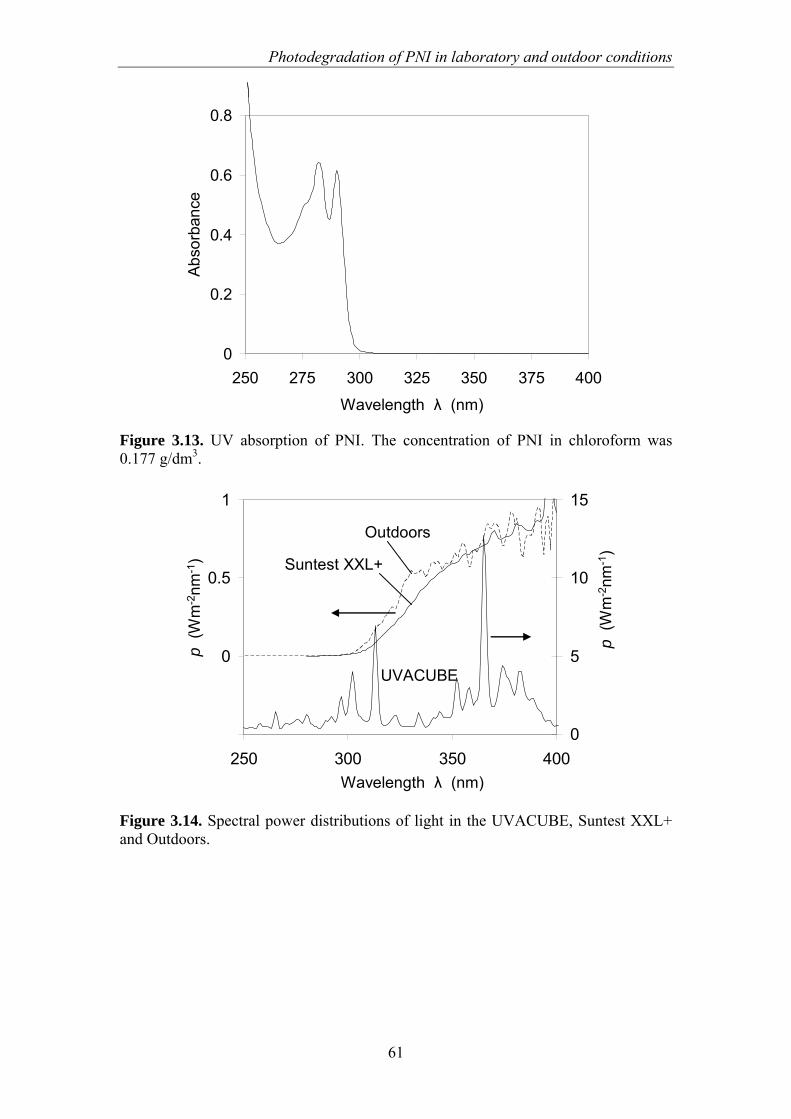
Photodegradation of PNI in laboratory and outdoor conditions
61
0
0.2
0.4
0.6
0.8
250 275 300 325 350 375 400waven
abso
rban
ce
Wavelength λ (nm)
Abs
orba
nce
0
0.2
0.4
0.6
0.8
250 275 300 325 350 375 400waven
abso
rban
ce
Wavelength λ (nm)
Abs
orba
nce
Figure 3.13. UV absorption of PNI. The concentration of PNI in chloroform was 0.177 g/dm3.
-0.5
0
0.5
1
250 300 350 400λ / nm
p /
Wm
-2nm
-1
0
5
10
15
p /
Wm
-2nm
-1
Suntest XXL+
UVACUBE
Wavelength λ (nm)
p(W
m-2
nm-1
)
p(W
m-2
nm-1
)
Outdoors
-0.5
0
0.5
1
250 300 350 400λ / nm
p /
Wm
-2nm
-1
0
5
10
15
p /
Wm
-2nm
-1
Suntest XXL+
UVACUBE
Wavelength λ (nm)
p(W
m-2
nm-1
)
p(W
m-2
nm-1
)
Outdoors
Figure 3.14. Spectral power distributions of light in the UVACUBE, Suntest XXL+ and Outdoors.
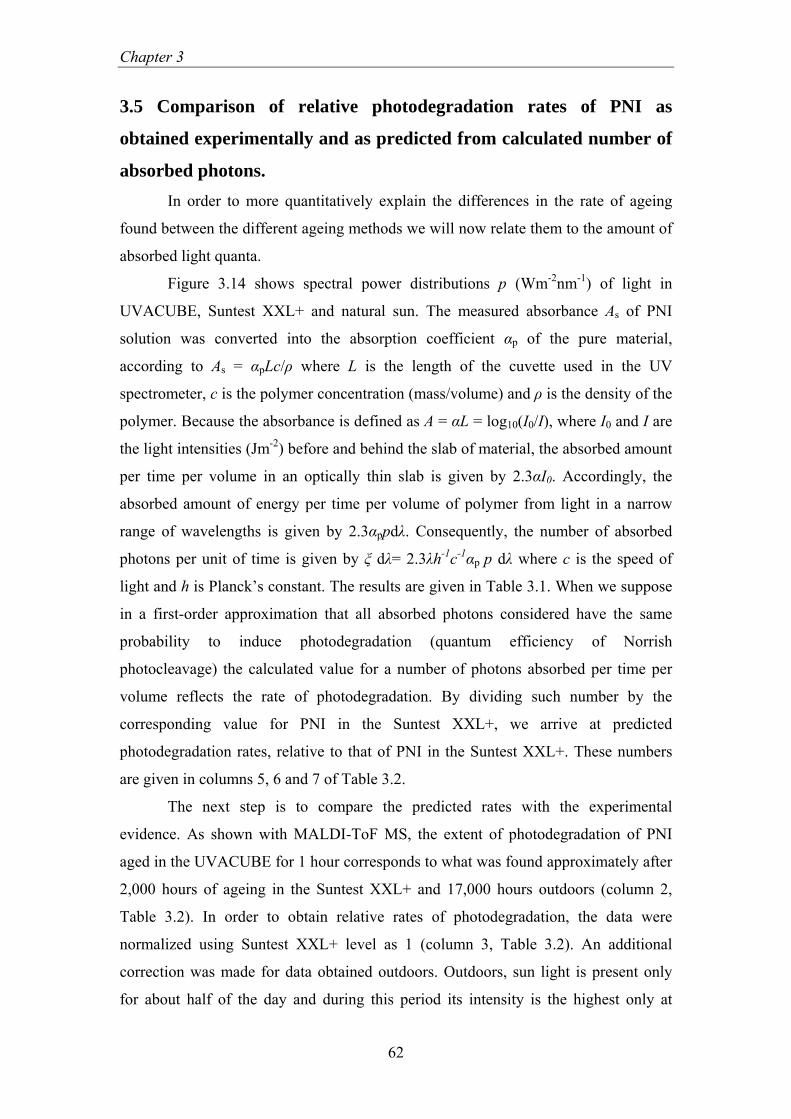
Chapter 3
62
3.5 Comparison of relative photodegradation rates of PNI as
obtained experimentally and as predicted from calculated number of
absorbed photons. In order to more quantitatively explain the differences in the rate of ageing
found between the different ageing methods we will now relate them to the amount of
absorbed light quanta.
Figure 3.14 shows spectral power distributions p (Wm-2nm-1) of light in
UVACUBE, Suntest XXL+ and natural sun. The measured absorbance As of PNI
solution was converted into the absorption coefficient αp of the pure material,
according to As = αpLc/ρ where L is the length of the cuvette used in the UV
spectrometer, c is the polymer concentration (mass/volume) and ρ is the density of the
polymer. Because the absorbance is defined as A = αL = log10(I0/I), where I0 and I are
the light intensities (Jm-2) before and behind the slab of material, the absorbed amount
per time per volume in an optically thin slab is given by 2.3αI0. Accordingly, the
absorbed amount of energy per time per volume of polymer from light in a narrow
range of wavelengths is given by 2.3αppdλ. Consequently, the number of absorbed
photons per unit of time is given by ξ dλ= 2.3λh-1c-1αp p dλ where c is the speed of
light and h is Planck’s constant. The results are given in Table 3.1. When we suppose
in a first-order approximation that all absorbed photons considered have the same
probability to induce photodegradation (quantum efficiency of Norrish
photocleavage) the calculated value for a number of photons absorbed per time per
volume reflects the rate of photodegradation. By dividing such number by the
corresponding value for PNI in the Suntest XXL+, we arrive at predicted
photodegradation rates, relative to that of PNI in the Suntest XXL+. These numbers
are given in columns 5, 6 and 7 of Table 3.2.
The next step is to compare the predicted rates with the experimental
evidence. As shown with MALDI-ToF MS, the extent of photodegradation of PNI
aged in the UVACUBE for 1 hour corresponds to what was found approximately after
2,000 hours of ageing in the Suntest XXL+ and 17,000 hours outdoors (column 2,
Table 3.2). In order to obtain relative rates of photodegradation, the data were
normalized using Suntest XXL+ level as 1 (column 3, Table 3.2). An additional
correction was made for data obtained outdoors. Outdoors, sun light is present only
for about half of the day and during this period its intensity is the highest only at

Photodegradation of PNI in laboratory and outdoor conditions
63
noon. In order to compare the data obtained outdoors with laboratory (UVACUBE,
Suntest XXL+) data (obtained from continuously irradiated samples) the hours of
outdoor exposure were multiplied by a factor of 4 (column 4, Table 3.2). Table 3.2
shows the comparison of relative photodegradation rates of PNI obtained
experimentally and predicted from the number of absorbed photons in three different
ageing methods (UVACUBE, Suntest XXL+ and outdoor). The comparison shown in
the Table 3.2 is based on a number of approximations and assumptions both on the
experimentally obtained results as well as on the predicted data. Nevertheless, overall
the experimental and predicted rates of photodegradation for three different
degradation methods seem to correlate well. This calculation shows that overall UV
stability may be predicted knowing some of the characteristics of the polymer (UV
absorption) and conditions of ageing (spectral power distribution of light used).
Table 3.1. Number of photons per second absorbed by PNI when exposed in the UVACUBE, Suntest XXL+ and Outdoors. Photodegradation Methods
λ < 325 λ < 350 λ < 400
Suntest XXL+ 4.53×10²¹ 9.57×10²¹ 1.33×10²² UVACUBE 2.69×1025 2.69×1025 2.69×1025 Outdoors 5.23×10²¹ 1.22×10²² 1.59×10²²
Table 3.2. Comparison of relative photodegradation rates of PNI obtained experimentally and predicted from calculated number of absorbed photons in three different ageing methods (UVACUBE, Suntest XXL+ and outdoor). For the calculations, spectral distributions of light in Suntest XXL+ and outdoors were taken starting at 295 nm and in UVACUBE at 254 nm up to 400 nm. Additionally the calculation was performed for λmax 325, 350, 400 nm.
Experimental Predicted relative rates of photodegrad.
Photodegradation Methods
Hours of ageing for
coresponding extent of
photodegrad.
Relative rates of
photodegrad.
Corrected relative rates
of photodegrad.
λ < 325 nm
λ < 350 nm
λ < 400 nm
Suntest XXL+ 2,000 1 1 1 1 1 UVACUBE 1 2,000 2,000 5,900 2,800 2,000 Outdoors 17,000 0.12 0.48 1.15 1.27 1.20
Chapter 3
64
3.6 Conclusions In this chapter, the molecular mechanism of the photolysis and photooxidation
of an non-crosslinked poly(neopentyl isophthalate) (PNI), applied as a thin coating
and aged under different conditions (UVACUBE: λ > ~254 nm, Suntest XXL+ λ >
~300 nm and outdoors) was studied. The main focus of this work was (1) on the
influence of wavelength and (2) on the differences between laboratory and outdoor
exposure with respect to the mechanism of degradation.
With respect to the influence of the wavelength on the mechanism, it was
found that photooxidation promotes the break-down of the polymer chain and the
generation of functional groups such as C=O and OH/OOH in the polymer structure,
as detected by ATR-FTIR. Similar changes in the ATR-FTIR spectra were observed
for ageing of PNI both in UVACUBE and in Suntest XXL+.
Size Exclusion Chromatography was performed to determine changes in the
size of molecules. Both an increase and a decrease of molecular weight were
observed, indicating that both photocrosslinking and chain scission are taking place
during photodegradation in UVACUBE and Suntest XXL+ exposure. However,
ageing in UVCUBE leads to higher crosslinking / chain scission ratio as compared to
Suntest XXL+.
MALDI-ToF MS revealed molecular structures of degradation products.
Despite the large differences in accelerated weathering conditions between
UVACUBE and Suntest XXL+, identical photolysis and photooxidation products of
PNI were identified. This strongly indicates that the molecular mechanism of
photolysis and photooxidation is quite similar.
These three independent analytical techniques proved that a common
mechanism is operative in the photodegradation of PNI in UVACUBE and Suntest
XXL+. Nevertheless due to the high absorption of short wavelength irradiation by
PNI, degradation takes place mainly at the surface. More importantly short
wavelength irradiation causes a dramatic speed-up of the photodegradation process.
Secondly, the influence of laboratory (Suntest XXL+) and outdoor exposure
on the mechanism of degradation was studied with ATR-FTIR, SEC and MALDI-ToF
MS. Ageing of PNI in Suntest XXL+ and outdoors resulted in the formation of similar
chemical structures in the initial stage of ageing as investigated with all three above
mentioned analytical techniques. The spectral power distribution of light provided by
Photodegradation of PNI in laboratory and outdoor conditions
65
Suntest XXL+ resembles the spectral distribution of natural sun light. The differences
in acceleration may be due to the higher temperature and intensity of light.
Comparison of relative photodegradation rates of PNI, obtained
experimentally and predicted from the calculated number of absorbed photons, for the
three different ageing methods (UVACUBE, Suntest XXL+ and outdoor) seem to
correlate well.
Chapter 3
66
References 1. Baljit S, Sharma N. Polym Degrad Stab 2008;93:561-584.
2. White JR, Turnbull AJ. J Mater Sci 1994;29:584-613.
3. Pospisil J, Nespurek S. Prog Polym Sci 2000;25:1261-1335.
4. Day M, Wiles DM. J Appl Polym Sci 1972;16:175-189.
5. Day M, Wiles DM. J Appl Polym Sci 1972;16:191-202.
6. Day M, Wiles DM. J Appl Polym Sci 1972;16:203-215.
7. Rivaton A, Gardette JL. Die Angewandte Makromolekulare Chemie
1998;261-262:173-188.
8. Rivaton A. Polym Degrad Stab 1993;41:283-296.
9. Rivaton A. Polym Degrad Stab 1993;41:297-310.
10. Maetens D. Prog Org Coat 2007;58:172-179.
11. Focus on Powder Coatings, 2005;1:5-6.
12. Carroccio S, Rizzarelli P, Puglisi C, Montaudo G. Macromolecules
2004;37:6576 6586.
13. Carroccio S, Rizzarelli P, Scaltro G, Puglisi C. Polymer 2008;49:3371-3381.
14. Diepens M, Gijsman P. Polym Degrad Stab 2007;92:397-406.
15. Staal BBP. Ph.D. Thesis. University of Technology Eidhoven, 2005, ISBN
90-386-2816-1, http://alexandria.tue.nl/extra2/200510293.pdf.
16. Sampers J. Polym Degrad Stab 2002;76:455-465.
4
Photodegradation of polyesters based on isophthalate
and terephthalate units
Summary In this chapter we describe the mechanism of photodegradation of polyesters
based on isophthalic and terephthalic units. Poly(neopentyl isophthalate) (PNI) and
poly(neopentyl terephthalate) (PNT) were aged in the Suntest XXL+ and the
mechanisms of degradation were studied with ATR-FTIR, SEC and MALDI-ToF MS.
All results confirm that PNI is much more UV stable than PNT. This can be explained
by the fact that the absorption spectrum of PNT has much more overlap with the
spectrum of the light source than PNI has. However, the nature of the
photodegradation with respect to the mechanism is not different; in both cases the
same type of products are formed.

Chapter 4
68
4.1 Introduction Aromatic polyesters are commonly used in the field of coating technology.
Overall good mechanical properties and low cost make them very attractive for
protection against corrosion and weathering as well as for decoration purposes.
Aromatic polyesters are prepared in polycondensation reactions of acids and glycols.
The chemical architectures of both the acid and the glycol unit determine the
mechanical properties of the polyester and the final coating. More interestingly, the
chemical architecture of monomers can also strongly influence the weathering
stability of aromatic polyesters. For instance, polyesters based on terephthalic acid
(TPA) before weathering show very good mechanical properties (flexibility) but poor
weathering stability. On the contrary, polyesters based on isophthalic acid (IPA)
exhibit poor mechanical properties before weathering but excellent weathering
stability. The superior performance of IPA based coatings under weathering was
attributed to the lower absorption of UV light as compared to polyesters based on
TPA[1,2]. Nevertheless, under the influence of UV light, these polymers undergo
degradation in outdoor conditions. As described in the literature, a Norrish
photocleavage of the aromatic ester group leads to chain break-down. Radicals, which
are formed in this cleavage reaction, can abstract hydrogen or undergo oxidation
processes[3-8]. Chemical changes taking place influence the physical properties and
finally lead to failure of the coating. Although coatings based on IPA exhibit very
good stability in outdoor conditions as compared to coatings based on TPA, further
improvement of the weathering stability of polyester coatings is still required. This
can only be achieved by a more detailed understanding of the molecular degradation
mechanisms.
Previous studies were mainly focused on the photodegradation of polyesters
based on the terephthalate (TPA) unit[4-8] and not much work was done, either on
polyesters based on IPA or on the comparison of IPA to TPA. The establishment of
degradation mechanisms as well as discovery of the cause of differences in durability
of both polyesters based on TPA and IPA isomers is essential for a further
improvement of the weathering stability of polyester coatings. The degradation
mechanisms of polymers are usually studied with spectroscopic techniques such as
FTIR and UV. Recently, there has been a growing interest in the application of
molecular analytical techniques like MALDI-ToF MS to study the mechanisms of

Photodegradation of polyesters based on isophthalate and terephthalate units
69
(thermal and photo) degradation[9,10]. This technique provides detailed structural
information on the degradation products, which allows establishing precise
mechanisms of the degradation.
In Chapters 2 and 3 we studied and established the mechanism of photolysis
and photooxidation of non-crosslinked poly(neopentyl isophthalate) (PNI) coatings
exposed in the UVACUBE (λ > ~254 nm), in the Suntest XXL+ (λ > ~300 nm) as
well as outdoors, using ATR-FTIR, SEC and MALDI-ToF MS.
In this chapter, we compare the mechanism of photodegradation of non-
crosslinked poly(neopentyl isophthalate) (PNI) and poly(neopentyl terephthalate)
(PNT) coatings, as exposed in the Suntest XXL+ (λ > ~300 nm) light using the same
experimental techniques
4.2 Experimental Materials
Model polyesters poly(neopentyl isophthalate) (PNI) and poly(neopentyl
terephthalate) provided by DSM were used in this study. The polyesters were
prepared by a bulk polycondensation with Titanium (IV) n-butoxide (Ti(OBu)4) as a
catalyst. Synthesis was performed with an excess of neopentyl glycol resulting in
hydroxyl functional polymers. The characteristics of PNI and PNT are presented in
Table 4.1 where OHV – hydroxyl value, AV – acid value, Mn – number average
molecular weight, Tg – glass transition temperature. These parameters were
determined according to procedures described in Chapter 2.
Table 4.1. Characteristics of PNI and PNT.
OHV (mg KOH/g)
AV (mg KOH/g)
Mn (g/mol) (based on titration)
Mn (g/mol) (based on
SEC)
Tg (°C)
PNI 16 1 6,600 9,650 58
PNT 13 7 5,600 3,850 53
Coating preparation
Polyester coatings were prepared according to the following procedure. First
polymers were dissolved in N-methyl-2-pyrrolidone (30 w/w %) and applied on
aluminium plates using a doctor blade driven by 509 MC Coatmaster applicator
(Erichsen GmbH). Coatings were dried at 120 ºC for one hour in an oven. The

Chapter 4
70
thickness of the resulting dry coating was approximately 12 μm, as measured with a
TWIN-CHECK Instrument (List-Magnetic GmbH).
Weathering conditions
Polyester coatings were aged using a Suntest XXL+ (ATLAS), equipped with
xenon lamps. The light emitted by the xenon lamps was filtered with daylight filters (λ
> ~300 nm). The intensity of light in the range of 300 – 400 nm was 60 W/m2. The
chamber temperature was 45 ºC while the temperature of the black standard was
70 ºC. The relative humidity was 25%.
Analytical methods
Attenuated Total Reflectance Fourier Transform Infrared Spectroscopy (ATR-
FTIR) was performed using a BioRad Excalibur FTS3000MX spectrometer equipped
with a diamond crystal (Golden Gate). Spectra of the surfaces of the PNI coatings
were recorded in the range of 4000 – 650 cm-1 with a resolution of 4 cm-1. For ATR-
FTIR spectroscopy a small piece was cut off the coated panel and pressed on the ATR
crystal. The BioRad Win-IR Pro software was used to process the data. Spectra in the
range of 2300 – 3700 cm-1 were normalized to the peak at 2967 cm-1 (CH3
antisymmetric stretching) and in the range of 1500 – 1900 cm-1 to the peak at 1716
cm-1 (C=O stretching).
Size exclusion chromatography (SEC) was carried out using a WATERS 2695
separation module and a Model 2414 refractive index detector at 40 °C. The injection
volume used was 50 µL. The column set consisted of a Polymer Laboratories PLgel
guard column (5 µm particles, 50 × 7.5 mm), followed by two PLgel mixed-C
columns (5 µm particles, 300 × 7.5 mm). The columns were calibrated at 40 °C using
polystyrene standards (Polymer Laboratories, M = 580 up to M = 7.1*106 g/mol) in
series. Tetrahydrofuran (Biosolve, stabilised with BHT) was used as eluent at a flow
rate of 1.0 ml/min. Prior to the SEC analysis, the polyester was removed from the
substrate and dissolved in THF (~ 5 mg/ml). In the case of aged polyester the
insoluble (crosslinked gel) part of the polymer was removed by filtration (0.2 µm
PTFE filter) and the soluble part was analyzed. Data acquisition and processing were
performed using WATERS Empower 2 software. Chromatograms were scaled to the
maximum peak height. Molecular weights were calculated from chromatograms up to
17.5 min of the elution time in case of PNI and up to 18.1 min in case of PNT.

Photodegradation of polyesters based on isophthalate and terephthalate units
71
Matrix assisted laser desorption ionization time of flight mass spectra
(MALDI-ToF MS) were recorded in reflector mode using a Voyager-DE STR
instrument. Trans-2-[3-(4-tert-Butylphenyl)-2-methyl-2-propenylidene] malononitrile
was used as a matrix. Samples were prepared by mixing matrix, potassium
trifluoroacetate and polymer sample in a volume ratio 4:1:4, with THF as a solvent.
Prior to the MALDI-ToF MS analysis, the polyester was removed from the substrate
and dissolved in THF. In the case of the aged polyester the insoluble (crosslinked gel)
part of the degradation was removed by filtration. The soluble part was analyzed.
UV spectroscopy was performed using an UV/VIS/NIR spectrometer Lambda
900 (Perkin Elmer). Spectra were collected in the range of 500 – 200 nm. For this
measurement PNI and PNT were dissolved in chloroform (0.177 g/dm3) and placed in
quartz cuvettes (1 cm).
The spectral power distribution of light in the Suntest XXL+ was measured
using an ultraviolet radiation spectroradiometer MSS 2040-UV.
Film thicknesses were measured with a TWIN-CHECK Instrument (List-
Magnetic GmbH).
4.3 Results 4.3.1 ATR-FTIR analysis
ATR-FTIR spectroscopy was used to observe the formation of functional
groups at the polymer surface during UV exposure. Figures 4.1 and 4.2 show changes
in the carbonyl and hydroxyl regions of PNI exposed for up to 10,000 hours. The
changes in the carbonyl and hydroxyl regions of PNT aged for up to 6,000 hours are
presented in Figures 4.3 and 4.4. Ageing both of PNI and of PNT leads to changes in
the ATR-FTIR spectra. New carbonyl groups (1850 – 1600 cm-1) formed during UV
exposure can be attributed to anhydrides, carboxylic acids and aldehydes. The new
hydroxyl groups (3600 – 2400 cm-1) probably originate from carboxylic acid
(mentioned above), alcohol and hydroperoxide[11].
Although ageing of PNI and PNT both lead to changes in the ATR-FTIR
spectra, at similar wavenumbers, there is considerable difference in the kinetics of
ageing. The changes in the ATR-FTIR spectra of PNI aged for 10,000 hours
correspond to changes in PNT spectra recorded after about 1,000 hours of ageing.
This confirms the empirically known much better UV stability of PNI over PNT.
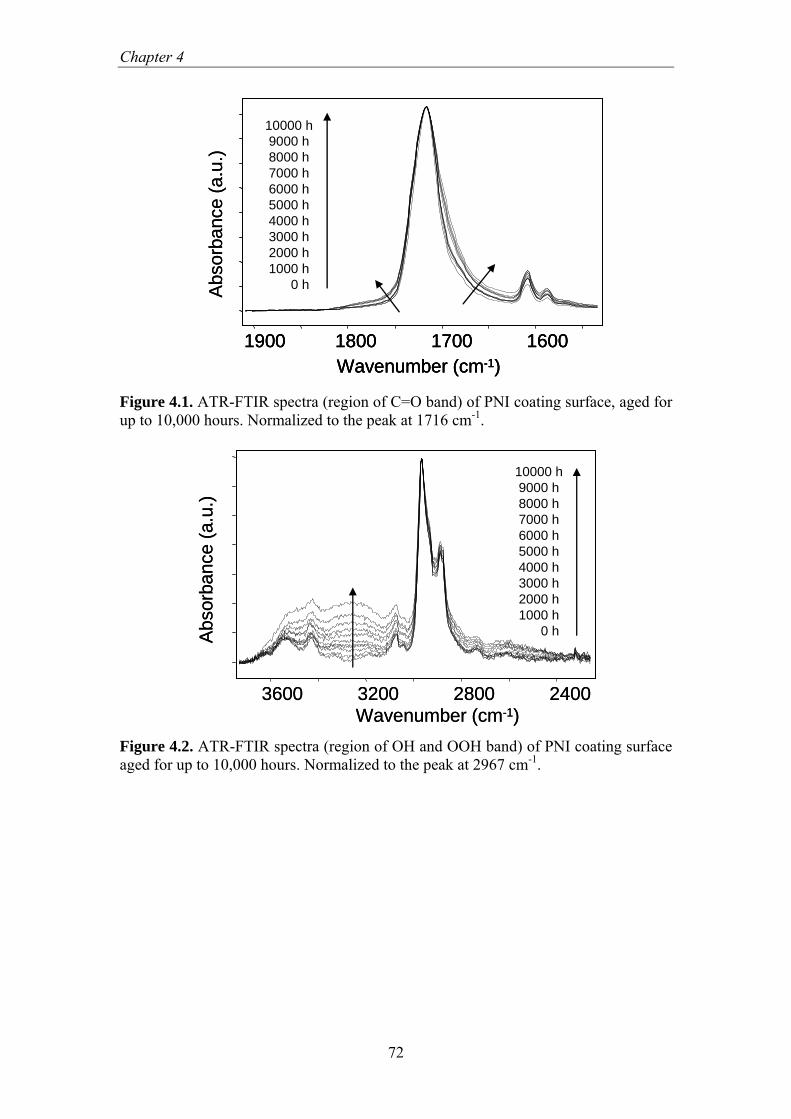
Chapter 4
72
Abs
orba
nce
(a.u
.)
Wavenumber (cm-1)1900 1800 1700 1600
10000 h9000 h8000 h7000 h6000 h5000 h4000 h3000 h2000 h1000 h
0 hAbs
orba
nce
(a.u
.)
Wavenumber (cm-1)1900 1800 1700 1600
10000 h9000 h8000 h7000 h6000 h5000 h4000 h3000 h2000 h1000 h
0 h
Wavenumber (cm-1)1900 1800 1700 1600
10000 h9000 h8000 h7000 h6000 h5000 h4000 h3000 h2000 h1000 h
0 h
Figure 4.1. ATR-FTIR spectra (region of C=O band) of PNI coating surface, aged for up to 10,000 hours. Normalized to the peak at 1716 cm-1.
3600 3200 2800 2400Wavenumber (cm-1)
Abs
orba
nce
(a.u
.)
10000 h9000 h8000 h7000 h6000 h5000 h4000 h3000 h2000 h1000 h
0 h
3600 3200 2800 2400Wavenumber (cm-1)
Abs
orba
nce
(a.u
.)
10000 h9000 h8000 h7000 h6000 h5000 h4000 h3000 h2000 h1000 h
0 h
Figure 4.2. ATR-FTIR spectra (region of OH and OOH band) of PNI coating surface aged for up to 10,000 hours. Normalized to the peak at 2967 cm-1.
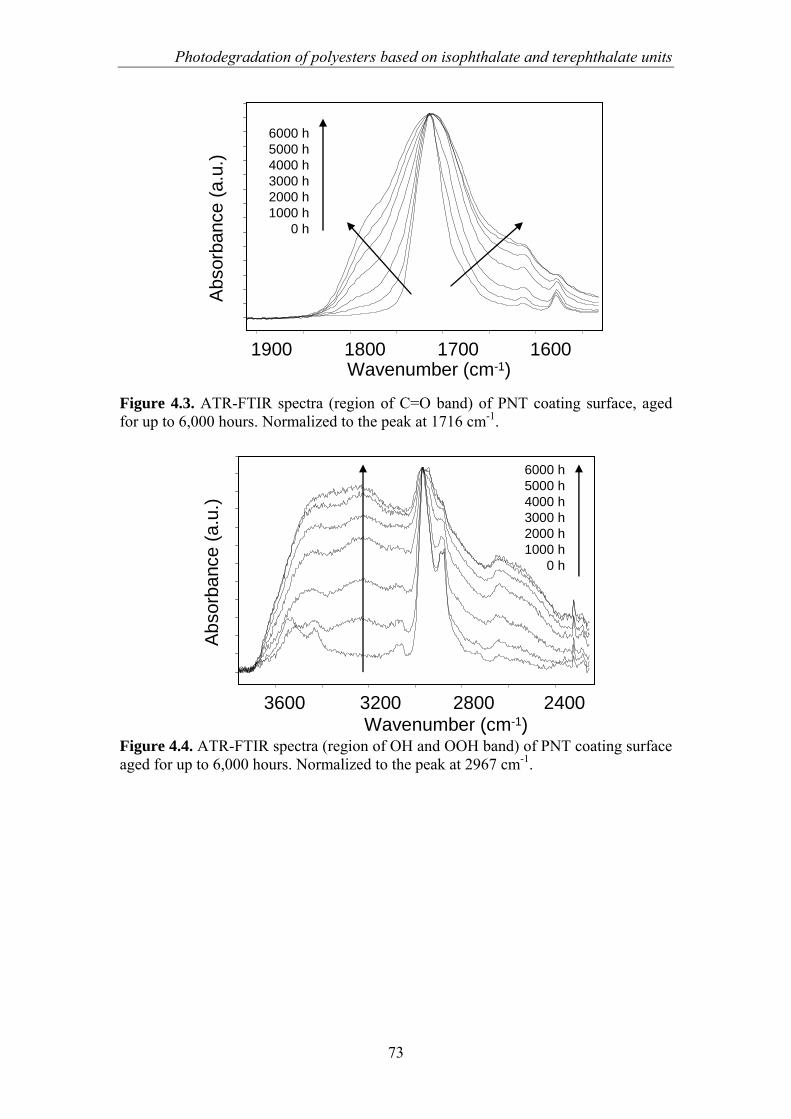
Photodegradation of polyesters based on isophthalate and terephthalate units
73
1900 1800 1700 1600Wavenumber (cm-1)
Abs
orba
nce
(a.u
.)
6000 h5000 h4000 h3000 h2000 h1000 h
0 h
1900 1800 1700 1600Wavenumber (cm-1)
Abs
orba
nce
(a.u
.)
6000 h5000 h4000 h3000 h2000 h1000 h
0 h
Figure 4.3. ATR-FTIR spectra (region of C=O band) of PNT coating surface, aged for up to 6,000 hours. Normalized to the peak at 1716 cm-1.
3600 3200 2800 2400Wavenumber (cm-1)
6000 h5000 h4000 h3000 h2000 h1000 h
0 h
Abs
orba
nce
(a.u
.)
3600 3200 2800 2400Wavenumber (cm-1)
6000 h5000 h4000 h3000 h2000 h1000 h
0 h
Abs
orba
nce
(a.u
.)
Figure 4.4. ATR-FTIR spectra (region of OH and OOH band) of PNT coating surface aged for up to 6,000 hours. Normalized to the peak at 2967 cm-1.

Chapter 4
74
4.3.2 SEC analysis
The changes in molecular weight of PNI and PNT as caused by UV exposure
were determined using Size Exclusion Chromatography. Figures 4.5 and 4.6 show the
SEC chromatograms and molecular weight distribution (MWD) plots of PNI aged for
up to 10,000 hours. As can be seen from Figures 4.5 and 4.6, both products with
higher and lower molecular weight are formed during ageing. UV exposure leads to a
chain scission of PNI, resulting in a decrease of the number average molecular weight
(Mn) and a reduction of Mp (the position of the maximum of the MWD in Figure 4.6)
with exposure time as can be seen in Table 4.2. At the same time an increase of the
weight average molecular weight (Mw) is observed (Table 4.2). Some of the radicals
formed during photodegradation can recombine and form crosslinked molecules. In
the first stage of this process crosslinked molecules but still soluble (sol) are formed.
Extensive crosslinking results in gel (insoluble material) formation. The gel formation
was observed in samples aged for 9,000 hours and more. Part of the crosslinked
molecules, which were fully detected by SEC before that moment, have become
insoluble and thus were removed in the filtration step. This can explain the reduction
of Mw for samples aged 9,000 hours and longer. Both processes, chain scission and
crosslinking, contribute to the increase of the polydispersity index (PDI) expressed as
Mw/ Mn ratio, shown in Table 4.2.
Figure 4.7 shows chromatograms and Figure 4.8 MWD plots of PNT aged for
up to 1,000 hours. The ageing of PNT also leads to simultaneous chain scission and
crosslinking. This is supported by the data on molecular weight (Table 4.3) in analogy
to what was discussed for PNI. However, in this case much shorter UV exposure is
needed for significant changes in molecular weight. Whereas with PNI, both Mn and
Mp steadily decreased with ageing time, with PNT these parameters initially (250
hours) slightly increased and later decreased with exposure time (Table 4.3). UV
exposure of PNT for 500 hours resulted in further crosslinking and chain scission.
Until that moment a gradual increase of Mw (Table 4.3) was observed. Ageing of PNT
leads to gel formation as well, which was found already after ageing for 750 hours
and more. As with PNI, the insoluble fraction was removed in the filtration step and
reduction of Mw was observed. As chain scission proceeds Mn and Mp decrease and
chromatograms are shifted towards lower molecular weight values.
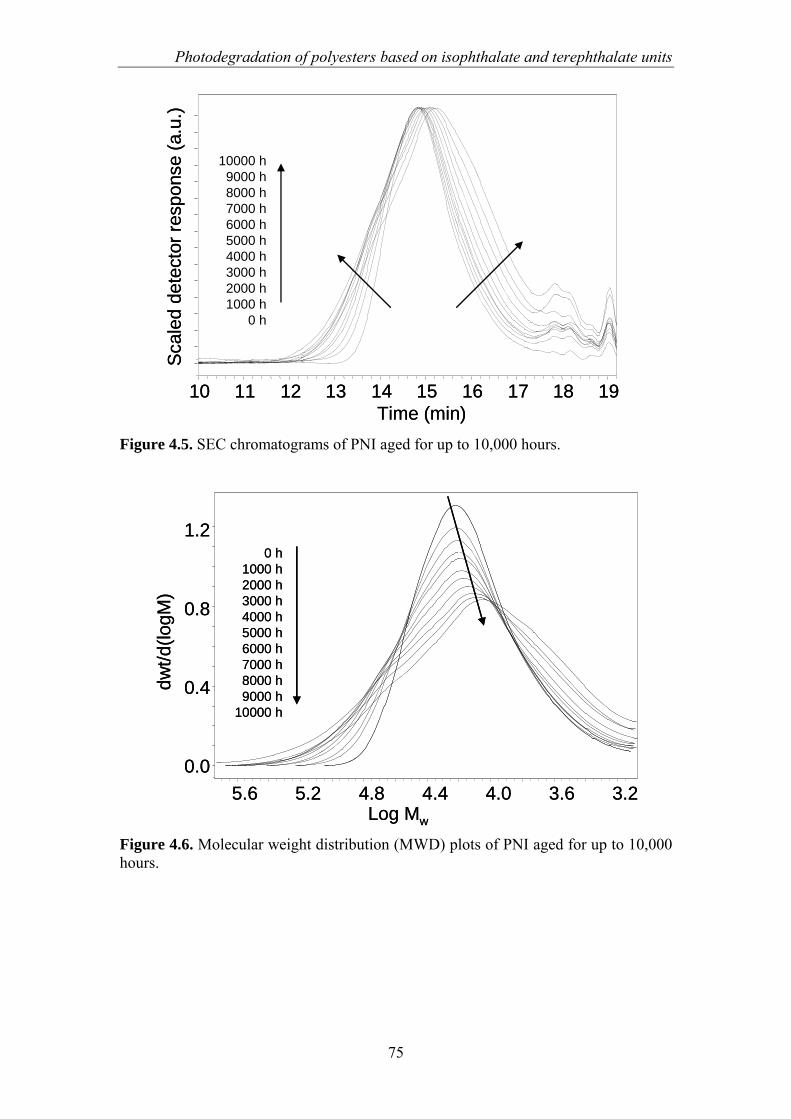
Photodegradation of polyesters based on isophthalate and terephthalate units
75
Sca
led
dete
ctor
resp
onse
(a.u
.)
Time (min)10 11 12 13 14 15 16 17 18 19
10000 h9000 h8000 h7000 h6000 h5000 h4000 h3000 h2000 h1000 h
0 h
Sca
led
dete
ctor
resp
onse
(a.u
.)
Time (min)10 11 12 13 14 15 16 17 18 19
10000 h9000 h8000 h7000 h6000 h5000 h4000 h3000 h2000 h1000 h
0 h
Figure 4.5. SEC chromatograms of PNI aged for up to 10,000 hours.
dwt/d
(logM
)
0.0
0.4
0.8
1.2
Log Mw
3.23.64.04.44.85.25.6
0 h1000 h2000 h3000 h4000 h5000 h6000 h7000 h8000 h9000 h
10000 h
dwt/d
(logM
)
0.0
0.4
0.8
1.2
Log Mw
3.23.64.04.44.85.25.6
0 h1000 h2000 h3000 h4000 h5000 h6000 h7000 h8000 h9000 h
10000 h
Figure 4.6. Molecular weight distribution (MWD) plots of PNI aged for up to 10,000 hours.

Chapter 4
76
Table 4.2. Changes in Mn, Mw, Mp and PDI of PNI aged for up to 10,000 hours.
Time of ageing
(103 hours)
Mn (g/mol)
Mw (g/mol)
M p (g/mol)
PDI
0 9,650 17,310 16,670 1.8 1 9,640 19,080 16,600 2.0 2 9,400 19,660 16,250 2.1 3 9,480 21,340 15,980 2.2 4 9,430 22,070 15,560 2.3 5 9,090 23,290 15,240 2.6 6 8,850 24,110 14,840 2.7 7 8,130 23,390 13,880 2.9 8 7,910 25,630 13,130 3.2 9 7,310 22,660 12,240 3.1 10 6,500 20,380 11,150 3.1
Sca
led
dete
ctor
resp
onse
(a.u
.)
Time (min)12 13 14 15 16 17 18 19
1000 h750 h500 h250 h
0 h
Sca
led
dete
ctor
resp
onse
(a.u
.)
Time (min)12 13 14 15 16 17 18 19
1000 h750 h500 h250 h
0 h
Figure 4.7. SEC chromatograms of PNT aged for up to 1,000 hours.

Photodegradation of polyesters based on isophthalate and terephthalate units
77
dwt/d
(logM
)
0.0
0.2
0.4
0.6
0.8
1.0
1.2
Log Mw
2.83.23.64.04.44.8
0 h250 h
500 h
1000 h
750 hdwt/d
(logM
)
0.0
0.2
0.4
0.6
0.8
1.0
1.2
Log Mw
2.83.23.64.04.44.8
0 h250 h
500 h
1000 h
750 h
Figure 4.8. Molecular weight distribution (MWD) plots of PNT aged for up to 1,000 hours. Table 4.3. Changes in Mn, Mw, Mp and PDI of PNT aged for up to 1,000 hours.
Time of ageing ( hours)
Mn (g/mol)
Mw (g/mol)
M p (g/mol)
PDI
0 3,850 6,710 6,510 1.7 250 4,050 8,300 6,940 2.0 500 3,800 9,400 6,210 2.5 750 3,200 7,550 4,830 2.4
1,000 2,500 5,050 3,490 2.0
4.3.3 Thickness loss
Thicknesses of coatings were measured as a function of exposure time. Ageing
of PNT coatings leads to a gradual loss of thickness. Every 1,000 hours of UV
exposure, the thickness was reduced by about 1 µm. The initial thickness of coatings
was 12 µm, so the thickness of a PNT coating after 6,000 hours of ageing has reduced
to approximately 50%. This is a strong indication that extensive photodegradation is
taking place, implying material loss via evaporation of small molecules (CO2, CO,
CH2O etc.). Contrary to what was found with PNT, the ageing of PNI for 10,000
hours did not result in any significant reduction of thickness.

Chapter 4
78
4.3.4 MALDI-ToF MS analysis
MALDI-ToF MS was used to obtain structural information on the products of
photolysis and photooxidation of PNI and PNT. Each polymer molecule discussed in
this paper consists of a sequence of repeating units terminated with various end
groups. The repeating units of PNI and PNT are built up from the same neopentyl
glycol (NPG) and different phthalic acid isomers: isophthalic (IPA) and terephthalic
(TPA) acids. Due to this fact particular oligomers of PNI and PNT with the same end
groups will have exactly the same mass. All identified oligomers are described and
listed in Table 2.1 of Chapter 2. Structures are described with numbers and small
letters, e.g. 1a, which refer to Table 2.1. Due to the above mentioned fact, Table 2.1 in
Chapter 2 lists only structures based on IPA.
Any molecular species with a given atomic composition is represented by
“isotopic distribution” in the MALDI-ToF MS spectrum. One of the problems
associated with the analysis of MALDI-ToF MS data is the “isotope overlap”. The
presence of two or more molecules with a small difference in mass (2 – 4 Daltons)
results in overlapping of isotope distributions. As a consequence, one clustered
isotopic distribution can represent two or more molecular structures. This
phenomenon complicates the identification of products. In Chapter 2, we have
successfully applied in-house-developed software[12,13] to overcome this problem.
That program calculates the isotopic distributions for given (expected) chemical
structures and compares them with the experimental data.
Figure 4.9 shows one repeating unit of the MALDI-ToF-MS spectra of PNI,
non-aged (A), aged for 2,000 hours (B), 4,000 hours (C), 6,000 hours (D), 8,000 hours
(E) and 10,000 hours (F). The main structure of the non-aged PNI (Figure 4.9A) is a
sequence of repeating units terminated with neopentyl glycol (Structure 1a). In
addition, structures 1b, 6, 8a and 8b were identified. These are presumably species
inherent in polycondensation reactions (cyclic oligomers: 8b) or species being formed
during polycondensation as a result of thermal or thermo-oxidative degradation
reactions. Ageing for 2,000 hours (Figure 4.9B) results in the formation of other
structures. Further ageing leads to a further increase of those structures and also to the
formation of many new products (Figures 4.9C – F). Overall, 15 (clustered) isotopic
distributions were found representing 28 molecules (Table 2.1). The same isotopic
distributions were found when analyzing other repeating units, from 1,000 m/z up to
7,000 m/z.
Photodegradation of polyesters based on isophthalate and terephthalate units
79
Figure 4.10 shows one repeating unit of the MALDI-ToF MS spectra of PNT,
non-aged (A), aged for 250 hours (B), 500 hours (C) and 750 hours (D). The main
structure of the non-aged PNT (Figure 4.10A) is a sequence of repeating units
terminated with neopentyl glycol (Structure 1a). In addition oligomers terminated on
one side with neopentyl glycol and on the other side with terephthalic acid (Structures
7a and 4c) were identified. Ageing of PNT for up to 750 hours (Figures 4.10B – D)
resulted in the appearance of many other structures.
MALDI-ToF MS revealed the molecular structures of degradation products. It
has to be noted that, as described above, the chemical compositions of non-aged PNI
and PNT are slightly different. This results in differences in the MALDI-ToF MS
spectra of virgin polyesters. Nevertheless, UV exposure of PNI and PNT resulted in
formation of the same isotopic distributions as can be seen from comparison of Figure
4.9F and 4.10D. Although MALDI-ToF MS is not a quantitative technique, it can
clearly be seen that similar changes in MALDI spectra were observed after ageing of
PNI for 10,000 hours and after ageing of PNT for only 750 hours.
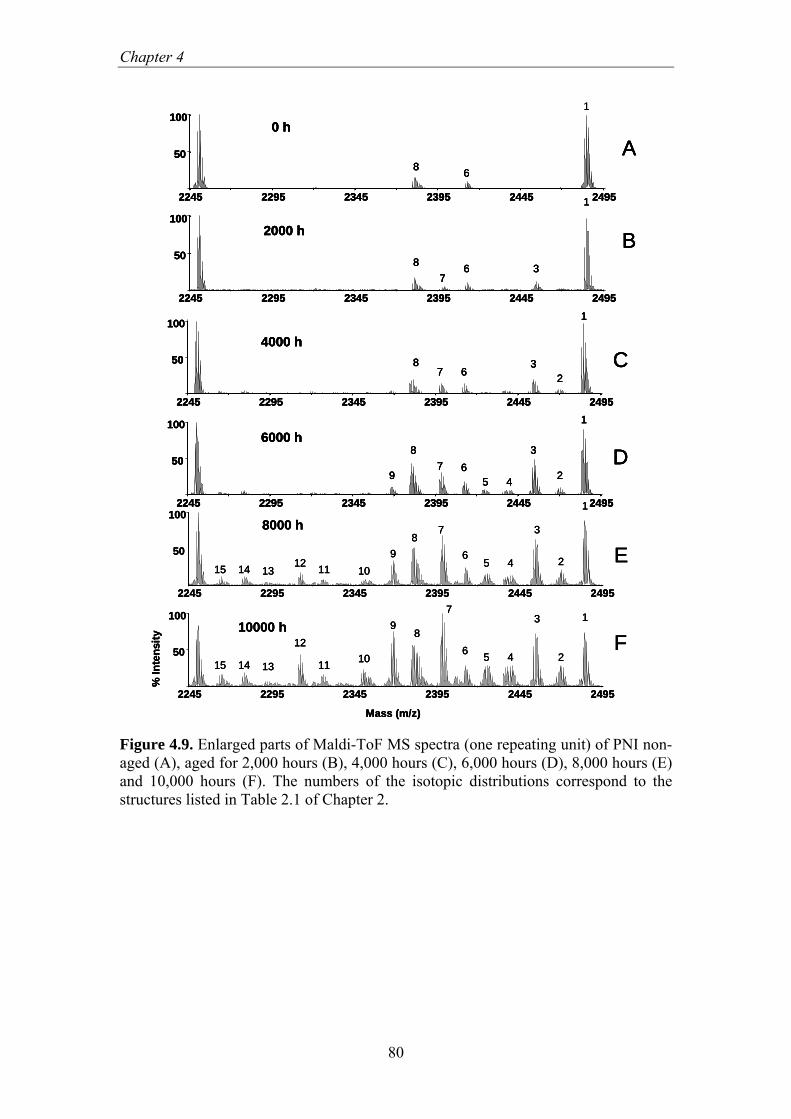
Chapter 4
80
1
2245 2295 2345 2395 2445 2495
50
100
2245 2295 2345 2395 2445 2495
50
100
68
68 3
0 h
2000 h
7
A
B
2245 2295 2345 2395 2445 2495
50
100
2245 2295 2345 2395 2445 2495
50
1001
68
1
68 3
4000 h
6000 h
7
7
32
2459
C
D
1
68
1
68
3
8000 h
10000 h
7
7
3
2
245
9
2245 2295 2345 2395 2445 2495
50
100
2245 2295 2345 2395 2445 2495
50
100
45
1015
12
111314
91015 12 111314
E
F
Mass (m/z)
% In
tens
ity
1
1
2245 2295 2345 2395 2445 2495
50
100
2245 2295 2345 2395 2445 2495
50
100
68
68 3
0 h
2000 h
7
A
B
2245 2295 2345 2395 2445 2495
50
100
2245 2295 2345 2395 2445 2495
50
1001
68
1
68 3
4000 h
6000 h
7
7
32
2459
C
D
1
68
1
68
3
8000 h
10000 h
7
7
3
2
245
9
2245 2295 2345 2395 2445 2495
50
100
2245 2295 2345 2395 2445 2495
50
100
45
1015
12
111314
91015 12 111314
E
F
Mass (m/z)
% In
tens
ity
1
2245 2295 2345 2395 2445 2495
50
100
2245 2295 2345 2395 2445 2495
50
100
68
68 3
0 h
2000 h
7
A
B
1
2245 2295 2345 2395 2445 2495
50
100
2245 2295 2345 2395 2445 2495
50
100
68
68 3
0 h
2000 h
7
A
B
2245 2295 2345 2395 2445 2495
50
100
2245 2295 2345 2395 2445 2495
50
1001
68
1
68 3
4000 h
6000 h
7
7
32
2459
C
D
2245 2295 2345 2395 2445 2495
50
100
2245 2295 2345 2395 2445 2495
50
1001
68
1
68 3
4000 h
6000 h
7
7
32
2459
C
D
1
68
1
68
3
8000 h
10000 h
7
7
3
2
245
9
2245 2295 2345 2395 2445 2495
50
100
2245 2295 2345 2395 2445 2495
50
100
45
1015
12
111314
91015 12 111314
E
F
Mass (m/z)
% In
tens
ity
1
Figure 4.9. Enlarged parts of Maldi-ToF MS spectra (one repeating unit) of PNI non-aged (A), aged for 2,000 hours (B), 4,000 hours (C), 6,000 hours (D), 8,000 hours (E) and 10,000 hours (F). The numbers of the isotopic distributions correspond to the structures listed in Table 2.1 of Chapter 2.

Photodegradation of polyesters based on isophthalate and terephthalate units
81
2245 2295 2345 2395 2445 2495
50
100
2245 2295 2345 2395 2445 2495
50
100 1
1
4c7 A
B4c
723
PNT 0 h
PNT 250 h
2245 2295 2345 2395 2445 2495Mass (m/z)
50
100
% In
tens
ity
2245 2295 2345 2395 2445 2495
50
100 1
68
73
24
591015 12 1113
14
C
1
68
7
32
45
910
15 121113
14 D
PNT 500 h
PNT 750 h
2245 2295 2345 2395 2445 2495
50
100
2245 2295 2345 2395 2445 2495
50
100 1
1
4c7 A
B4c
723
2245 2295 2345 2395 2445 2495
50
100
2245 2295 2345 2395 2445 2495
50
100 1
1
4c7 A
B4c
723
PNT 0 h
PNT 250 h
2245 2295 2345 2395 2445 2495Mass (m/z)
50
100
% In
tens
ity
2245 2295 2345 2395 2445 2495
50
100 1
68
73
24
591015 12 1113
14
C
1
68
7
32
45
910
15 121113
14 D
PNT 500 h
PNT 750 h
Figure 4.10. Enlarged parts of Maldi-ToF MS spectra (one repeating unit) of PNT non-aged (A), aged for 250 hours (B), 500 hours (C), 750 hours (D).The numbers of the isotopic distributions correspond to the structures listed in Table 2.1 of Chapter 2.
4.4 Mechanism of the photolysis and photooxidation of PNI and PNT As described in Chapter 2, under the influence of UV irradiation, the aromatic
ester group can undergo Norrish type I photocleavage. The ester group can be cleaved
at three different positions (Scheme 2.1, case: A, B, C). As a consequence six
different primary radicals can be formed. These radicals can undergo several reactions
like rearrangements, hydrogen abstraction, oxidation and termination.
Due to Norrish type I photocleavage of the ester group described as case A in
Schemes 2.1 and 2.2, an alkoxy radical A-1 and an acyl radical A-2 are formed. The
alkoxy radical A-1 can be rearranged by formaldehyde elimination to the tertiary
alkyl radical A-3 (–•C<). Hydrogen abstraction by this alkyl radical leads to the
formation of an isobutyl end group (Structures 3a, 4a, 4b, 5b, 5c and 9a).
Alternatively the tertiary alkyl radical A-3 can disproportionate to an isobutene end
group (Structures 3b, 5c and 9b). The presence of isobutyl and isobutene end groups
was indicated by MALDI spectra after UV irradiation of PNI for 2,000 hours (Figure
4.9B) and of PNT for 250 hours (Figure 4.10B). This strongly suggests that both for
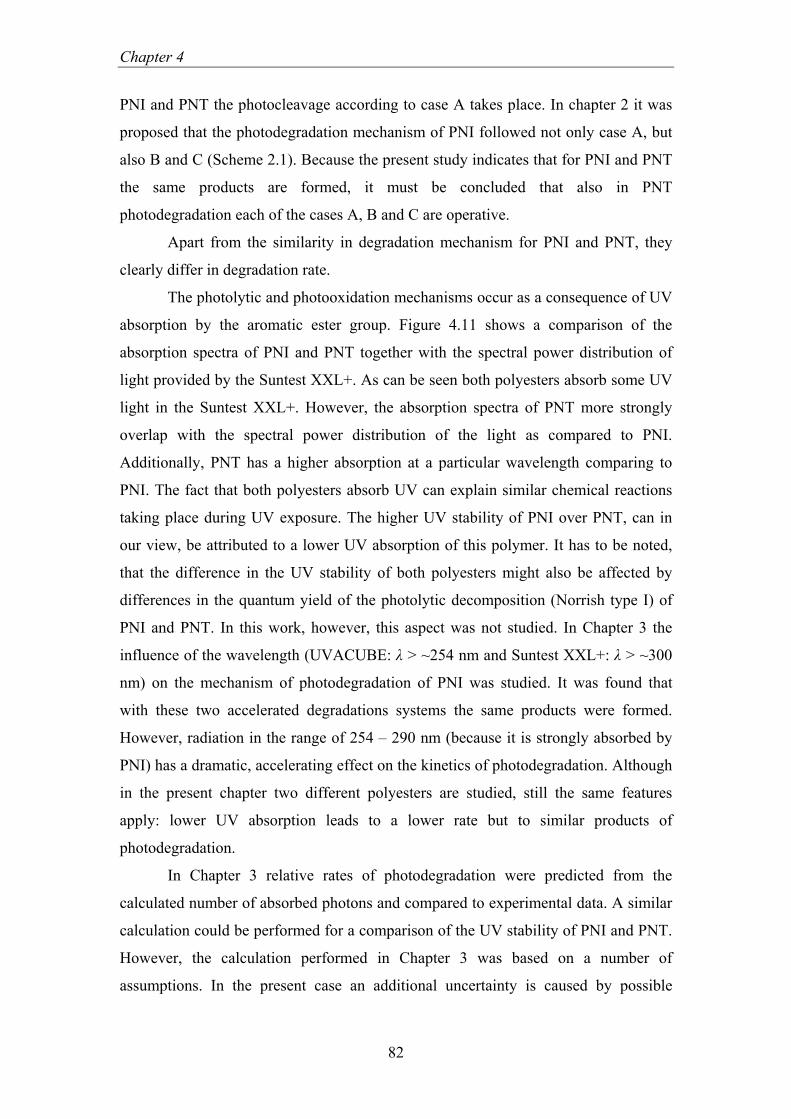
Chapter 4
82
PNI and PNT the photocleavage according to case A takes place. In chapter 2 it was
proposed that the photodegradation mechanism of PNI followed not only case A, but
also B and C (Scheme 2.1). Because the present study indicates that for PNI and PNT
the same products are formed, it must be concluded that also in PNT
photodegradation each of the cases A, B and C are operative.
Apart from the similarity in degradation mechanism for PNI and PNT, they
clearly differ in degradation rate.
The photolytic and photooxidation mechanisms occur as a consequence of UV
absorption by the aromatic ester group. Figure 4.11 shows a comparison of the
absorption spectra of PNI and PNT together with the spectral power distribution of
light provided by the Suntest XXL+. As can be seen both polyesters absorb some UV
light in the Suntest XXL+. However, the absorption spectra of PNT more strongly
overlap with the spectral power distribution of the light as compared to PNI.
Additionally, PNT has a higher absorption at a particular wavelength comparing to
PNI. The fact that both polyesters absorb UV can explain similar chemical reactions
taking place during UV exposure. The higher UV stability of PNI over PNT, can in
our view, be attributed to a lower UV absorption of this polymer. It has to be noted,
that the difference in the UV stability of both polyesters might also be affected by
differences in the quantum yield of the photolytic decomposition (Norrish type I) of
PNI and PNT. In this work, however, this aspect was not studied. In Chapter 3 the
influence of the wavelength (UVACUBE: λ > ~254 nm and Suntest XXL+: λ > ~300
nm) on the mechanism of photodegradation of PNI was studied. It was found that
with these two accelerated degradations systems the same products were formed.
However, radiation in the range of 254 – 290 nm (because it is strongly absorbed by
PNI) has a dramatic, accelerating effect on the kinetics of photodegradation. Although
in the present chapter two different polyesters are studied, still the same features
apply: lower UV absorption leads to a lower rate but to similar products of
photodegradation.
In Chapter 3 relative rates of photodegradation were predicted from the
calculated number of absorbed photons and compared to experimental data. A similar
calculation could be performed for a comparison of the UV stability of PNI and PNT.
However, the calculation performed in Chapter 3 was based on a number of
assumptions. In the present case an additional uncertainty is caused by possible

Photodegradation of polyesters based on isophthalate and terephthalate units
83
differences in the quantum yield of photolytic decomposition (Norrish type I) between
PNI and PNT. In view of mentioned facts the calculation was not performed.
The combined effect of the absorption spectrum of the polymer and the
spectral distribution of light determines the depth penetration of the light, and
consequently the distribution of the degradation products through the cross-section of
the coating (surface effect). The spectral power distribution of light provided by
Suntest XXL+ begins at about 300 nm. Based on the absorption coefficient it was
calculated that the first 3 μm of the PNT coating absorbs ~95% of the light at 300 nm.
This suggests that most of the degradation products are probably concentrated in the
surface of PNT coating. Note that PNT also absorbs at 310 nm. In this case only
~15% of light is absorbed in the first 3 μm of the coating. Although light at 310 nm
has a lower energy that light at 300 nm, it probably can cause degradation in the
deeper layers of coating as well. In case of PNI, about 5% of light is absorbed at 300
nm in the first 3 μm of the coating. This suggests that in case of PNI the products of
degradation are not especially located in the surface but also in the deeper layers.
Based on the experimental data obtained (SEC, ATR-FTIR) there is no clear evidence
of differences in surface effect between PNI and PNT. This effect might be not clearly
visible in this case due to small thickness of coating (12 µm). Additionally, due to
differences in molecular weight of polyesters, a precise comparison is not possible. As
already mentioned, in the previous chapter the influence of wavelength (UVACUBE:
λ > ~254 nm and Suntest XXL+: λ > ~300 nm) on the photodegradation of PNI was
studied. In that investigation, an indication of a different distribution of degradation
products throughout the thickness of PNI coating aged in the UVACUBE and Suntest
XXL+ was observed. However, in that case there was a significant difference in the
spectral power distribution of light provided by UVACUBE (λ > ~254 nm) and
Suntest XXL+ (λ > ~300) in relation to the absorption spectrum of PNI. PNI shows
strong UV absorption in the range of 254 – 290 nm and only limited above 300 nm.
This resulted in a higher concentration of products in the top layers of coatings aged
in the UVACUBE in comparison to the Suntest XXL+. In these studies, the
differences in absorption spectra of PNI and PNT in relation to spectral power
distribution of light provided by Suntest XXL+ are relatively small and in these
particular experimental conditions ageing did not result in clear differences in the
surface effect between these two polyesters.
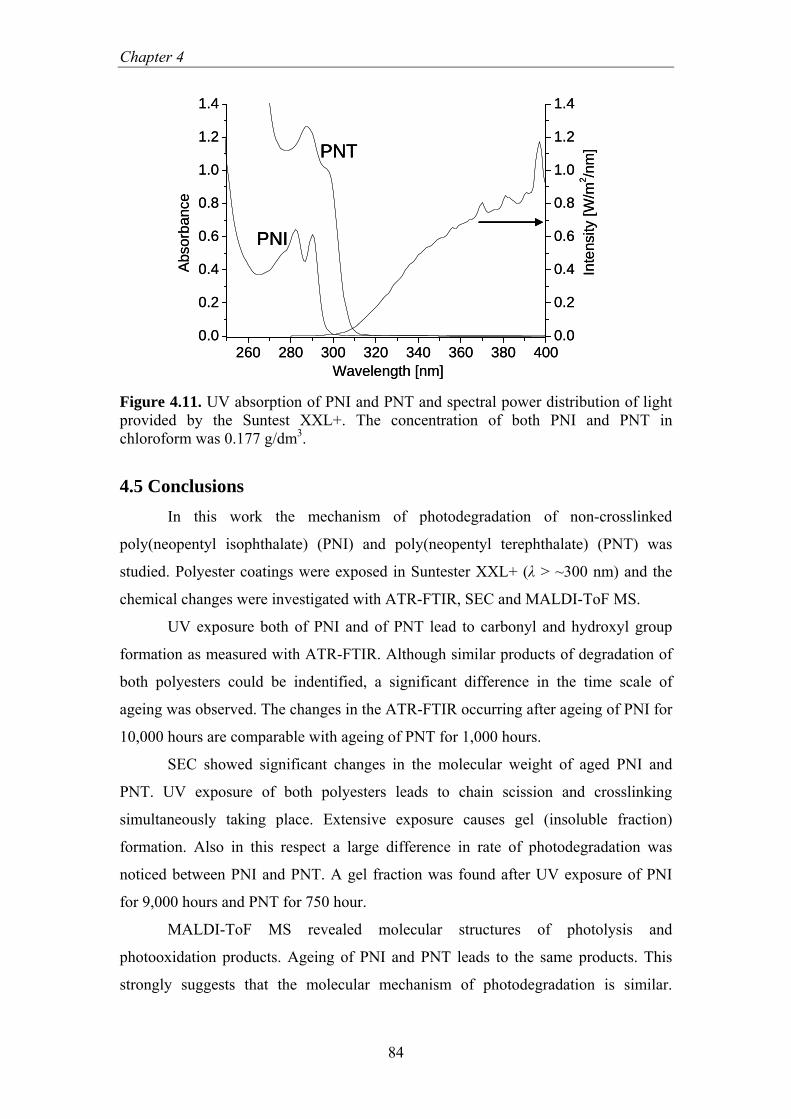
Chapter 4
84
260 280 300 320 340 360 380 4000.0
0.2
0.4
0.6
0.8
1.0
1.2
1.4
0.0
0.2
0.4
0.6
0.8
1.0
1.2
1.4
Inte
nsity
[W/m
2 /nm
]
Wavelength [nm]
Abs
orba
nce
PNI
PNT
260 280 300 320 340 360 380 4000.0
0.2
0.4
0.6
0.8
1.0
1.2
1.4
0.0
0.2
0.4
0.6
0.8
1.0
1.2
1.4
Inte
nsity
[W/m
2 /nm
]
Wavelength [nm]
Abs
orba
nce
PNI
PNT
PNI
PNT
Figure 4.11. UV absorption of PNI and PNT and spectral power distribution of light provided by the Suntest XXL+. The concentration of both PNI and PNT in chloroform was 0.177 g/dm3.
4.5 Conclusions In this work the mechanism of photodegradation of non-crosslinked
poly(neopentyl isophthalate) (PNI) and poly(neopentyl terephthalate) (PNT) was
studied. Polyester coatings were exposed in Suntester XXL+ (λ > ~300 nm) and the
chemical changes were investigated with ATR-FTIR, SEC and MALDI-ToF MS.
UV exposure both of PNI and of PNT lead to carbonyl and hydroxyl group
formation as measured with ATR-FTIR. Although similar products of degradation of
both polyesters could be indentified, a significant difference in the time scale of
ageing was observed. The changes in the ATR-FTIR occurring after ageing of PNI for
10,000 hours are comparable with ageing of PNT for 1,000 hours.
SEC showed significant changes in the molecular weight of aged PNI and
PNT. UV exposure of both polyesters leads to chain scission and crosslinking
simultaneously taking place. Extensive exposure causes gel (insoluble fraction)
formation. Also in this respect a large difference in rate of photodegradation was
noticed between PNI and PNT. A gel fraction was found after UV exposure of PNI
for 9,000 hours and PNT for 750 hour.
MALDI-ToF MS revealed molecular structures of photolysis and
photooxidation products. Ageing of PNI and PNT leads to the same products. This
strongly suggests that the molecular mechanism of photodegradation is similar.

Photodegradation of polyesters based on isophthalate and terephthalate units
85
Although MALDI is not a quantitative technique, also in this case spectra of PNI aged
for 10,000 hours were comparable with spectra of PNT aged for 750 hours.
It was confirmed that PNI is much more UV stable than PNT is. More
interestingly it was proved that the mechanism of photodegradation is similar for both
polyesters. Both PNI and PNT absorb UV light in the Suntest XXL+. This can explain
the similar mechanism of photodegradation. The higher UV stability of PNI over PNT
can be attributed to a lower UV absorption of PNI as compared to PNT.
Chapter 4
86
References 1. Focus on Powder Coatings, 2005;1:5-6.
2. Maetens D. Prog Org Coat 2007;58:172-179.
3. Rabek JF. Polymer photodegradation - mechanisms and experimental methods,
1st ed. London:Chapman and Hall, 1995.
4. Day M, Wiles DM. J Appl Polym Sci 1972;16:175-189.
5. Day M, Wiles DM. J Appl Polym Sci 1972;16:191-202.
6. Day M, Wiles DM. J Appl Polym Sci 1972;16:203-215.
7. Rivaton A. Polym Degrad Stab 1993;41:283-296.
8. Rivaton A. Polym Degrad Stab 1993;41:297-310.
9. Carroccio S, Rizzarelli P, Puglisi C, Montaudo G. Macromolecules
2004;37:6576-6586.
10. Carroccio S, Rizzarelli P, Scaltro G, Puglisi C. Polymer 2008;49:3371-3381.
11. Lin-Vien D, Colthup NB, Fateley WG, Grasselli JG. The Handbook of Infrared
and Raman Characteristics Frequencies of Organic Molecules,
Academic Pres, 1990.
12. Staal BBP. Ph.D. Thesis. University of Technology Eidhoven, 2005,
ISBN 90-386-2816-1, http://alexandria.tue.nl/extra2/200510293.pdf.
13. Huijser S, Staal BBP, Huang J, Duchateau R, Koning CE. Angew Chem
2006;118:4210-4214.
5
Mechanism of crosslinking of
poly(neopentyl phthalate) during photodegradation
Summary The mechanism of crosslinking of poly(neopentyl phthalate) as a result of
photodegradation was investigated. UV exposure of these polyesters resulted in gel
(insoluble material) formation. The gel material was collected and the morphology of
the gel material was characterized with SEM. To obtain information on the
crosslinking at a molecular level the gel was decomposed by methanolysis and the
decomposition products were analyzed with LC-MS.

Chapter 5
88
5.1 Introduction UV exposure of aromatic polyesters leads to extensive chemical changes[1-7].
The main chemical reactions taking place are photolysis, photooxidation and
photocrosslinking. Under influence of UV irradiation an aromatic ester bond can
dissociate in two radicals (photolysis). These radicals can abstract hydrogen or react
with oxygen (photooxidation). Alternatively, radicals can recombine and form larger
molecules (photocrosslinking). As a first step of this crosslinking process a high
molecular weight sol fraction (crosslinked molecules, yet still soluble) is formed.
Extensive crosslinking leads to gel formation (insoluble material). Photolysis and
photooxidation are mechanisms which ultimately lead to the decomposition of the
polyester and have attracted most of the attention of researchers. In contrast, the
chemistry of crosslinking has not been extensively studied.
The chemistry of photocrosslinking of poly(ethylene terephthalate) was
investigated by Marcotte et al. Based on ESR (Electron Spin Resonance), the
formation of an intermediate phenyl radical was proposed[1].
The recombination of two such radicals would lead to the crosslinking of polymer
chains.
Later, other researchers referred to this reaction as a possible mechanism of
photocrosslinking of aromatic polyesters. Rivaton[5] studied the photochemistry of
poly(butylene terephthalate) with IR and suggested the formation of a m-biphenyl
structures as a alternative to the above mentioned mechanism of photocrosslinking.
The previous studies, however, have mainly relied on IR spectroscopy. The
new groups formed by crosslinking, being carbon to carbon recombination products,
do not have high IR absorption coefficient. In addition, new chemical structures
involved in crosslinking may be present, each only present in very small
Mechanism of crosslinking of poly(neopentyl phthalate) during photodegradation
89
concentration. Therefore, detection and detailed characterization of crosslinking using
spectroscopic techniques may be difficult. A more detailed analysis is required for the
identification of chemically crosslinked species.
In the first part of this investigation the mechanism of the photocrosslinking of
poly(neopentyl isophthalate) (PNI) was studied. UV exposure of PNI in a UVACUBE
(λ > ~254 nm) resulted in gel formation. The gel contains the highest concentration of
crosslinked structures, and therefore was regarded as the most interesting material to
study the mechanism of crosslinking. Since a gel is an intrinsically non-soluble
polymer material, there is a limited number of analytical techniques available which
can provide structural information. To obtain information on the molecular level of
the crosslinking, the gel was decomposed by methanolysis (break-down of ester
group) and the decomposition products were analyzed with LC-MS. This approach
allowed for a detailed characterization of crosslinked moieties, and finally to the
proposition of an alternative mechanism of crosslinking than the already known
phenyl-to-phenyl recombination.
Secondly, the photocrosslinking of poly(neopentyl isophthalate) (PNI) and
poly(neopentyl terephthalate) (PNT) aged in a Suntest XXL+ (λ > ~300 nm) was
examined.
5.2 Experimental Materials
Model polyesters poly(neopentyl isophthalate) (PNI) and poly(neopentyl
terephthalate), provided by DSM, were used in this study. The polyesters were
prepared in a bulk polycondensation with Titanium (IV) n-butoxide (Ti(OBu)4) as a
catalyst. Synthesis was performed with an excess of neopentyl glycol resulting in
hydroxyl functional polymers. The characteristics of PNI and PNT are presented in
Table 5.1 where OHV – hydroxyl value, AV – acid value, Mn – number average
molecular weight. Tg – glass transition temperature. These parameters were
determined according to procedures described in Chapter 2.
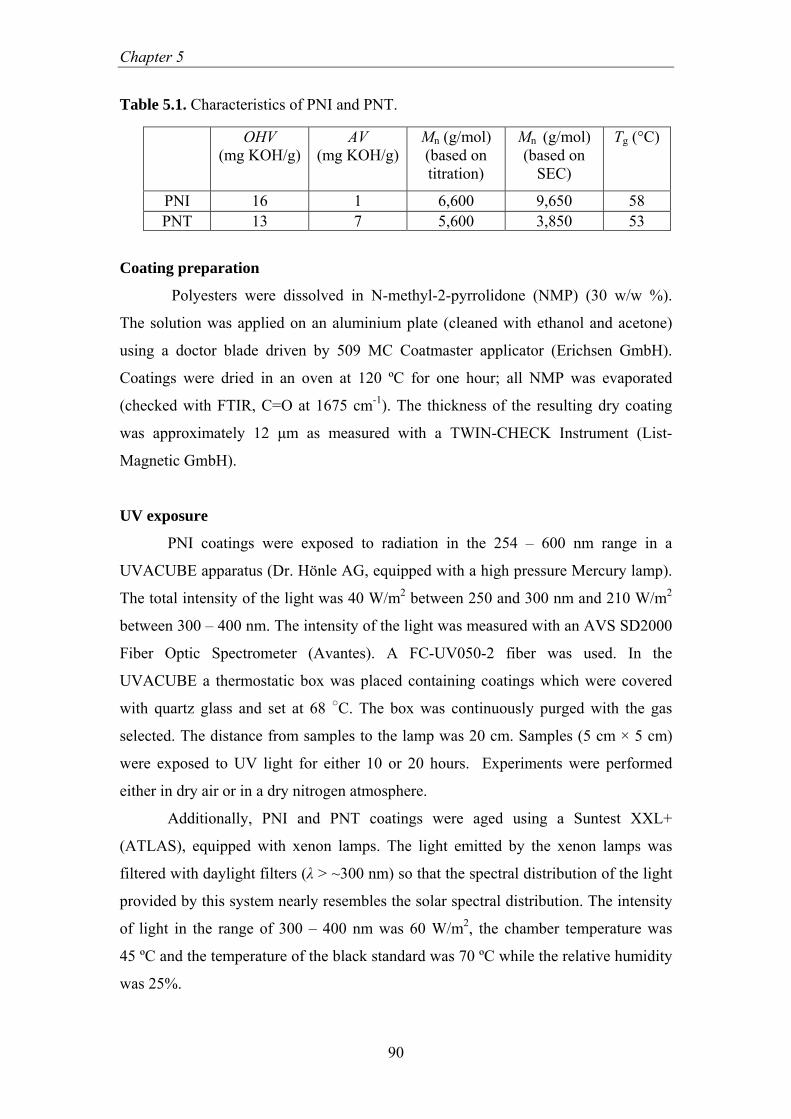
Chapter 5
90
Table 5.1. Characteristics of PNI and PNT.
OHV (mg KOH/g)
AV (mg KOH/g)
Mn (g/mol) (based on titration)
Mn (g/mol) (based on
SEC)
Tg (°C)
PNI 16 1 6,600 9,650 58 PNT 13 7 5,600 3,850 53
Coating preparation
Polyesters were dissolved in N-methyl-2-pyrrolidone (NMP) (30 w/w %).
The solution was applied on an aluminium plate (cleaned with ethanol and acetone)
using a doctor blade driven by 509 MC Coatmaster applicator (Erichsen GmbH).
Coatings were dried in an oven at 120 ºC for one hour; all NMP was evaporated
(checked with FTIR, C=O at 1675 cm-1). The thickness of the resulting dry coating
was approximately 12 μm as measured with a TWIN-CHECK Instrument (List-
Magnetic GmbH).
UV exposure
PNI coatings were exposed to radiation in the 254 – 600 nm range in a
UVACUBE apparatus (Dr. Hönle AG, equipped with a high pressure Mercury lamp).
The total intensity of the light was 40 W/m2 between 250 and 300 nm and 210 W/m2
between 300 – 400 nm. The intensity of the light was measured with an AVS SD2000
Fiber Optic Spectrometer (Avantes). A FC-UV050-2 fiber was used. In the
UVACUBE a thermostatic box was placed containing coatings which were covered
with quartz glass and set at 68 ○C. The box was continuously purged with the gas
selected. The distance from samples to the lamp was 20 cm. Samples (5 cm × 5 cm)
were exposed to UV light for either 10 or 20 hours. Experiments were performed
either in dry air or in a dry nitrogen atmosphere.
Additionally, PNI and PNT coatings were aged using a Suntest XXL+
(ATLAS), equipped with xenon lamps. The light emitted by the xenon lamps was
filtered with daylight filters (λ > ~300 nm) so that the spectral distribution of the light
provided by this system nearly resembles the solar spectral distribution. The intensity
of light in the range of 300 – 400 nm was 60 W/m2, the chamber temperature was
45 ºC and the temperature of the black standard was 70 ºC while the relative humidity
was 25%.

Mechanism of crosslinking of poly(neopentyl phthalate) during photodegradation
91
Analytical methods
Gel fractions were determined gravimetrically. The adhesion of the polyester
coating to the aluminium substrate was very high and peeling off the coating for gel
fraction measurement was not possible. Instead the weight of the coating together
with the substrate was measured first. Then, the polyester was washed off with THF
and the weight of the bare substrate was measured. The soluble part of polyester was
separated from the gel by filtration (0.2 µm PTFE filter). After evaporation of the
THF (24 hours at 75 ○C, vacuum oven) the weight of soluble fraction was measured.
Knowing the weights of the coating with the substrate, the bare substrate and the
soluble fraction, the weight of the gel fraction was calculated.
Attenuated Total Reflectance Fourier Transform Infrared Spectroscopy (ATR-
FTIR) was performed using a BioRad Excalibur FTS3000MX spectrometer equipped
with a diamond crystal (Golden Gate). Spectra of the gel were recorded in the range
of 920 – 750 cm-1 with a resolution of 4 cm-1.
The methanolysis reaction of the virgin polyester (blank test) and the gel were
performed according to the reaction presented in Scheme 5.1. The reaction was
carried out in a 40 ml steel reactor (Parr Instrument) containing 10 ml of methanol
and 20 mg of polymer. Titanium chloride TiCl4 (0.3 % w/w in methanol) was used as
a catalyst while the reaction conditions were 170 ○C for 15 hours.
O O
OO
O
n
OO
O
O
O O
+TiCl4
OH
OO
HO
HO OH
+
170 oC
CH3OH
Scheme 5.1. Methanolysis of esters. During this reaction methanol can attack the carbonyl (-C=O) of the ester group, yielding a methyl ester (-C(O)OCH3) and hydroxyl (-OH) groups. Methanol might also attack the methylene (-CH2-) group, in which case carboxylic acid (-C(O)OH) and methoxy (-OCH3) groups will be formed. Alternatively, OH-functional molecules can undergo Lewis-acid catalyzed etherification with methanol.
High performance liquid chromatography was performed using an Agilent
1100 series system consisting of a G1311A quaternary pump, a G1322A degasser and
an G1313A autosampler. An Agilent 1100, G1315B, UV DAD (diode array detector)
detector with detection wavelength 254 nm was used. Chromatographic separation
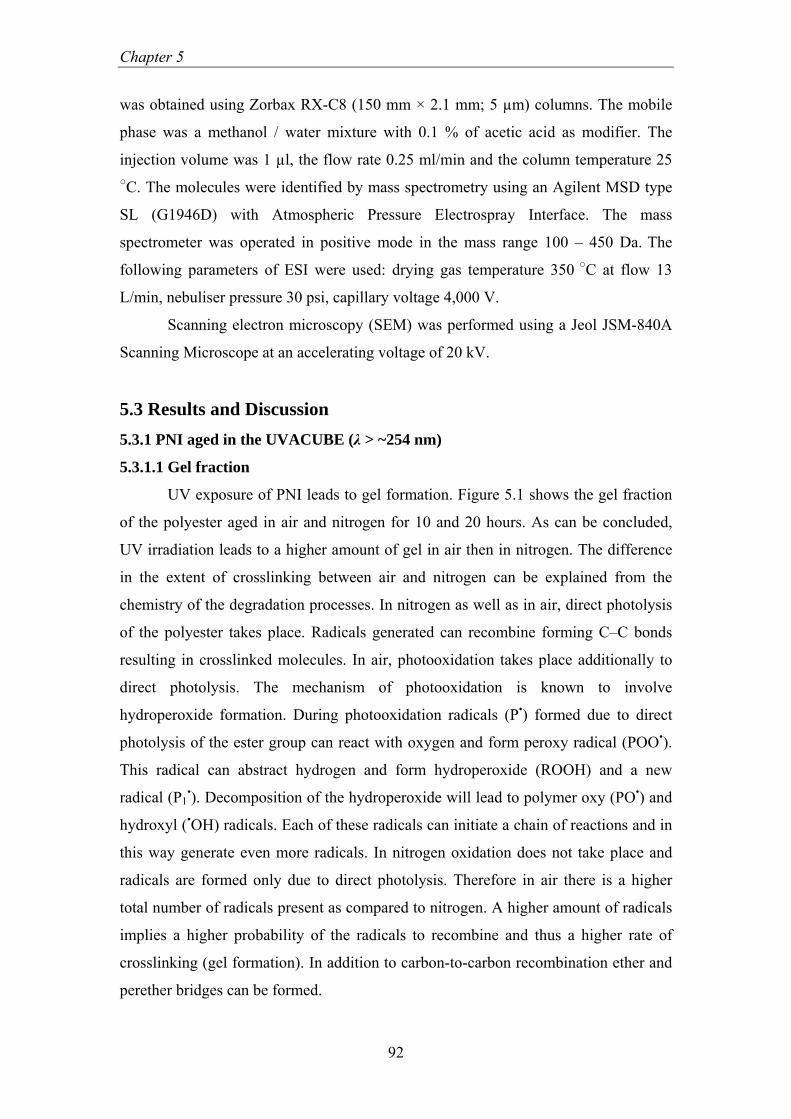
Chapter 5
92
was obtained using Zorbax RX-C8 (150 mm × 2.1 mm; 5 µm) columns. The mobile
phase was a methanol / water mixture with 0.1 % of acetic acid as modifier. The
injection volume was 1 µl, the flow rate 0.25 ml/min and the column temperature 25 ○C. The molecules were identified by mass spectrometry using an Agilent MSD type
SL (G1946D) with Atmospheric Pressure Electrospray Interface. The mass
spectrometer was operated in positive mode in the mass range 100 – 450 Da. The
following parameters of ESI were used: drying gas temperature 350 ○C at flow 13
L/min, nebuliser pressure 30 psi, capillary voltage 4,000 V.
Scanning electron microscopy (SEM) was performed using a Jeol JSM-840A
Scanning Microscope at an accelerating voltage of 20 kV.
5.3 Results and Discussion 5.3.1 PNI aged in the UVACUBE (λ > ~254 nm)
5.3.1.1 Gel fraction
UV exposure of PNI leads to gel formation. Figure 5.1 shows the gel fraction
of the polyester aged in air and nitrogen for 10 and 20 hours. As can be concluded,
UV irradiation leads to a higher amount of gel in air then in nitrogen. The difference
in the extent of crosslinking between air and nitrogen can be explained from the
chemistry of the degradation processes. In nitrogen as well as in air, direct photolysis
of the polyester takes place. Radicals generated can recombine forming C–C bonds
resulting in crosslinked molecules. In air, photooxidation takes place additionally to
direct photolysis. The mechanism of photooxidation is known to involve
hydroperoxide formation. During photooxidation radicals (P•) formed due to direct
photolysis of the ester group can react with oxygen and form peroxy radical (POO•).
This radical can abstract hydrogen and form hydroperoxide (ROOH) and a new
radical (P1•). Decomposition of the hydroperoxide will lead to polymer oxy (PO•) and
hydroxyl (•OH) radicals. Each of these radicals can initiate a chain of reactions and in
this way generate even more radicals. In nitrogen oxidation does not take place and
radicals are formed only due to direct photolysis. Therefore in air there is a higher
total number of radicals present as compared to nitrogen. A higher amount of radicals
implies a higher probability of the radicals to recombine and thus a higher rate of
crosslinking (gel formation). In addition to carbon-to-carbon recombination ether and
perether bridges can be formed.

Mechanism of crosslinking of poly(neopentyl phthalate) during photodegradation
93
0 5 10 15 20 25
0
5
10
15
20
25
30
N2
AIR
Gel
frac
tion
[%]
Time (hours) Figure 5.1. Gel fractions in PNI coatings UV exposed in the UVACUBE, in nitrogen and air. 5.3.1.2 Gel morphology
When exposing polyester coatings to organic solvents (THF, chloroform)
surprisingly it was noted that the insoluble top layer forms fibrous or needle like
structures. After solvent evaporation, these structures were analyzed with Scanning
Electron Microscope. Figures 5.2 and 5.3 show SEM graphs of the gel fraction
collected from coatings aged for 20 hours in nitrogen and air conditions, respectively.
As can be seen each individual fiber is in fact a rolled-up layer of a crosslinked
polymer. This is a strong indication that crosslinked molecules form a skin layer on
top of a UV exposed coating. This crosslinked layer (gel) has a non-uniform cross-
linked density. The side of the layer that is directed to the surface of the coating will
have the highest crosslink density. When exposed to a solvent this side has less
tendency to swell than the other side of the crosslinked layer. As a consequence the
side of the layer that is directed to the coating surface becomes the interior side of the
roll that visually appears as needle. Possibly differential internal stresses due to
gradient in crosslinking also contribute. The gel material in the coating is present in
the form of a three dimensional network. After dissolving and drying for SEM
analysis it obviously shrinks. Therefore from SEM graphs the evaluation of the actual
thickness of the gel layer is difficult. However, an estimation of its thickness can be
made in a different way. In these experiments coatings were exposed in the
UVACUBE (λ > ~254). Approximately 85% of the light in the range of 254 – 290 nm

Chapter 5
94
is absorbed by the first 3 µm of the PNI coating. Thus it can be assumed that upon
ageing in a UVACUBE the gel is formed primarily in the top 3 to 4 µm of the coating.
Figure 5.2. SEM graphs of gel collected from PNI coatings UV exposed in the UVACUBE for 20 hours in nitrogen.
Figure 5.3. SEM graphs of gel collected from PNI coatings UV exposed in the UVACUBE for 20 hours in air.
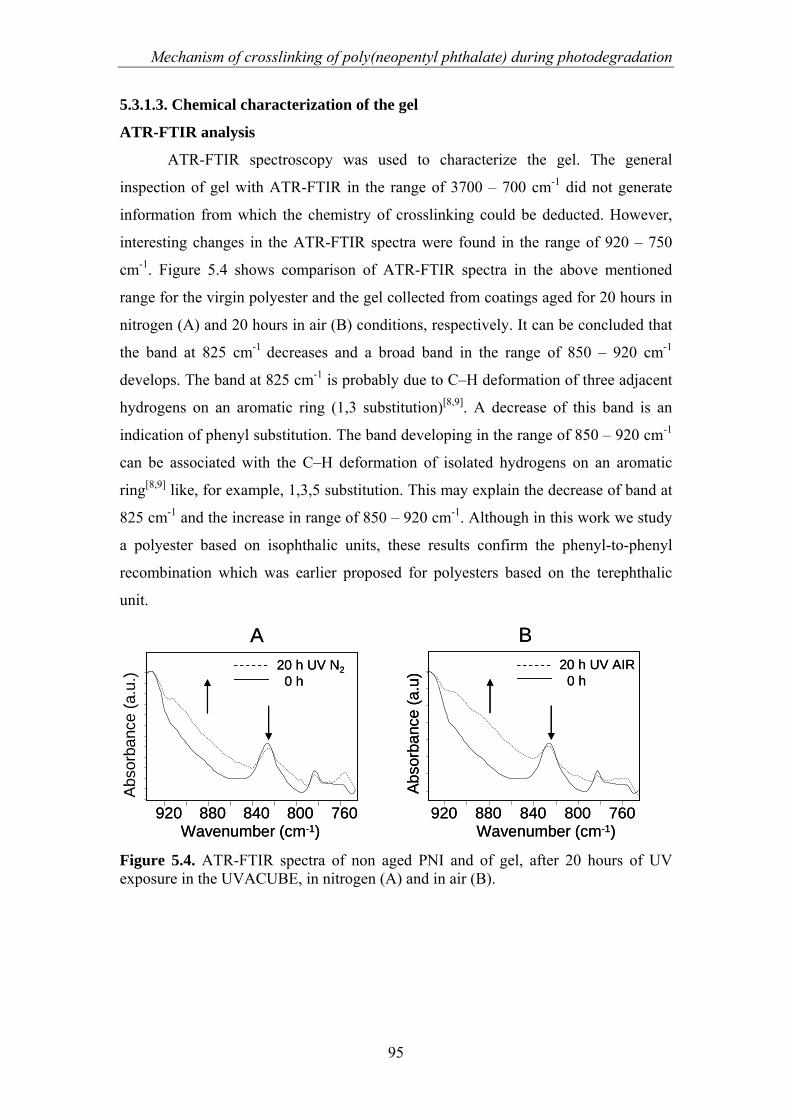
Mechanism of crosslinking of poly(neopentyl phthalate) during photodegradation
95
5.3.1.3. Chemical characterization of the gel
ATR-FTIR analysis
ATR-FTIR spectroscopy was used to characterize the gel. The general
inspection of gel with ATR-FTIR in the range of 3700 – 700 cm-1 did not generate
information from which the chemistry of crosslinking could be deducted. However,
interesting changes in the ATR-FTIR spectra were found in the range of 920 – 750
cm-1. Figure 5.4 shows comparison of ATR-FTIR spectra in the above mentioned
range for the virgin polyester and the gel collected from coatings aged for 20 hours in
nitrogen (A) and 20 hours in air (B) conditions, respectively. It can be concluded that
the band at 825 cm-1 decreases and a broad band in the range of 850 – 920 cm-1
develops. The band at 825 cm-1 is probably due to C–H deformation of three adjacent
hydrogens on an aromatic ring (1,3 substitution)[8,9]. A decrease of this band is an
indication of phenyl substitution. The band developing in the range of 850 – 920 cm-1
can be associated with the C–H deformation of isolated hydrogens on an aromatic
ring[8,9] like, for example, 1,3,5 substitution. This may explain the decrease of band at
825 cm-1 and the increase in range of 850 – 920 cm-1. Although in this work we study
a polyester based on isophthalic units, these results confirm the phenyl-to-phenyl
recombination which was earlier proposed for polyesters based on the terephthalic
unit.
920 880 840 800 760Wavenumber (cm-1)
Abs
orba
nce
(a.u
.)
20 h UV N20 h
A
920 880 840 800 760Wavenumber (cm-1)
Abs
orba
nce
(a.u
.)
20 h UV N20 h
A
920 880 840 800 760
Wavenumber (cm-1)
Abso
rban
ce (a
.u) 20 h UV AIR
0 h
B
920 880 840 800 760Wavenumber (cm-1)
Abso
rban
ce (a
.u) 20 h UV AIR
0 h
B
Figure 5.4. ATR-FTIR spectra of non aged PNI and of gel, after 20 hours of UV exposure in the UVACUBE, in nitrogen (A) and in air (B).

Chapter 5
96
Methanolysis and LC-MS analysis
In order to obtain detailed information on the chemistry of crosslinking, the
gel material was decomposed by methanolysis and analyzed using liquid
chromatography combined with mass spectrometry. In this approach insoluble
material, which is generally difficult to characterize, is converted into soluble
fragments and studied on the molecular level. A crosslinked structure can be formed
either by “chain coupling” (A) and/or by “grafting” (B) reactions. Both resulting
structures are shown in Scheme 5.2. As described in the experimental section,
methanolysis breaks down ester bonds. Since crosslinking is expected to be carbon-to-
carbon recombination, crosslinked sites (○, Scheme 5.2) should not be affected by
methanolysis. It should be noted that, although unexpected, crosslinked sites not
based on carbon-to-carbon recombination products, are likely to be lost in this
process.
A
B
A
B
Scheme 5.2. Graphical illustration of methanolysis of the gel, formed by chain coupling (A) and by grafting (B).
As shown and explained in the experimental section (Scheme 5.1),
methanolysis of polyester leads to the formation of small molecules with mainly
methyl ester, hydroxyl, acid and methoxy end groups. Different combinations of these
end groups will result in different polarities and masses of particular fragments. The
gel material collected from coatings aged in nitrogen was chosen as study material in
order to have the highest possible content of carbon-to-carbon crosslinked moieties.
As a blank reference, a non-aged polyester was used. The separation of methanolysis
fragments of the virgin polymer and the gel was performed with chromatography
combined with an UV-DAD detector and with mass spectrometry. Figure 5.5 shows
UV-DAD and ESI-MS total ion current (TIC) chromatograms of the methanolized
non-aged polyester. The TIC chromatograms show more peaks as compared to the
UV-DAD chromatograms. Probably structures represented by peaks in the TIC

Mechanism of crosslinking of poly(neopentyl phthalate) during photodegradation
97
chromatogram, while not observed in UV-DAD chromatogram, are present in small
concentration and/or have low UV absorption. Figure 5.6 shows UV-DAD and TIC
chromatograms of the methanolized gel. Both UV-DAD and TIC chromatograms of
the methanolized gel (Figure 5.6) show a higher number of peaks as compared to the
virgin polymer (Figure 5.5). This is an indication of a different chemical composition
of the gel as compared to non-aged polyester. The mass spectrometry was performed
in positive mode; most of molecules are protonated and / or sodiated species. All
identified molecules, with masses and retention times, are presented in Table 5.2. The
methanolysis of virgin polymer leads to original, monomer fragments (Structures 1, 2,
3, 4, 5 and 7, Table 5.2). For instance, Figures 5.7 and 5.8 show the mass spectra of
molecules 1 and 4 which appeared in the TIC chromatogram (Figure 5.5) at 2.4 and 8
min of retention time. In the methanolized gel, in addition to the above mentioned
molecules, the following structures were identified; 6, 8, 9, 10 and 11 (Table 5.2). The
structures 9, 10 and 11 represent crosslinked monomers. These crosslinked moieties
are believed to have been responsible for the gel formation. Figures 5.9 and 5.10 show
mass spectra of crosslinked molecules (Structure 10 and 11, Table 5.2) represented in
the TIC chromatogram (Figure 5.6) at 11.7 and 14.2 min of retention time.

Chapter 5
98
0 2.5 5 7.5 10 12.5 15 17.5 20
mAU
0
1e3
2e3
10.7
4
min2.5 5 7.5 10 12.5 15 17.5 200
2e7
4e7 1.50
2.39
3.98 5.
44 7.97
10.9
0
12.3
6
Int.TIC
UV-DAD
min
18.7
4
0 2.5 5 7.5 10 12.5 15 17.5 20
mAU
0
1e3
2e3
10.7
4
min2.5 5 7.5 10 12.5 15 17.5 200
2e7
4e7 1.50
2.39
3.98 5.
44 7.97
10.9
0
12.3
6
Int.TIC
UV-DAD
min
18.7
4
Figure 5.5. UV-DAD and TIC (total ion current) chromatograms of methanolized non-aged PNI.
min0 2.5 5 7.5 10 12.5 15 17.5 20
mAU
0
1.5e3
1.64 8.24
8.99
10.0
110
.61
11.5
012
.29
13.0
014
.02
14.2
714
.66
15.3
4
min2.5 5 7.5 10 12.5 15 17.5 200
2e7
4e7
1.50
2.38
3.40
5.62 8.
41 9.10 10
.17
10.7
111
.68
12.3
313
.06
14.1
914
.85
15.1
715
.50
Int.
0
UV-DAD
TIC
17.6
8
min0 2.5 5 7.5 10 12.5 15 17.5 20
mAU
0
1.5e3
1.64 8.24
8.99
10.0
110
.61
11.5
012
.29
13.0
014
.02
14.2
714
.66
15.3
4
min2.5 5 7.5 10 12.5 15 17.5 200
2e7
4e7
1.50
2.38
3.40
5.62 8.
41 9.10 10
.17
10.7
111
.68
12.3
313
.06
14.1
914
.85
15.1
715
.50
Int.
0
UV-DAD
TIC
17.6
8
Figure 5.6. UV-DAD and TIC (total ion current) chromatograms of methanolized gel.
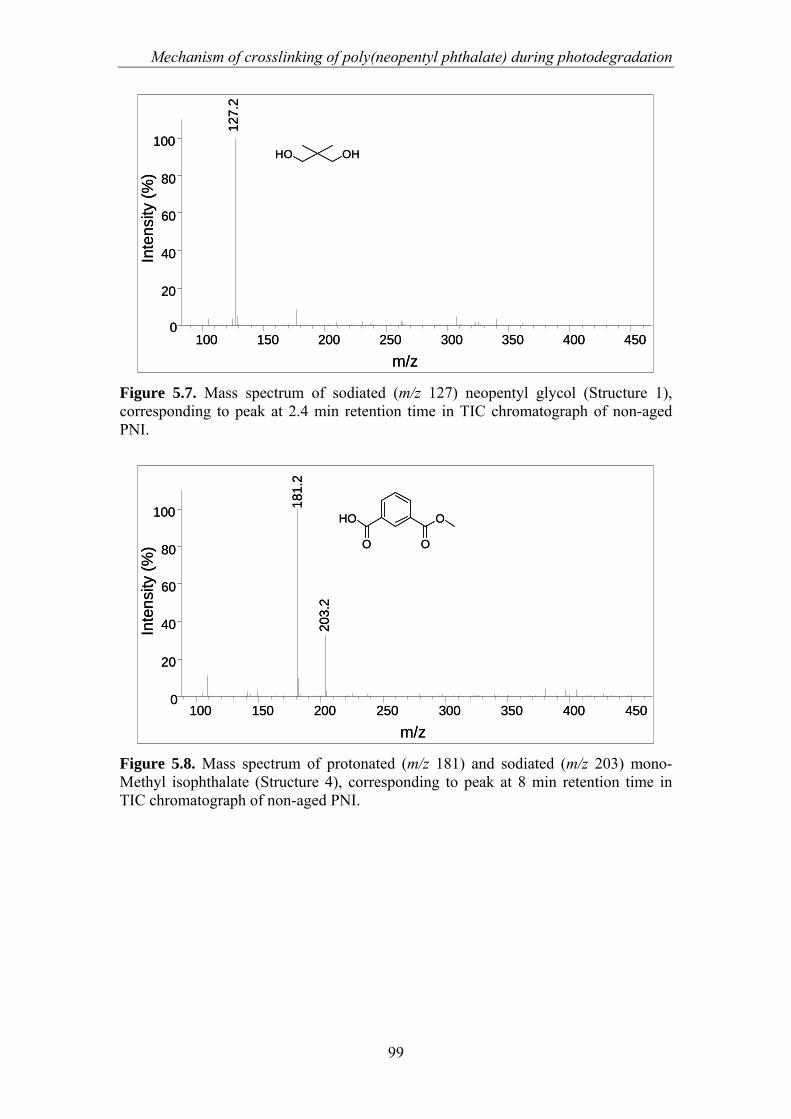
Mechanism of crosslinking of poly(neopentyl phthalate) during photodegradation
99
m/z100 150 200 250 300 350 400 450
0
20
40
60
80
100
127.
2
Inte
nsity
(%)
OHHO
m/z100 150 200 250 300 350 400 450
0
20
40
60
80
100
127.
2
Inte
nsity
(%)
OHHO
Figure 5.7. Mass spectrum of sodiated (m/z 127) neopentyl glycol (Structure 1), corresponding to peak at 2.4 min retention time in TIC chromatograph of non-aged PNI.
m/z100 150 200 250 300 350 400 450
0
20
40
60
80
100
203.
2
181.
2
Inte
nsity
(%)
OHO
O O
m/z100 150 200 250 300 350 400 450
0
20
40
60
80
100
203.
2
181.
2
Inte
nsity
(%)
OHO
O O
Figure 5.8. Mass spectrum of protonated (m/z 181) and sodiated (m/z 203) mono-Methyl isophthalate (Structure 4), corresponding to peak at 8 min retention time in TIC chromatograph of non-aged PNI.

Chapter 5
100
m/z100 150 200 250 300 350 400 450
0
20
40
60
80
100
217.
2
195.
2
271.
2
249.
2
Inte
nsity
(%)
OO
OHOOO
O O
m/z100 150 200 250 300 350 400 450
0
20
40
60
80
100
217.
2
195.
2
271.
2
249.
2
Inte
nsity
(%)
OO
OHOOO
O O
Figure 5.9. Mass spectrum of protonated (m/z 195) and sodiated (m/z 217) dimethyl isophthalate (Structure 5) and protonated (m/z 249) and sodiated (m/z 271) methylated NPG dimer (Structure 10), corresponding to peak at 11.7 min retention time in TIC chromatograph of methanolized gel.
m/z100 150 200 250 300 350 400 450
0
20
40
60
80
100
329.
3
351.
2
297.
2
OO
O O
O
O
Inte
nsity
(%)
m/z100 150 200 250 300 350 400 450
0
20
40
60
80
100
329.
3
351.
2
297.
2
OO
O O
O
O
Inte
nsity
(%)
Figure 5.10. Mass spectrum of protonated (m/z 329) and sodiated (m/z 351) phenyl to phenyl crosslinked molecule (Structure 11), corresponding to peak at 14.2 min retention time in TIC chromatograph of methanolized gel. The peak at 297 m/z corresponds to fragment ( M – MeO).

Mechanism of crosslinking of poly(neopentyl phthalate) during photodegradation
101
5.3.1.4 Mechanism of crosslinking
As described earlier Norrish type I photocleavage is the main initiation step of
photodegradation of poly(neopentyl isophthalate) PNI. The ester group can be cleaved
at three different positions creating six possible different primary radicals (Scheme
5.3). Under inert conditions these radicals can directly, or after rearrangement,
abstract hydrogen and form new end groups. The most labile hydrogen atoms on the
PNI backbone are located in the α-position of the ester group. As presented in Scheme
5.4, macromolecular alkyl radicals (–C•H–O–C(O)–) result from hydrogen abstraction
from those positions. Recombination of these radicals will lead to crosslinking
(Scheme 5.4). Structures 9 and 10 (Table 5.2) identified with LC-MS are clear
evidence of “chain coupling” recombination taking place.
As was illustrated in Scheme 5.3, in case C the phenyl radical C-2 can be
formed by photocleavage of the ester group. It can also be formed by decarbonylation
of the acyl or by decarboxylation of the carboxyl radicals. It was shown in Chapter 2
that phenyl radicals C-2 can abstract hydrogen and form a benzoic end group. This
structure was observed (MALDI-ToF MS). It appears that the phenyl radical can also
react with an isophthalate unit of the polyester chain and in this way form “grafted”
crosslinked molecules (Scheme 5.5).
As shown above the mechanism of crosslinking can have a “chain coupling”
(Structures 9 and 10) or a “grafting” (Structure 11) character. These findings are in
line with the earlier suggested phenyl to phenyl crosslinking mechanism of PET.
O
O O
O
OOO O
O
OO
O
O O
OO
A
B
C
A-1 A-2
B-1B-2
C-1C-2
+
+
+
hv
- CO
- CO2
Scheme 5.3. Norrish type I photocleavage of ester group, case: A, B, C.

Chapter 5
102
O
O O
O
O
O O
O
P
O
O O
O
O
OO
O
Scheme 5.4. “Chain coupling”-like crosslinking.
O
O
O O
O
OO
O O
O
Scheme 5.5. “Grafting”-like crosslinking.
Table 5.2. Molecules identified with LC-MS.
Number Structure Mass (m/z) H+
Mass (m/z) Na+
Retention time (min)
1 OHHO 105 127 2.4
2 OHO 119 141 14
3 OHHO
O O
167 189 5.4
4 OHO
O O
181 203 8
5 OO
O O
195 217 10.7
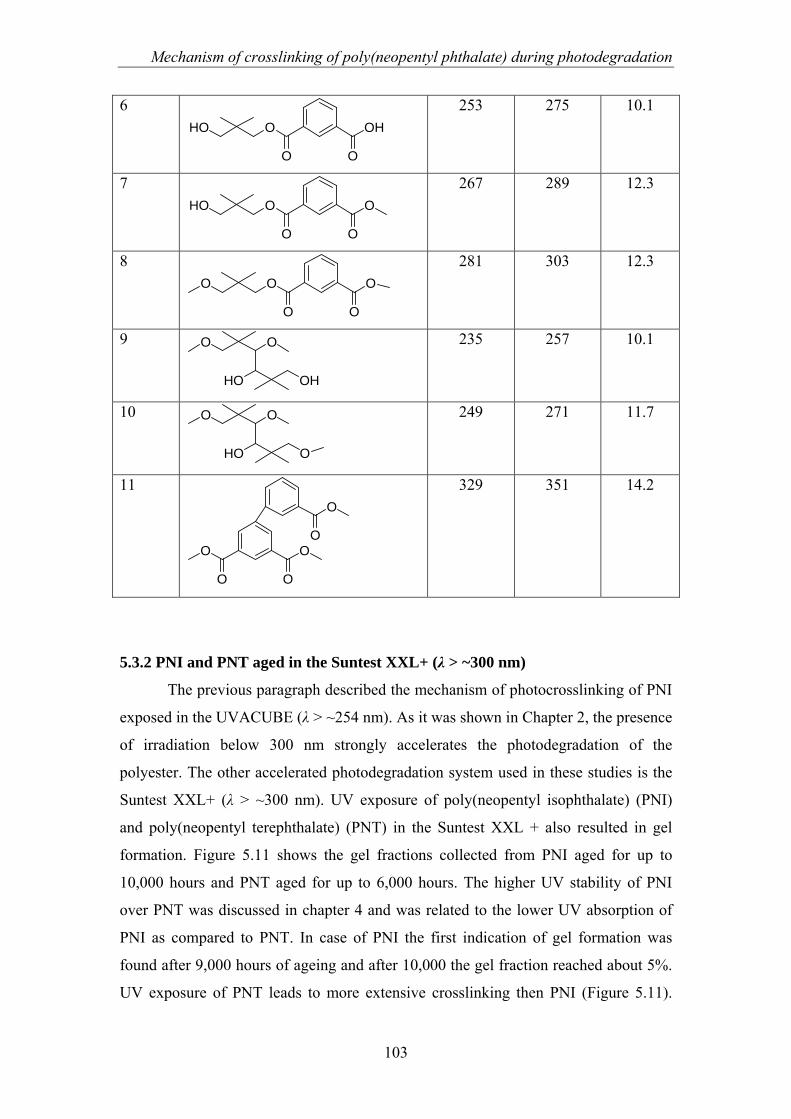
Mechanism of crosslinking of poly(neopentyl phthalate) during photodegradation
103
6 HO O
O O
OH
253 275 10.1
7 HO O
O O
O
267 289 12.3
8 O O
O O
O
281 303 12.3
9 OO
OHHO
235 257 10.1
10 OO
OHO
249 271 11.7
11
OO
O O
O
O
329 351 14.2
5.3.2 PNI and PNT aged in the Suntest XXL+ (λ > ~300 nm)
The previous paragraph described the mechanism of photocrosslinking of PNI
exposed in the UVACUBE (λ > ~254 nm). As it was shown in Chapter 2, the presence
of irradiation below 300 nm strongly accelerates the photodegradation of the
polyester. The other accelerated photodegradation system used in these studies is the
Suntest XXL+ (λ > ~300 nm). UV exposure of poly(neopentyl isophthalate) (PNI)
and poly(neopentyl terephthalate) (PNT) in the Suntest XXL + also resulted in gel
formation. Figure 5.11 shows the gel fractions collected from PNI aged for up to
10,000 hours and PNT aged for up to 6,000 hours. The higher UV stability of PNI
over PNT was discussed in chapter 4 and was related to the lower UV absorption of
PNI as compared to PNT. In case of PNI the first indication of gel formation was
found after 9,000 hours of ageing and after 10,000 the gel fraction reached about 5%.
UV exposure of PNT leads to more extensive crosslinking then PNI (Figure 5.11).
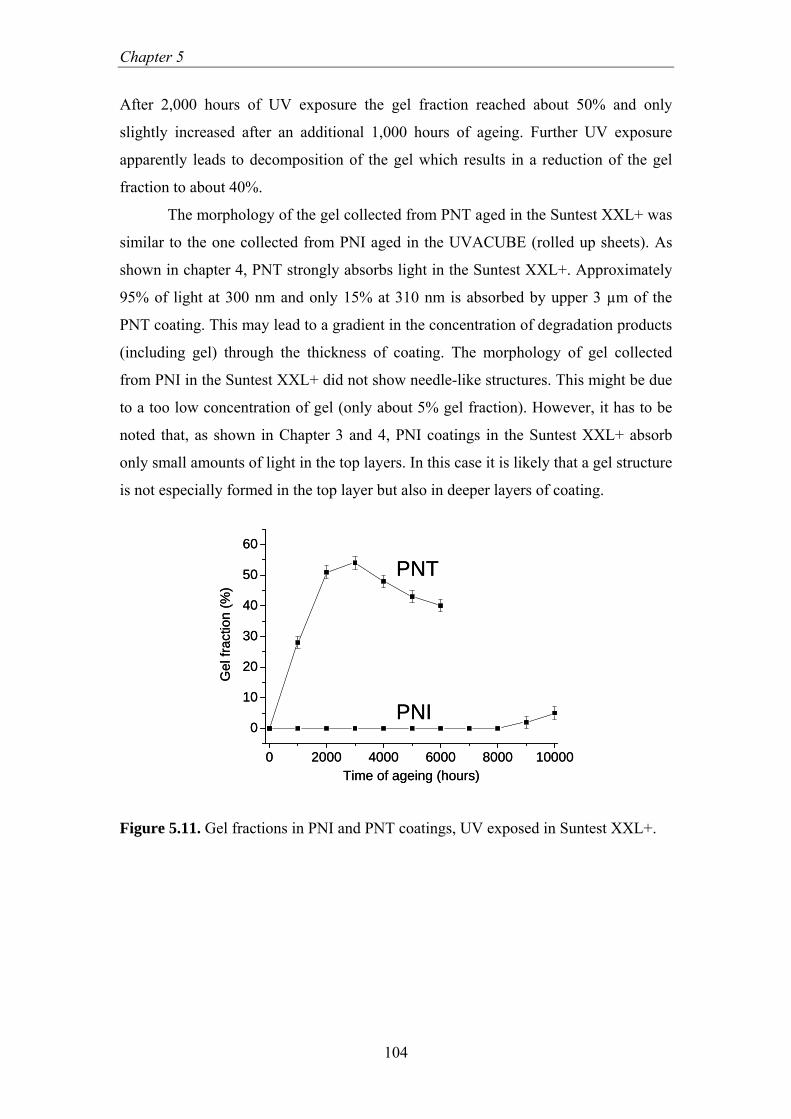
Chapter 5
104
After 2,000 hours of UV exposure the gel fraction reached about 50% and only
slightly increased after an additional 1,000 hours of ageing. Further UV exposure
apparently leads to decomposition of the gel which results in a reduction of the gel
fraction to about 40%.
The morphology of the gel collected from PNT aged in the Suntest XXL+ was
similar to the one collected from PNI aged in the UVACUBE (rolled up sheets). As
shown in chapter 4, PNT strongly absorbs light in the Suntest XXL+. Approximately
95% of light at 300 nm and only 15% at 310 nm is absorbed by upper 3 µm of the
PNT coating. This may lead to a gradient in the concentration of degradation products
(including gel) through the thickness of coating. The morphology of gel collected
from PNI in the Suntest XXL+ did not show needle-like structures. This might be due
to a too low concentration of gel (only about 5% gel fraction). However, it has to be
noted that, as shown in Chapter 3 and 4, PNI coatings in the Suntest XXL+ absorb
only small amounts of light in the top layers. In this case it is likely that a gel structure
is not especially formed in the top layer but also in deeper layers of coating.
0 2000 4000 6000 8000 10000
0
10
20
30
40
50
60
Gel
frac
tion
(%)
Time of ageing (hours)
PNI
PNT
0 2000 4000 6000 8000 10000
0
10
20
30
40
50
60
Gel
frac
tion
(%)
Time of ageing (hours)
PNI
PNT
Figure 5.11. Gel fractions in PNI and PNT coatings, UV exposed in Suntest XXL+.
Mechanism of crosslinking of poly(neopentyl phthalate) during photodegradation
105
5.4 Conclusions In this chapter photocrosslinking of poly(neopentyl phthalate) was studied. In
the first part of this investigation the mechanism of crosslinking of poly(neopentyl
isophthalate) (PNI) as a result of photodegradation was studied. PNI coatings were
exposed in the UVACUBE (λ > 254 nm). UV irradiation resulted in gel formation
(insoluble material). The gel was collected and chemically characterized. It was
observed that when aged coatings are subjected to organic solvents (THF), the gel
material forms needle-like structures. Using SEM it was shown that these needles are
in fact rolled-up layers of crosslinked polymer. This indicated that gel material had
formed a skin layer in the top of a UV irradiated coating. Chemical characterization of
the gel was performed with ATR-FTIR and methanolysis combined with LC-MS.
ATR-FTIR of the gel material indicated phenyl substitution (850 – 920 cm-1 area).
During methanolysis the ester bonds of gel material were broken down, causing the
insoluble material to become soluble again and suitable to be analyzed with LC-MS.
In addition to the phenyl-phenyl coupling, it was found that radicals formed in the α-
position to the ester group can recombine and form crosslinked moieties.
Secondly, PNI and PNT coatings were aged in the Suntest XXL+ (λ > 300
nm). UV exposure of PNI and PNT in these conditions also resulted in gel formation,
much more in PNT than in PNI. The PNT gel did give needle-like structures in THF
whereas PNI did not.
Chapter 5
106
References 1. Marcotte FB, Campbell D, Cleaveland JA, Turner DT. J Polym Sci
1967;5:481-501.
2. Day M, Wiles DM. J Appl Polym Sci 1972;16:175-189.
3. Day M, Wiles DM. J Appl Polym Sci 1972;16:191-202.
4. Day M, Wiles DM. J Appl Polym Sci 1972;16:203-215.
5. Rivaton A. Polym Degrad Stab 1993;41:283-296.
6. Rivaton A. Polym Degrad Stab 1993;41:297-310.
7. Carroccio S, Rizzarelli P, Scaltro G, Puglisi C. Polymer 2008;49:3371-3381.
8. Lin-Vien D, Colthup NB, Fateley WG, Grasselli JG. The Handbook of Infrared
and Raman Characteristics Frequencies of Organic Molecules,
Academic Pres, 1990.
9. Holland BJ, Hay JN. Polymer 2002;43:1835-1847.
6
Correlations between chemical and physical changes
of polyester coatings under UV irradiation
Summary
The influence of chemical changes taking place during photodegradation of
aromatic polyester coatings on the surface physical properties was studied. In order
to distinguish between different chemical reactions, degradation experiments were
performed in air and nitrogen atmosphere. Chemical changes were studied with ATR-
FTIR spectroscopy and SEC chromatography. As investigated with ATR-FTIR, UV
exposure in air leads to extensive carbonyl and hydroxyl group formation
(photooxidation) in the polyester. On the other hand, upon ageing in nitrogen such
groups are only formed to a minor extent. As proven with SEC, UV irradiation leads
to simultaneous chain scission and crosslinking. The extent of both chain scission and
crosslinking is higher when aging occurs in air than in nitrogen. Extensive
crosslinking leads to insoluble material (gel) formation. Depth-sensing indentation
was used to investigate the mechanical properties of aged coatings, showing an
increase in hardness. It was established that photooxidation is the predominant cause
of hardness increase as it leads to polar group formation.
Part of this chapter is submitted for publication: P. Malanowski, H. Kranenburg, F. Scaltro, R. A. T. M. van Benthem, L. G. J van der Ven, J. Laven, G de With, Correlations between chemical and physical changes of poly(neopentyl isophthalate) coatings under short wavelength UV irradiation.

Chapter 6
108
6.1 Introduction Polymeric coatings are used for protective and decorative reasons.
Unfortunately in weathering conditions numerous factors like UV irradiation, water
and temperature can cause changes in the chemical structure of polymeric coatings.
This can influence the physical properties, ultimately leading to failure (cracking,
gloss loss, blistering and delamination) and reduction of their life time[1]. The
correlation of chemical reactions and resulting physical properties taking place during
ageing is essential for a complete understanding of the weathering process.
UV light is known to be the dominant factor affecting durability of polymeric
materials outdoors. One of the main chemical reactions taking place under the
influence of UV radiation is chain scission (photolysis). Radicals formed from this
reaction can abstract hydrogen or react with oxygen (photooxidation). Additionally,
radicals can recombine and form networks (photocrosslinking)[1,2]. All these chemical
reactions can change the chemical nature of the polymer (decrease or increase the
molecular weight, increase the polarity) and thereby influence its physical
properties[3-5]. In order to probe changes in mechanical properties, hardness is often
measured as a function of exposure time. It has been reported that in some cases UV
irradiation of polymers may lead to an increase[6-12], in other cases to a decrease[12,13]
of hardness. However, in most of the cases an increase of hardness is reported. The
impact of chemical degradation on the physical properties may depend on which
reaction (chain scission, crosslinking) is dominant, the relative ratio of these reactions
and possible synergetic effects.
Usually during ageing a number of mechanisms is involved simultaneously.
Therefore establishing the contribution of each specific reaction to the change of
physical properties is almost impossible.
In the first part of this investigation, poly(neopentyl isophthalate) (PNI)
coatings, were aged in a UVACUBE (λ > ~254 nm). UV exposure was carried out in
different atmospheres (air and nitrogen) in order to distinguish oxygen dependent
chemical reactions and their influence on the mechanical properties. Since the
temperature can influence the mechanism of photodegradation and consequently the
physical properties, PNI coatings were aged at two different temperatures. The
changes in chemical structure were studied with ATR-FTIR, SEC and by measuring

Correlations between chemical and physical changes of polyester coatings under UV
109
the gel fraction. Depth-sensing indentation was found to be a suitable tool to study the
mechanical properties of aged coatings.
In the second part, poly(neopentyl isophthalate) (PNI) and poly(neopentyl
terephthalate) (PNT) coatings were aged in a Suntest XXL+ (λ > ~300 nm). The
difference in the extent of the chemical reactions taking place during ageing and their
influence on the mechanical properties of both polyesters was investigated.
6.2 Experimental Materials
Poly(neopentyl isophthalate) (PNI) and poly(neopentyl terephthalate) (PNT),
provided by DSM were used in this study. The polyesters were prepared in a bulk
polycondensation with Titanium (IV) n-butoxide (Ti(OBu)4) as a catalyst. Synthesis
was performed with an excess of neopentyl glycol resulting in hydroxyl functional
polymers. The characteristics of PNI and PNT are presented in Table 6.1. OHV –
hydroxyl value, AV - acid value, Mn – number average molecular weight. Tg – glass
transition temperature. These parameters were determined according to procedures
described in Chapter 2.
Table 6.1. Characteristics of PNI and PNT
OHV (mg KOH/g)
AV (mg KOH/g)
Mn (g/mol) (based on titration)
Mn (g/mol) (based on
SEC)
Tg (°C)
PNI 16 1 6,600 9,650 58 PNT 13 7 5,600 3,850 53
Coating preparation
The polyester was dissolved in N-methyl-2-pyrrolidone (NMP) (30 % w/w)
and applied on an aluminium plate (cleaned with ethanol and acetone) using a doctor
blade driven by 509 MC Coatmaster applicator (Erichsen GmbH). Coatings were
dried in an oven at 120 ºC for one hour; all NMP was evaporated (checked with FTIR,
C=O at 1675 cm-1). After drying the polyester remained amorphous (as checked with
DSC). The coating thickness after drying was approximately 12 μm as measured with
a TWIN-CHECK Instrument (List-Magnetic GmbH).

Chapter 6
110
UV exposure
In the first part of this investigation PNI coatings were exposed to radiation in
the 254 – 600 nm range in a UVACUBE apparatus (Dr. Hönle AG, equipped with a
high pressure Mercury lamp). The intensity of the light was 40 W/m2 in the range of
250 – 300 nm and 210 W/m2 in the range of 300 – 400 nm, as measured with AVS
SD2000 Fiber Optic Spectrometer (Avantes) using a FC-UV050-2 fiber. In the
UVACUBE the PNI coatings were in a thermostatic box set at 68 ○C or at 43 ○C
covered with quartz glass and continuously purged with the gas selected. The distance
from samples to the lamp was 20 cm and samples (5 cm × 5 cm) were exposed to UV
light for either 10 or 20 hours. Experiments were performed either in dry air or in dry
nitrogen atmosphere.
In the second part of this investigation PNI and PNT coatings were aged using
a Suntest XXL+ (ATLAS), equipped with xenon lamps. The light emitted by the
xenon lamps was filtered with daylight filters (λ > ~300 nm). The spectral distribution
of the light provided by this system nearly resembles the solar spectral distribution
with an intensity of the light in the range of 300 – 400 nm of 60 W/m2. The chamber
temperature was 45 ºC and the temperature of the black standard was 70 ºC all
experiments were at a relative humidity 25%.
Analytical methods
Attenuated Total Reflectance Fourier Transform Infrared Spectroscopy (ATR-
FTIR) was performed using a BioRad Excalibur FTS3000MX spectrometer equipped
with a diamond crystal (Golden Gate). Spectra of the surface of the PNI coatings were
recorded in the range of 4000 – 650 cm-1 with a resolution of 4 cm-1. For ATR-FTIR
spectroscopy a small piece was cut from the coated panel and pressed on the ATR
crystal. Spectra in the range of 2300 – 3700 cm-1 were normalized to the peak at 2967
cm-1 (CH3 antisymmetric stretching) and in the range of 1500 – 1900 cm-1 to the peak
at 1716 cm-1 (C=O stretching). The ratio of the carbonyl peak area between 1900 and
1625 cm-1 and the peak area at 723 cm-1 attributed to the aromatic ring was calculated.
The value of that ratio in excess over its starting value is defined as the “carbonyl
index” and is used as a measure of the formation of carbonyl groups.
Size exclusion chromatography (SEC) was carried out using a WATERS 2695
separation module and a Model 2414 refractive index detector at 40 °C using an
injection volume of 50 µL. The column set consisted of a Polymer Laboratories PLgel

Correlations between chemical and physical changes of polyester coatings under UV
111
guard column (5 µm particles, 50 × 7.5 mm), followed by two PLgel mixed-C
columns (5 µm particles, 300 × 7.5 mm), calibrated at 40 °C using polystyrene
standards (Polymer Laboratories, M = 580 up to M = 7.1*106 g/mol). Tetrahydrofuran
(Biosolve, stabilised with BHT) was used as eluent at a flow rate of 1.0 ml/min. Prior
to the SEC analysis, the polyester was removed from the substrate and dissolved in
THF. In the case of aged polyester the insoluble (crosslinked gel) part of the polymer
was removed by filtration (0.2 µm PTFE filter) and the soluble part (concentration ~
5mg/ml in THF) was analyzed. Data acquisition and processing were performed using
WATERS Empower 2 software. Chromatograms were scaled to the maximum peak
height.
Gel fractions were measured gravimetrically. The adhesion of the polyester
coating to the aluminium substrate was very high and peeling off the coating for gel
fraction measurement was not possible. Instead the weight of the coating together
with the substrate was measured first. Later, the polyester was washed with THF off
the substrate and the weight of the bare substrate was measured. The soluble part of
polyester was separated from the gel part by filtration (0.2 µm PTFE filter). After
evaporation of THF (vacuum oven, 24 hours at 75 ○C) the weight of the soluble
fraction was measured. From the weights of the coating with substrate, the bare
substrate and the soluble fraction, the weight of the gel fraction was calculated.
Depth-sensing indentation was performed with a TriboIndenter (Hysitron),
equipped with a 2D-transducer and a Berkovich tip, on polyester coatings at 25 °C
and reduced humidity (13.2 ± 0.3 % RH). As the maximum indentation depth was at
most 9% of the total coating thickness (12 µm), the obtained hardness was not
influenced by the properties of the aluminum coating substrate. A loading scheme of
10 s loading to maximum load (Pmax), 10 s hold at maximum load and 1 s unloading
was applied. For each sample, at least one series of 10 experiments was performed in
which the maximum load was varied in steps of 300 µN from 3,000 µN to 300 µN.
For coatings that exhibited a relatively high surface roughness and low thickness
(PNT after 4,000, 5,000 and 6,000 hours of ageing in a Suntest XXL+) additionally, a
series of 8 measurements was performed at higher load levels, namely ranging from
4200 to 2100 µN. The first two measurements of each series were disregarded to
exclude the effect of thermal drift. For samples where two or more series of ten
indents were made, no significant differences were observed between the series.

Chapter 6
112
The indentation load-displacement responses were analyzed using the
procedure proposed by Oliver and Pharr[14]. The mean contact pressure is taken as a
measure of the hardness H of the material:
A
PH max= (1)
where Pmax is the load at the beginning of the unloading and A is the projected contact
area, which depends on the contact depth hc and the tip shape. The tip area function
calibration was performed on polystyrene, assuming a constant elastic modulus for
polystyrene in the contact depth range from 126 to 954 nm (Appendix 6.1). The
unloading responses were fitted from 0.95·Pmax to 0.20·Pmax with the conventional
power law form to obtain the slope at the start of the unloading S, that is used in the
calculation of the contact depth[14]. The obtained fits match well with the unloading
responses even outside of the range used for fitting: R2 was observed to be larger than
0.999. The power law exponents ranged from 1.6 to 2.4. The cause for lower values
than the value of 2, expected for the contact of a cone onto an elastic halfspace[15], are
discussed by Bolsakov and Pharr[16]. For some of the fits power values higher than 2
were obtained. This possibly is attributable to non-linear elastic and visco-elastic
response of the polymer material. We noted that the hardness decreased with the
contact depth. Therefore, in order to achieve a fair comparison, the hardness was
evaluated at constant contact depth (400 nm, for the higher load series 550 nm) for the
various ageing conditions (evaluation at another contact depth gives the same trends
at somewhat shifted hardness values, Appendix 6.1), whereby a linear fit was applied
to the hardness data as function of contact depth for the various ageing conditions.
It is acknowledged that the procedure to calculate the projected contact area
has been developed for elastic-plastic materials and the actual projected contact area
may be somewhat different for visco-elastic-plastic materials such as polymers[17,18].
So, the hardness obtained by indentation depends on experimental settings such as the
loading and unloading rate[19-21]. We ascertained that the creep rate at the end of the
hold period is small enough to safely ignore the effect of creep on the hardness.
Though depth-scanning indentation does not provide absolute values for the hardness,
the obtained hardness can be used as a reliable measure to compare different samples.
Scanning Electron Microscopy was performed using the Phenom™ Desktop
SEM (FEI Company).
Correlations between chemical and physical changes of polyester coatings under UV
113
6.3 Results 6.3.1 PNI exposed in the UVACUBE (λ > 254 nm)
6.3.1.1 Chemical characterization
ATR-FTIR analysis
The formation of functional groups at the surface of the polyester coating
during photodegradation was examined with ATR-FTIR. Figure 6.1 shows changes in
the carbonyl region of the polyester exposed to UV in nitrogen and in air atmosphere
at 68 °C. The corresponding changes in the hydroxyl region are presented in Figure
6.2 Ageing of polyester coatings in nitrogen leads only to little changes in the ATR-
FTIR spectra as compared to ageing in air atmosphere. The development of carbonyl
groups (1850 – 1600 cm-1) is probably caused by the formation of anhydrides,
carboxylic acids and aldehydes. The increased absorption in the OH region (3600 –
2500 cm-1) can by attributed to hydroxyl groups originating from carboxylic acid
(mentioned above), alcohol and hydroperoxide.
In addition, ageing of PNI in nitrogen and air was performed at 43 °C (Figures
6.3 and 6.4). Ageing at 43 °C leads to qualitatively similar changes in the FTIR
spectra as at 68 °C. However, the rate of the changes at 43 °C is lower.
Overall, the rate of formation of polar groups (C=O, OH) at the polyester
coating surface increases as a function of exposure time (10 and 20 hours) and
temperature (43 and 68 °C). However, the most important factor determining the
development of polar groups is the atmosphere (air vs. nitrogen). Figure 6.5 shows the
development of the carbonyl index of the polyester coating when UV irradiated in
nitrogen and air at 43 and 68 °C. Only exposure in air atmosphere leads to significant
surface changes as observed with ATR-FTIR.
The differences in the formation of functional groups in air and nitrogen can
obviously be explained by the accepted mechanism of photooxidation and photolysis.
Under influence of UV irradiation, the polyester chains break-down (photolysis) and
radicals are formed. Under nitrogen, these radicals can only abstract hydrogen or
recombine. As a consequence of the hydrogen abstraction, only a small amount of
additional hydroxyl and carbonyl groups can be formed. This explains the relatively
small changes observed with ATR-FTIR of coatings aged in nitrogen. In an air
atmosphere, the same radicals, apart from hydrogen abstraction and recombination,
can react with oxygen (photooxidation) and form numerous new hydroxyl and
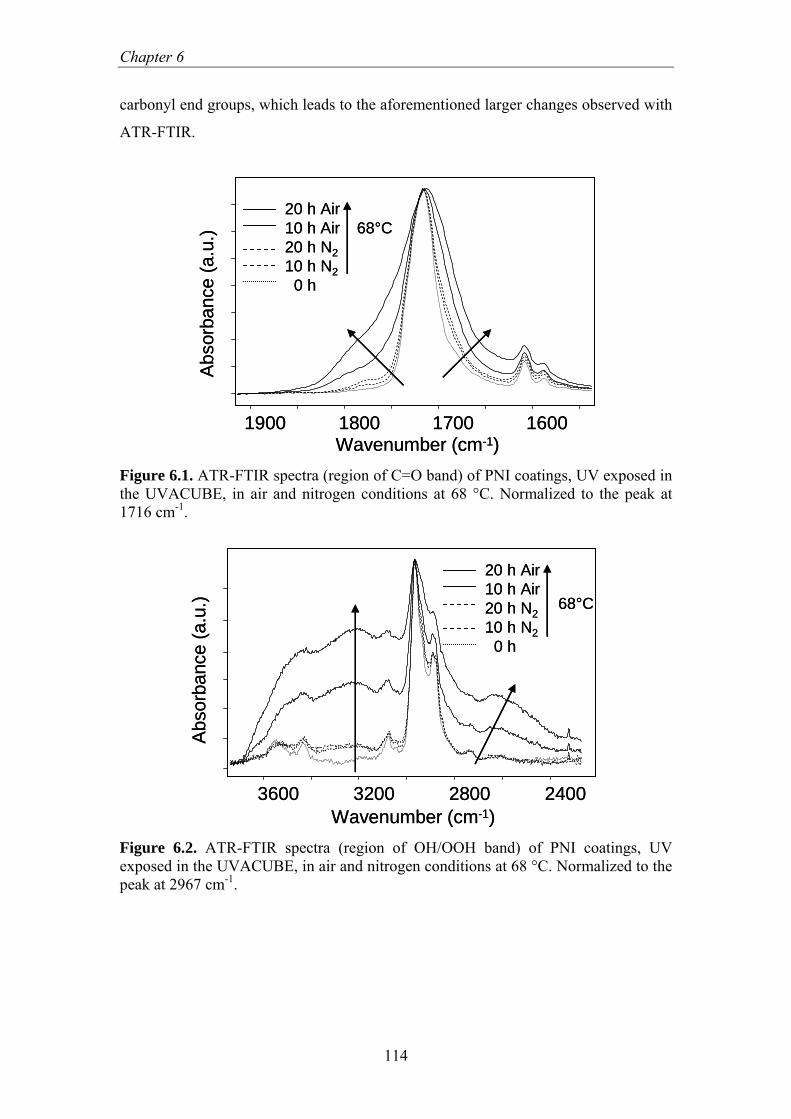
Chapter 6
114
carbonyl end groups, which leads to the aforementioned larger changes observed with
ATR-FTIR.
1900 1800 1700 1600Wavenumber (cm-1)
Abs
orba
nce
(a.u
.)20 h Air10 h Air 20 h N2 10 h N2
0 h
68°C
1900 1800 1700 1600Wavenumber (cm-1)
Abs
orba
nce
(a.u
.)20 h Air10 h Air 20 h N2 10 h N2
0 h
68°C
Figure 6.1. ATR-FTIR spectra (region of C=O band) of PNI coatings, UV exposed in the UVACUBE, in air and nitrogen conditions at 68 °C. Normalized to the peak at 1716 cm-1.
20 h Air10 h Air20 h N2 10 h N2
0 h
3600 3200 2800 2400Wavenumber (cm-1)
Abs
orba
nce
(a.u
.) 68°C
20 h Air10 h Air20 h N2 10 h N2
0 h
3600 3200 2800 2400Wavenumber (cm-1)
Abs
orba
nce
(a.u
.) 68°C
Figure 6.2. ATR-FTIR spectra (region of OH/OOH band) of PNI coatings, UV exposed in the UVACUBE, in air and nitrogen conditions at 68 °C. Normalized to the peak at 2967 cm-1.

Correlations between chemical and physical changes of polyester coatings under UV
115
1900 1800 1700 1600Wavenumber (cm-1)
Abs
orba
nce
(a.u
.)
20 h Air10 h Air 20 h N2 10 h N2
0 h
43°C
1900 1800 1700 1600Wavenumber (cm-1)
Abs
orba
nce
(a.u
.)
20 h Air10 h Air 20 h N2 10 h N2
0 h
43°C
Figure 6.3. ATR-FTIR spectra (region of C=O band) of PNI coatings, UV exposed in the UVACUBE, in air and nitrogen conditions at 43 °C. Normalized to the peak at 1716 cm-1.
20 h Air 10 h Air 20 h N2 10 h N2
0 h
3600 3200 2800 2400Wavenumber (cm-1)
Abs
orba
nce
(a.u
.)
43°C
20 h Air 10 h Air 20 h N2 10 h N2
0 h
3600 3200 2800 2400Wavenumber (cm-1)
Abs
orba
nce
(a.u
.)
43°C
Figure 6.4. ATR-FTIR spectra (region of OH/OOH band) of PNI coatings, UV exposed in the UVACUBE, in air and nitrogen conditions at 43 °C. Normalized to the peak at 2967 cm-1.

Chapter 6
116
0 5 10 15 20 25
0.0
0.5
1.0
1.5
2.0
2.5
3.0
N2 68oC
N2 43oC
AIR 43oC
AIR 68oC
Car
bony
l Ind
ex
Time (hours)
Figure 6.5. Carbonyl index of PNI coatings UV exposed in the UVACUBE, in air and nitrogen at 43 and 68 °C.
SEC analysis and gel formation.
Size Exclusion Chromatography was performed to determine changes in
molecular weight. Figures 6.6 and 6.7 show SEC chromatograms of the polyester
aged in nitrogen and in air at 68 °C and at 43 °C, respectively. As can be seen, both
molecules with higher and with lower molecular weight are formed during UV
exposure in nitrogen and air. This indicates that chain scission and crosslinking
reactions take place simultaneously. The extent of both chain scission and
crosslinking increases with time (10 and 20 hours) and temperature (43 and 68 °C) of
UV exposure. The rates of both reactions differ between air and nitrogen conditions.
However, the influence of air on the extent of the chain scission and crosslinking is
not as much pronounced as on formation of polar groups at the surface observed with
ATR-FTIR.
Extensive crosslinking leads to gel (insoluble crosslinked molecules)
formation. Figure 6.8 shows the amount of gel collected from the polyester aged in
nitrogen and air atmosphere at 43 and 68 °C. Also in this case, the extent of gel
fraction increases with increasing time (10 and 20 hours), and temperature (43 and 68
°C). Moreover, the atmosphere (nitrogen and air) of ageing has a very important
effect.
The difference between air and nitrogen for the extent of chain fragmentation
and crosslinking can be explained by the chemistry of the degradation processes. In

Correlations between chemical and physical changes of polyester coatings under UV
117
nitrogen some of the radicals formed during photolysis can recombine and form
carbon-to-carbon crosslinked molecules. In air, besides the radicals resulting from
direct photolysis, photooxidative decomposition of the polymer chain leads to
additional radical formation. The mechanism of photooxidation is known to involve
hydroperoxide formation, which after decomposition result in a higher total number of
radicals present in air as compared to nitrogen. A higher concentration of radicals
implies a higher probability of recombination and higher rate of crosslinking (gel
formation). Besides of carbon to carbon recombination, also ether and perether
bridges can be formed.
Sca
led
dete
ctor
resp
onse
(a.u
.)
Time (min)10 11 12 13 14 15 16 17 18 19
20 h Air10 h Air 20 h N2 10 h N2
0 h
68°C
Sca
led
dete
ctor
resp
onse
(a.u
.)
Time (min)10 11 12 13 14 15 16 17 18 19
20 h Air10 h Air 20 h N2 10 h N2
0 h
68°C
Figure 6.6. SEC chromatograms of PNI coatings, UV exposed in the UVACUBE, in air and nitrogen conditions at 68 °C.

Chapter 6
118
Sca
led
dete
ctor
resp
onse
(a.u
.)
Time (min)10 11 12 13 14 15 16 17 18 19
20 h Air10 h Air 20 h N2 10 h N2
0 h
43°C
Sca
led
dete
ctor
resp
onse
(a.u
.)
Time (min)10 11 12 13 14 15 16 17 18 19
20 h Air10 h Air 20 h N2 10 h N2
0 h
43°C
Figure 6.7. SEC chromatograms of PNI coatings, UV exposed in the UVACUBE, in air and nitrogen conditions at 43 °C.
0 5 10 15 20 25
0
5
10
15
20
25
30
N2 43oC
AIR 43oCN2 68oC
AIR 68oC
Gel
frac
tion
(%)
Time (hours) Figure 6.8. Gel fractions in PNI coatings, UV exposed in the UVACUBE, in air and nitrogen conditions at 43 and 68 °C.
6.3.1.2 Surface hardness
In Figures 6.9 and 6.10 load-displacement responses are shown for PNI after
ageing in nitrogen and air at 43 and 68 °C, respectively. The most compliant response
is that of the starting material. Upon ageing, the material gets stiffer, especially when
the ageing is performed in air. From these load-displacement responses, the hardness
was evaluated using the method proposed by Oliver and Pharr[14]. These results are
summarized in Figure 6.11. The hardness increases as a function of exposure time
(10 and 20 hours) and temperature of ageing (43 and 68 °C). However, the

Correlations between chemical and physical changes of polyester coatings under UV
119
atmosphere of ageing (air vs. nitrogen) was found to be the most important factor
influencing the surface hardness of coatings. UV exposure of these polyester coatings
for 20 hours at 68 °C under air leads to an increase of hardness for approximately
30% and under nitrogen only of approximately 7%. Ageing for 20 hours performed at
43 °C under air leads to an increase of hardness of about 18% and in nitrogen
atmosphere of about 5%.
0 100 200 300 400 500 6000
400
800
1200
1600Ageing at 43 °C
20 h Air10 h Air20 h N210 h N2 0 h
Load
(µN
)
Displacement (nm) Figure 6.9. Load-displacement responses of PNI coatings, UV exposed in the UVACUBE, in air and nitrogen conditions at 43 °C. The fitted unloading curve is within the resolution of the unloading data points (this also apply to Figures 6.10 and 6.15).
0 100 200 300 400 500 6000
400
800
1200
1600Ageing at 68°C
20 h Air10 h Air 20 h N210 h N2 0 h
Load
(µN
)
Displacement (nm) Figure 6.10. Load-displacement responses of PNI coatings, UV exposed in the UVACUBE, in air and nitrogen conditions at 68 °C.

Chapter 6
120
0 5 10 15 20 250.26
0.28
0.30
0.32
0.34
0.36
N2 43oC
AIR 43oC
N2 68oC
AIR 68oC
Har
dnes
s (G
Pa)
Time of ageing (hour) Figure 6.11. Development of hardness of PNI coatings, UV exposed in the UVACUBE, in air and nitrogen, at 43 and 68 °C.
6.3.1.3 Discussion
As shown above, photodegradation strongly influences the chemical
composition of polyester coatings and this finds reflection in their surface mechanical
properties. There are three main mechanisms of photodegradation of polyester
(photolysis, photooxidation and photocrosslinking) which can influence the
mechanical properties. These mechanisms are interrelated. However, for sake of
clarity their influence on physical properties will be discussed separately.
Photocrosslinking leads to gel formation. The presence of three dimensional
networks is a possible explanation for the significant hardness increase of coatings.
The highest gel fraction was found for coatings aged for 20 hours at 68 °C under air
conditions. Indeed, these coatings show the highest hardness. However, the gel
fraction and hardness data show no clear correlation. For instance, ageing of polyester
coatings for 20 hours at 43 °C under air and for 20 hours at 68 °C in nitrogen result in
similar gel fractions (~17%) but different hardnesses. The hardness of the coating
aged in air increases by about 18% and the one aged in nitrogen by about 7% only.
This shows that there must be at least one additional factor affecting the hardness of
polyester coating.
Photolysis leads to chain scission. Related to the phenomenon of “physical
ageing” of glassy polymers it has been suggested that due to faster relaxation of
smaller molecules in the glassy state an increase of hardness can take place[8]. On the
other hand it has also been proposed that fragmentation can lead to a decrease of the
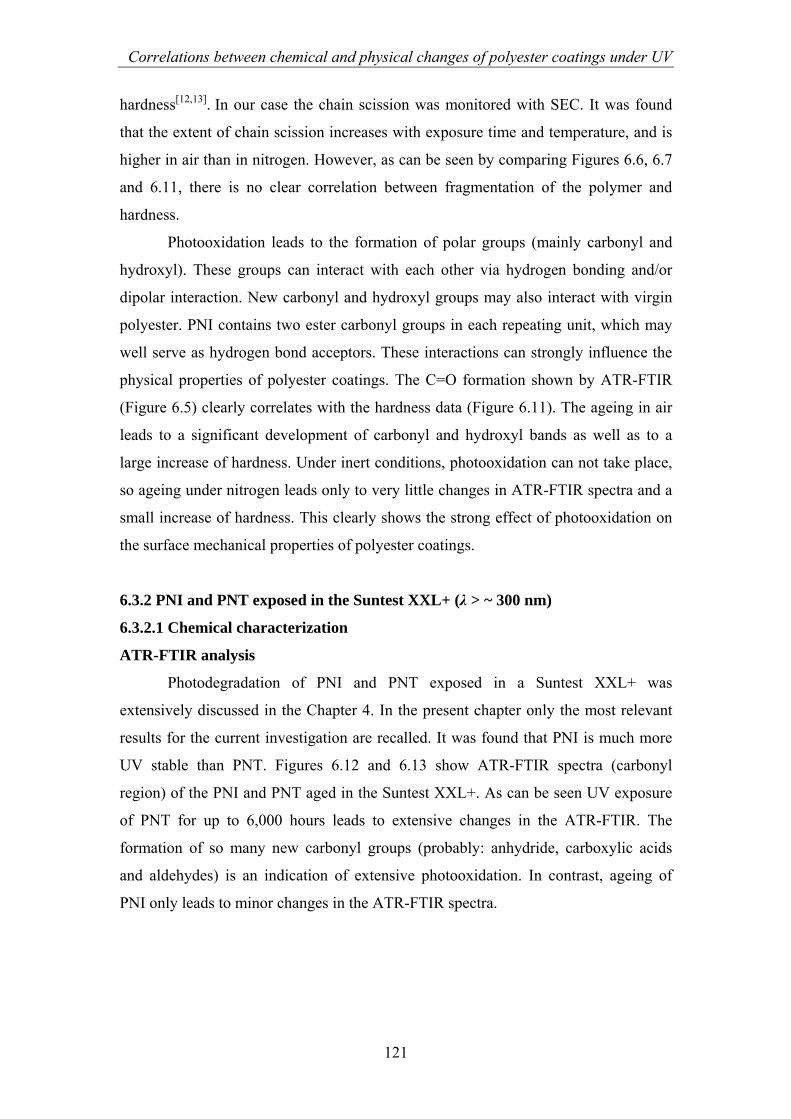
Correlations between chemical and physical changes of polyester coatings under UV
121
hardness[12,13]. In our case the chain scission was monitored with SEC. It was found
that the extent of chain scission increases with exposure time and temperature, and is
higher in air than in nitrogen. However, as can be seen by comparing Figures 6.6, 6.7
and 6.11, there is no clear correlation between fragmentation of the polymer and
hardness.
Photooxidation leads to the formation of polar groups (mainly carbonyl and
hydroxyl). These groups can interact with each other via hydrogen bonding and/or
dipolar interaction. New carbonyl and hydroxyl groups may also interact with virgin
polyester. PNI contains two ester carbonyl groups in each repeating unit, which may
well serve as hydrogen bond acceptors. These interactions can strongly influence the
physical properties of polyester coatings. The C=O formation shown by ATR-FTIR
(Figure 6.5) clearly correlates with the hardness data (Figure 6.11). The ageing in air
leads to a significant development of carbonyl and hydroxyl bands as well as to a
large increase of hardness. Under inert conditions, photooxidation can not take place,
so ageing under nitrogen leads only to very little changes in ATR-FTIR spectra and a
small increase of hardness. This clearly shows the strong effect of photooxidation on
the surface mechanical properties of polyester coatings.
6.3.2 PNI and PNT exposed in the Suntest XXL+ (λ > ~ 300 nm)
6.3.2.1 Chemical characterization
ATR-FTIR analysis
Photodegradation of PNI and PNT exposed in a Suntest XXL+ was
extensively discussed in the Chapter 4. In the present chapter only the most relevant
results for the current investigation are recalled. It was found that PNI is much more
UV stable than PNT. Figures 6.12 and 6.13 show ATR-FTIR spectra (carbonyl
region) of the PNI and PNT aged in the Suntest XXL+. As can be seen UV exposure
of PNT for up to 6,000 hours leads to extensive changes in the ATR-FTIR. The
formation of so many new carbonyl groups (probably: anhydride, carboxylic acids
and aldehydes) is an indication of extensive photooxidation. In contrast, ageing of
PNI only leads to minor changes in the ATR-FTIR spectra.

Chapter 6
122
Abs
orba
nce
(a.u
.)
Wavenumber (cm-1)1900 1800 1700 1600
10000 h9000 h8000 h7000 h6000 h5000 h4000 h3000 h2000 h1000 h
0 hAbs
orba
nce
(a.u
.)
Wavenumber (cm-1)1900 1800 1700 1600
10000 h9000 h8000 h7000 h6000 h5000 h4000 h3000 h2000 h1000 h
0 h
Wavenumber (cm-1)1900 1800 1700 1600
10000 h9000 h8000 h7000 h6000 h5000 h4000 h3000 h2000 h1000 h
0 h
Figure 6.12. ATR-FTIR spectra (region of C=O band) of PNI coating surface, aged in the Suntest XXL+ for up to 10,000 hours. Normalized to the peak at 1716 cm-1.
1900 1800 1700 1600Wavenumber (cm-1)
Abs
orba
nce
(a.u
.)
6000 h5000 h4000 h3000 h2000 h1000 h
0 h
1900 1800 1700 1600Wavenumber (cm-1)
Abs
orba
nce
(a.u
.)
6000 h5000 h4000 h3000 h2000 h1000 h
0 h
Figure 6.13. ATR-FTIR spectra (region of C=O band) of PNT coating surface, aged in the Suntest XXL+ for up to 6,000 hours. Normalized to the peak at 1716 cm-1.
Gel fraction
Crosslinking leads to gel (insoluble crosslinked molecules) formation. Figure
6.14 shows the amount of gel collected from UV exposed PNI and PNT. Ageing of
PNT leads to extensive gel formation. After 2,000 hours of UV exposure the gel
fraction reached about 50% and only slightly increased after an additional 1,000 hours
of ageing. Further UV exposure leads to the decomposition of the gel which results in
reduction of the gel fraction to about 40% after 6,000 hours of ageing. In case of PNI
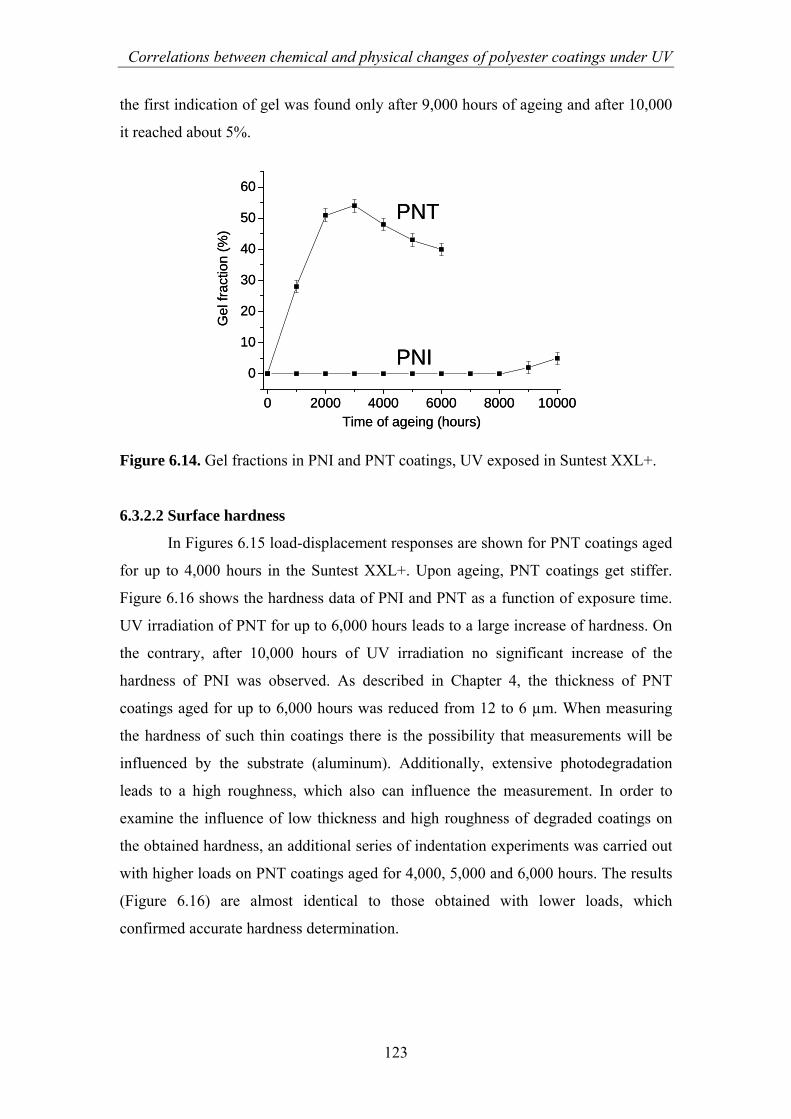
Correlations between chemical and physical changes of polyester coatings under UV
123
the first indication of gel was found only after 9,000 hours of ageing and after 10,000
it reached about 5%.
0 2000 4000 6000 8000 10000
0
10
20
30
40
50
60
Gel
frac
tion
(%)
Time of ageing (hours)
PNI
PNT
0 2000 4000 6000 8000 10000
0
10
20
30
40
50
60
Gel
frac
tion
(%)
Time of ageing (hours)
PNI
PNT
Figure 6.14. Gel fractions in PNI and PNT coatings, UV exposed in Suntest XXL+.
6.3.2.2 Surface hardness
In Figures 6.15 load-displacement responses are shown for PNT coatings aged
for up to 4,000 hours in the Suntest XXL+. Upon ageing, PNT coatings get stiffer.
Figure 6.16 shows the hardness data of PNI and PNT as a function of exposure time.
UV irradiation of PNT for up to 6,000 hours leads to a large increase of hardness. On
the contrary, after 10,000 hours of UV irradiation no significant increase of the
hardness of PNI was observed. As described in Chapter 4, the thickness of PNT
coatings aged for up to 6,000 hours was reduced from 12 to 6 µm. When measuring
the hardness of such thin coatings there is the possibility that measurements will be
influenced by the substrate (aluminum). Additionally, extensive photodegradation
leads to a high roughness, which also can influence the measurement. In order to
examine the influence of low thickness and high roughness of degraded coatings on
the obtained hardness, an additional series of indentation experiments was carried out
with higher loads on PNT coatings aged for 4,000, 5,000 and 6,000 hours. The results
(Figure 6.16) are almost identical to those obtained with lower loads, which
confirmed accurate hardness determination.
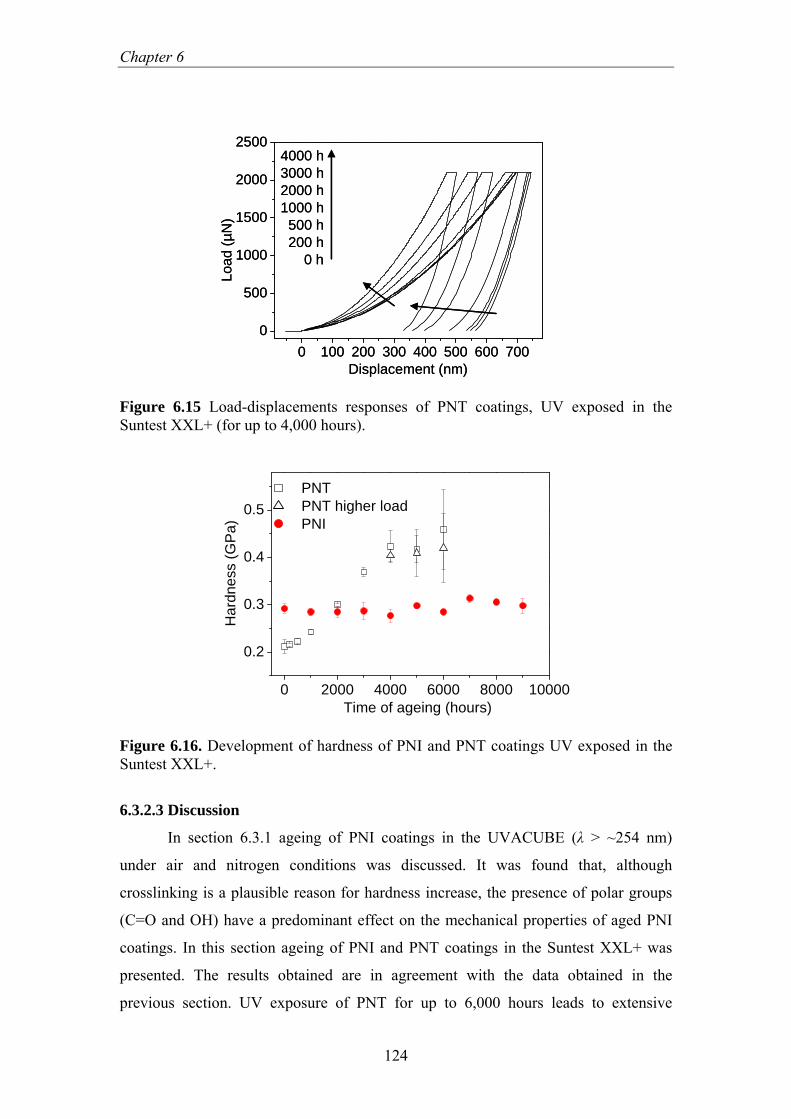
Chapter 6
124
0 100 200 300 400 500 600 7000
500
1000
1500
2000
25004000 h3000 h2000 h1000 h 500 h 200 h 0 h
Load
(µN
)
Displacement (nm)0 100 200 300 400 500 600 700
0
500
1000
1500
2000
25004000 h3000 h2000 h1000 h 500 h 200 h 0 h
Load
(µN
)
Displacement (nm)
Figure 6.15 Load-displacements responses of PNT coatings, UV exposed in the Suntest XXL+ (for up to 4,000 hours).
0 2000 4000 6000 8000 10000
0.2
0.3
0.4
0.5 PNT PNT higher load PNI
Har
dnes
s (G
Pa)
Time of ageing (hours)
Figure 6.16. Development of hardness of PNI and PNT coatings UV exposed in the Suntest XXL+.
6.3.2.3 Discussion
In section 6.3.1 ageing of PNI coatings in the UVACUBE (λ > ~254 nm)
under air and nitrogen conditions was discussed. It was found that, although
crosslinking is a plausible reason for hardness increase, the presence of polar groups
(C=O and OH) have a predominant effect on the mechanical properties of aged PNI
coatings. In this section ageing of PNI and PNT coatings in the Suntest XXL+ was
presented. The results obtained are in agreement with the data obtained in the
previous section. UV exposure of PNT for up to 6,000 hours leads to extensive

Correlations between chemical and physical changes of polyester coatings under UV
125
photodegradation. Polar groups and hardness of PNT increase also as a function of
exposure time. The gel fraction rises for samples aged up to 3,000 hours. Even though
further UV irradiation leads to a slight decrease of the gel fraction, the hardness still
increases, as does the amount of polar groups. Ageing of PNI under these conditions
resulted in relatively small changes in the carbonyl region of the ATR-FTIR spectra,
and only in a small gel fraction. This resulted in a rather insignificant hardness
increase.
A large increase in hardness is also an indication of rising stresses in the
coating which may lead to cracking of material[22]. This phenomenon was indeed
observed for PNT coatings aged for 4,000 hours and longer. Figures 6.17, 6.18 and
6.19 show SEM graphs of PNT non-aged, aged for 4,000 hours and for 5,000 hours
respectively. UV exposure of PNI coatings resulted in insignificant increase in
hardness and no cracking was observed.
In section 6.3.1 PNI coatings aged in the UVACUBE (λ > ~254 nm) were
investigated. Also in that case an increase of hardness (up to 30%) was observed but
no cracking was noticed. This is probably due to the much lower extent of
degradation of PNI coatings in the UVACUBE than of PNT in the Suntest XXL+. In
case of PNT aged in a Suntest XXL+, the first cracking was noticed when the
hardness was increased by about 100% (Figure 6.18, PNT aged for 4,000 hours).
250 µm250 µm
Figure 6.17. SEM graph of non-aged PNT coating.
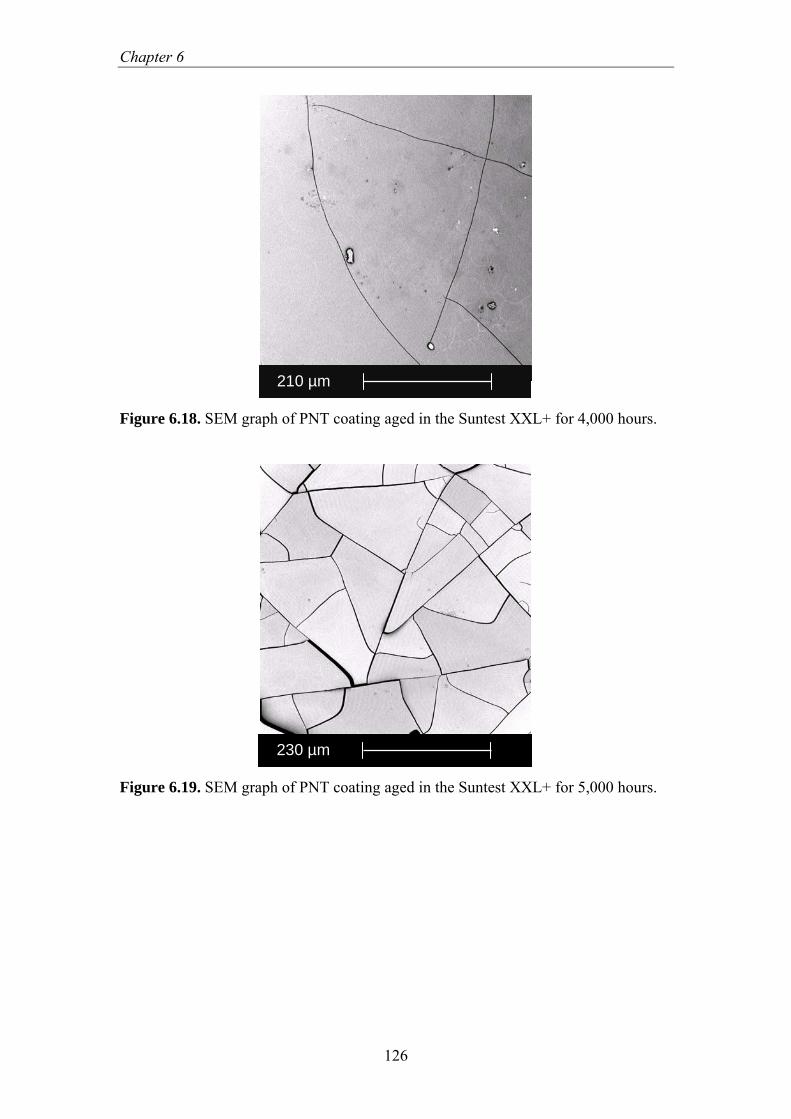
Chapter 6
126
210 µm210 µm
Figure 6.18. SEM graph of PNT coating aged in the Suntest XXL+ for 4,000 hours.
230 µm230 µm
Figure 6.19. SEM graph of PNT coating aged in the Suntest XXL+ for 5,000 hours.

Correlations between chemical and physical changes of polyester coatings under UV
127
6.4 Conclusions In this chapter the influence of UV induced chemical changes on the surface
physical properties of poly(neopentyl phthalate) coatings was investigated.
In the first part of the investigation, in order to distinguish between different
reactions and their relative importance to changes in the physical properties,
poly(neopentyl isophthalate) (PNI) coatings were aged under different conditions (air
vs. nitrogen) in the UVACUBE (λ > ~254 nm). Ageing in air leads to an extensive
development of carbonyl and hydroxyl groups, which is attributed to photooxidation.
In contrast, UV exposure in nitrogen leads only to minor changes in the infrared
spectra. In addition, the number of carbonyl and hydroxyl groups increases as a
function of exposure time and temperature. UV exposure leads to both chain scission
and crosslinking. Extensive crosslinking results in gel formation. The rate of both
chain scission and crosslinking is higher when the polyester is UV exposed in air, as
compared to nitrogen conditions, and increases with time and temperature of ageing.
The surface hardness of PNI increases with time and temperature of exposure. It was
found that photooxidation has the most dominant influence on the hardness. Carbonyl
and hydroxyl groups formed during this process can interact with each other or with
the virgin polymer via hydrogen bonding and dipolar interaction, and in this way
strongly increase the surface hardness of coatings.
In the second part, photodegradation of PNI and PNT coatings aged in a
Suntest XXL+ was studied. Chemical characterization (ATR-FTIR, gel fraction) of
both polyesters showed that PNI is much more UV stable than PNT. This clearly is
reflected in mechanical properties. The extensive chemical changes taking place in the
structure of PNT leads to significant increase of hardness which resulted in cracking.
In this case a typical weathering pathway was observed. UV exposure caused
chemical changes (formation of polar groups, gel) in the structure of PNT, which
resulted in physical changes (increase of hardness) and as a consequence of increased
stress failure of the coating (cracking). PNI showed a much lower extent of
degradation and as a consequence a minor increase of hardness and no cracking.

Chapter 6
128
References
1. Rabek JF, Polymer photodegradation - mechanisms and experimental methods,
1st ed. UK: Chapman and Hall, London, 1995.
2. Baljit S, Sharma N. Polym Degrad Stab 2008;93:561-584.
3. White JR. Turnbull AJ. J Mater Sci 1994;29:584-613.
4. White JR. C R Chim 2006;9:1396-1408.
5. Nowicki M, Richter A, Wolf B, Kaczmarek H. Polymer 2003;44:6599-6606.
6. Gu X, Michaels CA, Drzal PL, Jasmin J, Martin D, Nguyen T, Martin JW. J Coat
Technol Res 2007;4(4):389-399.
7. Gu X, Nguyen T, Sung LP, VanLandingham MR, Fasolka MJ, Martin JW, Jean
YC, Nguyen D, Chang NK, Wu TY. J Coat Technol Res 2004;1(3):191-200.
8. Skaja A, Fernando D, Croll S. J Coat Technol Res 2006;3(1):41-51.
9. Delobelle P, Guillot L, Dubois C, Monney L. Polym Degrad Stab
2002;77:465-475.
10. Tavares AC, Gulmine JV, Lepienski CM, Akcelrud L. Polym Degrad Stab
2003;81:367-373.
11. Signor AW, VanLandingham MR, Chin JW. Polym Degrad Stab
2003;79:359-368.
12. Mailhot B, Bussière PO, Rivaton A, Morlat-Thérias S, Gardette JL. Macromol
Rapid Commun 2004;25:436-440.
13. Mailhot B, Morlat-Thérias S, Bussière PO, Gardette JL. Macromol Chem Phys
2005;206:585-591
14. Oliver WC, Pharr GM. J Mater Res 1992;7(6):1564-1583.
15. Sneddon IN. Int J Eng Sci 1965;3:47-57.
16. Pharr GM, BolsakovA. J Mater Res 2002;17:2660-2671
17. Oyen ML. Phil Mag 2006;86:5625-5641.
18. Tranchida D, Piccarolo S, Loos J, Alexeev A. Macromolecules
2007;40:1259-1267.
19. Tweedie CA, Van Vliet KJ. J Mater Res 2006;21(12):3029-3036.
20. Oyen, ML. J Biomech 2006;39:2699-2702.
21. Menčík J, Rauchs G, Bardon J, Riche A. J Mater Res 2005;20(10):2660-2669.
22. Oosterbroek M, Lammers RJ, vanderVen LGJ, Perera DY. J Coat Technol 1991;67(797):55-60.
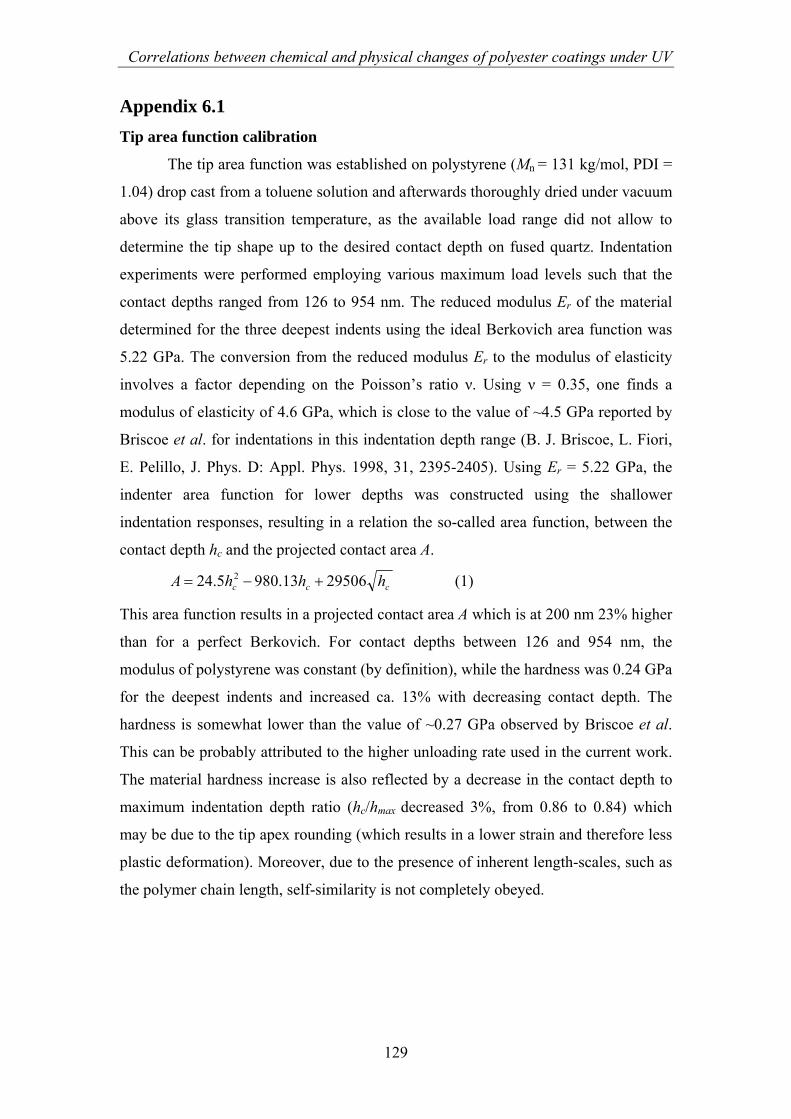
Correlations between chemical and physical changes of polyester coatings under UV
129
Appendix 6.1 Tip area function calibration
The tip area function was established on polystyrene (Mn = 131 kg/mol, PDI =
1.04) drop cast from a toluene solution and afterwards thoroughly dried under vacuum
above its glass transition temperature, as the available load range did not allow to
determine the tip shape up to the desired contact depth on fused quartz. Indentation
experiments were performed employing various maximum load levels such that the
contact depths ranged from 126 to 954 nm. The reduced modulus Er of the material
determined for the three deepest indents using the ideal Berkovich area function was
5.22 GPa. The conversion from the reduced modulus Er to the modulus of elasticity
involves a factor depending on the Poisson’s ratio ν. Using ν = 0.35, one finds a
modulus of elasticity of 4.6 GPa, which is close to the value of ~4.5 GPa reported by
Briscoe et al. for indentations in this indentation depth range (B. J. Briscoe, L. Fiori,
E. Pelillo, J. Phys. D: Appl. Phys. 1998, 31, 2395-2405). Using Er = 5.22 GPa, the
indenter area function for lower depths was constructed using the shallower
indentation responses, resulting in a relation the so-called area function, between the
contact depth hc and the projected contact area A.
ccc hhhA 2950613.9805.24 2 +−= (1)
This area function results in a projected contact area A which is at 200 nm 23% higher
than for a perfect Berkovich. For contact depths between 126 and 954 nm, the
modulus of polystyrene was constant (by definition), while the hardness was 0.24 GPa
for the deepest indents and increased ca. 13% with decreasing contact depth. The
hardness is somewhat lower than the value of ~0.27 GPa observed by Briscoe et al.
This can be probably attributed to the higher unloading rate used in the current work.
The material hardness increase is also reflected by a decrease in the contact depth to
maximum indentation depth ratio (hc/hmax decreased 3%, from 0.86 to 0.84) which
may be due to the tip apex rounding (which results in a lower strain and therefore less
plastic deformation). Moreover, due to the presence of inherent length-scales, such as
the polymer chain length, self-similarity is not completely obeyed.

Chapter 6
130
Evaluation of the hardness of aged PNI at a contact depth of 250 nm
The presented hardness values for PNI after various ageing conditions were
evaluated at a contact depth of 400 nm. In that procedure, a linear fit was applied to
the hardness data as function of contact depth; typically, the applied loading
conditions and maximum load levels resulted in a contact depth range from 160 to
540 nm.
Evaluation at other contact depths than 400 nm results in the same trends with ageing
conditions as shown in Figure 6.20. However, the absolute hardness values are shifted
somewhat. It is noted that, as discussed above, also for polystyrene a hardness
increase is observed upon evaluating the hardness at smaller contact depths (at hc =
400 nm, the hardness of the polystyrene was 0.265 GPa, while at 250 nm a hardness
of 0.271 GPa was evaluated). Below, the hardness for the aged PNI as evaluated at
250 nm is shown.
0 5 10 15 20 25
0.26
0.28
0.30
0.32
0.34
0.36
0.38
N2 43oCN2 68oC
AIR 43oC
AIR 68oC
Har
dnes
s (G
Pa)
Time (hour)
Figure 6.20. Hardness of polyester coatings after various ageing conditions evaluated at a contact depth of 250 nm.

7
Epilogue
Chapter 7
132
In outdoor weathering many factors simultaneously influence the ageing of
polymeric coatings. The cooperative action of UV radiation, heat and moisture can
cause changes in the chemical structure of macromolecules, thus influencing the
physical properties of a coating, and ultimately leading to its failure (cracking, gloss
loss, blistering, etc.) and a reduction of its life-time. The investigation of its
photodegradation is essential to better understand and subsequently improve the
weathering stability of polyester coatings.
The aim of this Thesis was to investigate the molecular mechanism of
photodegradation of poly(neopentyl isophthalate) PNI and poly(neopentyl
terephthalate) PNT, which belong to an important class of polymers used in coating
technology. In order to be able to study the effects of degradation efficiently, we used
non-crosslinked coatings.
In the first part of this work, photodegradation of PNI under highly accelerated
degradation conditions (UVACUBE, λ > ~ 254 nm) was studied. It was shown that
UV exposure of PNI leads to both chain scission and crosslinking occurring
simultaneously. The main focus to this part of work was to establish mechanisms of
photolysis and photooxidation (which mainly lead to decomposition of polyester).
MALDI-ToF MS provided detailed structural information on the degradation
products, which allowed establishing the mechanism of photolysis and photooxidation
of PNI on the molecular level.
It is known that the mechanism of degradation can be affected by highly
accelerated conditions (UVACUBE). In order to verify the established mechanism,
PNI coatings were aged using more realistic method - Suntest XXL+ (λ > ~ 300 nm) -
and exposed outdoors. It was found that the degradation of PNI in both UVACUBE
and Suntest XXL+ experiments leads to similar products, which suggests that similar
mechanism of photolysis and photooxidation of PNI occur under both accelerating
degradation methods. However, the short wavelength UV radiation, present in the
UVACUBE, strongly accelerates the overall rate of photodegradation due to the
higher absorption. The experiments performed outdoors proved that in the initial stage
of ageing under all three degradation conditions (UVACUBE, Suntest XXL+ and
outdoor) similar mechanisms of degradation occur.
In order to prevent photodegradation, photostabilizers are often used. The
mechanisms of photostabilization by such additives are directly related to the
mechanisms of photodegradation. Studying the mechanisms and effects of
Epilogue
133
photostabilization of polymers requires knowledge on the mechanism of
photodegradation. The mechanism proposed in this thesis can well serve for future
studying the mechanism of photostabilization of PNI on the molecular level.
In the next step of our studies the mechanism of photodegradation of PNI and
PNT exposed in the Suntest XXL+ was studied. PNI proved to have a much higher
UV stability as compared to PNT. Nevertheless, it was shown that both polyesters
degrade due to the same mechanism. The higher UV stability of PNI over PNT was
attributed to a higher UV absorption of PNT as compared to PNI. In order to get more
detailed information on these phenomena, it would be desirable to measure the
quantum yield of the photochemical decomposition of both PNI and PNT in future.
Such a measurement performed on model compounds using monochromatic light
could bring more fundamental understanding of differences in UV stability of both
polyesters.
Apart from fragmentation of polyester chains its photodegradation comprises
crosslinking, which leads to insoluble material (gel). The chemistry of decomposition
of polymers was extensively studied in the literature, but limited amount of work was
done on the mechanism of crosslinking as result of photodegradation. In order to
obtain information on the crosslinking at a molecular level the gel material was
decomposed by methanolysis. In this way insoluble material became soluble and
could be analyzed with LC-MS, which allowed the elucidation the mechanism of
crosslinking. This approach appeared to be rather successful and can be used to study
crosslinking of other polyesters.
Although there is a great deal of information available on photodegradation of
polymers both for the chemical and physical aspects, the relationship between these
two aspects is still not well understood. In this work we discuss how a number of
chemical processes correlate with the increase of hardness as was observed upon
ageing of polyester coatings. Polar groups like -OH and -C=O formed during
photooxidation were found to be the predominant factor causing the hardness
increase. The increase of hardness leads to an increase in internal stress of the coating
which in turn, during prolonged ageing, leads to extensive cracking.
This work presents a fundamental approach towards photodegradation and is
only a first step in the long term research program. The general knowledge obtained
in this work should be translated and compared in future to more realistic –
crosslinked – coatings.
Chapter 7
134
Photodegradation is known to be a surface effect. Mainly due to absorption of
UV light and the limited diffusion of oxygen into the polymer bulk, the degradation
takes place mainly in the top layer of a coating. In this work the depth penetration of
light was calculated from the absorption coefficient. In some cases the surface effect
could also be deduced from SEC and gel fraction measurements. However, a more
suitable approach to study the surface effect is cross-sectioning of degraded coatings
and the analysis of such cross-sections. In our case due to the high brittleness and low
thickness of PNI coatings, the proper preparation of cross-sections appeared to be
impossible. Crosslinked coatings are more suitable for the preparation of cross-
sections. In the future, the analysis of such cross-sections should focus both on
chemical and on physical aspects and this should lead to valuable information on the
distribution of products throughout the thickness of coatings. In this case, the depth
profile of degradation predicted from light absorption and diffusion of oxygen can be
directly compared to the experimental data.
135
Summary The molecular mechanism of photodegradation during ageing under UV light
was studied for model polyester coatings of poly(neopentyl isophthalate) PNI and of
poly(neopentyl terephthalate) PNT. The ageing was performed using accelerated
degradation methods in the laboratory (UVACUBE, λ > ~ 254 nm; Suntest XXL+,
λ > ~ 300 nm) as well as outdoors. Changes in the chemical structure of the polymer
caused by UV irradiation were investigated with several analytical techniques. Size
Exclusion Chromatography was performed to determine changes in molecular weight.
It was found that molecules both with higher and with lower molecular weight are
formed, indicating that both chain scission and crosslinking take place
simultaneously. ATR-FTIR spectroscopy was used to monitor the formation and
disappearance of functional groups near the coating surface. Such a surface when
irradiated in air atmosphere exhibits significant chemical changes (the appearance of
carbonyl and hydroxyl/hydroperoxide bands) indicating extensive photooxidation.
Detailed structural information on the products of decomposition was obtained using
MALDI-ToF MS. Based on this highly informative data, the mechanism of photolysis
and photooxidation is described. The mechanism of degradation involves Norrish
(type I) photocleavage of the ester group. Radicals formed due to this reaction can
abstract hydrogen or can react with oxygen and primarily form acid and alcohol end
groups. Moreover, hydrogen abstraction taking place along the polymer backbone
followed by oxidation reactions leads to further fragmentation of the polymer chain.
The photodegradation of PNI aged in the UVACUBE (λ > ~ 254 nm) and in
the Suntest XXL+ (λ > ~ 300 nm) were compared. Under short (λ > ~254 nm) and
long (λ > ~300 nm) wavelength irradiation similar products of degradation are formed
as demonstrated with MALDI-ToF MS. This strongly suggests similar mechanisms of
photolysis and photooxidation under these two different accelerated degradation
conditions. The main effect of the short wavelength radiation is that it dramatically
accelerates the overall rate of photodegradation of PNI as evident from both
experiments and from energy absorption calculations. When comparing the exposure
of PNI in laboratory and outdoors conditions in the initial stage of ageing again
similar degradation products were formed.
A comparison of the degradation products of PNI and PNT, as obtained from a
Suntest XXL+ experiment and analyzed by MALDI-ToF MS, shows that the same

136
type of products are obtained. However, the rate of photodegradation of PNT is much
higher as compared to PNI which is in line with the much higher level of UV
absorption.
Extensive crosslinking leads to the formation of insoluble material (gel). The
chemistry of crosslinking of PNI was studied with methanolysis combined with LC-
MS. It was found that the alkyl radicals formed in the α-position to the ester group can
recombine and form crosslinking species. Additionally the phenyl to phenyl
recombination was confirmed.
The physical properties of coatings will change along with the chemical
changes. In order to investigate the physical properties of aged and non-aged coatings,
nanoindentation tests were performed. The ageing of PNI and PNT coatings leads to
an increase of surface hardness. It was shown that the formation of polar groups like
-OH and -C=O (photooxidation) is the dominant factor causing the increase of
hardness.
137
Acknowledgments During the last four years I have met a number of great people how have
contributed to the work presented in this thesis, and it is my pleasure to acknowledge
them here.
First and foremost, I would like to express my sincere gratitude to my
promoters and supervisors: Prof. dr. Rolf van Benthem, Prof. dr. Bert de With, dr. Jos
Laven and Leo van der Ven. I would like to thank you for giving me the opportunity
to work in SMG group. I am very grateful for your understanding, patience and
constructive support. Your positive attitude and professional guidance have always
been very helpful. I would like to express my appreciation for creating a great
working atmosphere and for the help I have received regarding experimental work as
well as writing this manuscript.
Secondly, I would like to thank the members of the doctoral committee: Prof.
dr. hab. Halina Kaczmarek, Prof. dr. Fred Brouwer and Prof. dr. Cor Koning, for
spending time to evaluate my thesis and sharing their valuable comments and
remarks.
I am grateful to dr. Pieter Gijsman for fruitful discussions and his input to my
work. I would like to thank Saskia Huijser for help with interpretation of complicated
Maldi data. Hans Kranenburg, for nanoindentation measurements and interesting
discussions on “correlations”. For SEM and molecular dynamic simulations, I have to
thank dr. Srdjan Kisin. I am grateful to “Lab-monster” – dr. Tamara Dikic – for
microtoming, XPS and NMR as well as for many interesting discussions. Thanks to
Marjolein Diepens for providing spectral distributions of UV lamps. I would like
extend my thanks to Marion van Straten for Maldi and LC-MS measurements and for
her valuable suggestions, Wieb Kingma for SEC analysis and Otto van Asselen for
FTIR analysis. For designing oxygen uptake instrument and for professional technical
support I would like to thank Huub van der Palen. Many thanks to Marco Hendrix for
SEM and XRD measurements.
I take this opportunity to acknowledge Francesca Scaltro for extensive
discussions on the complicated degradation mechanisms, as well as for all her
assistance with the experimental work.
I am very thankful to Imanda for being a super secretary. Dear Imanda, thank
you for all your help and support I have received last four years.
138
Working in the SMG group was valuable experience. I would like to thank all
former and present members of SMG, especially: Srdjan, Francesca, Tamara, Mark,
Daniela, Olavio, Willem-Jan, Baris, Ming, Marshall, Catarina, Wilfred, Huub, Marco,
Imanda, Svetlana, Beryl, Adolphe, Thanos, Sasha… Thank you for all scientific and
non-scientific discussions as well as parties in the Fort and borrels – It was a great
time !
The last couple of years I have met a number of great people with whom I
spent unforgettable time. Łukasz, Gosia, Kasia, Roy, Francesca, Tamara, Petr, Srdjan,
Mark, Baris, Olavio, Johan, Anka… Thanks for all crazy parties and nice moments
we shared together.
Szczególnie chciałbym podziękować moim rodzicom i dziadkom za naukę,
wiarę i wszystko, co dla minie zrobili. Dziękuję Wam bardo, wasze wsparcie i
modlitwa bardzo mi pomogły. Dziękuję również mojej siostrze i szwagrowi. Wiem,
że zawsze mogę na was liczyć. Specjalne podziękowania dla mojego „złotka”.
Dziękuję Ci Ninka za cierpliwość, wyrozumiałość i za to, że jesteś.
139
Curriculum Vitae
Przemysław Malanowski was born on 9 September 1979 in Golub-Dobrzyń
(Poland). He studied Chemistry at Nicolaus Copernicus University, Toruń (Poland)
and in June 2001 he received his Bachelor degree (B.Sc. Chemistry). Soon after, he
started his Master studies in Chemistry at the same University and in June 2003 he
obtained his M.Sc degree. Part of the Master graduation project entitled
“Biodegradation and photodegradation of polymer blends” was performed at the
Faculty of Chemistry and Industrial Chemistry, University of Genova (Italy). In
August 2004 he started his Ph.D. research in the group of Material and Interface
Chemistry at the Department of Chemical Engineering and Chemistry, Eindhoven
University of Technology (The Netherlands). Within this group he worked under the
supervision of prof. dr. R. A. T. M. van Benthem, prof. dr. G. de With, dr. J. Laven
and L. G. J. van der Ven. The most important results from his Ph.D. work are
described in this Thesis.

140