historical trend of polycyclic aromatic hydrocarbons ... · pdf filea result of high suspended...
TRANSCRIPT

World Journal of Research and Review (WJRR)
ISSN:2455-3956, Volume-5, Issue-4, October 2017 Pages 05-24
5 www.wjrr.org
Abstract— The distribution and historical changes of
polycyclic aromatic hydrocarbons (PAHs) contamination in
recent sediment cores from the Imo River were evaluated
over the last ca 5 decades. The concentrations of total PAHs
(TPAHs-sum of parent and alkyl) ranging from 402.37 ng/g
dry weight (dw) at the top layer of the Estuary site (ES6; 0-5
cm) to 92,388.59 ng/g dw at the near-top layer of the Afam
site (AF5; 5-10 cm) indicated that PAHs contamination was
localized not only between sites but also within the same
cores. Sediment-depth profiles for the four (Afam-AF,
Mangrove-MG, Estuary-ES and illegal Petroleum
refinery-PT) cores generally revealed irregular TPAHs
patterns, except the fact that the levels became maximized at
the near-top layers (5-10 cm; ca.1997-2005). This time-frame
coincided with the period of intensive oil bunkering/pipeline
vandalism by the Niger Delta militant groups. The general
decline in TPAHs levels up-cores to the most recent layers
(0-5 cm) was attributed to the recent offer of amnesty to the
Niger Delta militants and subsequent effort by the Nigerian
government in clamping down the illegal activity of the
economic saboteurs. Examination of perylene distributions
down cores revealed natural terrestrial biogenic, pyrogenic
and non-marine petrogenic origins for the compound at
different sites. Thus, in view of the uncertainty surrounding
the mechanism of perylene formation, the study highlighted
the need for more attention to be paid to the involvement of
terrigenous instead of aquatic OC in arriving at the probable
mechanism for the compound.
Index Terms— Distribution, Historical trend, Imo River,
Origin, Perylene..
I. INTRODUCTION
Polycyclic aromatic hydrocarbons (PAHs) have been
listed as priority compounds due to their carcinogenicity,
mutagenity, acute toxicity and persistency in the
environment [1]. Reports by many researchers have shown
that PAHs are ubiquitous compounds, found in all
compartments of the environment and tend to adsorb to
aquatic sediments ([2], [3]).
As time progresses, the deposition of contaminants led
to the differences in the distribution of PAHs at different
depth intervals. In other words, diverse distributions of
Inyang O. Oyo-Ita, Environmental/Petroleum Geochemistry
Research Group, Department of Pure & Applied Chemistry, University
of Calabar, Nigeria
Orok E. Oyo-Ita, Environmental/Petroleum Geochemistry Research
Group, Department of Pure & Applied Chemistry, University of Calabar,
Nigeria
PAHs in different years are recorded in sediment due to
differences in energy structure and economic development
[4].Therefore, it is very important to analyze sediment
cores in order to understand the historical trends of PAHs
deposition in the Imo river region. So far, the temporal
historical trends of PAHs in sediment cores have been
studied extensively around the world (e.g. [5],[4],[6]), and
many of them show that the temporal trends corresponded
to the vertical distributions in sediment cores. However,
the knowledge of historical trends of PAHs sources in
tropical African countries is relatively limited. To our
knowledge, this is the first investigation on historical
trends of PAHs contamination in the imo river sediments
that reflects events that occurred after the first commercial
discovery of crude oil in Nigeria in 1956.
Previous studies of the river sediment focused mainly
on the surface sediment characterization ([3],[7],[8],[9]).
Radiometric methods have been shown to be
reliable in a large number of dating studies of
sediments, whether such sediment accumulation rates
are uniform or non-uniform [10]. 2 1 0 Pb supply
mechanisms are commonly assessed by three models,
viz. Constant Flux Constant Sedimentation (CFCS),
Constant Rate of Supply (CRS) and Constant Initial
Concentration (CIC). The choice of CRS in the present
investigation was based on the assumption that there is
constant net rate of supply of 210Pb from the water
column to the sediment, irrespective of changes that may
have occurred. The study combined radiometric and
sedimentological investigations to asses’ sedimentation
rates and the chronological succession of sediment layers
that may be related to historical events.
Perylene, a 5-ring PAH has been extensively reported
by many researchers in marine, lake, river and estuarine
sediments to have diverse origins including non-marine
oils [11]; natural gas combustion product ([12],[13]) insitu
terrigenous and/or aquatic organic carbon (OC)
production ([11],[14],[15]) and tropical termite mounds
[16].Thus, the origin of perylene has been a matter of
continued debate as the mechanism of its formation still
remains enigmatic.
The Imo River environment represents one of the
few environments suitable for the investigation of the
diverse origins of perylene with the view to having a better
insight into the mechanism of perylene formation
in the nearest future. This is because its environmental
characteristics provide a veritable means of tracing both
natural (terrestrial or aquatic) and anthropogenic
Historical Trend of Polycyclic Aromatic
Hydrocarbons Contamination in Recent Dated
Sediment Cores from The Imo River, Southeast
Nigeria Inyang O. Oyo-Ita , Orok E. Oyo-Ita

Historical Trend of Polycyclic Aromatic Hydrocarbons Contamination in Recent Dated Sediment Cores from The
Imo River, Southeast Nigeria
6 www.wjrr.org
(petrogenic or pyrogenic) origins for the compound.
Therefore, the main objectives of the present study were
to: (i) delineate the distribution of PAHs in sediment cores
of the study area, (ii) determine the historical trends of
PAHs contamination over the last ca. 5 decades and (iii)
evaluate the diverse origins of perylene in a single
sedimentary environment.
II. STUDY AREA
Details about the study area are described by [9]. Briefly,
the Imo River is one of the tributaries of the southeastern
Niger Delta, Nigeria (Fig. 1). It originates from the hill
region of Imo State and flows through several towns,
villages and farmland areas and empties directly into the
Bight of Bonny, which then flows into the Atlantic Ocean.
The river lies between 5° 55'N and 7° 1'E. It is shallow,
with depth ranging from 1 to 10 m at flood tide and from
less than 1 cm to ca. 8 m maximum at ebb tide. The study
area belongs to the low lying coastal deltaic plain of SE
Nigeria; the terrain is virtually flat or gently undulating,
sloping generally towards the Atlantic [17]. Because of
this, part of its watershed is generally flooded, especially
during intensive rainfall. In March 2012, the Nigerian
hydrological service announced an impending rise in
water height to about 5 m occasioned by global climate
change that subsequently caused devastating
consequences to life and properties of coastal
communities who ignored an early warning of evacuation
from the region to the hinterland. The entire river appears
cloudy (except at the congruence with other tributaries) as
a result of high suspended sediment load due to rapid
weathering. These suspended particles may raise the water
temperature, reducing the oxygen content of the river
water and limiting phytoplankton growth [9].
An important vegetation input to the river
consists of floating grass on the shoreline (which often
forms large floating mats) and mangrove. However, there
are a few industries (e.g. the Afam power station and
fertilizer plant) aligned near part of the riverbank and the
prevalence of illegal oil refinery and bunkering activity,
resulting in spillage.
Geologically, the study area belongs to the SE
part of the Cretaceous and Tertiary sedimentary basin of
the southern Niger Delta.The hydrogeology is related
directly to the structural setting of the Benin Formation
which is the aquiferous layer of groundwater supply. The
layer consists of sand and gravel that are enhanced by
hydraulic conductivity and transmissivity of the
water-producing layer (aquifer) such that the water table is
invariably at shallow depth. However, minor interaction
with shale gives rise to a multi-aquifer system, two
components of which were identified by [17]. The upper
one (Holocene in age) is more prolific, extends to ca. 80 m
and is mainly fine-grained sand. The other (Oligocene) is
less prolific and is beneath this depth. These structural
features provide channels for the flow and accumulation
of ground water, which afford springs and seasonal
streams[17].
III. EXPERIMENTAL METHODS
A. Materials
The following analytical grade solvents including
dichloromethane, methanol, hexane, acetone, isooctane
and ethyl acetate were provided by Dr. Ehrenstofer
GmbH(Augsburg, Germany) and Merck (Hohenbrunn,
Germany). Silica gel (0.063-0.200 mm), anhydrous
sodium sulfate and aluminum oxide active neutral
(0.063-0.200 mm) were also obtained from Merck. The
vessels used for analysis were pre-cleaned with ethyl
acetate followed by acetone and heated at 300 0C
overnight.
B. Samples and Radiometric Analysis
The Imo River was divided into four different sites, each
site made up of one sediment core of 30 cm long (designed
to correspond to a dated time-scale of ca. 5 decades to
coincide with the period of first commercial discovery of
crude oil in Nigeria). Each core was cut into 6 sections of 5
cm interval.
Site I consists of samples obtained near thick
mangrove vegetation stands (MG1-6) expected to contain
dominant terrestrial organic carbon (OC); Site II consists
of samples obtained near Afam Power Station (AF1-6)
where natural gas combustion takes place; Site III consists
of samples collected near illegal local petroleum refinery
site (PT1-6) and Site IV consists of samples collected near
the estuary (ES1-6) where commercial fishery activity
takes place. All cores were collected in 12th August 2013
after the devastating flood episode of 2012 using a
calibrated PVC corer, wrapped with pre-cleaned
aluminum foil, kept in a cooler containing ice, brought to
the laboratory and stored at -20 oC in a deep freeze until
further processing.
Due to tidal influx and mixing arising from sediment
re-suspension, core collected towards the estuary site (ES)
was not well preserved. Thus, radiometric analysis for the
ES core was not possible. Samples from individual layers
were dried at 60 oC for 3 days and then weighed to estimate
dry bulk density and cumulative mass depth. The dried
samples were homogenized with a pestle and mortar before
conditioning and analysis [10]. Samples were analyzed
using direct γ assay (Ortec HPGe GWL series well-type)
housed in a 10 cm Pb shielding with Cu, Cd and plastic
lining, operated under Canberra Genie 2000 software. For
Gamma counting, the samples were put into polystyrene
tubes. Excess 210Pb (210Pbxs) was determined by
subtracting the specific activity of 214Pb (i.e.226Ra) from
the total 210Pb specific activity. This calculation was based
on the assumption that the intermediate daughter product, 222Rn, is in equilibrium with 226Ra. The samples were then
sealed and left for three weeks to allow equilibrium to be
reached before gamma counts were carried out.
Radiometric measurements were performed in a very
low background P-type germanium well detector
(Canberra Industries), which offered a relative efficiency
of 40% and a 4 π counting geometry. The counting device
was placed in a low-level background laboratory, in order
to ensure a very low detection threshold for environmental
radioactivity. Such a precaution was particularly necessary
for the isotopes of interest here (210Pb and 214Pb. Details of
the method are given in Appleby et al. 1992[18].This
World Journal of Research and Review (WJRR)
ISSN:2455-3956, Volume-5, Issue-4, October 2017 Pages 05-24
7 www.wjrr.org
analytical process allowed us to measure 210Pb isotope
with detection limits of below 6mBq/g. The experimental
error for this measurement, taking into account the
different sources of error due to the sampling and
analytical procedures, was approximately ±25%. Counts
were carried out on individual samples for time periods
ranging from 105 to 3 x 10⁵ s. For every 10 samples
analyzed, the background level was measured over periods
of 2 x 10⁵ to 3 x 10⁵s. Sample specific activity A, and total
uncertainties of calculated specific activity values, §A,
were expressed in Becquerel per kilogram of dry weight
(Bq/kgdrywt).The standard deviation expressed the 95%
confidence level [10].
C. Grain Size, Bulk Density, TOC and TN
Determinations
Sediment grain sizes were analyzed using a laser particle
sizer (LS 200, Beckmann-Coulter) with a mesh range of
0.375-1000 µm. A detailed description of these analytical
techniques is given in Strauss et al. (2015)[19].
Bulk density (BD) measurements were performed by
determining the volume of frozen samples with the
Archimedes Principle that involved quantifying the water
displaced in a water-filled glass beaker using a balance
(FCB 8K0.1, Kern; [10]. BD was calculated using the
following equation:
BD [103 kgm-3] = sample dry weight [103 kg]/sample
volume [m3].
Freeze-dried samples were de-carbonated in 85%
syrupy orthophosphoric acid in several stages until
bubbling stopped and rinsed in de-ionised water until
neutral pH. The determination of total organic carbon
(TOC) and total nitrogen(TN) contents was performed by
flash combustion at 1024oC, followed by thermic
conductivity detection in triplicate in a CHNS Elemental
Analyser, Carlo Erbar 1108.
D. Extraction and Clean-up
Prior to extraction protocol, sediment samples were
―spiked‖ with the perdeuterated surrogates
(naphthalene-d8, anthracene-d10, pyrene-d10,
benzo[a]pyrene-d12, benz[a]anthracene-d12 and
triphenylamine(TPhA) as internal standard. Samples (1g
each) were extracted three times by sonication (ultrasons
9L; 360 W average power output and mean operating
frequency of 40 KHz) for 30 min with 15 ml of solvent
mixture (acetone/hexane; 1:1 v/v). After centrifugation at
3500 rpm for 10 min, the clear supernatants were removed
and the combined extract was concentrated to
near-dryness under a stream of pure nitrogen and
re-dissolved in ~0.5 ml hexane prior to clean-up.
Cleanup was performed by adsorption
chromatography in an open glass column packed with 1 g
anhydrous sodium sulfate (top), 2 g neutral alumina
(middle; activated at 400 oC, 5% water deactivated) and
glass wool (bottom). The eluent was concentrated to an
accurate 300 µL by a gentle stream of N2 gas and
preserved in a dark- brown vial prior to gas
chromatography-mass spectrometry (GC-MS) injection.
E. Instrumental Analysis And Quality
Assurance/Control
Analysis of the aromatic fractions was accomplished with
a TRACE GC-MS Thero-Finnigan (Manchester, UK) in
the electron impact (EI) mode at 70 eV. A 30-m,
0.25-mm-inner diameter capillary column coated with
0.25 μm of ZB-5MS stationary phase (Phenomenex
Zebron; USA) was used. The carrier gas was helium with a
constant flow rate of 1.2 ml/min. The injector temperature,
in ―splitless‖ mode, was held at 280 oC and the purge valve
was activated 50 s after the injection. Column temperature
was held at 60 oC for 1 min, then the temperature was
increased to 200 oC at 10 oC/min and finally to 320 oC at
4.8 oC/min, holding that temperature for 10 min. Transfer
line and ion source temperatures were held at 250 oC and
200 oC, respectively. Data were acquired in the SIM mode
with 6 min of solvent delay and processed by the X-calibur
Thermo Finnigan software (San Jose, California, USA).
One analytical blank was run with every batch of
2-5 samples to check background contamination during
the extraction and purification steps. To remove
background contamination, we corrected PAHs
concentrations by subtracting the mean of the analytical
blanks from the concentrations of PAHs. Deuterated
analogues were used for both recovery and quantification
corrections. The analysis of the samples was repeated in
triplicate and relative standard deviations were calculated.
Limits of detection (LOD) and limits of quantification
(LOQ) were estimated as the average signal of the blanks
plus three times the standard deviation of the signal of the
blanks and average signal of the blanks plus ten times the
standard deviation of the signal of the blanks, respectively.
The parent and alkyl PAHs in the samples were
identified on the basis of retention time and ion fragment
profile compared against authentic standards, whereas
quantification was conducted using multipoint internal
calibration method. A calibration curve (detector response
versus amounts injected) was performed for each
compound to be quantified. The linear range of the
detector was estimated from the curve generated by
plotting detector signal versus amount injected. All
measurements were performed in the linear ranges for
each target compound. In few cases, the samples were
re-diluted and re-injected for fitting within the linear range
of the instrument.
IV. RESULTS AND DISCUSSION
A. Sediment Characteristics
The accuracy and reproducibility of the PAH analytical
method were satisfactory. The percentage recoveries of
the 16 priority listed PAHs and others including the
alkylated homologs ranged from 60% to 130% except
naphthalene which had only 40% recovery. The relative
standard deviations of three replicates were less than 20%
except naphthalene (23%). These results were comparable
with those reported by previous workers such as Zheng et
al. (2002)[20] and Ke et al. (2005)[5], and also fulfilled
the acceptance criteria suggested by [21], suggesting that
the analytical procedures were subjected to quality
assurance and quality control.

Historical Trend of Polycyclic Aromatic Hydrocarbons Contamination in Recent Dated Sediment Cores from The
Imo River, Southeast Nigeria
8 www.wjrr.org
The cores were dominated by gray-dark sandy silt
and a minor clay deposits at depths 5-30 cm, whereas a
relatively higher silt/clay fraction were deposited at the top
layers (0-5 cm). The fairly constant bulk density values
recorded for the lower layers (Table 1) suggested
occurrence of a steady sedimentation rates at the three
coring sites. However, the slight decline in bulk density
values at the top layers (0-5 cm) was associated with the
flood episode of 2012, leading to a slight change in the
sedimentation rates at the top layers. In other words,
except for the top layers, no periods of surface mixing
were observed in the vertical structure of the dated
sediments and generally had a well-defined depositional
chronology.
The cores were dated by the application of 210Pb-derived model. The 210Pbxs
specific activity profile
was relatively homogeneous for depths 5-30cm
(3.06-3.24 Bq/kg) and differed at 0-5 cm ((4.24-4.35
Bq/kg; Table 1). The depths at which 210Pbxs specific
activities were homogenous coincided with the depths
5-30 cm and differed from depth 0-5 cm in which
therelatively higher silt/clay content and slight decrease
in bulk density occurred (Table 1).Consequently, the
sediment deposits scenario did not meet the conditions
for applying the CFCS model [10].Therefore, CFCS
could not be used to calculate mean sedimentation rates
for the cores. An alternative way to analyze such a profile
was to assume that there is a constant net rate of supply
of 210Pb from the water column to the sediment,
irrespective of changes that may have occurred in the net
dry mass sedimentation rate[22].Therefore, calculated
ages based on CRS model assumed the constant
sedimentation rates for the whole cores. These
sedimentation rates were derived from the mean slope of 210Pb specific activity plotted on a logarithmic scale.
Mean sedimentation rates for AF, PT and MG cores were
ca. 0.60, 0.58 and 0.62 cm/yr, respectively, with an
overall mean of ca. 0.60±0.07 cm/yr. This mean value
was subsequently used for assessing the historical trends
of contamination by PAHs for the river sediment.
Ages of specific layers were determined by
dividing their depths by the corresponding sedimentation
rates.Age resolution of the cores represents an average
provisional record of ca. 50 yr. of sedimentation
history.Sedimentary records for the river date from ca.
1964 (ca. 8 yr after the first commercial discovery of oil
in Nigeria in 1956) to ca. 2013 (ca. 4 yr after an amnesty
offer to Niger Delta militant groups by the Nigerian
government in 2009).
Total organic carbon (TOC) profiles down cores
exhibited low values that ranged from 0.10% at the
middle layer (PT3; 15-20 cm) of the PT to 1.02% at
near-top layer (AF5; 5-10 cm) of the AF site. These low
TOC values may be a result of poor adsorbability of the
OC on the negatively charge solid matrix (quartz in
nature), shallow water depth, low primary productivity
and the characteristic sheltered basin morphology
predominated by sand fraction [9]. On the other hand, the
total nitrogen (TN) contents did not vary widely with
depth and generally exhibited values <0.05, indicating a
relatively constant and minimal aquatic flora production
down cores [23]. To support the low contribution of
aquatic flora relative to terrestrial OM input, atomic C/N
values for the four cores were calculated and the values
ranged from 18.9 at the near-bottom layer (AF3, 20-25
cm) of AF to 35.3 at the top layer of MG core (MG 6, 0-5
cm; Table 1). Oyo-Ita and Oyo-Ita, (2012)[3] reported a
similar high C/N value for the top layer of Ukwa Ibom
lake sediment, SE Nigeria and attributed the elevated level
to greater wash-in of land-derived OM following
pave-road extension exercise that involved tree
logging/forest clearing. The elevated C/N scenario at the
top layers here most likely reflected the effect of flood
associated with the recent intense rainfall occasioned by
global climate change, carrying larger amounts of
land-derived debris to the river.
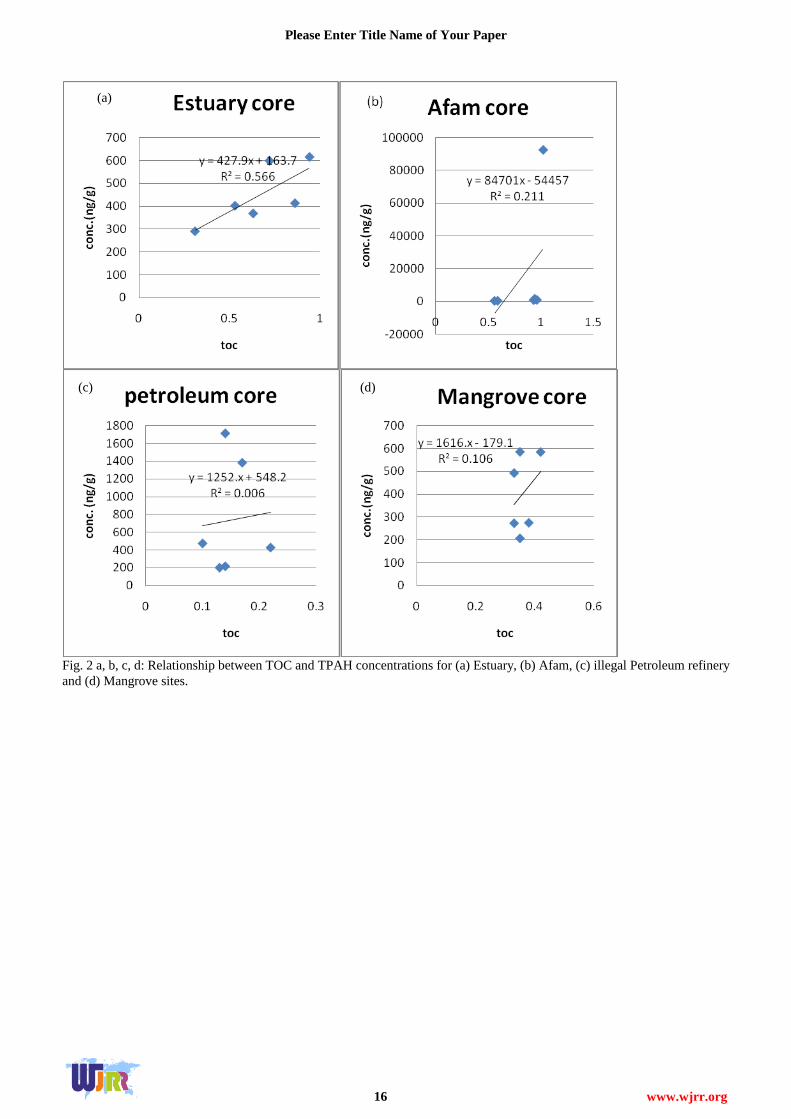
It is a common knowledge that properties of sediment
such as TOC would influence the distribution and
concentrations of PAHs and other hydrophobic organic
compounds (Ke et al. 2005). In the study, a good
correlation existed between TOC contents and TPAH
concentrations for the ES (r2 = 0.5663). However, poor
correlations existed for the PT (r2 = 0.0063), AF (r2 =
0.2113) and MG (r2 = 0.1069) cores (Fig. 2 a, b, c,d). This
means that some local contamination sources might have
interfered in the linear relationship between the PAHs and
OC contents in the study area. Therefore, PAH
concentrations were normalized by the respective OC
contents to eliminate variations generated by the inherent
property of the sediments such as OC.
B. Spatial and Vertical Distribution of PAHs in Estuary
and Afam Cores.
Generally, the spatial variation in PAHs concentrations in
the 6 layers of the four cores might be ascribed to
differences in hydrodynamic regimes related to the present
and past river discharges and tidal influx, changes in
sediment particle size characteristics in the individual
cores and non-homogenous inputs from point- and
non-point-sources of PAHs in the region [24].
The PAHs distribution by number of rings for the
top layer of AF core was as follows: 2->3->4->5->6-rings
characteristic of dominant input from oil, while a
2->5->4->3->6-rings trend was found for the ES core,
indicative of a mixed source scenario with an enhanced
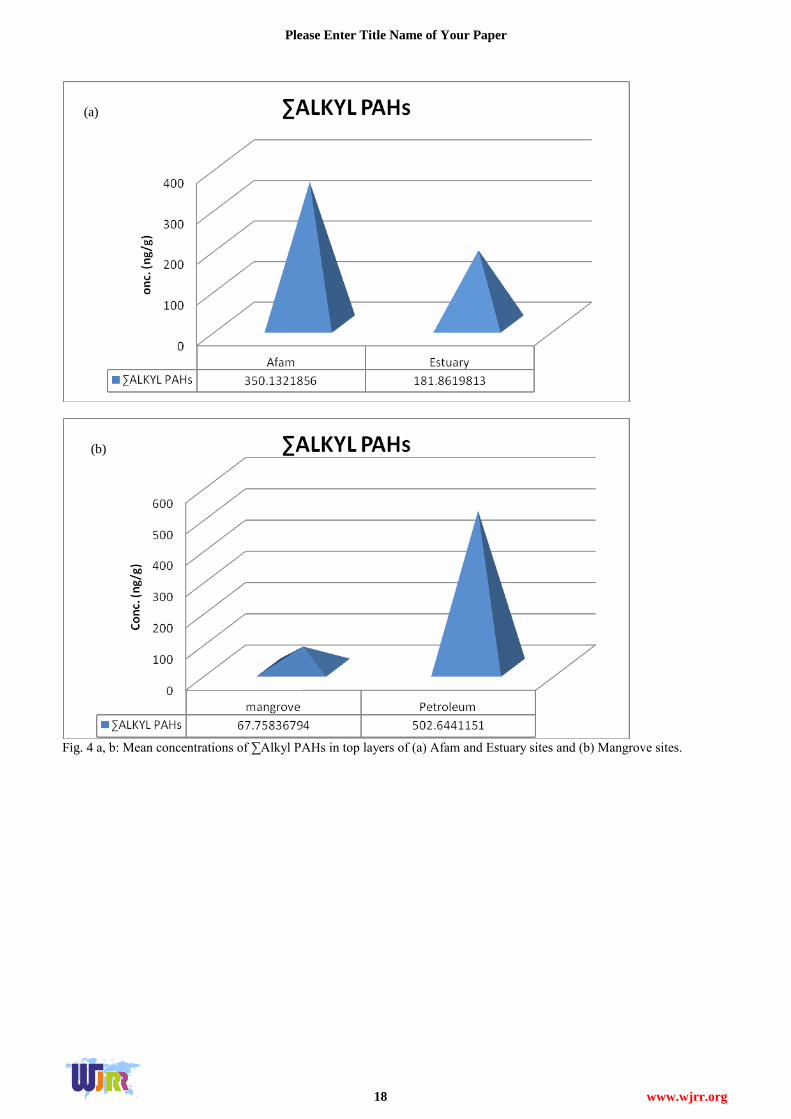
pyrogenic source inputs (Fig. 3 a, b). It is a
well-established knowledge that higher proportions of
alkyl PAH analogs are often found in petroleum than in
pyrogenic sources [25]. In support of the oil dominance,
Fig. 4 a shows relatively higher abundance of alkyl PAHs
(350.13 ng/g dry weight-dw) in the AF than the ES core
(181.86 ng/g dw).
The vertical distributions of TPAH for the AF
and ES cores are shown in Fig. 5 a. In all depth intervals,
the AF exhibited significantly higher TPAH levels than
the ES except at the middle layer (15-20 cm). The
relatively higher clay fraction (22.1%) and TOC content
(0.94%) in the middle layer of ES (ES3) facilitated the
adsorption and accumulation of PAHs, and may partly
account for the relatively high level (615.29 ng/g dw) in
the layer relative to AF3 (422.15 ng/g dw). The TPAH
level measured at AF5 (5 – 10 cm) was about 5 order of
magnitude higher than those measured in other layers of
World Journal of Research and Review (WJRR)
ISSN:2455-3956, Volume-5, Issue-4, October 2017 Pages 05-24
9 www.wjrr.org
the AF core. Field observation revealed that there was a
smell of oil in the AF5 sample but not in others of the AF
core, suggesting that oil contamination at the AF5 was
accidental, and did not permeate significantly down core.
An increase in TPAH levels from top layer (0 – 5
cm) to the middle (15 - 20 cm) and then declined thereafter
to the bottom layer (25 – 30 cm) was found for the ES
core. The differences in TPAHs levels between sediment
layers of the ES core were not significant according to one
way ANOVA test (F = 3.56; p = 0.088), implying that
depth did not have significant effect on the distribution of
TPAH at the ES site.
The distribution of individual PAHs in both AF
and ES cores are complex and did not follow any regular
pattern (Table 2). An insitu degradation or metabolism by
benthic communities could have contributed to the
dispersion profile. Nevertheless at the layer 5-10 cm
(AF5), the low molecular weight (LMW) PAHs including
naphthalene, acenaphthene, acenapthylene, anthracene
and phenanthrene were the dominant compounds
(concentrations exceeding 1,000 ng/g dw), supporting the
accidental oil discharge scenario to the sediment layer.
Besides the observed dispersion, there was no
significant difference in the concentrations of individual
PAHs in all layers of the ES core. Although the
concentrations of naphthalene were pervasively high in all
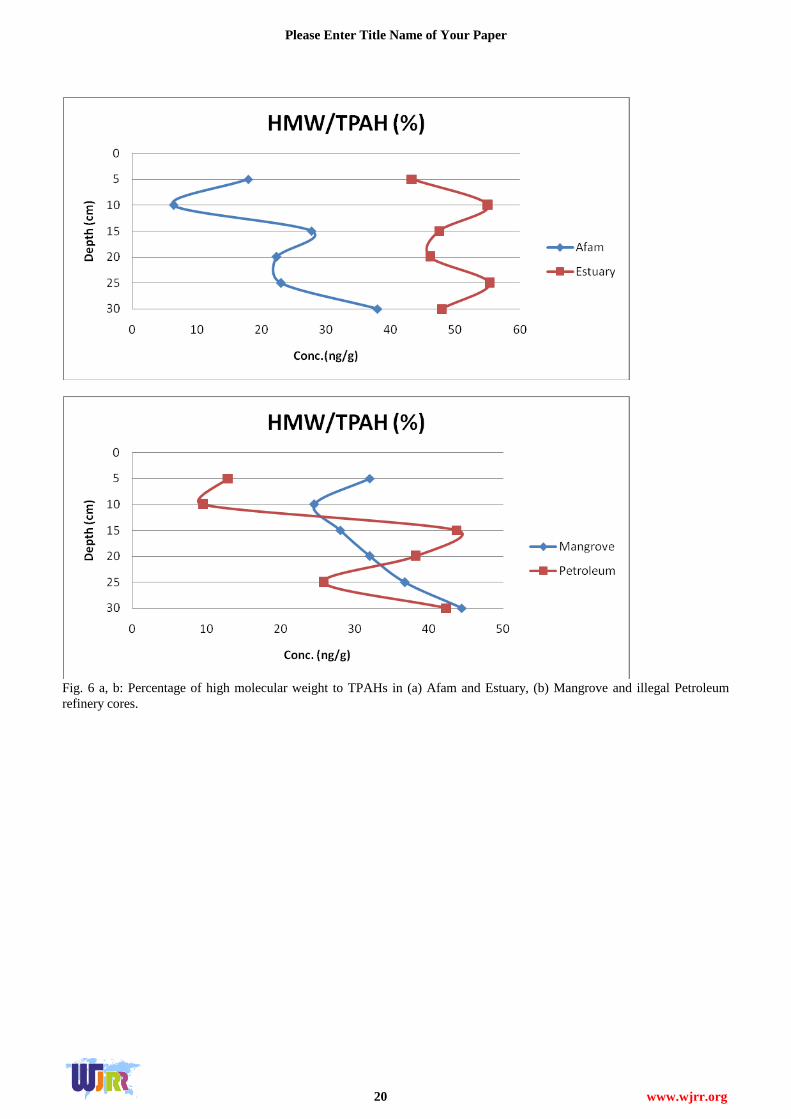
layers of ES, higher proportion of high molecular weight
(HMW) PAHs was apparent. The higher percentage of
HMW to total PAHs calculated for the ES relative to the
AF core (Fig. 6) supported the higher pyrogenic
contribution to the ES relative to the AF over the last ca. 5
decades. The implication here is that the two sites were
influenced predominantly by PAHs of different sources.
Therefore, localization of the input sources played an
important role in PAH contamination for the two sites. In
addition, the percentage HMW to TPAH values did not
vary significantly with depth for the two cores except at
the AF5 (5- 10 cm), suggesting that the sources of
contamination were fairly constant over the last 5 decades.
C. Spatial and Vertical Distribution of PAHs in
Mangrove and Illegal Petroleum Refinery Cores
Comparing top layers data between the MG and PTcores,
the following distribution trends were found for PAHs
according to number of rings: 2->3->4->5->6-rings and
2->3->5->4->6-rings, respectively (Fig. 3 c, d).The
prevalence of 2- and 3- ring types is indicative of
predominance of petrogenic over pyrogenic source input
to the two sites, with higher proportion of fossil fuel
combustion influence at the PT relative to the MG site as
evidenced in the higher proportion of % HMW to TPAH
(Fig. 6 b).There were no consistent trends in the vertical
distributions of PAHs according to ring size for the two
sites. However, it appears that the 2- and 3-ring types’
levels remained highest at 5-10 cm for the two cores,
indicating that similar anthropogenic pressure occurred
during the period ca. 1997-2005 of sediment deposition
(Fig 3 c, d). Comparing the levels of alkyl PAHs between
the two cores, it is apparent that the extent of impart by oil
was higher in the PT (502.64 ng/g dw) than MG site
(67.76 ng/g dw; Fig 4 b).
The vertical distributions of TPAHs in the MG
and PT cores are shown in Fig. 5 b. In all layers, the PT
exhibited significantly higher TPAH concentrations than
the MG except at MG1 (25-30 cm) and MG4 (10-15 cm)
where a reverse trend occurred. The distributions of TPAH
down cores for the two cores did not follow any regular
trend except that the levels peaked at the near-top layers (5
– 10 cm) and became minimized at the bottom layers
(25-30 cm). In the two cores, depth had no significant
effect on the vertical distribution of the TPAHs (one way
ANOVA test; F = 3.4; p = 0.09). The value was less than
the critical F value of 4.96, implying that the levels of
TPAHs in all layers did not vary widely over the last ca. 5
decades of sediment deposition.
The concentrations of individual PAHs in the
two cores were also complex and did not reflect any
regular pattern (Table 3). Nevertheless, the only
observable trends were found in naphthalene (in the case
of the MG) and acenaphthene (in the case of the PT) which
remained pervasively dominant in all layers. Differences
in insitu degradation by microbes or metabolism by
benthic communities between the two cores may account
for the dispersion found for most of the individual PAHs.
The non-uniformity in the vertical distribution of
percentage of HMW to TPAHs for the two cores confirms
that petroleum residue was not the exclusive source of
PAHs contamination (Fig. 6 b), but that pyrogenic input
arising from combustion of fossil fuel associated with the
illegal oil refining process must also be involved. The
result therefore confirms that localized contamination was
not only evidenced between the two cores but also within
the same cores.
D. Historical Trends of PAHs Contamination
The historical trends of normalized PAH distribution
down cores are shown in Fig. 7 and indicates that the
contamination was heaviest in the near-top layers (5-10
cm) for the three dated cores (AF, MG and PT). The
heavily impacted layer according to the estimate
corresponded to the period ca. 1997-2005. In other words,
PAH contamination of the river was very serious in the
mid-1990s and 2000s. This time-frame coincided with the
period of intensive oil bunkering/pipeline vandalism
activity by the Niger Delta militant groups. In June, 1998,
a 16-inch underground Shell pipeline burst, discharging
about 800,000 barrels of oil into the area [26]. Oil
companies including Shell Petroleum Development
Company operating in Nigeria often blame oil spills on
armed militants operating in the Niger Delta, who
campaign for a fairer allocation of oil revenue to locale in
the oil-rich region. The contamination then dropped to the
most recent period (ca. 2005-2013, 0-5 cm). Although the
decline in PAHs contamination was more significant in
the AF core, the scenario was linked to the recent offer of
amnesty in 2009 and subsequent clamped down on
vandals/militants by the joined armed forces empowered
by the Nigerian government.
After the first commercial discovery of
petroleum in Nigeria in 1956, sediment cores from the
MG, ES and PT sites except the AF exhibited gradual and
steady increase up-cores in PAH contamination from early
1960s to mid-1990s. The increase may be associated with
Historical Trend of Polycyclic Aromatic Hydrocarbons Contamination in Recent Dated Sediment Cores from The
Imo River, Southeast Nigeria
10 www.wjrr.org
increasing urbanization and economic development in the
region. The slight decline up-core in all cores except AF
signifies that despite the concerted effort by the Nigerian
government to curb the activity of the economic saboteurs,
some pockets of bunkering activity and illegal oil
refineries still persisted going by the recent report
accredited to the Minister of Petroleum in 2015.
In the case of the AF core, the pattern differed
slightly, showing a relatively higher TPAH level in the
bottom layer (25-30 cm; ca. 1964 -1972). The plausible
explanation for the variation in the AF was thought to be
the effect of construction of the Afam power station
complex in the early 1960s (when utilization of natural gas
and petroleum condensate for power generation was at its
peak). In addition, Eyama-Eleme, a village near the AF
area experienced an oil spill in the late 1960s caused by a
fire explosion in which a vast area was buried under a
hard-rock crust of burnt oil many feet thick [26],
contributing to the enhanced impact in the bottom layer.
E. Origins of Perylene
The study was able to identify in a single environment
three different origins for perylene by examination of its
distribution patterns. Perylene has not only been reported
by many researchers to be produced by insitudiagenesis of
biogenic precursors of terrestrial OC origin (eg. [11],[14])
and aquatic origin ([27,[28]), it has also been shown to be
derived from anthropogenic sources ([12], [15]).
In the study, among the four top layer samples,
perylene levels were most concentrated in the ES site
which was within 3 orders of magnitude higher than those
in other sites. The relatively high perylene level (54.43
ng/g dw; Table 2) at the site where commercial fishery
activity takes place may be associated with input from
liquid fossil fuel combustion process arising from boat
traffic/vehicular exhaust emission. The deduction is
supported by the relatively higher proportion of
percentage HMW to TPAH (characteristic of pyrogenic
input; Fig. 8) for the site.
Furthermore, a comparison of vertical
distribution profiles of perylene between AF and relatively
pristine MG revealed different origins for the compound
(Fig. 9). For instance, a uniform perylene distribution
trend observed for the MG down core indicated a constant
production over the last ca. 5 decades, most likely
reflecting a diagenetic origin [24]. Result of atomic C/N
calculation (> 15) revealed that the Imo River sediment is
dominated by terrestrial (land-derivd) OC, and lesser
amounts of aquatic (e.g. micro-algae/phytoplankton)
production (Table 1; [29], [30], [31]). Therefore, the
proposed biogenic production for perylene in the MG was
rather linked to diagenesis of terrigenous OC instead of an
aquatic origin.
In the case of the more contaminated AF site, an
irregular perylene distribution trend down core that
maximized (734.53 ng/g dw) at 5-10 cm layer (AF5; 1997-
2005, a period when accidental discharge of oil was earlier
reported to have occurred) was found. Since the Nigerian
oil/gas is believed to be predominantly derived from
terrestrial OC on the basis of detection of oleanane,
perylene occurrence in the AF site can thus be linked to a
non-marine oil origin. Hence, the Imo River environment
truly represents one of the few environments suitable for
the investigation of the diverse origins of perylene. We
therefore recommend that concerted research effort should
be directed more towards utilization of terrigenous instead
of aquatic OC in understanding the mechanic of perylene
formation.
V. CONCLUSIONS
The Imo River environment provides a veritable means of
tracing the diverse origins of perylene as well as assessing
the historical trends of PAHs contamination after the first
commercial discovery of oil in Nigeria in 1956. The
vertical distributions of perylene in the MG revealed a
constant trend that suggests natural biogenic origin
derived from terrigenous OC. While pyrogenic origin for
the compound was established for the ES, the AF
exhibited a profile consistent with a non-marine
petrogenic source. Hence, in view of the uncertainty
surrounding the probable mechanism of
peryleneformation, we recommend that concerted
research effort should be focused more on the involvement
of terrigenous instead of aquatic OC.
No regular trends were found in the distribution
of TPAHs in all cores, except that the parameter peaked at
the near-top layers corresponding to the period of
intensive oil bunkering/pipeline vandalism and illegal oil
refining activity. A general decline thereafter up-core was
most likely attributable to the recent offer of amnesty and
subsequent effort by the Nigerian government in clamping
down the illegal activity of the Niger Delta militant
groups.
VI. ACKNOWLEDGEMENTS
We are sincerely thankful to the European Association of
Organic Geochemists (EAOG) for the financial support
that made this research work possible. We are also grateful
for the excellent scientific equipment provided by the
Institute of Environmental Assessment and Water
Research, Spanish Council of Scientific Research (CSIC),
Barcelona, Spain and ADECYTE at little or no cost.
REFERENCES
Christensen ER, Arora S (2007). Source apportionment of PAHs in
sediments using factor analysis by time records: application to Lake
Michigan, USA. Water Res. 23: 1 -8.
[2] Liu Z, Zhang H, Tao M, Yang S, Wang L, Liu Y, Ma D,
Zhiming H (2007). Organochlorine pesticides in
consumer fish and mollusk of Liaoning province, China: distribution
and human exposure implication. Arch. Environ. Contam. Toxicol. 59:
444-453.
[3] Oyo-Ita OE, Oyo-Ita IO (2012). PAHs depositional
history in recent core sediments from UkwaIbom lake, SENigeria.
Environ. Geochem. Health 35: 189 – 199.
[4] Guo J-y, Wu FC, Luo XJ, Liang Z, Liao HQ, Zhang RY
(2010). Anthropogenic input of polycyclic aromatic hydrocarbons into
five lakes in western china. Environ.Pollut. 158(6): 2175-2180.
[5] Ke L, Yu H, Wong S, Tam Y (2005). Spatial and vertical distribution
of polyaromatic hydrocarbons inMangrove sediments. Sci. Tot. Environ.
340: 177-187.
World Journal of Research and Review (WJRR)
ISSN:2455-3956, Volume-5, Issue-4, October 2017 Pages 05-24
11 www.wjrr.org
[6] Zhang R, Zhang F, Zhang T (2013). Sedimentary records of PAHs in
a sediment core from tidal flat Haizhou Bay, China. Sci. Tot. Environ.
450:280-288.
[7] Sojino S, Wang J, SonibareO, Zeng E (2010). Polycyclic
aromatic hydrocarbons in Sediments and soils from oil exploration
areas of the Niger Delta, Nigeria. Hazard. Mater. 174: 641- 647.
[8] Ekpo BO, Ebirien PF, Okon DE, Hab LM (2012). Distributions of
Fossil Fuel Biomarkers in Sediments as Proxies for Petroleum
Contamination of Coastal Environment of the Niger Delta, Southeastern
Nigeria. J. Appl. Sci. Environ. Sanit. 7(2): 75-86.
[9] Oyo-ita OE, Oyo-Ita IO (2013). Fatty acids and alcohols
distributions and sources in surface sediments of the ImoRiver, SE. Niger
Delta, Nigeria. Environ. Natl. Reso.Res. 2: 101 -113.
[10] Arnaud F,Magand O,Chapron E,Bertrand , Boe¨s, X, Charlet, MA,
Me´lie`res, F (2006). Radionuclide dating (210Pb,137Cs,241Am) of recent
lake sediments in a highly active geodynamic setting (Lakes
PuyehueandIcalma-ChileanLakeDistrict). Sci. Tot. Environ. 366:
837-850.
[12] Grice K, Lu H, Atahan P, Asif M, Hallmann C, Greenwood P,
Maslen
E, Tulipani S, Williford K, Dodson J (2009). New insights to the origin of
perylene in geological samples. Geochim. Cosmochim. Act 73: 6531
-6543.
[13] Bixtong Y, Zhihuan Z, Ring M (2006). Pollution source
identification of polycyclic aromatic hydrocarbons ofsoils in Tianjin
area, China.Chemos. 64: 525-534.
[14] Oyo-Ita OE, Offem JO, Ekpo BO, Adie P (2013).
Anthropogenic PAHs in Mangrove sediments of theCalabar River, S.E.
Niger Delta, Nigeria. Appl. Geochem. 28: 212 -219.
[15] Ekpo BO, Oyo-Ita OE, Oros DH, Simoneit BRT (2011).
Distribution and sources of polycyclic aromatic hydrocarbons in surface
sediments from Cross River estuary, S. E. Niger Delta, Nigeria. Environ.
Monitor. Assess. 34: 225-237.
[16] Marynowski L, Kurkiewicz S, Rakocinski M, Simoneit
BRT (2011) Effects of weathering on organic matter: 1.Changes
inmolecular composition of extractable organic compounds by
paleoweathering of a lower carboniferous (Tournaisian) marine black
shale. Chem. Geol. 285: 144-156.
[17] Wilcke W, Amelung W, Krauss M, Martins C, Bandeir RA, Gracia
M (2003). Polycyclic aromatic hydrocarbons (PAHs) patterns in
climatically different ecological zones of Brazil. Org. Geochem. 34:
1405 – 1418.
[18] Ezeayim V, Okereke CA (1996). The effects of petroleum
activities in Nigerian soil environment. Glob. J. Pure Appl. Sci. 11:
285-297.
[19] Appleby PG, Richardson N, Noland PJ (1992). Self-
absorption corrections for well-type Germanium detectors.Nuel.Inst.
Meth. 371: 228-233.
[20] Strauss J, Schirrmeister L, Mangelsdorf K, Eichhorn L,
Wetterich S, Herzschuh, U (2015).Organic-matter qualityof deep
permafrost carbon – a study from Arctic Siberia.Biogeosci. 12:
2227–2245.
[21] Zheng G, Man B, Lam M, Lam P (2002). Distribution and
sources of polycyclic aromatic hydrocarbons in thesediment of a
sub-tropical coastal wetland. Water Res. 36: 1457 - 1468.
[22] Burns W, Mankiewicz P, Bence A, Page D, Parker K (2007). A
principal component and least squares methodfor allocatingpolycyclic
aromatic hydrocarbons in sediment to multiple sources. Environ.
Toxicol. Chem. 8: 1119-1131.
[23] ApplebyPG,OldfieldF (1992).In:Ivanovich,M., Haiman, R. S.,
(ed). .Application
oflead-210tosedimentationstudies.Oxford7Ura-niumseriesdisequilibriu
m.
[24] Gonzales-Vila FJ, Polvillo O, Boski T, Moura D,Andres
de JR (2003). Biomarker patterns in a time-resolved
Holocene/terminal Pleistocene Sedimentary Sequence from the
Gurdiana River estuarine area (SW Portugal/Spain Border). Org.
Geochem. 34: 1601-1613.
[25] Dominguez C, Sarkar S, Bhattacharya M, Chatterjee B,
Bhattacharya B, Jover E, Albaiges J, Bayona J, Alam MD, Satpathy K
(2010). Quantification and source identification of polycyclic aromatic
hydrocarbons in core sediemnts from sundarban mangrove wetland,
India. Arch. Environ. Contam. Toxicol. 59: 49-61.
[26] Walker SE, Dickhut RM, Chisholm-Brause C, Sylva S,
Reddy CM (2006). Molecular and isotopic identification of PAH sources
in a highlyindustrialized urban estuary. Org. Geochem. 36: 619-632.
[27] Okpo OC, Eze RC (2012). Vandalization of oil pipeline in
The Niger Delta region in Nigeria and poverty: and overview. J. Stud.
Sociol. Sci. 3(2): 13 – 21.
[28] Wakeham SC, Farrington JN, Volkman JK (1981) Fatty
acids, wax ester, triacylglycerols and alkyldiaylglycerols associated with
particles collected in sediment traps in the Peru upwelling. Advances
Org. Geochem. 18: 185-197.
[29] Unlu S, Alpa B (2006). Distribution and sources of
hydrocarbons in surface sediments of Gemlik Bay (Marmeara Sea,
Turkey). Chemos. 64: 764 – 777.
[30] Meyers PA, Ishiwatari P (1998). The early diagenesis of organic
matter in lacustrine sediments. Org. Geochem. 22: 185-200.
[31] Ekweozor C.M, Telnaes N (1990).Oleanane parameter:
verification by quantitative study of the biomarker occurrence in
sediment of the Niger Delta. Org. Geochem. 16: 401-413.
[32] Oyo-Ita IO, Oyo-Ita OE, Dosunmu MI., Dominquez C, Bayona
JM, Albaiges J, (2016). Sources and distribution of petroleum
hydrocarbons in recent sediment of the Imo River, SE Nigeria. Arch.
Environ. Contam. Toxicol. 70: 372-382.
Historical Trend of Polycyclic Aromatic Hydrocarbons Contamination in Recent Dated Sediment Cores
from The Imo River, Southeast Nigeria
12 www.wjrr.org
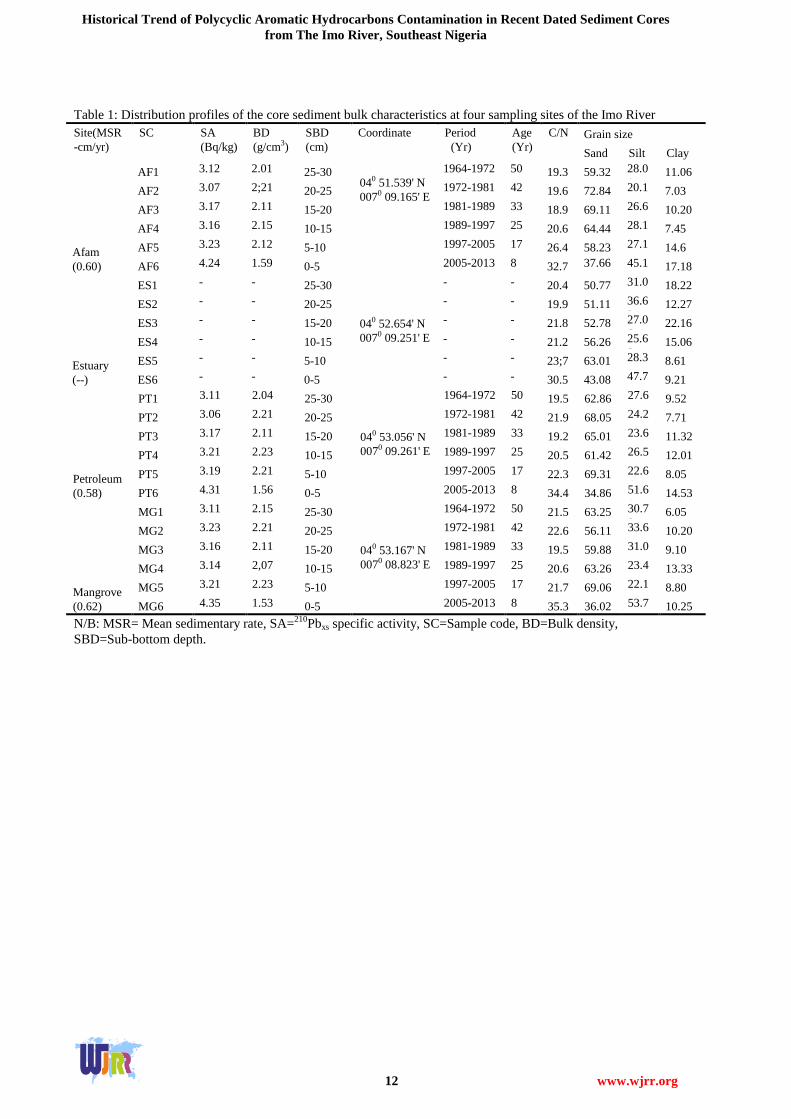
Table 1: Distribution profiles of the core sediment bulk characteristics at four sampling sites of the Imo River
Site(MSR
-cm/yr)
SC
SA
(Bq/kg)
BD
(g/cm3)
SBD
(cm)
Coordinate Period
(Yr)
Age
(Yr)
C/N Grain size
Sand Silt Clay
Afam
(0.60)
AF1 3.12 2.01 25-30
040 51.539' N
0070 09.165' E
1964-1972
50 19.3 59.32 28.0
1 11.06
AF2 3.07 2;21 20-25 1972-1981 42 19.6 72.84 20.1
3 7.03
AF3 3.17 2.11 15-20 1981-1989 33 18.9 69.11 26.6
9 10.20
AF4 3.16 2.15 10-15 1989-1997 25 20.6 64.44 28.1
1 7.45
AF5 3.23 2.12 5-10 1997-2005 17 26.4 58.23 27.1
7 14.6
AF6 4.24 1.59 0-5 2005-2013 8 32.7 37.66
5
45.1
6 17.18
Estuary
(--)
ES1 - - 25-30
040 52.654' N
0070 09.251' E
- - 20.4 50.77 31.0
1 18.22
ES2 - - 20-25 - - 19.9 51.11 36.6
2 12.27
ES3 - - 15-20 - - 21.8 52.78 27.0
6 22.16
ES4 - - 10-15 - - 21.2 56.26 25.6
8 15.06
ES5 - - 5-10 - - 23;7 63.01 28.3
8 8.61
ES6 - - 0-5 - - 30.5 43.08 47.7
1 9.21
Petroleum
(0.58)
PT1 3.11 2.04 25-30
040 53.056' N
0070 09.261' E
1964-1972
50 19.5 62.86 27.6
2 9.52
PT2 3.06 2.21 20-25 1972-1981
42 21.9 68.05 24.2
4 7.71
PT3 3.17 2.11 15-20 1981-1989 33 19.2 65.01 23.6
7 11.32
PT4 3.21 2.23 10-15 1989-1997 25 20.5 61.42 26.5
7 12.01
PT5 3.19 2.21 5-10 1997-2005 17 22.3 69.31 22.6
4 8.05
PT6 4.31 1.56 0-5 2005-2013 8 34.4 34.86 51.6
1 14.53
Mangrove
(0.62)
MG1 3.11 2.15 25-30
040 53.167' N
0070 08.823' E
1964-1972 50 21.5 63.25 30.7
0 6.05
MG2 3.23 2.21 20-25 1972-1981 42 22.6 56.11 33.6
9 10.20
MG3 3.16 2.11 15-20 1981-1989 33 19.5 59.88 31.0
2 9.10
MG4 3.14 2,07 10-15 1989-1997 25 20.6 63.26 23.4
1 13.33
MG5 3.21 2.23 5-10 1997-2005 17 21.7 69.06 22.1
4 8.80
MG6 4.35 1.53 0-5 2005-2013 8 35.3 36.02 53.7
3 10.25
N/B: MSR= Mean sedimentary rate, SA=210Pbxs specific activity, SC=Sample code, BD=Bulk density,
SBD=Sub-bottom depth.
World Journal of Research and Review (WJRR)
ISSN:2455-3956, Volume-5, Issue-4, October 2017 Pages
05-24
13 www.wjrr.org
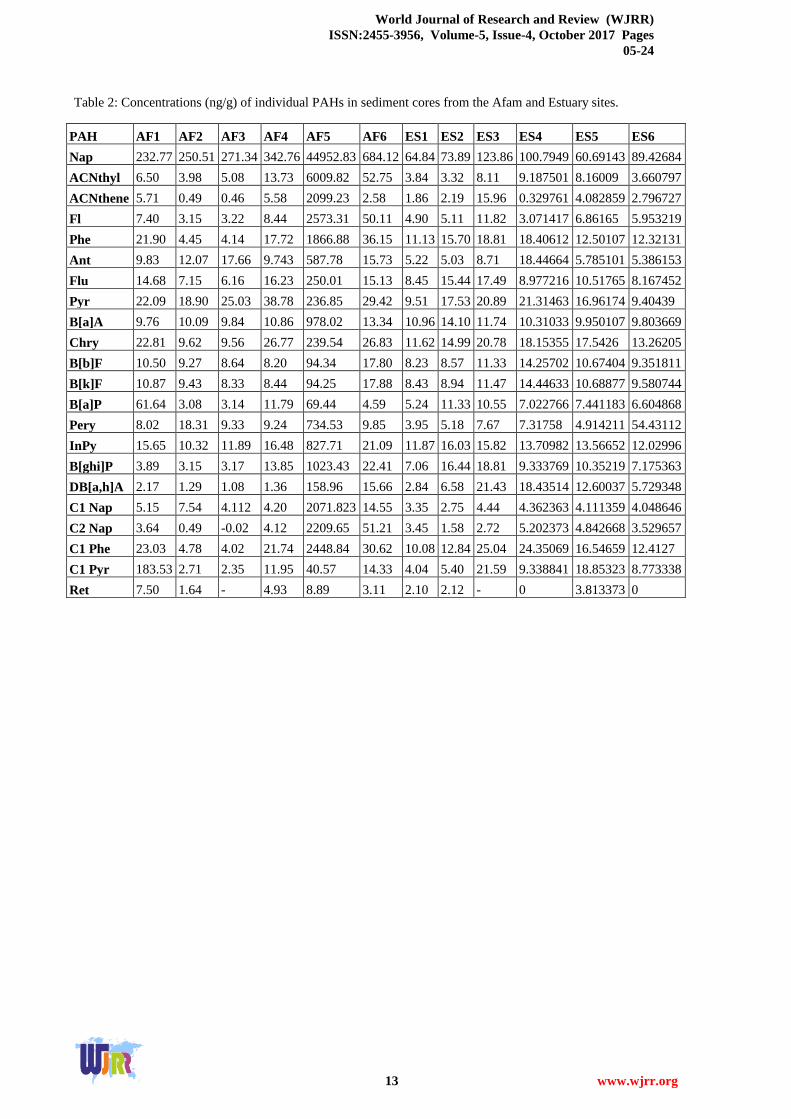
Table 2: Concentrations (ng/g) of individual PAHs in sediment cores from the Afam and Estuary sites.
PAH AF1 AF2 AF3 AF4 AF5 AF6 ES1 ES2 ES3 ES4 ES5 ES6
Nap 232.77 250.51 271.34 342.76 44952.83 684.12 64.84 73.89 123.86 100.7949 60.69143 89.42684
ACNthyl 6.50 3.98 5.08 13.73 6009.82 52.75 3.84 3.32 8.11 9.187501 8.16009 3.660797
ACNthene 5.71 0.49 0.46 5.58 2099.23 2.58 1.86 2.19 15.96 0.329761 4.082859 2.796727
Fl 7.40 3.15 3.22 8.44 2573.31 50.11 4.90 5.11 11.82 3.071417 6.86165 5.953219
Phe 21.90 4.45 4.14 17.72 1866.88 36.15 11.13 15.70 18.81 18.40612 12.50107 12.32131
Ant 9.83 12.07 17.66 9.743 587.78 15.73 5.22 5.03 8.71 18.44664 5.785101 5.386153
Flu 14.68 7.15 6.16 16.23 250.01 15.13 8.45 15.44 17.49 8.977216 10.51765 8.167452
Pyr 22.09 18.90 25.03 38.78 236.85 29.42 9.51 17.53 20.89 21.31463 16.96174 9.40439
B[a]A 9.76 10.09 9.84 10.86 978.02 13.34 10.96 14.10 11.74 10.31033 9.950107 9.803669
Chry 22.81 9.62 9.56 26.77 239.54 26.83 11.62 14.99 20.78 18.15355 17.5426 13.26205
B[b]F 10.50 9.27 8.64 8.20 94.34 17.80 8.23 8.57 11.33 14.25702 10.67404 9.351811
B[k]F 10.87 9.43 8.33 8.44 94.25 17.88 8.43 8.94 11.47 14.44633 10.68877 9.580744
B[a]P 61.64 3.08 3.14 11.79 69.44 4.59 5.24 11.33 10.55 7.022766 7.441183 6.604868
Pery 8.02 18.31 9.33 9.24 734.53 9.85 3.95 5.18 7.67 7.31758 4.914211 54.43112
InPy 15.65 10.32 11.89 16.48 827.71 21.09 11.87 16.03 15.82 13.70982 13.56652 12.02996
B[ghi]P 3.89 3.15 3.17 13.85 1023.43 22.41 7.06 16.44 18.81 9.333769 10.35219 7.175363
DB[a,h]A 2.17 1.29 1.08 1.36 158.96 15.66 2.84 6.58 21.43 18.43514 12.60037 5.729348
C1 Nap 5.15 7.54 4.112 4.20 2071.823 14.55 3.35 2.75 4.44 4.362363 4.111359 4.048646
C2 Nap 3.64 0.49 -0.02 4.12 2209.65 51.21 3.45 1.58 2.72 5.202373 4.842668 3.529657
C1 Phe 23.03 4.78 4.02 21.74 2448.84 30.62 10.08 12.84 25.04 24.35069 16.54659 12.4127
C1 Pyr 183.53 2.71 2.35 11.95 40.57 14.33 4.04 5.40 21.59 9.338841 18.85323 8.773338
Ret 7.50 1.64 - 4.93 8.89 3.11 2.10 2.12 - 0 3.813373 0
Historical Trend of Polycyclic Aromatic Hydrocarbons Contamination in Recent Dated Sediment Cores
from The Imo River, Southeast Nigeria
14 www.wjrr.org
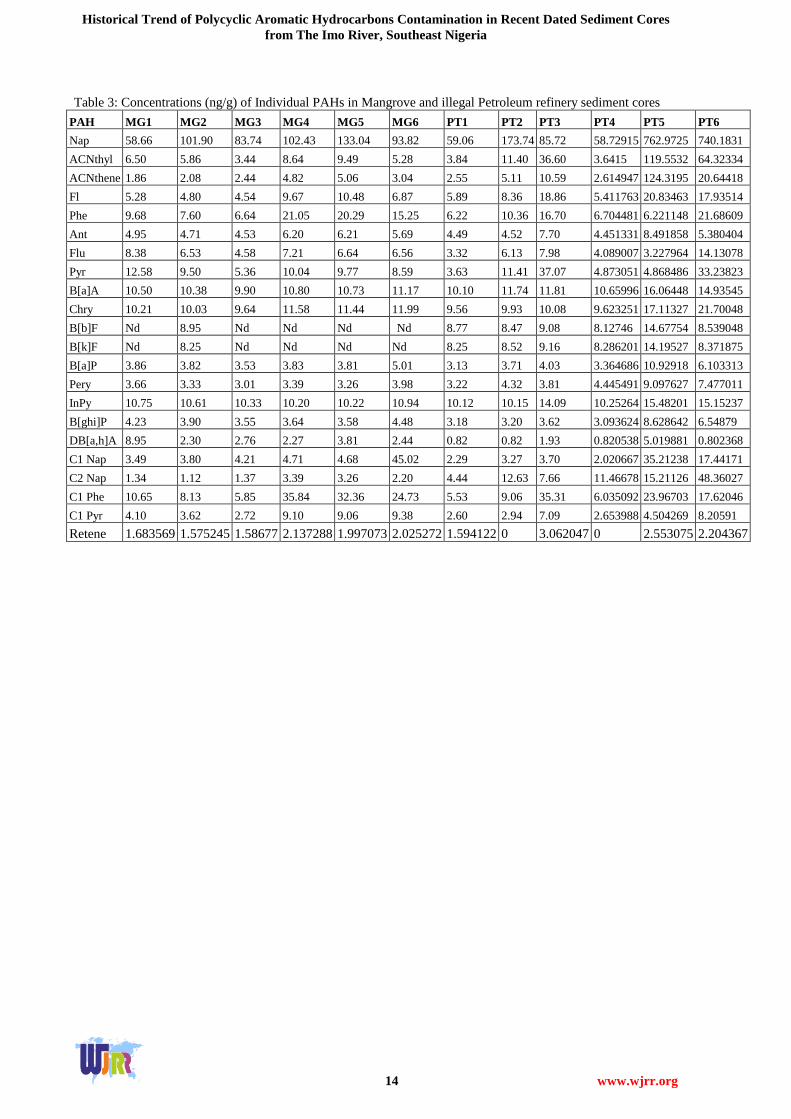
Table 3: Concentrations (ng/g) of Individual PAHs in Mangrove and illegal Petroleum refinery sediment cores
PAH MG1 MG2 MG3 MG4 MG5 MG6 PT1 PT2 PT3 PT4 PT5 PT6
Nap 58.66 101.90 83.74 102.43 133.04 93.82 59.06 173.74 85.72 58.72915 762.9725 740.1831
ACNthyl 6.50 5.86 3.44 8.64 9.49 5.28 3.84 11.40 36.60 3.6415 119.5532 64.32334
ACNthene 1.86 2.08 2.44 4.82 5.06 3.04 2.55 5.11 10.59 2.614947 124.3195 20.64418
Fl 5.28 4.80 4.54 9.67 10.48 6.87 5.89 8.36 18.86 5.411763 20.83463 17.93514
Phe 9.68 7.60 6.64 21.05 20.29 15.25 6.22 10.36 16.70 6.704481 6.221148 21.68609
Ant 4.95 4.71 4.53 6.20 6.21 5.69 4.49 4.52 7.70 4.451331 8.491858 5.380404
Flu 8.38 6.53 4.58 7.21 6.64 6.56 3.32 6.13 7.98 4.089007 3.227964 14.13078
Pyr 12.58 9.50 5.36 10.04 9.77 8.59 3.63 11.41 37.07 4.873051 4.868486 33.23823
B[a]A 10.50 10.38 9.90 10.80 10.73 11.17 10.10 11.74 11.81 10.65996 16.06448 14.93545
Chry 10.21 10.03 9.64 11.58 11.44 11.99 9.56 9.93 10.08 9.623251 17.11327 21.70048
B[b]F Nd 8.95 Nd Nd Nd Nd 8.77 8.47 9.08 8.12746 14.67754 8.539048
B[k]F Nd 8.25 Nd Nd Nd Nd 8.25 8.52 9.16 8.286201 14.19527 8.371875
B[a]P 3.86 3.82 3.53 3.83 3.81 5.01 3.13 3.71 4.03 3.364686 10.92918 6.103313
Pery 3.66 3.33 3.01 3.39 3.26 3.98 3.22 4.32 3.81 4.445491 9.097627 7.477011
InPy 10.75 10.61 10.33 10.20 10.22 10.94 10.12 10.15 14.09 10.25264 15.48201 15.15237
B[ghi]P 4.23 3.90 3.55 3.64 3.58 4.48 3.18 3.20 3.62 3.093624 8.628642 6.54879
DB[a,h]A 8.95 2.30 2.76 2.27 3.81 2.44 0.82 0.82 1.93 0.820538 5.019881 0.802368
C1 Nap 3.49 3.80 4.21 4.71 4.68 45.02 2.29 3.27 3.70 2.020667 35.21238 17.44171
C2 Nap 1.34 1.12 1.37 3.39 3.26 2.20 4.44 12.63 7.66 11.46678 15.21126 48.36027
C1 Phe 10.65 8.13 5.85 35.84 32.36 24.73 5.53 9.06 35.31 6.035092 23.96703 17.62046
C1 Pyr 4.10 3.62 2.72 9.10 9.06 9.38 2.60 2.94 7.09 2.653988 4.504269 8.20591
Retene 1.683569 1.575245 1.58677 2.137288 1.997073 2.025272 1.594122 0 3.062047 0 2.553075 2.204367

World Journal of Research and Review (WJRR)
ISSN:2455-3956, Volume-5, Issue-3, September 2017 Pages 21-24
15 www.wjrr.org
Fig .1: Map of the study area indicating sampling locations
Please Enter Title Name of Your Paper
16 www.wjrr.org
Fig. 2 a, b, c, d: Relationship between TOC and TPAH concentrations for (a) Estuary, (b) Afam, (c) illegal Petroleum refinery
and (d) Mangrove sites.
(a)
(c) (d)

World Journal of Research and Review (WJRR)
ISSN:2455-3956, Volume-5, Issue-3, September 2017 Pages 21-24
17 www.wjrr.org
Fig. 3 a, b ,c, d: Vertical distributions of PAHs by number of rings for (a) Afam, (b) Estuary, (c) Mangrove and (d) Illegal
petroleum refinery sites.
(a)
Please Enter Title Name of Your Paper
18 www.wjrr.org
Fig. 4 a, b: Mean concentrations of ∑Alkyl PAHs in top layers of (a) Afam and Estuary sites and (b) Mangrove sites.
(b)
(a)

World Journal of Research and Review (WJRR)
ISSN:2455-3956, Volume-5, Issue-3, September 2017 Pages 21-24
19 www.wjrr.org
Fig. 5 a, b: Vertical distributions of TPAH in cores from (a) Afam and Estuary, (b) Mangrove and illegal petroleum refinery
sites. Note: AF5 value was norma;ized by 50 order of magnitude in order to fitl into the appropriate scale.
.
(a)
(b)
Please Enter Title Name of Your Paper
20 www.wjrr.org
Fig. 6 a, b: Percentage of high molecular weight to TPAHs in (a) Afam and Estuary, (b) Mangrove and illegal Petroleum
refinery cores.

World Journal of Research and Review (WJRR)
ISSN:2455-3956, Volume-5, Issue-3, September 2017 Pages 21-24
21 www.wjrr.org
Fig 7: Historical trends of TPAH contamination for the Afam, Mangrove and illegal Petroleum refinery cores.
Note: AF5 value was normalizeded by 50 orders of magnitude in order to fit into the appropriate scale.

Please Enter Title Name of Your Paper
22 www.wjrr.org
Fig. 8: Percentage of HMW to TPAHs for the top layers of the four sites.

World Journal of Research and Review (WJRR)
ISSN:2455-3956, Volume-5, Issue-3, September 2017 Pages 21-24
23 www.wjrr.org
FIG. 9: Concentration-depth profile for Perylene in Mangrove and Afam Sediment Cores.
Please Enter Title Name of Your Paper
24 www.wjrr.org
PROFILE FOR DR INYANG OKON OYO-ITA FCAI
Dr. (Mrs.) Inyang Okon Oyo-ita is a lecturer I with the Department of Pure and Applied Chemistry, University of Calabar,
Nigeria. She has her Ph.D degreein Environmental Organic Geochemistry, certificates in SMART notebook software training
for SMART BOARD users and a post graduate diploma certificate in advanced study in academic practice from Grenoble,
France.
Inyang has developed scientific research collaborative framework that explore research problems through scholarships and
creativity with the Environmental and Petroleum Geochemistry research group (EPGRG) university of Calabar, Nigeria,
Institute of Environmental Assessment and Water Research Spanish Council of Scientific Research(CSIC) Barcelona, Spain,
Laboratory of Biomonitoring of the Environment, Coastal Ecology and Ecotoxicity unit, University of Carthage, Faculty of
Science of Bizerte, Zarzouna, Tunisia etc. Dr (Mrs) Inyang Oyo-ita is a member of many professional societies and has also
presented quality papers/keynote addresses in National and International conferences. She is an awardee of European
Association of Organic Geochemist (EAOG) Travel Scholarship award to Spain, Best session paper and Excellence Keynote
address presentation awards at the fifth international conference on Biological, Chemical and Environmental Science (BCES,
2016) in London and a fellow of cooperate administration for a successful combination of research and administrative
activities.
SOME OF HER LATEST PUBLICATIONS
1 Oyo-Ita, O. E., Oyo-Ita, I. O. and Ugim S. U. (2011). Sources and distribution of polycyclic aromatic hydrocarbons in
post-flooded soil profile near Afam power station, SE Niger Delta, Nigeria. Soil Science and Environmental
Management 7, 35 – 42 (India).
2 Oyo-Ita, O..E. Oyo-Ita, I. O. and Ugim, S. U. (2012). Distribution and sources of polycyclic aromatic hydrocarbons and
sterols in termite nest, soil and sediment from Great Kwa River, SE. Niger Delta, Nigeria. Environmental Monitoring
and Assessment 185(2), 1413 – 1426 (Springer Science Publisher, UK).
3 Oyo-Ita, O.E. and Oyo-Ita, I.O. (2012). PAHs depositional history in recent core sediments from UkwaIbom lake, SE
Nigeria. Environmental Geochemistry and Health 35, 189 – 199 (Springer Science Publisher, Dordracht).
4 Oyo-ita, O. E. and Oyo-Ita, I.O. (2012). Fatty acids and alcohols distributions and sources in surface sediments of the
Imo River, SE. Niger Delta, Nigeria. Environment and Natural Resources Research 2, 101 -113 (Canadian Center of
Education Publisher, Canada).
5 Oyo-ita, O. E, Ekpo, B. O., Oyo-ita, I. O. and Offem, J.O. (2014). Phthalates and other plastic additives in surface
sediments of Cross River System, SE, Nigeria; Environmental Implications. Environment & Pollution, 3(1), 60-72
(Canadian Center of Education Publisherm Canada).
6 *Oyo-Ita, O..E. Oyo-Ita, I. O. and Ugim, S. U. (2013). Distribution and sources of polycyclic aromatic hydrocarbons
and sterols in termite nest, soil and sediment from Great Kwa River, SE. Niger Delta, Nigeria. Environmental
Progress WWW. environment progress. Org.
7 Oyo-Ita, O..E. Oyo-Ita, I. O. (2015). Polycyclic aromatic hydrocarbons. Nova Science Inc. Publisher, New York
(USA).
8 Dosunmu, M. I., Oyo-Ita, I. O. and Oyo-Ita, O., E., (2016). Risk assessment of human exposure to
polycyclicaromatichydrocarbonsvia shrimp (Macrobrachiumfelicinum) consumption along the Imo River
catchments, SE Nigeria. Environmental Geochemistry and Health 38(1),1-15 (Springer Science Publisher, Dordracht)
9 Oyo-Ita, I. O., Oyo-Ita, O. E.., Dosunmu, M. I., Camen Dominquez., Bayona, J. M. and Albaiges, J. (2016). Sources
and distribution of petroleum hydrocarbons in recent sediment of the Imo River, SE Nigeria. Arch. Environmental
Contamination & Toxicology70 (2), 372-382.
10 Oyo-ita, O. E., Oyo-ita, I.O., Sam, E. S., Ekpo, O. I. &Ugim, S. U. (2016). Natural and Anthropogenic biomarkers in
recent dated sediment cores from Reforme Lake, SE Nigeria: environmental implications. Environmental Earth
Science 75 (22), 1-14.