wearable heart rate sensor systems for wireless … · (heart rate, heart rate ... wearable heart...
TRANSCRIPT

1530-437X (c) 2015 IEEE. Personal use is permitted, but republication/redistribution requires IEEE permission. Seehttp://www.ieee.org/publications_standards/publications/rights/index.html for more information.
This article has been accepted for publication in a future issue of this journal, but has not been fully edited. Content may change prior to final publication. Citation information: DOI10.1109/JSEN.2015.2485210, IEEE Sensors Journal
> REPLACE THIS LINE WITH YOUR PAPER IDENTIFICATION NUMBER (DOUBLE-CLICK HERE TO EDIT) <
1
Abstract—There is an increasing interest from dog handlers and
veterinarians in an ability to continuously monitor dogs’ vital signs (heart rate, heart rate variability, and respiratory rate) outside laboratory environments, with the aim of identifying physiological correlations to stress, distress, excitement, and other emotional states. We present a non-invasive wearable sensor system combining electrocardiogram (ECG), photoplethysmogram (PPG), and inertial measurement units (IMU) to remotely and continuously monitor vital signs of dogs. To overcome the limitations imposed by the efficiently insulated skin and dense hair layers of dogs, we investigated the use of various styles of ECG electrodes and enhancements of these by conductive polymer coatings. We also studied the incorporation of light guides and optical fibers for efficient optical coupling of PPG sensors to the skin. Combined with our parallel efforts to use inertial measurement units (IMUs) to identify dog behaviors, these physiological sensors will contribute to a canine-body area network (cBAN) to wirelessly and continuously collect data during canine activities with a long-term goal of effectively capturing and interpreting dogs’ behavioral responses to environmental stimuli that may yield measurable benefits to handlers interactions with their dogs.
Index Terms—computer applications; inertial measurement unit; animal machine interface; physiology
I. INTRODUCTION nterpreting the emotional state underlying canine behavior is essential in human-canine interactions, to achieve effective
training, and to improve canine welfare. Traditionally, dog trainers monitor postures, vocalizations, and behavioral signs of anxiety (e.g. trembling, restlessness, visual scanning, or yawning) to determine canines emotional responses to certain stimuli or environmental conditions. There is an increasing interest in making this interpretive process less subjective by monitoring the physiological signals of working, service, and companion dogs. Vital signs, such a heart rate, may serve as indicators of emotions and welfare, and may also be used to aid in the identification of stress or excitement triggers outside of laboratory environments. This information could then be used
This paper was submitted for review February 1, 2015. An earlier version of this paper was presented at the IEEE Sensors 2014 Conference and was published in its Proceedings. Web-link: http://ieeexplore.ieee.org/xpl/articleDetails.jsp?tp=&arnumber=6985477. This work was supported by National Science Foundation (Award 1329738).
R. Brugarolas, T. Latif, J. Dieffenderfer, K. Walker and A. Bozkurt are with the Electrical and Computer Engineering Department, North Carolina State
by handlers to optimize methodologies to improve training effectiveness and efficiency. The overarching goal of our work is to achieve more accurate interpretation of canine emotional response by correlating behavioral responses with the physiological responses of heart rate (HR), heart rate variability (HRV), and respiratory rate [1–3]. In the long term, the physiological sensors presented here will be a part of a canine-body area network (cBAN) that combines multimodal wearable sensing technologies and computational modeling with behavioral assessment to effectively capture dogs’ emotional responses [4–11] (Fig. 1).
When at work, dogs are very active. Consequently a heart rate monitoring system needs to be both resistive and robust. Reliably recording canine HR and HRV during static postures and dynamic activities in both interior and exterior environments in a context-aware manner is a challenging task. We present our initial efforts to improve the electrocardiogram (ECG) and phyotoplethysmogram (PPG) hardware for a better coupling with the tissue to provide more accurate and robust ECG and PPG monitoring outside of laboratory and veterinary environments. We additionally report the results of experiments characterizing the quality of the tissue coupling with these enhancements and comparing it with commercially available ECG electrodes used in clinics.
University, Raleigh, NC 27606 USA (corresponding e-mail: [email protected]).
S. Yuschak and B. L. Sherman are with the College of Veterinary Medicine, North Carolina State University, Raleigh, NC 27606 USA.
D. L. Roberts is with the Department of Computer Science, North Carolina State University, Raleigh, NC 27606 USA.
Wearable Heart Rate Sensor Systems for Wireless Canine Health Monitoring
Rita Brugarolas, Tahmid Latif, James Dieffenderfer, Katherine Walker, Sherrie Yuschak, Barbara L. Sherman, David L. Roberts, and Alper Bozkurt, Member, IEEE
I
Fig. 1. General description of the canine-machine interface to enhance human-canine interactions.

1530-437X (c) 2015 IEEE. Personal use is permitted, but republication/redistribution requires IEEE permission. Seehttp://www.ieee.org/publications_standards/publications/rights/index.html for more information.
This article has been accepted for publication in a future issue of this journal, but has not been fully edited. Content may change prior to final publication. Citation information: DOI10.1109/JSEN.2015.2485210, IEEE Sensors Journal
> REPLACE THIS LINE WITH YOUR PAPER IDENTIFICATION NUMBER (DOUBLE-CLICK HERE TO EDIT) <
2
II. BACKGROUND In general, to maintain homeostasis, physical activity has a
positive effect on HR and respiration rate. HR is the number of heart beats per minute and is based on the number of contraction of the ventricles. The variability in the interval between consecutive heart beats, referred to as HRV, is considered a valuable indicator of the fluctuations in autonomic nervous system inputs to the heart [4]. The ECG reveals the electrical activity of the heart. It is the gold standard to measure the HR as time between consecutive cardiac electrical impulses (heart beats), referred to as R-R intervals. Variability in R-R intervals represents interplay between two branches of the autonomic nervous system, the parasympathetic branch, which has an extension effect on the R-R interval duration mediated by the release of acetylcholine by the vagus nerve, and the sympathetic branch, which has a shortening effect mediated by the release of epinephrine and norepinephrine [4]. In dogs, the R-R cycle length normally varies with respiratory activity. Called respiratory sinus arrhythmia, the R-R interval shortens during inspiration and lengthens during expiration [12]. R-R interval series are analyzed by time and frequency domain methods to calculate HRV measures. A number of studies have used HRV as an indicator of stress in animals [5,13].
The traditional ECG method in a veterinary setting involves pinching “alligator” clips applied to the skin to attach electrodes on the animal’s body when it is anesthetized for surgery. These would be painful if used on awake or active animals and cause inflammation. Alternatively, commercially-available human ECG electrode patches are used for at-home cardiac monitoring. For these, the animal’s hair must be shaved at the ECG surface electrode attachment sites to ensure optimal adherence and avoid detachment due to the movement of the animal [6]. Dense hair and subcutaneous fat for thermal insulation on the dog’s body dampen electrical conductivity and limit the useful application of these patches. One possible solution for securing these electrodes is to use tape and bandages, as used in Holter monitoring, although it is time-consuming for daily use and could be uncomfortable for animals [14]. Moreover, most of these clinical systems only provide on-board recording capabilities, and the wireless telemetry systems are too expensive for home-use [15]. Implantable sensors provide another solution but are also expensive and require surgical placement [16].
In addition to traditional ECGs used in veterinary clinics, some new technologies are appearing in the consumer market for daily monitoring of HR and HRV in humans using dry electrodes. Some of these products from Polar® have been used by veterinary researchers and have shown reasonable correlation on stationary dogs, and also during dynamic activity when the hairs are clipped and additional conductive electrolyte gel is liberally applied [17–19]. PetPace® and Voyce® are two emerging commercial devices that use non-conventional acoustic and ultra-wideband radio-frequency technologies, respectively. At present, due to the recent appearance of these products in the market, there is limited information available about their technologies and the clinical validation of their sensing capabilities and reliability.
To overcome some of the difficulties associated with the application of contact-based ECG electrodes to canines, we introduced novel electrode configurations that allow for signal recording without the necessity of shaving the dog’s hair. We evaluated two types of electrodes to improve the tissue-electrode contact despite the existence of a dense hair layer: thick-tapered electrode and comb-shaped arrays of thin spring-loaded pins. We demonstrated that surface modification of the metal electrodes by coating with poly(3,4-ethylene-dioxythiophene) poly-(styrene-sulfonate) (PEDOT:PSS) conductive polymer can enhance their electrical property in terms of increasing the charge storage capacity and decreasing the impedance of the tissue-electrode interface [20–22].
We included PPG in our sensor system for self-calibrating the HR and HRV measurements. PPG is an optical volumetric measurement of blood flow obtained by shining infrared light into the tissue and detecting the amount of backscattered light with a photodiode. The traditional PPG recording has only been used on anesthetized animals during surgeries where traditional pulse oximetry clips were attached to locations, such as ear or tongue that is not practical for dogs’ activities outside of veterinary environments [23]. We studied the incorporation of light guides and optical fibers to create an efficient optical coupling to a dog’s skin through the hair when performing PPG measurement in wearable form factors at hairy locations on their chest. Placing the sensors on the chest enables us to use a single chest strap to contain all the sensors without restricting the range of motion. When the dog is at rest, the PPG based HR could be correlated with ECG based measurements to validate the accuracy of the measurements. Beyond this, concurrent measurement of PPG and ECG can track the arterial pulse transient time (PTT) which has been an indirect measure of relative changes of blood pressure or stress levels in humans and has a potential to be used in canines [24].
As the dogs’ heart rate is correlated with its behaviors [25], it is essential to monitor the behaviors in parallel to HRV. In our earlier work, we demonstrated the capability of a cBAN to detect static dog postures (sitting, lying down, standing, eating off the ground, and standing on two legs) and dynamic activities (walking down a ramp, climbing up stairs, and walking on flat ground) using a cascade of machine learning classifiers [26]. The classifiers used the linear and angular accelerations provided by IMUs worn by the dog in two locations. In particular, Hidden Markov Models were used for detection of dynamic behaviors, and decision tree classifiers for static postures, achieving an average accuracy above 95% [10,11]. This provides the capability of identifying behaviors remotely and automatically without the need for camera recordings and video processing as traditionally used in veterinary behavior research and clinics. In addition to behavior monitoring, such an accelerometer can be placed at the site of the ECG electrodes to correlate activity levels to ECG signal to noise ratio to further understand the sources of noise. It is noteworthy that, this IMU can also be used to perform seismocardiography by registering the vibrations due to cardiac contraction and respiratory modulation and potentially calculate the resting HR and respiratory rate [27,28].

1530-437X (c) 2015 IEEE. Personal use is permitted, but republication/redistribution requires IEEE permission. Seehttp://www.ieee.org/publications_standards/publications/rights/index.html for more information.
This article has been accepted for publication in a future issue of this journal, but has not been fully edited. Content may change prior to final publication. Citation information: DOI10.1109/JSEN.2015.2485210, IEEE Sensors Journal
> REPLACE THIS LINE WITH YOUR PAPER IDENTIFICATION NUMBER (DOUBLE-CLICK HERE TO EDIT) <
3
III. MATERIALS AND METHODS To evaluate the performance of the ECG and PPG systems,
we connected these to a wearable BeagleBone Black (BBB) platform integrated into an adjustable elastic belt placed around the thorax behind the two front legs. The BBB served as the processing unit of the cBAN to retrieve the sensor information and transmit it using a wireless communication link based on the IEEE 802.11 standard for Wi-Fi (Fig. 2) [29]. The analog outputs of the ECG and PPG systems were directly connected to the 12 bit analog-to-digital converter (ADC) channels of the BBB and the digital output of the 3-axis accelerometer to the I2C serial bus. For experimental flexibility and to support scenarios where Wi-Fi is not available or battery power is limited, we also included a Texas Instruments system-on-chip (cc2541) in the cBAN to be able to connect to the computational node carried by the handler (e.g. smartphone) directly using Bluetooth low energy (BLE).
For this study we recruited five dogs of various size, breed, and hair density at the North Carolina State University (NCSU) College of Veterinary Medicine (CVM). Table I shows information on the five dogs participating. All animal procedures were approved by the Institutional Animal Care and Use Committee of NCSU.
A. Improving the ECG Electrodes
To overcome the limitations imposed by dog fur, we used two types of electrodes for the recording of ECG signals: a four millimeter thick stainless steel pointed style electrode, which is traditionally used in training collars, and electrodes that are comprised of arrays of one millimeter thick spring-loaded gold-coated pins similar to dry electrodes used in EEG caps [30] (Fig. 3). We hypothesized that using an array of multiple thinner electrodes instead of a thicker single one would reduce the tissue-electrode impedance and improve the hair penetration. It would also improve the comfort by distributing the applied pressure to a larger area. We used a commercial-off-the-shelf (COTS) pointed-style stainless steel electrode (RFA-529) with added silicone cushioning to expose only the narrower tip for favoring the attachment and comfort (Fig. 2). For the second type of electrode, COTS copper alloy spring-loaded pins with 1.07 mm diameter, 8 mm height and 0.51 μm gold plating (Mill-Max Mfg.) were soldered on a mini printed-circuit-board (PCB) to create a comb-shaped array (Fig. 3). The small dimensions of the pins would allow easy penetration through the hair and the spring mechanism would help in maintaining the skin-to-electrode contact under motion or rapid excursions of the chest during panting.
To further reduce the impedance of the electrode array, we coated the tip of the gold-coated pins with PEDOT:PSS. We
prepared the PEDOT:PSS monomer solution in the laboratory by using a magnetic stirrer to mix 35 mg of 3,4-ethylenedioxythiophene with 250 mg poly (styrenesulfonic acid sodium salt) in 25 ml of deionized water for two hours [20]. All
TABLE I DOG INFORMATION
Dog number Breed/Breed Type Age
(years) Sex
1 Labrador 3 M 2 Mixed 11 F-Spayed 3 Greyhound 9 M 4 Otterhound 6 M 5 Mixed 2 M
Fig. 2 (Top) Top view of the BBB and the PCB for ECG and PPG front-end circuit and BLE SoC. (Middle) A labrador retriever with the cBAN harness with sensor locations indicated. (Bottom) Chest strap including ECG and PPG sensors with inset showing the light guides for PPG recording.
Fig. 3. (Left) Comb-shape array electrode with four and ten gold spring-loaded pins. (Inset) SEM of the PEDOT-PSS coated tip of the ten pin array. (Right) Relative sizes of stainless steel electrode and four pin array.

1530-437X (c) 2015 IEEE. Personal use is permitted, but republication/redistribution requires IEEE permission. Seehttp://www.ieee.org/publications_standards/publications/rights/index.html for more information.
This article has been accepted for publication in a future issue of this journal, but has not been fully edited. Content may change prior to final publication. Citation information: DOI10.1109/JSEN.2015.2485210, IEEE Sensors Journal
> REPLACE THIS LINE WITH YOUR PAPER IDENTIFICATION NUMBER (DOUBLE-CLICK HERE TO EDIT) <
4
the chemicals for both solutions were purchased from Sigma Aldrich, Inc. A prerequisite of the coating process involved the ultrasonic cleaning of the gold plated pins using acetone followed by alcohol. For the electrochemical polymerization process, we dipped the tips of the spring-loaded pin arrays in the PEDOT:PSS solution along with a 500 μm platinum wire as counter electrode while applying galvanostatic charges of 100 μA/mm2 for 10 minutes. Fig. 3 shows one of the polymerized pins with the characteristic black coloration of PEDOT:PSS coating. It should be noted that direct electro-polymerization of PEDOT:PSS over stainless steel is not possible therefore, only the gold-coated pin arrays were coated with PEDOT:PSS in this study.
After assembly, we connected the three electrodes required for ECG recording to a COTS heart rate monitor analog front-end chip (AD8232, Analog Devices). This integrated circuit included an instrumentation amplifier, an operational amplifier for filtering and extra gain, and a right leg drive amplifier to compensate for the common-mode voltage variations to improve the common-mode rejection ratio of the system. We designed the narrowband filter bandwidth to be between 7-24 Hz. We selected this bandwidth to remove motion artifacts at the cost of some distortion of the ECG signal. This type of distortion can be afforded in our application as we were interested in the detection of HR and HRV through the R-R interval rather than observing the full PQRST waveform. In addition, AD8232 provided additional circuitry to reduce the settling time and fast signal restoration when a saturation condition was detected at the output of the instrumentation amplifier. The ADC in the BBB processed the filtered ECG signal at a rate of 350 Hz before transmitting it to the computational node.
B. Improving the Skin-to-Device Coupling for PPG In PPG measurements, canine fur becomes a barrier by
reflecting most of the incident light applied for measurement. To penetrate through the hair, we incorporated light guides that utilize internal reflection to homogenize non-uniform light sources and optical fibers for efficient optical coupling to the skin (Fig. 2). In our system, we used a light emitting diode (LED) working at 850 nm to shine light into the tissue and a COTS monolithic photodetector and transimpedance amplifier (TSL12T) to detect the modulated light exiting the tissue (Fig. 4). We included a silicone structure to hold the light guides at a fixed distance and orientation with respect to each other. Silicone also acts as an optical barrier to prevent direct light from the LED to reach the photodetector directly.
In order to reduce the 1/f noise, we set the LED pulse rate at 500Hz; the processing unit generated these pulses while the operational amplifier sourced the current. A sample and hold circuit demodulated the photon populations received by the photodiode to extract the arterial pulsation signal. Subsequently, we removed the DC component before amplifying and high-frequency filtering the signal. We added back the DC component before sending it to the microcontroller’s ADC (Fig. 5). Finally, a laptop node analyzed and stored the data received from the processing unit.
IV. EXPERIMENTAL RESULTS In order to validate the performance of the ECG and PPG
systems we performed three separate characterizations. The first characterization (see section IV.A) involved the in vitro and in vivo impedance analysis of the two types of electrodes through electrochemical impedance spectroscopy (EIS) to demonstrate that a) the surface modification by coating the metal electrodes with PEDOT:PSS can reduce the impedance of the tissue-electrode interface, and b) to compare the quality of the tissue coupling using these electrodes and commercially available ECG electrodes used in clinics. The second characterization (see section IV.B), involved the in vivo evaluation of the ECG system performance by a) comparing the accuracy to a Holter monitor routinely used in veterinary clinics and b) performing recordings while dogs were performing activities with various intensities to show the reliability of the ECG under various conditions. Lastly, we present the effectiveness of the light guides to enable PPG measurements in a hairy chest region (see IV.C).
A. Electrode impedance characterization We performed the electrode impedance characterization in
two separate experiments. The first experiment involved in vitro EIS to reveal the effect of the number of gold spring-loaded pins and the electropolymerization with PEDOT:PSS on the overall impedance of the comb-shaped array electrode. For the second experiment we used in vivo EIS to compare the electrical properties of the tissue-electrode interface formed with patch electrodes, pointed style electrodes, and spring-loaded pin arrays under various interface conditions (i.e.,
Fig. 4 Operation of PPG sensor. Light guides in the photodetector and LED for tissue coupling. On the lower left, a close look of the light pipe and also optic fiber bundle for further enhancement. Silicone is used for structural support and to block direct light transmission from LED to photodetector.
Fig. 5 System block diagram of the various parts of the wireless PPG sensor.

1530-437X (c) 2015 IEEE. Personal use is permitted, but republication/redistribution requires IEEE permission. Seehttp://www.ieee.org/publications_standards/publications/rights/index.html for more information.
This article has been accepted for publication in a future issue of this journal, but has not been fully edited. Content may change prior to final publication. Citation information: DOI10.1109/JSEN.2015.2485210, IEEE Sensors Journal
> REPLACE THIS LINE WITH YOUR PAPER IDENTIFICATION NUMBER (DOUBLE-CLICK HERE TO EDIT) <
5
presence of hair and application of an electrolyte gel). For each condition we iteratively fitted the obtained EIS graphs to the equivalent circuit model of the tissue-electrode interface.
1) In vitro electrode impedance characterization
a) Experimental Setup We characterized the electrodes in a phosphate buffered
saline solution (0.8% NaCl) with a 4.8×4.8 mm2 silver-silver chloride (Ag|AgCl) reference electrode using a GAMRY Reference 600 Potentiostat to determine and compare the impedance properties and evaluate the success of the electro-polymerization process. EIS recorded the complex impedance to characterize the charge transport mechanism. We used a 10 mV AC voltage (typical EIS small-signal value) and zero bias voltage as the input signal and recorded the impedance between 10 Hz and 10 kHz at 10-20 discrete frequencies per decade. We analyzed the impedance of a single pointed style electrode and multiple pin comb-shaped electrode arrays to investigate the effect of the number of pins in the array.
b) Results Fig. 6 shows the in vitro EIS characterization of the stainless
steel pointed style electrode and spring-loaded gold-coated pin arrays. The stainless steel electrode and the spring-loaded six pin array presented a very similar impedance response. The impedance improved as the number of pins increased. The increment in the number of pins decreased the overall electrode impedance since the same type and size of pins are connected in parallel. However, it became relatively more difficult to penetrate through the hair as the number of pins increased.
EIS results in Fig. 7 show the effect of PEDOT:PSS coating over gold coated spring-loaded pin arrays with various numbers of pins. The improvement in the impedance with PEDOT:PSS coating was more pronounced at lower frequencies typical for HRV measurements. At 10 Hz, the single pin impedance decreased from 4.8kΩ to 670Ω and in the four pin array from 2.3kΩ to 300Ω, both showing a similar improvement factor of 7.2 and 7.6 respectively. These results showed a greater reduction effect in the impedance by PEDOT:PSS coating of the electrodes than by increasing the number of pins.
2) In vivo electrode impedance characterization
a) Experimental Setup To characterize the skin-to-electrode interface impedance,
we performed EIS measurements with two electrodes on the chest of Dog 1: the electrode under study (working electrode) and a reference/counter electrode separated by 15 cm. The reference/counter electrode for all these characterization measurements was an Ag|AgCl electrode with gel placed in a clipped region and the working electrode was switched between the traditional patch electrodes used in clinical ECG settings, pointed style stainless steel electrodes and the spring-loaded comb-shaped array. These tests included the effect of placing patch electrodes directly on the skin in a shaved area and over the fur and application of gel electrolyte to the regions where
the stainless steel electrodes and PEDOT:PSS coated spring-loaded pin arrays were in contact with the skin.
b) Results Fig. 8 shows the impedance response of the pointed style
stainless steel electrode and the array of four spring-loaded pins coated with PEDOT:PSS when placed on a hairy region of the dog without and after applying electrolyte gel. The same figure also contains the impedance of the traditional ECG patch electrode applied to a shaved spot on the dog. As in the in vitro experiments, we obtained lower impedance when using the four spring-loaded pins coated with PEDOT:PSS than the pointed style stainless steel electrodes. These electrodes both provided better impedance with respect to the traditional ECG patches on hairy regions. When we applied electrolyte gel to stainless steel and gold electrodes in hairy regions, this impedance further improved to a level similar to the patch electrodes applied on a shaved region during clinical monitoring.
The equivalent model of the impedance consisted of a resistance (Rel) in series with a parallel combination of a resistance (Rct) and a capacitance (Cel) (Fig. 8). Rel represents the cumulative effect of electrodes, tissue, and additional resistances caused by the cabling and connections. The lower it is, the more voltage is transferred from the electrodes to the amplifiers and less thermal noise is generated. Cel is the electrode capacitance formed at the electrode–tissue interface and lower values of Cel results in less distortion of the signal. The charge transfer resistance Rct can be interpreted as the ability of the interface to transfer a charge from the tissue to the electrodes. A low Rct value is required to improve the recording performance. We iteratively fitted the obtained EIS graphs to the equivalent circuit model parameters of the tissue-electrode interface for further analysis by using the EIS300 software (Gamry Instruments, PA). We refined the parameter estimates until we obtained a 10% maximum difference between the measured and calculated impedance. Table II shows the fitted element values. We observed lower Rel and Cel in the four gold pins with PEDOT:PSS than in the stainless steel electrode under dry conditions. When we added the electrolyte gel Rct and Rel decreased and the Cel increased due to an increase in the permittivity (ε).
B. In vivo ECG system performance We conducted the in vivo ECG system performance
characterization in two independent experiments. The first experiment involved the simultaneous recording of our system and a Holter device (Trillium 5000, Forest Medical Inc) that is routinely used in the NCSU CVM Cardiology Service, to assess accuracy. The second experiment, involved performing ECG on the recruited five dogs while performing activities with different intensities to assess functionality and utility of the system. In both experiments we included an IMU to characterize activity intensity information. For one of the dogs in the later experiment we performed additional analysis on the ECG and accelerometer data to evaluate the use of the accelerometer to detect respiration and heart contraction in addition to activity intensity.

1530-437X (c) 2015 IEEE. Personal use is permitted, but republication/redistribution requires IEEE permission. Seehttp://www.ieee.org/publications_standards/publications/rights/index.html for more information.
This article has been accepted for publication in a future issue of this journal, but has not been fully edited. Content may change prior to final publication. Citation information: DOI10.1109/JSEN.2015.2485210, IEEE Sensors Journal
> REPLACE THIS LINE WITH YOUR PAPER IDENTIFICATION NUMBER (DOUBLE-CLICK HERE TO EDIT) <
6
1) System validation with Holter monitor
a) Experimental Setup In order to validate the system accuracy, we performed two
independent ECG measurements simultaneously on Dog 2 over
a 12 minute period involving two minutes of walking and ten minutes of resting in standing and lying postures. A Cardiac Holter Diagnostic Service Technician installed the Holter recorder on the dog following standard protocol. The protocol involved attaching the five leads of the Holter device and the ECG surface electrodes with incorporated electrolyte gel over shaved spots, and placing our ECG system with three comb-shaped array electrodes with six pins mounted on a chest-strap behind the front legs along with an IMU in close proximity (Fig. 2). To facilitate the contact of the pins with the skin, we gently wiggled the electrodes and applied some electrolyte gel. We then wrapped both sets of electrodes (patch and comb-shape array) with elastic adhesive tape. The wireless wearable monitoring system transmitted the data coming from our ECG system and IMU to the base unit for further processing and storage.
The Trillium 5000 had only on-board recording capability requiring data to be transferred to computer at the end of the test for offline processing. The proprietary software of this Holter recorder provided the detected QRS complex peak and the R-R interval series. The QRS complex is the most prominent deflection in the ECG waveform and is associated to the electrical activity of the ventricular contraction. In order to compare both systems, we implemented a QRS detector based on an existing algorithm[31]. We filtered the ECG signal with a differentiator (notch filter) 𝑦𝑦𝑜𝑜(𝑛𝑛) = 𝑥𝑥(𝑛𝑛) − 𝑥𝑥(𝑛𝑛 − 4) and a digital low pass filter 𝑦𝑦1(𝑛𝑛) = 𝑦𝑦𝑜𝑜(𝑛𝑛) + 4𝑦𝑦𝑜𝑜(𝑛𝑛 − 1) + 6𝑦𝑦𝑜𝑜(𝑛𝑛 −2) + 4𝑦𝑦𝑜𝑜(𝑛𝑛 − 3) + 𝑦𝑦𝑜𝑜(𝑛𝑛 − 4). We defined a threshold based on the signal amplitude and detected the crossings of the absolute value of the derivative of the threshold. We determined a QRS complex when four or fewer crossings occurred in a 200 ms window, and otherwise we considered it as noise.
b) Results Fig. 9 shows representative recordings of the R-R interval
series obtained simultaneously from the Holter device and our system with the six pin comb-shape array electrodes during static and dynamic activities. During static activities, the R-R interval series obtained with our system tracks closely the commercially-available system validating the hardware accuracy. Even during dynamic activities, the difference between the two measurements is small. We used the difference signal between the two R-R series to observe the discrepancy between the two measurements. Table III shows for each activity, the recording duration, the mean R-R interval and the associated number of heart beats recorded with the Holter device. To quantify the difference between the two measurements, the number of beats missed by our system with respect to the Holter, and the mean and standard deviation (SD) of the difference signal are also shown. The mean difference during both activities was below 35 ms, which was less than 10% of the mean R-R interval value. During a two minute walking period, our system missed only 5% of beats compared to the beats recorded by the Holter. In those cases, the measured R-R interval showed an unlikely duration of approximately double the average R-R interval. These events can be easily compensated in the detection algorithm but are included on the table with the purpose of showing the system performance.
Fig. 6 In vitro EIS measurements in four different gold spring-loaded pin arrays with one, four, six and ten pins.
Fig. 7 In vitro EIS measurements showing the effect of electropolymerization with PEDOT:PSS in a single gold plated spring-loaded pin, and a four pin array.
Fig. 8 In vivo EIS measurements at the patch, stainless steel, and gold spring-loaded array interface with tissue.
TABLE II EQUIVALENT CIRCUIT MODEL PARAMETERS
Type electrode Gel Cel(nF) Rel(kΩ) Rct(kΩ) Stainless Steel - 7 41 891 Stainless Steel + 15 27 40 4 gold pin PEDOT:PSS - 0.5 10 298 4 gold pin PEDOT:PSS + 15 2 39 Patch with solid gel + 17 0.6 23
1530-437X (c) 2015 IEEE. Personal use is permitted, but republication/redistribution requires IEEE permission. Seehttp://www.ieee.org/publications_standards/publications/rights/index.html for more information.
This article has been accepted for publication in a future issue of this journal, but has not been fully edited. Content may change prior to final publication. Citation information: DOI10.1109/JSEN.2015.2485210, IEEE Sensors Journal
> REPLACE THIS LINE WITH YOUR PAPER IDENTIFICATION NUMBER (DOUBLE-CLICK HERE TO EDIT) <
7
Note that, in order to keep the R-R interval sequence from the two systems in sync for comparison we interpolated an additional QRS complex at half the duration of the long R-R interval.
2) System validation during different intensity activities
a) Experimental Setup We evaluated the performance of the system on the five dogs
while performing static and walking activities during a 3-6 minute period. Because of the preliminary nature of the analyses we conducted, we did not base sample size on a formal power analysis. Instead, we estimated the smallest number of dogs that would allow us to obtain a representative sample and achieve a preliminary indication of functionality and utility. Table IV summarizes the trials indicating the breed, approximate hair length at the electrode sites, the type of electrodes used, and the duration for the static and dynamic periods.
The system setup was the same as in the previous section. To quantify activity intensity, we used the integral modulus of accelerometer (IMA) obtained from the readings of the 3-axis of the accelerometer on the chest. Defined as 𝐼𝐼𝐼𝐼𝐼𝐼 =1𝑓𝑓𝑓𝑓𝑓𝑓
|𝑎𝑎𝑥𝑥[𝑛𝑛]| + 𝑎𝑎𝑦𝑦[𝑛𝑛] + |𝑎𝑎𝑧𝑧[𝑛𝑛]| 𝑛𝑛𝑜𝑜+𝑓𝑓𝑓𝑓𝑓𝑓𝑛𝑛𝑜𝑜 , IMA has been
previously used for assessment of daily physical activity [32, 33]. We filtered the 3-axis acceleration using a band-pass filter (3-20 Hz) before integration. In order to emphasize short events of very high activity, such as naturally occurring shaking behavior, we used a small T equal to two seconds. In this experiment the QRS detector based on [31] was also used to detect QRS complexes and compute the R-R interval.
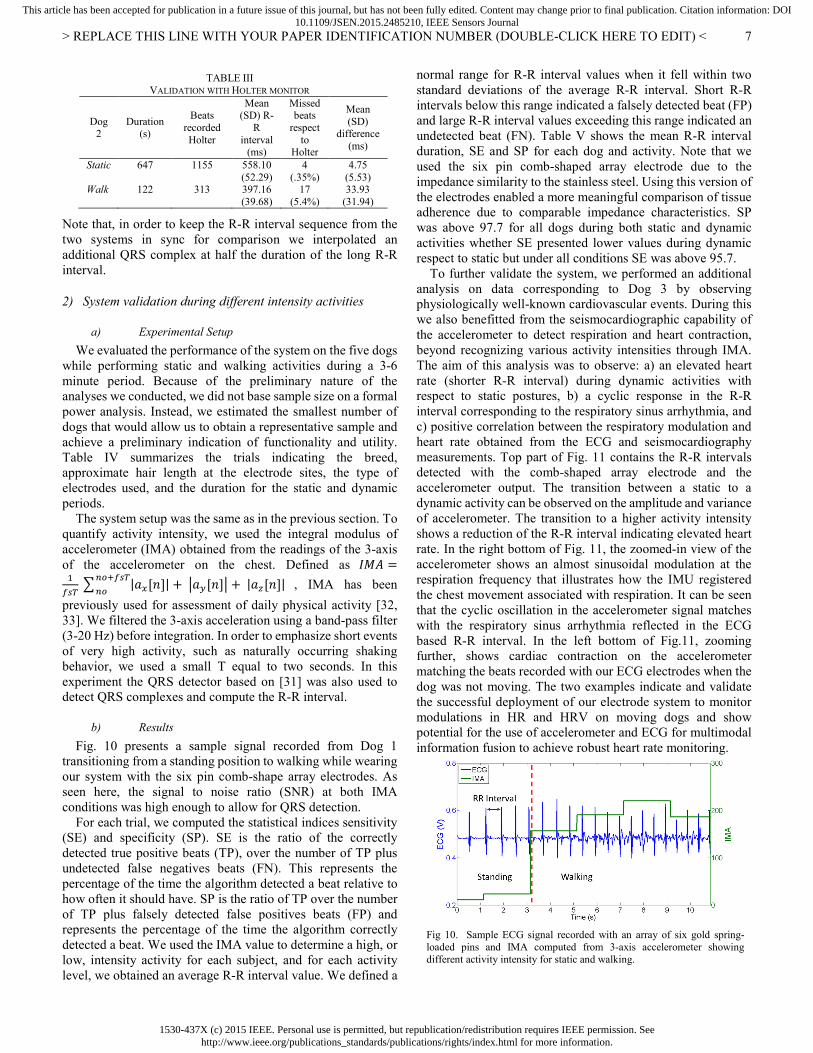
b) Results Fig. 10 presents a sample signal recorded from Dog 1
transitioning from a standing position to walking while wearing our system with the six pin comb-shape array electrodes. As seen here, the signal to noise ratio (SNR) at both IMA conditions was high enough to allow for QRS detection.
For each trial, we computed the statistical indices sensitivity (SE) and specificity (SP). SE is the ratio of the correctly detected true positive beats (TP), over the number of TP plus undetected false negatives beats (FN). This represents the percentage of the time the algorithm detected a beat relative to how often it should have. SP is the ratio of TP over the number of TP plus falsely detected false positives beats (FP) and represents the percentage of the time the algorithm correctly detected a beat. We used the IMA value to determine a high, or low, intensity activity for each subject, and for each activity level, we obtained an average R-R interval value. We defined a
normal range for R-R interval values when it fell within two standard deviations of the average R-R interval. Short R-R intervals below this range indicated a falsely detected beat (FP) and large R-R interval values exceeding this range indicated an undetected beat (FN). Table V shows the mean R-R interval duration, SE and SP for each dog and activity. Note that we used the six pin comb-shaped array electrode due to the impedance similarity to the stainless steel. Using this version of the electrodes enabled a more meaningful comparison of tissue adherence due to comparable impedance characteristics. SP was above 97.7 for all dogs during both static and dynamic activities whether SE presented lower values during dynamic respect to static but under all conditions SE was above 95.7.
To further validate the system, we performed an additional analysis on data corresponding to Dog 3 by observing physiologically well-known cardiovascular events. During this we also benefitted from the seismocardiographic capability of the accelerometer to detect respiration and heart contraction, beyond recognizing various activity intensities through IMA. The aim of this analysis was to observe: a) an elevated heart rate (shorter R-R interval) during dynamic activities with respect to static postures, b) a cyclic response in the R-R interval corresponding to the respiratory sinus arrhythmia, and c) positive correlation between the respiratory modulation and heart rate obtained from the ECG and seismocardiography measurements. Top part of Fig. 11 contains the R-R intervals detected with the comb-shaped array electrode and the accelerometer output. The transition between a static to a dynamic activity can be observed on the amplitude and variance of accelerometer. The transition to a higher activity intensity shows a reduction of the R-R interval indicating elevated heart rate. In the right bottom of Fig. 11, the zoomed-in view of the accelerometer shows an almost sinusoidal modulation at the respiration frequency that illustrates how the IMU registered the chest movement associated with respiration. It can be seen that the cyclic oscillation in the accelerometer signal matches with the respiratory sinus arrhythmia reflected in the ECG based R-R interval. In the left bottom of Fig.11, zooming further, shows cardiac contraction on the accelerometer matching the beats recorded with our ECG electrodes when the dog was not moving. The two examples indicate and validate the successful deployment of our electrode system to monitor modulations in HR and HRV on moving dogs and show potential for the use of accelerometer and ECG for multimodal information fusion to achieve robust heart rate monitoring.
TABLE III VALIDATION WITH HOLTER MONITOR
Dog 2
Duration (s)
Beats recorded Holter
Mean (SD) R-
R interval
(ms)
Missed beats
respect to
Holter
Mean (SD)
difference (ms)
Static 647 1155 558.10 (52.29)
4 (.35%)
4.75 (5.53)
Walk 122 313 397.16 (39.68)
17 (5.4%)
33.93 (31.94)
Fig 10. Sample ECG signal recorded with an array of six gold spring-loaded pins and IMA computed from 3-axis accelerometer showing different activity intensity for static and walking.

1530-437X (c) 2015 IEEE. Personal use is permitted, but republication/redistribution requires IEEE permission. Seehttp://www.ieee.org/publications_standards/publications/rights/index.html for more information.
This article has been accepted for publication in a future issue of this journal, but has not been fully edited. Content may change prior to final publication. Citation information: DOI10.1109/JSEN.2015.2485210, IEEE Sensors Journal
> REPLACE THIS LINE WITH YOUR PAPER IDENTIFICATION NUMBER (DOUBLE-CLICK HERE TO EDIT) <
8
TABLE IV TRIAL DETAILS
Dog number
Hair length (cm)
Duration: static/walk
(s) Type electrode
1 2 38 /116 Comb-shape array 6 pins 2 4 130/108 Comb-shape array 6 pins 3 0.5 169/159 Comb-shape array 6 pins 4 5 147/212 Pointed style stainless steel 5 2 84/148 Comb-shape array 6 pins
Fig 11. (Top) R-R interval series and x-axis of accelerometer during static and walking conditions. (Right bottom) Zooming into the data shows the overlapping respiratory sinus arrhythmia on the ECG based R-R interval sequence and the respiratory modulation from the chest accelerometer. (Left bottom) overlapping cardiac beats and contractions registered with ECG electrodes and the chest accelerometer.
TABLE V STATISTICAL INDICES FOR VARIOUS ACTIVITY INTENSITY
Dog
Static (Standing, laying down) Walking Mean R-R
interval (SD) ms
SE (TP,FN)
SP (TP,FP)
Mean R-R interval (SD) ms
SE (TP,FN)
SP (TP,FP)
1 675 (110) 1 (43,0) 0.977 (43,1)
580 (114) 0.966 (171,6)
0.983 (171,3)
2 532 (57) 1 (204,0)
1 (204,0)
419 (83) 0.957 (310,14)
1 (310,0)
3 607 (63) 0.996 (285,1)
1 (285,0)
456 (41) 0.976 (320,8)
1 (320,0)
4 587(177) 0.988 (252,3)
0.996 (252,1)
490 (69) 0.988 (429,5)
1 (429,0)
5 612 (80) 0.979 (138,3)
1 (138,0)
522 (80) 0.965 (278,10)
1 (278,0)
Fig 9. Sequence of R-R interval of two minutes of walking followed by standing. Data recorded with the holter device, our system, and the difference between these are shown.

1530-437X (c) 2015 IEEE. Personal use is permitted, but republication/redistribution requires IEEE permission. Seehttp://www.ieee.org/publications_standards/publications/rights/index.html for more information.
This article has been accepted for publication in a future issue of this journal, but has not been fully edited. Content may change prior to final publication. Citation information: DOI10.1109/JSEN.2015.2485210, IEEE Sensors Journal
> REPLACE THIS LINE WITH YOUR PAPER IDENTIFICATION NUMBER (DOUBLE-CLICK HERE TO EDIT) <
9
C. In vivo PPG system performance The performance characterization of the custom PPG system
and the evaluation of the efficacy of the incorporation of lights guides in improving the tissue-device interface involved performing PPG recordings on a chest in the presence of hair.
a) Experimental Setup We evaluated the performance of the system on Dog 1 during
rest. We placed the PPG sensor equipped with light guides in the LED and photodetector against the skin in an unshaved region and held in place by the chest strap (Fig. 2). We also used the PPG signal to extract the respiration rate from the respiration related modulation.
b) Results Fig. 12 shows a sample PPG signal that demonstrates the
heart beat and respiration related modulations on the dog during rest. The signal significantly degraded during higher intensity activities. Although the light guide method was effective in static postures and can be used for self-calibration and PTT tracking, more studies are required for deployment during dynamic activities.
V. DISCUSSION AND CONCLUSION The traditional ECG electrode patches used in veterinary
clinics require removal of dense layers of hair and are prone to detachment when the animal is on the move, thereby limiting their use during daily life activities. In this article, we studied the use of pointed style electrodes traditionally used in training collars and comb-shaped spring-loaded pin arrays to overcome these limitations. We performed in vitro EIS characterization of the electrodes showing that the impedance of the stainless steel pointed style electrodes is comparable to the comb-shaped electrode containing six spring-loaded pins. We showed that the impedances below the stainless steel electrode can be achieved by increasing the number of pins or by coating the pins with PEDOT:PSS.
We performed in vivo EIS measurements to compare the electrical properties of the tissue-electrode interface formed with patch electrodes, pointed style electrodes, and spring-loaded pin arrays under various interface conditions (i.e., presence of hair and application of an electrolyte gel).
These in vivo experiments validated the improvement in the impedance with the use of spring-loaded PEDOT:PSS coated pin arrays in comparison to the pointed style stainless steel electrodes. These electrodes provided ECG signals without requiring the removal of hair and provided similar impedance to the traditional clinical ECG electrode patches attached to the shaved skin. We tested the electrodes by observing key HRV signatures on five dogs of various size, breed, and amount of hair.
We also presented our preliminary results in improving the tissue-device interface of a custom built PPG system intended for self-calibration, PTT measurements, and in the long term for continuous recording of HRV when ECG recordings are noisy. We validated the efficacy of incorporation of light guides and optical fibers to light sources and detectors for an improved optical coupling with the skin at new body locations other than the ear or tongue.
The next stage of this research involves the collection of physiological data and behavioral information during extended periods of typical daily life activities and perform multimodal information fusion to achieve robust heart rate monitoring in wearable form factors. The combination of physiological signals and canine body language recognition can be used to provide more objective interpretation of canine emotional response to external stimuli and environments.
In conclusion, we have demonstrated a robust and successful heart rate monitoring system for dogs during low and moderate activity intensity enabled by the hardware improvements performed at the electrodes. This physiological data would enable handlers to monitor dog welfare and enhance the understanding of its emotional response to certain conditions.
ACKNOWLEDGMENTS The authors would like to thank NCSU Nanofabrication
Facility, Bruce Sprague and Michael McKnight for the SEM Images, and Ashley Wagner and Sean Mealin with experimental help. This research was supported by the National Science Foundation (CNS 1329738).
REFERENCES [1] S. Venkatraman, X. Jin, R. M. Costa, and J. M. Carmena, “Investigating
neural correlates of behavior in freely behaving rodents using inertial sensors.,” J. Neurophysiol., vol. 104, no. 1, pp. 569–75, Jul. 2010.
[2] B. D. Hansen, B. D. X. Lascelles, B. W. Keene, A. K. Adams, and A. E. Thomson, “Evaluation of an accelerometer for at-home monitoring of spontaneous activity in dogs,” Am. J. Vet. Res., vol. 68, no. 5, 2007.
[3] R. a Galosy, L. K. Clarke, and J. H. Mitchell, “Cardiac changes during behavioral stress in dogs.,” Am. J. Physiol., vol. 236, no. 5, pp. H750–8, May 1979.
[4] M. Malik, “Heart Rate Variability,” Ann. Noninvasive Electrocardiol., vol. 1, no. 2, pp. 151–181, 1996.
[5] E. Mohr, J. Langbein, and G. Nürnberg, “Heart rate variability: a noninvasive approach to measure stress in calves and cows,” Physiol. Behav., vol. 75, no. 1, pp. 251–259, 2002.
[6] “Alba Medical Systems, Inc.” [Online]. Available: www.albamedical.com/transmitholter.html. [Accessed: 21-Jul-2014].
[7] E. F. Hiby, N. J. Rooney, and J. W. S. Bradshaw, “Dog training methods: their use, effectiveness and interaction with behaviour and welfare,” Anim. WELFARE-POTTERS BAR THEN WHEATHAMPSTEAD-, vol. 13, no. 1, pp. 63–70, 2004.
Fig. 12: Sample PPG signal recorded on a resting Labrador retriever demonstrates both heart beat and respiration related modulations.

1530-437X (c) 2015 IEEE. Personal use is permitted, but republication/redistribution requires IEEE permission. Seehttp://www.ieee.org/publications_standards/publications/rights/index.html for more information.
This article has been accepted for publication in a future issue of this journal, but has not been fully edited. Content may change prior to final publication. Citation information: DOI10.1109/JSEN.2015.2485210, IEEE Sensors Journal
> REPLACE THIS LINE WITH YOUR PAPER IDENTIFICATION NUMBER (DOUBLE-CLICK HERE TO EDIT) <
10
[8] A. Bozkurt, D. L. Roberts, B. L. Sherman, R. Brugarolas, S. Mealin, J. Majikes, P. Yang, and R. Loftin, “Toward Cyber-Enhanced Working Dogs for Search and Rescue,” Intell. Syst. IEEE, vol. 29, no. 6, pp. 32–39, Nov. 2014.
[9] R. Brugarolas, D. L. Roberts, B. Sherman, and A. Bozkurt, “Posture Estimation for a Canine Machine Interface Based Training System,” in Proceedings of The Engineering in Medicine and Biology Conference, 2012, pp. 4489–4492.
[10] R. Brugarolas, D. Roberts, B. Sherman, and A. Bozkurt, “Machine Learning Based Posture Estimation for a Wireless Canine Machine Interface,” in IEEE Topical Conference on Biomedical Wireless Technologies, Networks, and Sensing Systems (BioWireless), 2012, pp. 3–5.
[11] R. Brugarolas, R. T. Loftin, P. Yang, D. L. Roberts, B. Sherman, and A. Bozkurt, “Behavior Recognition Based on Machine Learning Algorithms for a Wireless Canine Machine Interface,” in 10th annual Body Sensor Networks Conference, 2013, pp. 1–5.
[12] L. P. Tilley and F. W. K. Smith Jr, Blackwell’s five-minute Veterinary consult: canine and feline. John Wiley & Sons, 2011.
[13] B. Beerda, M. B. H. Schilder, J. A. R. A. . van Hooff, H. W. de Vries, and J. A. Mol, “Behavioural, saliva cortisol and heart rate responses to different types of stimuli in dogs,” Appl. Anim. Behav. Sci., vol. 58, no. 3, pp. 365–381, Feb. 2015.
[14] “Corsience GmbH & Co. KG.” [Online]. Available: www.corscience.de/en/medicalengineering/products/telemedicine/te-sys-ecg.html. [Accessed: 21-Jul-2014].
[15] “EMKA Technologies.” [Online]. Available: www.telemetry.emka.fr/prod.php?prod=4. [Accessed: 21-Jul-2014].
[16] “Integrated Telemetry Systems.” [Online]. Available: www.itstelemetry.com. [Accessed: 21-Jul-2014].
[17] V. S. M. Jonckheer-Sheehy, C. M. Vinke, and A. Ortolani, “Validation of a Polar® human heart rate monitor for measuring heart rate and heart rate variability in adult dogs under stationary conditions,” J. Vet. Behav. Clin. Appl. Res., vol. 7, no. 4, pp. 205–212, Jul. 2012.
[18] A. Essner, R. Sjöström, E. Ahlgren, and B. Lindmark, “Validity and reliability of Polar® RS800CX heart rate monitor, measuring heart rate in dogs during standing position and at trot on a treadmill,” Physiol. Behav., vol. 114–115, no. 0, pp. 1–5, Apr. 2013.
[19] D. S. Quintana, J. a J. Heathers, and A. H. Kemp, “On the validity of using the Polar RS800 heart rate monitor for heart rate variability research.,” Eur. J. Appl. Physiol., vol. 112, no. 12, pp. 4179–80, Dec. 2012.
[20] A. Bozkurt and A. Lal, “Low-cost flexible printed circuit technology based microelectrode array for extracellular stimulation of the
invertebrate locomotory system,” Sensors Actuators A Phys., vol. 169, no. 1, pp. 89–97, Sep. 2011.
[21] K. A. Ludwig, N. B. Langhals, M. D. Joseph, S. M. Richardson-Burns, J. L. Hendricks, and D. R. Kipke, “Poly(3,4-ethylenedioxythiophene) (PEDOT) polymer coatings facilitate smaller neural recording electrodes,” J. Neural Eng., vol. 8, no. 1, p. 14001, 2011.
[22] X. Cui and D. C. Martin, “Electrochemical deposition and characterization of poly(3,4-ethylenedioxythiophene) on neural microelectrode arrays,” Sensors and Actuators B-chemical, vol. 89, no. 1, pp. 92–102, 2003.
[23] N. S. Matthews, S. Hartke, and J. C. Allen, “An evaluation of pulse oximeters in dogs, cats and horses.,” Vet. Anaesth. Analg., vol. 30, no. 1, pp. 3–14, Jan. 2003.
[24] H. Gesche, D. Grosskurth, G. Küchler, and A. Patzak, “Continuous blood pressure measurement by using the pulse transit time: comparison to a cuff-based method,” Eur. J. Appl. Physiol., vol. 112, no. 1, pp. 309–315, 2012.
[25] K. Maros, A. Dóka, and Á. Miklósi, “Behavioural correlation of heart rate changes in family dogs,” Appl. Anim. Behav. Sci., vol. 109, no. 2, pp. 329–341, 2008.
[26] P. Viola and M. Jones, “Robust Real-time Object Detection,” in Second International Workshop on Statistical and Computational Theories of Vision, 2001, pp. 1–25.
[27] P. Castiglioni, A. Faini, G. Parati, and M. Di Rienzo, “Wearable seismocardiography,” in Engineering in Medicine and Biology Society, 2007. EMBS 2007. 29th Annual International Conference of the IEEE, 2007, pp. 3954–3957.
[28] J. Zanetti and others, “Seismocardiography: a new technique for recording cardiac vibrations. Concept, method, and initial observations,” J. Cardiovasc. Technol., vol. 9, no. 2, pp. 111–118, 1990.
[29] Beaglebord.org, “BeagleBone Black.” [Online]. Available: Beaglebord.org. [Accessed: 02-Jan-2015].
[30] G. Technologies, “g.tec Sahara dry electrode.” [Online]. Available: http://www.gtec.at/. [Accessed: 02-Jan-2015].
[31] W. A. H. Engelse and C. Zeelenberg, “A single scan algorithm for QRS-detection and feature extraction,” Comput. Cardiol., vol. 6, no. 1979, pp. 37–42, 1979.
[32] S. T. Boerema, L. van Velsen, L. Schaake, T. M. Tönis, and H. J. Hermens, “Optimal sensor placement for measuring physical activity with a 3D accelerometer,” Sensors, vol. 14, no. 2, pp. 3188–3206, 2014.
[33] C. V. C. Bouten, K. Koekkoek, M. Verduin, R. Kodde, and J. D. Janssen, “A triaxial accelerometer and portable data processing unit for the assessment of daily physical activity,” Biomed. Eng. IEEE Trans., vol. 44, no. 3, pp. 136–147, 1997.