wealth management
TRANSCRIPT

Partner Wealth Management
Mark O’Reilly
Using History as a Guide
If you have a client logo or other co-branding to include, this should go here. It should never be larger than the Deloitte logo.
Wealth Management
Using History as Our Guide
Mark O’Reilly, FIA

2©2014. For information, contact Deloitte China.
Asset Classes Property (real estate)
Equities (domestic, international)
Bonds
Annuities
Cash or “near cash”
Decisions How to allocate
What vehicles to use
How frequently to review
Wealth ManagementWhat We Can Invest In

3©2014. For information, contact Deloitte China.
EquitiesWhat Can We Reasonably Expect?
1
10
100
1,000
10,000
100,000
1,000,000
10,000,000
1871
1875
1879
1883
1887
1891
1895
1899
1903
1907
1911
1915
1919
1923
1927
1931
1935
1939
1943
1947
1951
1955
1959
1963
1967
1971
1975
1979
1983
1987
1991
1995
1999
2003
2007
2011
S&P500 Adjusted for Inflation, 1871-2015
Over 200 years, stockmarkets have show great volatility from year to year, but have proved much more consistent for periods of twenty+ years.
If history is any guide, they offer the best foundation for long-term (30 years+) years of investing
We use the S&P500 as an example because:
It represents 75% of the stock value in the USA;
The US market is one of the oldest and has been least affected by wars, civil unrest, etc.
It remains 38% of global exchanges and 50% of global indexes

4©2014. For information, contact Deloitte China.
EquitiesS&P500: Periods of the Best and Worst Returns
Period(Inclusive) Years Real Nominal Real Nominal1871-2014 144 7% 9% 1,501,528$ 28,159,836$ 1948-1965 18 14% 16% 1,060$ 1,422$ 1982-1999 18 15% 19% 1,216$ 2,176$ 2009-2014 6 15% 17% 235$ 260$ 2000-2008 9 -6% -4% 57$ 71$ 1966-1974 9 -5% 0% 61$ 99$ 1966-1981 16 -1% 6% 84$ 250$ 1929-1932 4 -16% -22% 49$ 37$ 1929-1947 19 1% 1% 121$ 121$
Annualized Return $100 Becomes
There is no pattern to bull or bear markets, and the effects of inflation upon “real” returns can vary greatly (real return = nominal return adjusted for consumer prices)
Return = appreciation + dividends. Does not reflect trading costs which were very substantial until the 1980s and remained substantial until the 2000s
"Stock prices have reached what looks like a permanently high plateau." Irving Fisher, October 21, 1929

5©2014. For information, contact [Legal name and branch name]. (Go Header & Footer to edit this text)
Equities
11.6%The annual return on the S&P500 over the
last 30 years
3.8%The annual return
earned by stock mutual-fund investors over the
last 30 years*
2.7%The annual rate of price inflation over the last 30
years
1.8%The annual return earned
by asset-allocation mutual-fund investors over the last
30 years*
“The overwhelming driver is bad timing by investors.”
“It would also help to design products that give an incentive not to bail out at the wrong moment.”
John Authers, The Financial Times
* Quantitative Analysis of Investor Behavior published by the US market research group Dalbar
The Dangers of Following the Market’s Momentum
6©2014. For information, contact Deloitte China.
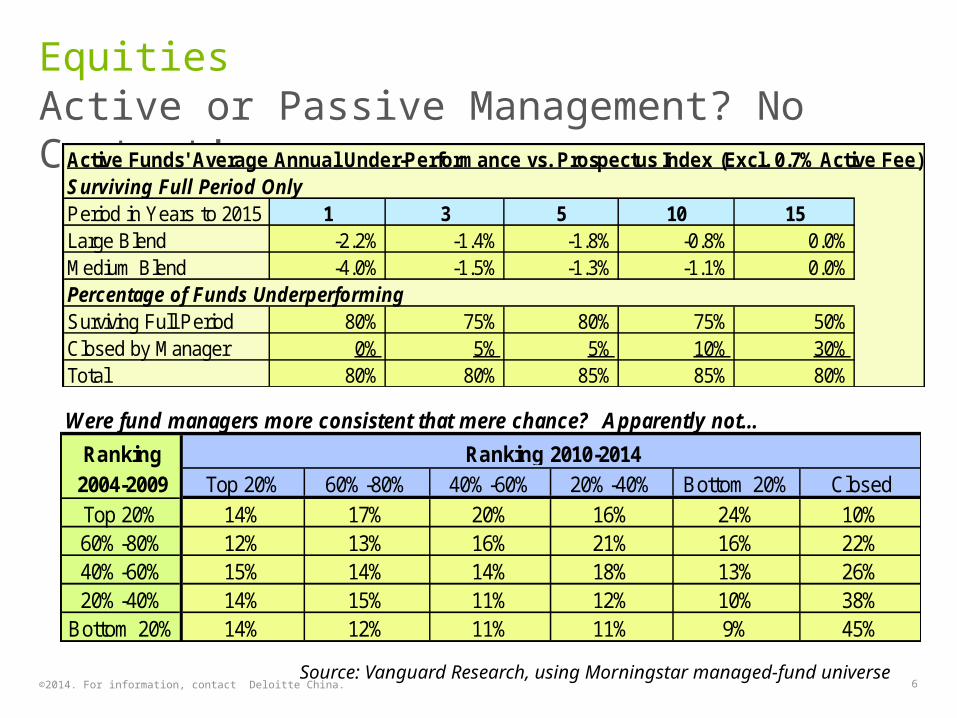
EquitiesActive or Passive Management? No Contest!
Active Funds' Average Annual Under-Performance vs. Prospectus Index (Excl. 0.7% Active Fee)Surviving Full Period OnlyPeriod in Years to 2015 1 3 5 10 15Large Blend -2.2% -1.4% -1.8% -0.8% 0.0%Medium Blend -4.0% -1.5% -1.3% -1.1% 0.0%Percentage of Funds UnderperformingSurviving Full Period 80% 75% 80% 75% 50%Closed by Manager 0% 5% 5% 10% 30%Total 80% 80% 85% 85% 80%
Source: Vanguard Research, using Morningstar managed-fund universe
Were fund managers more consistent that mere chance? Apparently not…Ranking
2004-2009 Top 20% 60%-80% 40%-60% 20%-40% Bottom 20% ClosedTop 20% 14% 17% 20% 16% 24% 10%60%-80% 12% 13% 16% 21% 16% 22%40%-60% 15% 14% 14% 18% 13% 26%20%-40% 14% 15% 11% 12% 10% 38%
Bottom 20% 14% 12% 11% 11% 9% 45%
Ranking 2010-2014

©2014. For information, contact Deloitte China. 7
How Expensive is the Current Market?Equities
The Shiller S&P500 PE Ratio*
Current Value: 24.6 Mean:16.6 Median: 16.0 Min: 4.8 Max: 44.2
Source: Robert Shiller, Yale University
* Uses average inflation-adjusted earnings from prior ten years
0
5
10
15
20
25
30
35
40
45
50
01-J
an-0
201
-Jan
-05
01-J
an-0
801
-Jan
-11
01-J
an-1
401
-Jan
-17
01-J
an-2
001
-Jan
-23
01-J
an-2
601
-Jan
-29
01-J
an-3
201
-Jan
-35
01-J
an-3
801
-Jan
-41
01-J
an-4
401
-Jan
-47
01-J
an-5
001
-Jan
-53
01-J
an-5
601
-Jan
-59
01-J
an-6
201
-Jan
-65
01-J
an-6
801
-Jan
-71
01-J
an-7
401
-Jan
-77
01-J
an-8
001
-Jan
-83
01-J
an-8
601
-Jan
-89
01-J
an-9
201
-Jan
-95
01-J
an-9
801
-Jan
-01
01-J
an-0
401
-Jan
-07
01-J
an-1
001
-Jan
-13
01-J
an-1
6
©2016. For information, contact Deloitte China 8
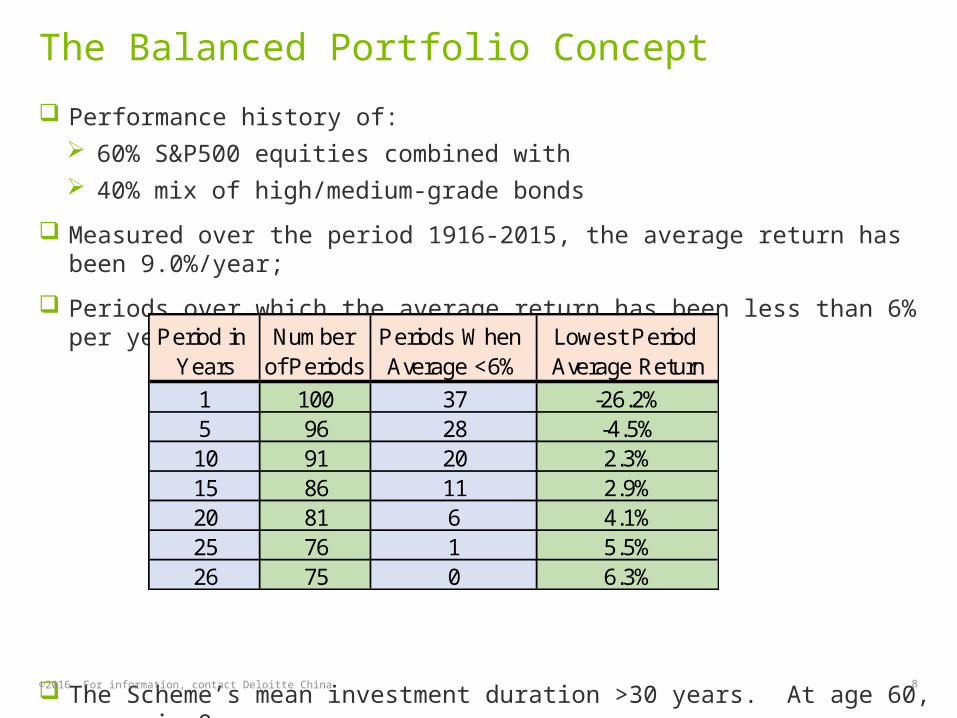
The Balanced Portfolio Concept
Performance history of: 60% S&P500 equities combined with 40% mix of high/medium-grade bonds
Measured over the period 1916-2015, the average return has been 9.0%/year;
Periods over which the average return has been less than 6% per year:
The Scheme’s mean investment duration >30 years. At age 60, yours is 8 years
.
* Source: NYU Stern School of Business, US Federal Reserve
Period in Years
Number of Periods
Periods When Average <6%
Lowest Period Average Return
1 100 37 -26.2%5 96 28 -4.5%10 91 20 2.3%15 86 11 2.9%20 81 6 4.1%25 76 1 5.5%26 75 0 6.3%

©2014. For information, contact Deloitte China. 9
How to Choose the Equities?Bonds with Equities
Like the S&P500 tracks 75% of the US stockmarket, there are indexed funds which track the global equity market, in proportion to its freely tradable market capitalization. For example, the FTSE* Global All Cap Index (GACI) differs from the market cap of global exchanges as follows:
Country/Exchange Index ExchangesUnited States 51% 38%United Kingdom 7% 9%Japan 8% 7%China (incl HK) 4% 14%Other Europe 14% 13%Australia/Canada 6% 4%Other 10% 15%Total 100% 100%
An advantage of choosing the global market is avoiding making “bets” on which local market performs best. For freely traded stocks, current prices represent the consensus of global investors, so any apparent advantage is already “priced in” at this consensus.
* FTSE Group, subsidiary of the London Stock Exchange (FTSE30 and FTSE100 are the LSE’s primary benchmarks)
A low-cost tracker fund for the GACI is Vanguard Total World Stock Fund (VT)

©2014. For information, contact Deloitte China. 10
How to Choose the Bonds?Bonds with Equities
An important first step is to understand the nature of the bond market
Term/ DefaultBond Types Risk Level Source 10/06/2015 17/04/2015 Rate /Year "BND"
Treasuries "Risk free" 10y 2.5% 1.7% NilTreasuries "Risk free" 20y 3.0% 2.3% NilTIPS "Risk free"/Inflation-linked 20y 1.0% 0.4% NilAAA Very high quality Fed. 4.3% 3.4% Negligible 6%AA High quality est. 4.6% <0.1% 4%A Upper medium quality est. 4.9% 0.10% 13%BBB (Baa) Medium quality Fed. 5.2% 4.4% 0.40% 14%"Junk" Below medium quality Fund 6%+ >2%? Nil
Yield
63%
A deeper look into US bonds…
US Bond MarketBond Type 2007 2015Treasuries 14% 32%Other Government 20% 15%Corporate 17% 20%Mortgage/Asst-backed 36% 26%Money Market 14% 7%Total US$ trillions $31.7 $39.2
Global Financial AssetsAsset Type 2007 2008 2014Equities 27% 15% 23%Government bonds 14% 17% 20%Corporate bonds 33% 37% 31%Other loans 26% 31% 26%Total US$ trillions $242 $222 $294

©2014. For information, contact Deloitte China. 11
Mutual Funds vs. Exchange-Traded Funds (ETFs)Bonds with Equities
Mutual Fund
Since 1920s1970s: 400 funds, $50BN2015: >15,000 US funds, $17TN $30TN worldwide 22% US household wealth
Open-ended fund invested according to prospectus (active or indexed)
Price valuation, purchase and sales can occur only at market closeLowest management fee: 0.05%
ETF
Since 1990s201%: >1,500 US funds, $2TN
Open-ended fund invested according to prospectus. Will seek to match a given index of equities or bonds (includes international, commodity and industry sectors.)
Funds are listed in exchange, starting at portfolio value but thereafter according to trades of market-makers, i.e rely upon market efficiency.Lowest management fee: 0.05%
©2014. For information, contact Deloitte China. 12
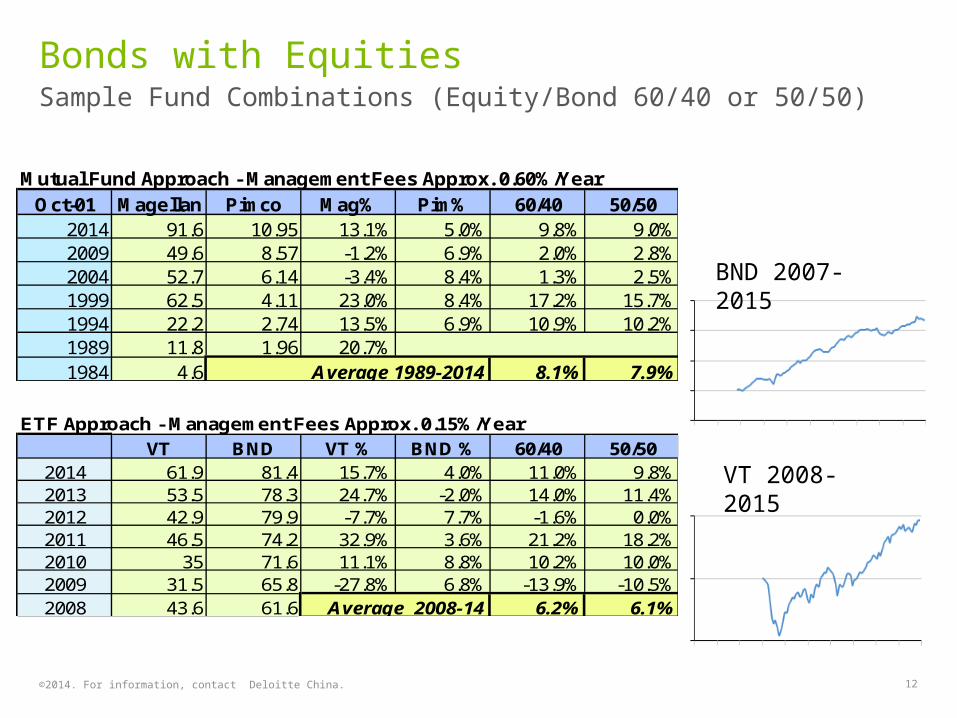
Sample Fund Combinations (Equity/Bond 60/40 or 50/50)Bonds with Equities
ETF Approach - Management Fees Approx. 0.15%/YearVT BND VT % BND % 60/40 50/50
2014 61.9 81.4 15.7% 4.0% 11.0% 9.8%2013 53.5 78.3 24.7% -2.0% 14.0% 11.4%2012 42.9 79.9 -7.7% 7.7% -1.6% 0.0%2011 46.5 74.2 32.9% 3.6% 21.2% 18.2%2010 35 71.6 11.1% 8.8% 10.2% 10.0%2009 31.5 65.8 -27.8% 6.8% -13.9% -10.5%2008 43.6 61.6 Average 2008-14 6.2% 6.1%
Mutual Fund Approach - Management Fees Approx. 0.60%/YearOct-01 Magellan Pimco Mag% Pim% 60/40 50/50
2014 91.6 10.95 13.1% 5.0% 9.8% 9.0%2009 49.6 8.57 -1.2% 6.9% 2.0% 2.8%2004 52.7 6.14 -3.4% 8.4% 1.3% 2.5%1999 62.5 4.11 23.0% 8.4% 17.2% 15.7%1994 22.2 2.74 13.5% 6.9% 10.9% 10.2%1989 11.8 1.96 20.7%1984 4.6 Average 1989-2014 8.1% 7.9%
VT 2008-2015
BND 2007-2015

13©2014. For information, contact Deloitte China.
PropertyGlobal ValuationsFirst Half 2014, Financial Times Survey
CityPrice To Income Ratio
Gross Rental
Yield City Centre %
Gross Rental Yield
Outside of Centre %
Price To Rent Ratio
City Centre
Price To Rent Ratio Outside Of
City Centre
Mortgage as Percentage Of Income
%
Beijing, China 33.6 2.7 2.7 36.6 37.8 290Hong Kong, Hong Kong 29.0 3.0 2.9 33.2 34.6 189Guangzhou, China 27.6 2.8 2.5 36.2 39.4 224Shenzhen, China 27.4 2.9 3.5 34.8 28.8 265Shanghai, China 27.4 3.2 3.5 31.2 28.4 242Singapore, Singapore 21.6 3.9 4.2 25.7 23.7 136Paris, France 16.6 2.7 2.9 37.1 34.6 116London, United Kingdom 16.2 3.9 4.2 25.9 23.9 120Barcelona, Spain 13.2 3.4 4.0 29.1 25.3 88Munich, Germany 11.6 3.0 3.6 33.7 28.0 81Amsterdam, Netherlands 9.4 4.8 4.9 21.0 20.6 70San Francisco, CA, United States 9.4 6.2 5.5 16.1 18.3 69Sydney, Australia 8.6 5.3 5.5 18.9 18.3 72Tokyo, Japan 8.2 5.8 4.1 17.3 24.5 50New York, NY, United States 8.1 6.2 7.9 16.1 12.7 59Brussels, Belgium 6.0 5.9 6.7 16.8 15.0 43Frankfurt, Germany 4.9 4.0 4.5 24.8 22.4 32Boston, MA, United States 3.5 12.7 11.6 7.9 8.7 25Chicago, IL, United States 3.3 11.3 12.9 8.8 7.8 25Philadelphia, PA, United States 2.7 12.0 12.7 8.3 7.9 20

14©2014. For information, contact Deloitte China.
PropertyDemographic Headwinds (Source: United Nations)
Japan
Females 20-29 60-74 75+1975 100% 100% 100%1980 85% 114% 129%1985 80% 117% 136%1990 84% 121% 144%1995 93% 124% 151%2000 91% 128% 159%2005 80% 132% 168%
Selected Age Groups
-
5,000
10,000
15,000
20,000
25,000
30,000
JAPAN - Females, Selected Age Groups
20-29 60-74 75+
Females 20-29 60-74 75+1995 100% 100% 100%2000 88% 110% 112%2005 82% 112% 116%2010 97% 113% 120%2015 96% 115% 124%2020 75% 118% 128%2025 62% 120% 132%
Selected Age Groups
China
-
50,000
100,000
150,000
200,000
250,000
CHINA - Females, Selected Age Groups
20-29 60-74 75+
40% drop for ages 25-29

15©2014. For information, contact Deloitte China.
PropertyREITs are a Means to Invest in Property through Tradable Equity
To qualify as a US REIT: >=75% assets in real estate >=75% gross income from
rents, mortgages, financing & sales of real property
>=90% of taxable income paid as dividends
Be managed by a board of directors or trustees
<=50% shares held by five individuals Industry Type US Index
Retail 25%Residential 17%Office 16%Healthcare 14%Hotel 7%Factory 4%Other 17%
Global Ex-USA
USA
Comparing Returns at 31/3/15Period US REITs S&P500
1 year 24.2% 12.7%3 years 14.2% 16.1%5 years 15.9% 14.5%10 years 9.8% 8.0%
S&P Global ex-U.S. Property IndexCompany %
Mitsubishi Estate Co Ltd 3.4MITSUI FUDOSAN CO LT 3.0CKH Food & Health Limited 2.9Sun Hung Kai Properties Ltd 2.8Unibail-Rodamco SE 2.8SUMITOMO REALTY & DE 1.9CHINA OVERSEAS LAND& 1.7Scentre Group 1.6Land Securities Group PLC 1.6Daiwa House Industry Co Ltd 1.5
Region AllocationPacific 51%Europe 23%Emerging 20%Other 6%
Unlike direct property ownership, REIT prices respond immediately to
investors’ views on future earnings, often leveraged by the REITs’ borrowing