ubs wealth management · ubs wealth management jürg zeltner ceo ubs wealth management november 17,...
TRANSCRIPT

UBS Wealth Management Jürg ZeltnerCEO UBS Wealth Management
November 17, 2011
Investor Day 2011

1
This presentation contains statements that constitute “forward-looking statements,” including but not limited to management’s outlook for UBS’s financial performance and statements relating to the anticipated effect of transactions and strategic initiatives on UBS’s business and future development. While these forward-looking statements represent UBS’s judgments and expectations concerning the matters described, a number of risks, uncertainties and other important factors could cause actual developments and results to differ materially from UBS’s expectations. Additional information about those factors is set forth in documents furnished or filed by UBS with the US Securities and Exchange Commission, including UBS's media release furnished on Form 6-K dated 17 November 2011, UBS’s financial report for third quarter 2011 filed on Form 6-K dated 25 October 2011 and UBS’s Annual Report on Form 20-F for the year ended 31 December 2010, as amended by Form 20-F/A filed on November 10, 2011. UBS is not under any obligation to (and expressly disclaims any obligation to) update or alter its forward-looking statements, whether as a result of new information, future events or otherwise.
This presentation and the information contained herein are provided solely for information purposes, and are not to be construed as a solicitation of an offer to buy or sell any securities or other financial instruments in Switzerland, the United States or any other jurisdiction. No investment decision relating to securities of or relating to UBS AG or its affiliates should be made on the basis of this document. No representation or warranty is made or implied concerning, and UBS assumes no responsibility for, the accuracy, completeness, reliability or comparability of the information contained herein relating to third parties, which is based solely on publicly available information. UBS undertakes no obligation to update the information contained herein.
Annualized figures for the first nine months of 2011 contained in this presentation do not constitute estimates of the actual 2011 full-year results.
© UBS 2011. The key symbol and UBS are among the registered and unregistered trademarks of UBS. All rights reserved.
Disclaimer
Cautionary statement regarding forward-looking statements

2
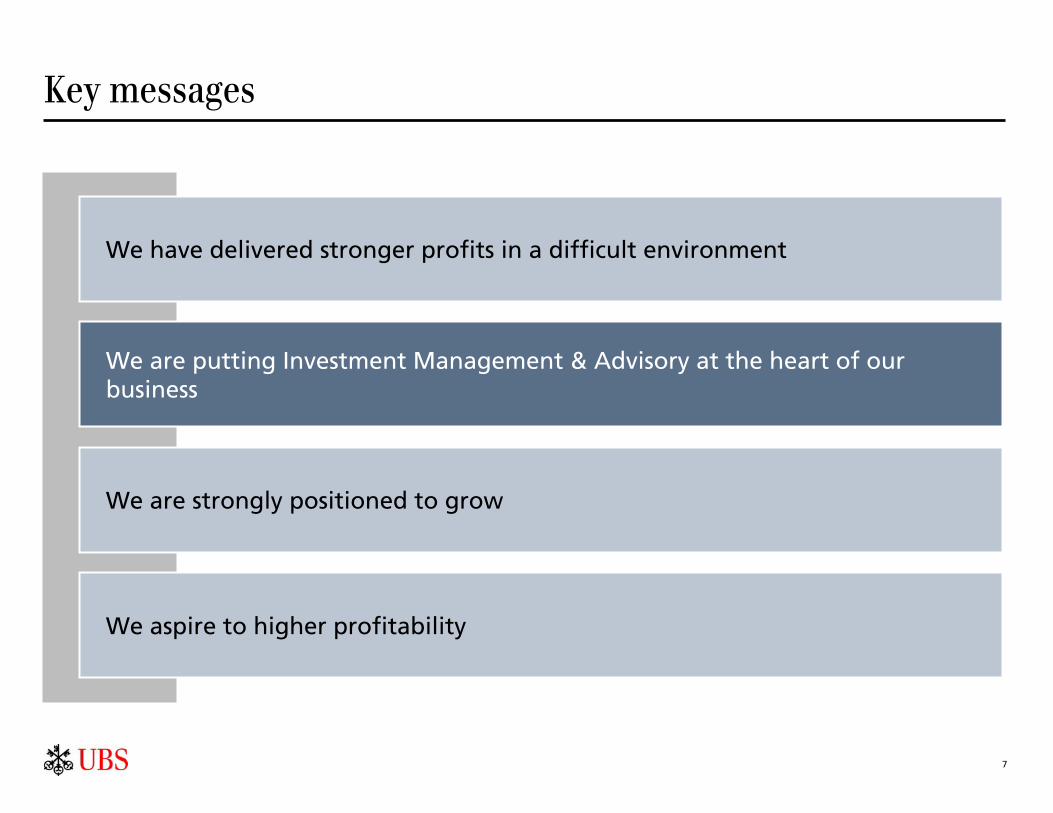
Key messages
We have delivered stronger profits in a difficult environment
We are strongly positioned to grow
We aspire to higher profitability
We are putting Investment Management & Advisory at the heart of our business
3
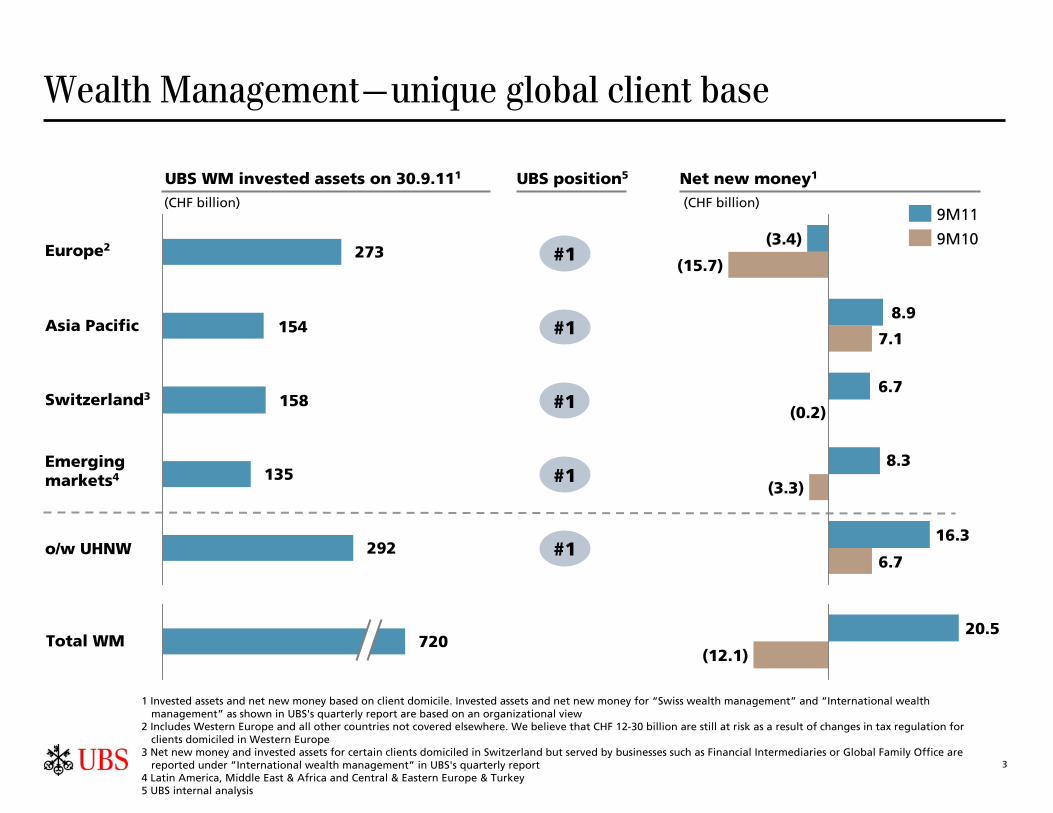
Wealth Management—unique global client base
UBS position5UBS WM invested assets on 30.9.111
o/w UHNW
Asia Pacific
Europe2
Net new money1
Emerging markets4
Switzerland3
#1
#1
#1
#1
#1
9M10
9M11
Total WM
(CHF billion) (CHF billion)
273
135
292
158
154
(3.3)
(15.7)
(3.4)
8.9
16.3
8.3
6.7
(0.2)
6.7
7.1
(12.1)
20.5720
1 Invested assets and net new money based on client domicile. Invested assets and net new money for “Swiss wealth management” and “International wealth management” as shown in UBS's quarterly report are based on an organizational view
2 Includes Western Europe and all other countries not covered elsewhere. We believe that CHF 12-30 billion are still at risk as a result of changes in tax regulation for clients domiciled in Western Europe
3 Net new money and invested assets for certain clients domiciled in Switzerland but served by businesses such as Financial Intermediaries or Global Family Office are reported under ”International wealth management” in UBS's quarterly report
4 Latin America, Middle East & Africa and Central & Eastern Europe & Turkey5 UBS internal analysis
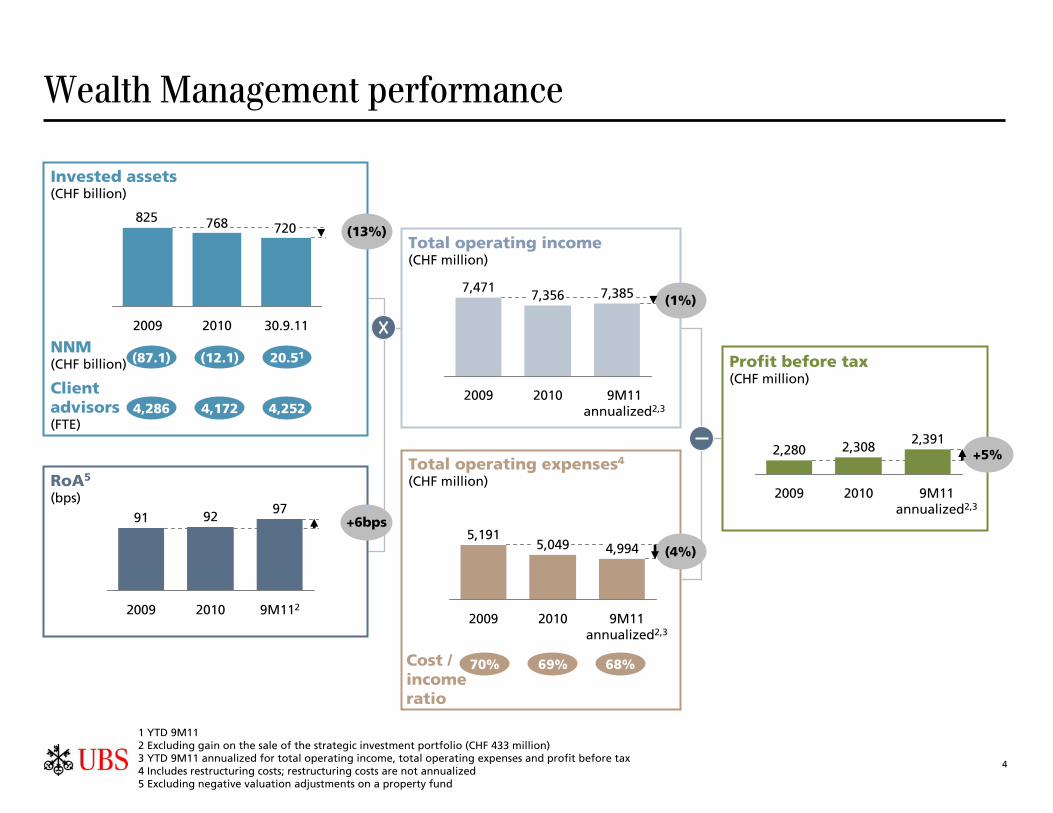
4
(13%)
(87.1) (12.1) 20.51NNM(CHF billion)
Invested assets(CHF billion)
RoA5
(bps)
Total operating expenses4
(CHF million)
Profit before tax(CHF million)
1 YTD 9M112 Excluding gain on the sale of the strategic investment portfolio (CHF 433 million)3 YTD 9M11 annualized for total operating income, total operating expenses and profit before tax4 Includes restructuring costs; restructuring costs are not annualized5 Excluding negative valuation adjustments on a property fund
Client advisors(FTE)
4,286 4,172 4,252
+6bps
Total operating income(CHF million)
Cost / income ratio
70% 69% 68%
Wealth Management performance
30.9.1120102009
720768825
97
9M1122010
92
2009
91
7,385
9M11 annualized2,3
2010
7,356
2009
7,471
5,049
20102009
5,1914,994
9M11 annualized2,3
9M11 annualized2,3
2,391
2009 2010
2,3082,280
(4%)
+5%
(1%)

5
Performance against WM peers
1 Delta RoA of period shown vs. RoA of preceding period; RoA calculated based on reported total operating income and average invested assets of respective period 2 Cost / income ratio of period shown3 Peers: Barclays, Crédit Agricole, Credit Suisse, EFG International, HSBC, JPMorgan, Julius Bär, RBS, Sarasin, Société Générale and Vontobel, WM definition can vary from
peer to peerSource: UBS internal analysis, certain peers adjusted based on available information
FY09 1H11
Cost / income ratio2,3
Peer A1
Peer G Peer G2
Peer B Peer E3
Peer E Peer A4
Peer C Peer C5
Rank
6
11
FY09 vs. FY08 1H11 vs. 2H10Rank
RoA change vs. previous period1,3
. .
. .
1 Peer A
2 Peer B Peer A
3 Peer C Peer F
4 Peer D Peer B
5 Peer E Peer E
6
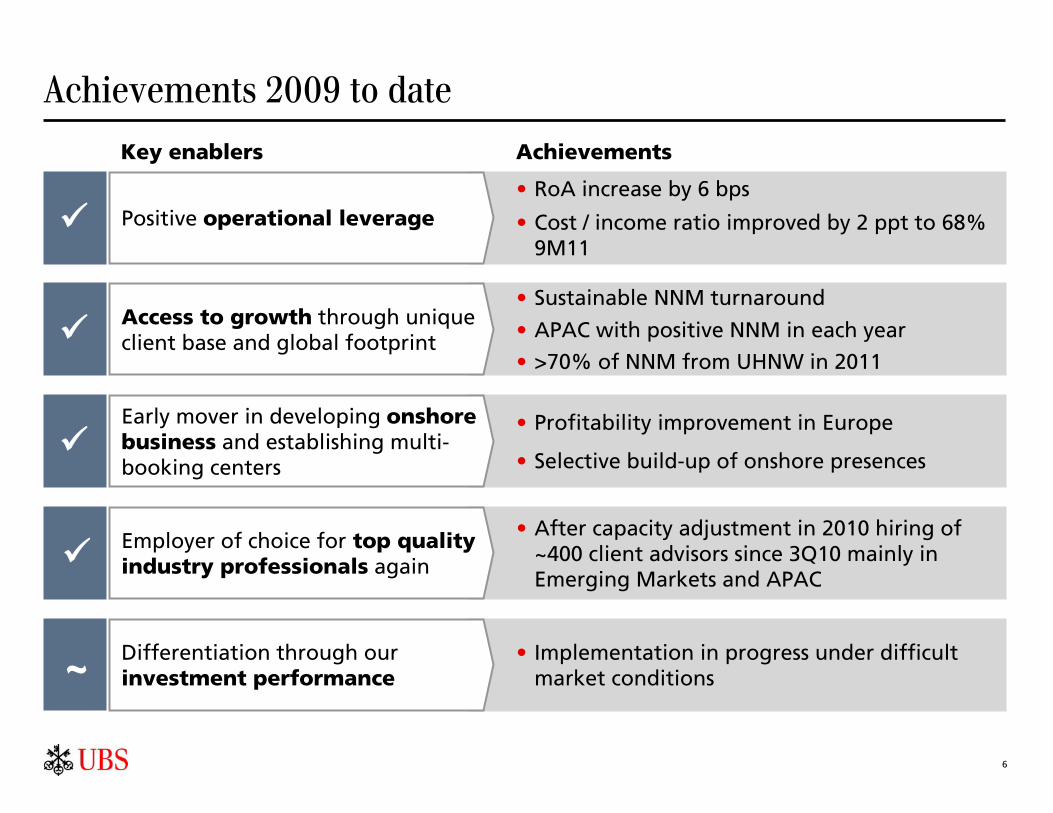
Achievements 2009 to date
• RoA increase by 6 bps
• Cost / income ratio improved by 2 ppt to 68% 9M11
Positive operational leverage
• Sustainable NNM turnaround
• APAC with positive NNM in each year
• >70% of NNM from UHNW in 2011
Access to growth through unique client base and global footprint
• Profitability improvement in Europe
• Selective build-up of onshore presences
Early mover in developing onshore business and establishing multi-booking centers
• After capacity adjustment in 2010 hiring of ~400 client advisors since 3Q10 mainly in Emerging Markets and APAC
Employer of choice for top quality industry professionals again
• Implementation in progress under difficult market conditions
Differentiation through ourinvestment performance~
Key enablers Achievements
7
Key messages
We have delivered stronger profits in a difficult environment
We are strongly positioned to grow
We aspire to higher profitability
We are putting Investment Management & Advisory at the heart of our business
8
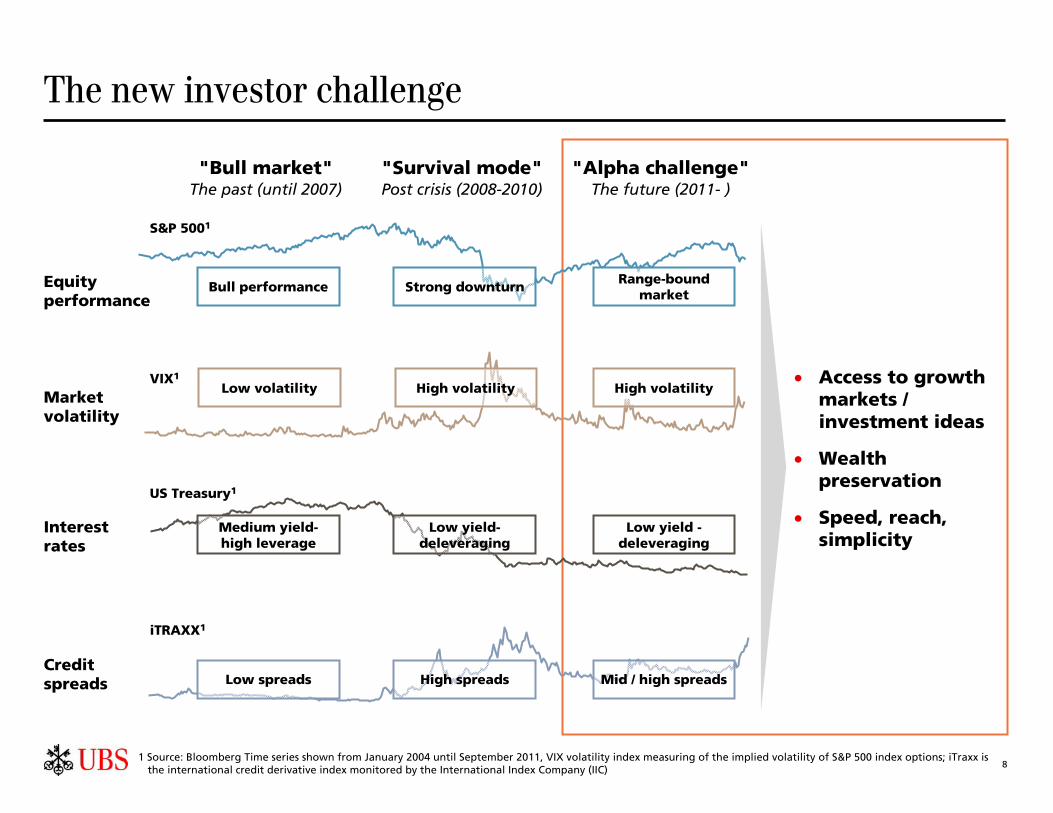
The new investor challenge
Interest rates
Equity performance
Market volatility
Credit spreads
"Bull market"The past (until 2007)
"Survival mode"Post crisis (2008-2010)
"Alpha challenge"The future (2011- )
S&P 5001
VIX1
US Treasury1
iTRAXX1
1 Source: Bloomberg Time series shown from January 2004 until September 2011, VIX volatility index measuring of the implied volatility of S&P 500 index options; iTraxx is the international credit derivative index monitored by the International Index Company (IIC)
Access to growth markets / investment ideas
Wealth preservation
Speed, reach, simplicity
Bull performance Strong downturnRange-bound
market
Low volatility High volatility High volatility
Medium yield-high leverage
Low yield-deleveraging
Low yield -deleveraging
Low spreads High spreads Mid / high spreads
9
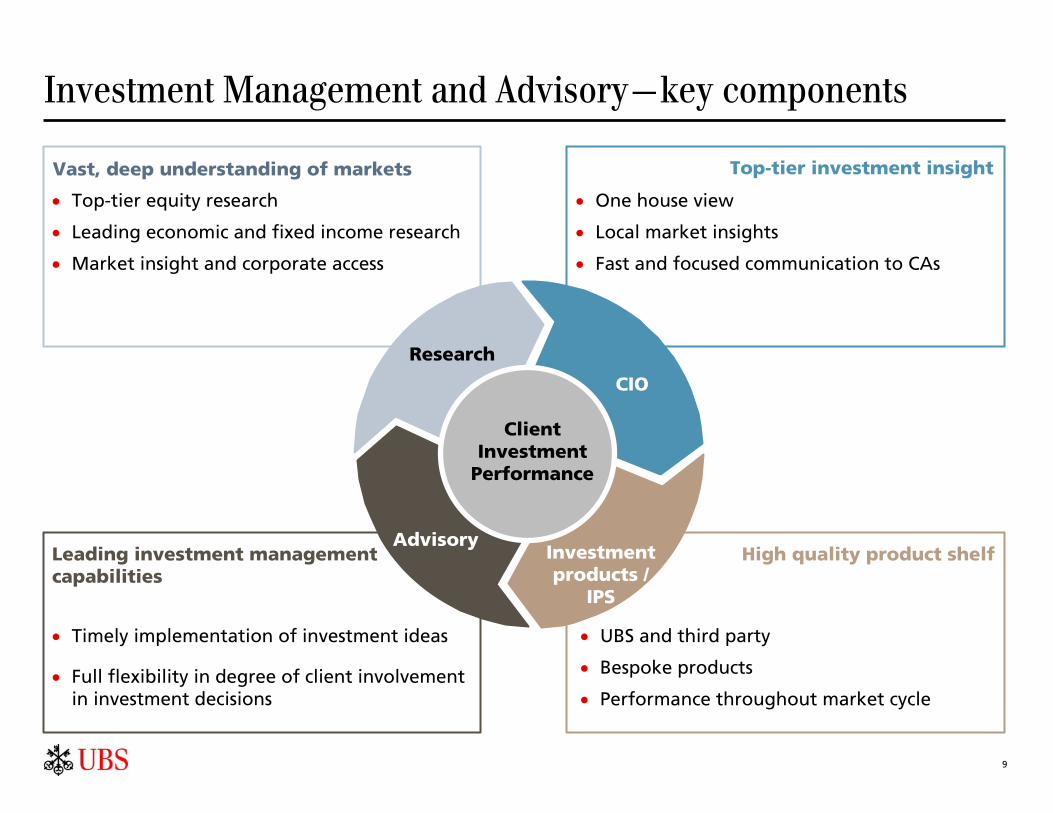
Investment Management and Advisory—key components
Vast, deep understanding of markets Top-tier investment insight
Leading investment management capabilities
High quality product shelf
One house view
Local market insights
Fast and focused communication to CAs
Timely implementation of investment ideas
Full flexibility in degree of client involvement in investment decisions
UBS and third party
Bespoke products
Performance throughout market cycle
Top-tier equity research
Leading economic and fixed income research
Market insight and corporate access
AdvisoryInvestment products /
IPS
Research
CIO
ClientInvestment
Performance

10
Chief Investment Officer driving the new investment process
CIO contribution
• Fast and crisp communication of UBS House View to advisors and clients
• Locally customized and suitable advisory packages providing actionable investment guidance for clients
• Ad-hoc communication in case of market events / turmoil
Communication andimplementation
• Chairing Global Investment Committee involving top investment professionals from entire firm
• Decision-making and formulating of UBS House View
- Asset allocation
- Investment themes
House View
• Integration of internal and external expertise
- Investment Bank and Global Asset Management
- WM Research and regional CIOs
- External investment professionals
• Development of Investment Strategy
Investment expertise
Global Investment Committee
Regional experts
External experts
UBS researchCIO

11
Investment Management and Advisory
Risk management
Asset servicing / Global custody
WealthManagement
Advisory
Portfolio management
Traditionalfunds
Hedge Funds
Private EquityReal Estate
Mandates
InvestmentBank
Global AssetManagement
GlobalInvestmentCommittee
ECM / DCM
Primebrokerage
Productdevelopment
Execution
Productdevelopment
Institutional clientsFamily officesPrivate clients
Traditional funds
Execution
Alternative investments
Third party Research

12
Investment Banking—a prerequisite for Wealth Management
Low Mid HighNeed for IB product
DC
M
EC
M
M&
A
Flo
w c
red
it
Cre
dit
solu
tio
ns
Co
rpo
rate
le
nd
ing
Rate
s
FXOth
er
macr
o /
Pro
p
Em
erg
ing
m
ark
ets
Co
mm
od
itie
s
Pri
me
bro
ke
rag
e
Cash
eq
uit
ies
Eq
uit
y
deri
vati
ves
Pro
p
Research
Institutional-like coverage (e.g. family offices)
Execution / risk
Product development
Exclusive investment opportunities
Investment Bank products
Advisory and corp. finance
IBDFICCEquities
Wealt
h M
an
ag
em
en
t n
eed
s
13
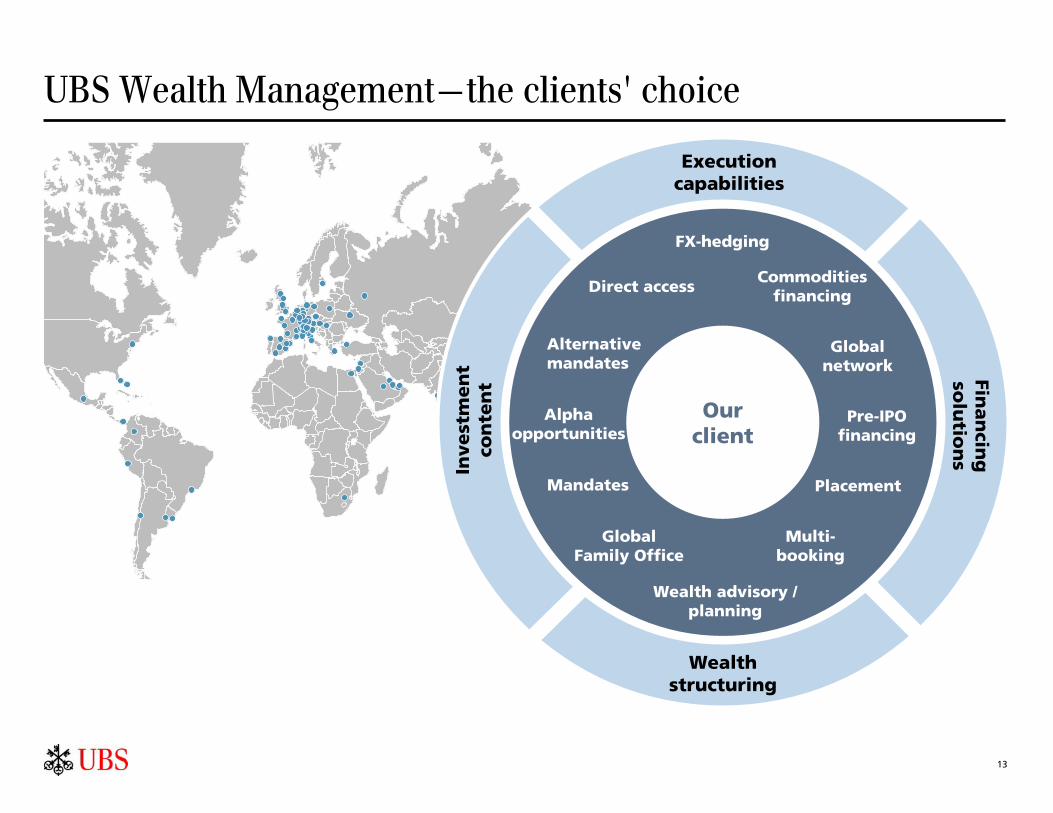
UBS Wealth Management—the clients' choice
FX-hedging
Commodities financing
Global network
Pre-IPO financing
Placement
Wealth advisory / planning
Multi-booking
Global Family Office
Mandates
Alpha opportunities
Alternative mandates
Direct access
Execution capabilities
Finan
cing
so
lutio
ns
Wealth structuring
Invest
men
t co
nte
nt
Ourclient

14
Key messages
We have delivered stronger profits in a difficult environment
We are strongly positioned to grow
We aspire to higher profitability
We are putting Investment Management & Advisory at the heart of our business

15
Well positioned in the most attractive markets
2% GDP growth p.a. until 2016
23% of global GDP in 2016
≈ 190 billionaires2
Western Europe1
4% GDP growth p.a. until 2016
17% of global GDP in 2016
≈ 240 billionaires2
Emerging Markets3 6% GDP growth p.a. until 2016
33% of global GDP in 2016
≈ 290 billionaires2
APAC
1 Including Switzerland2 USD billionaires3 Latin America, Middle East & Africa and Central & Eastern Europe & TurkeySources: IMF WEO Database Sept. 2011, Forbes List 2011
CHF 6.8trn new wealth generation by 2016
CHF 1.3trn new wealth generation by 2016
CHF 3.2trn new wealth generation by 2016

16
APAC—our strongest growth market
Net new money(CHF billion)
Invested assets(CHF billion)
• Hub strategy out of financial centers Singapore and Hong Kong
• Selective onshore market presences (e.g. Japan, Taiwan)
• Long-term investments in India and China
• Tight collaboration with IBD, IB Research and IB execution platform
Strategic focus
18 WM offices in 7 countries
Strong UBS franchise
Strong local Investment Bank footprint1:
• Top 2 position in IBD in Asia Pacific
• Top 3 position in Equities in HK/SG
• "Best Equity Bank in Asia" (Global Finance)
"Best Global Private Bank" (Asiamoney 2011)30.9.09 30.9.1130.9.10
154167155
9M119M09 9M10
972
1 Dealogic

17
Emerging markets1—leading franchise with growth potential
Net new money(CHF billion)
Invested assets(CHF billion)
Strong UBS franchise
WM present in more than 20 countries
Growing Investment Bank capabilities:
• "Best M&A Bank in Middle East" (Global Finance)
• "Top 2 overall Emerging Market Deal of the Year" (Euroweek)
• Six priority markets
• Selective build-up of local onshore presences (e.g. Brazil, Mexico, Israel)
• Cross-border business mainly out of US, UK and Switzerland
• UHNW focus due to prevalence of entrepreneurs
• Tight coordination with Investment Bank for market coverage and local market insights
• Opportunities for growth through acquisitions
Strategic focus
30.9.1130.9.1030.9.09
135139149
9M119M10
(3)
9M09
(11)
8
1 Latin America, Middle East & Africa and Central & Eastern Europe & Turkey

18
Switzerland—strengthen #1 position
• Full integration across all businesses (Retail and Corporate, Asset Management, Investment Bank)
• Strong referrals from Swiss Corporate and Retail client base
• Strong regional integration with Corporate and Retail leveraging joint platform and distribution network
Strategic focus
Strong UBS franchise
~100 WM offices in Switzerland
"Best Private Bank for UHNW clients"(Euromoney 2011)
Market leading position for UBS Global Asset Management
Invested assets(CHF billion)
Net new money(CHF billion)
30.9.10 30.9.1130.9.09
158163164
(7)
9M109M09 9M11
7
(0)
"Best M&A House in Switzerland" (Euromoney)

19
Convergence ofclient needs
Cross-border
Europe—the rules are changing
Increased international pressure on banking secrecy jurisdictions
Fiscal transparency
Increased regulatory requirements andcomplexity (high entry barriers)
Comprehensive Pan-European market access
Investor protection
MiFIDAIFMD
UCITS IV
FATCA
EUSDAbolition
Aut. inf. exchangeOECD art 26
Tax amnesties
Onshore
EU passport

20
Strong UBS franchise
• "Best Private Bank in Europe" (The Banker, Global Private Banking Awards 2011)
• "Best Private Bank for UHNW in Western Europe" (Euromoney 2011)
Global Asset Management: strong position in mutual fund business
• Combined market coverage – gain market share again
- Strong onshore franchise (10 countries, focus on UK, Germany and Italy)
- International business mainly served out of major financial centers Switzerland, UK and Luxembourg
• Tight profitability management (e.g. hub strategy for IT/Operations, product shelf, platform)
Strategic focus
Europe—our largest franchise
Investment Bank1: top 5 in IBD in UK and Germany
Invested assets(CHF billion)
Net new money(CHF billion)
30.9.1130.9.1030.9.09
273318380
(3)(16)
(39)
9M109M09 9M11
1 Dealogic

21
Key messages
We have delivered stronger profits in a difficult environment
We are strongly positioned to grow
We aspire to higher profitability
We are putting Investment Management & Advisory at the heart of our business
22
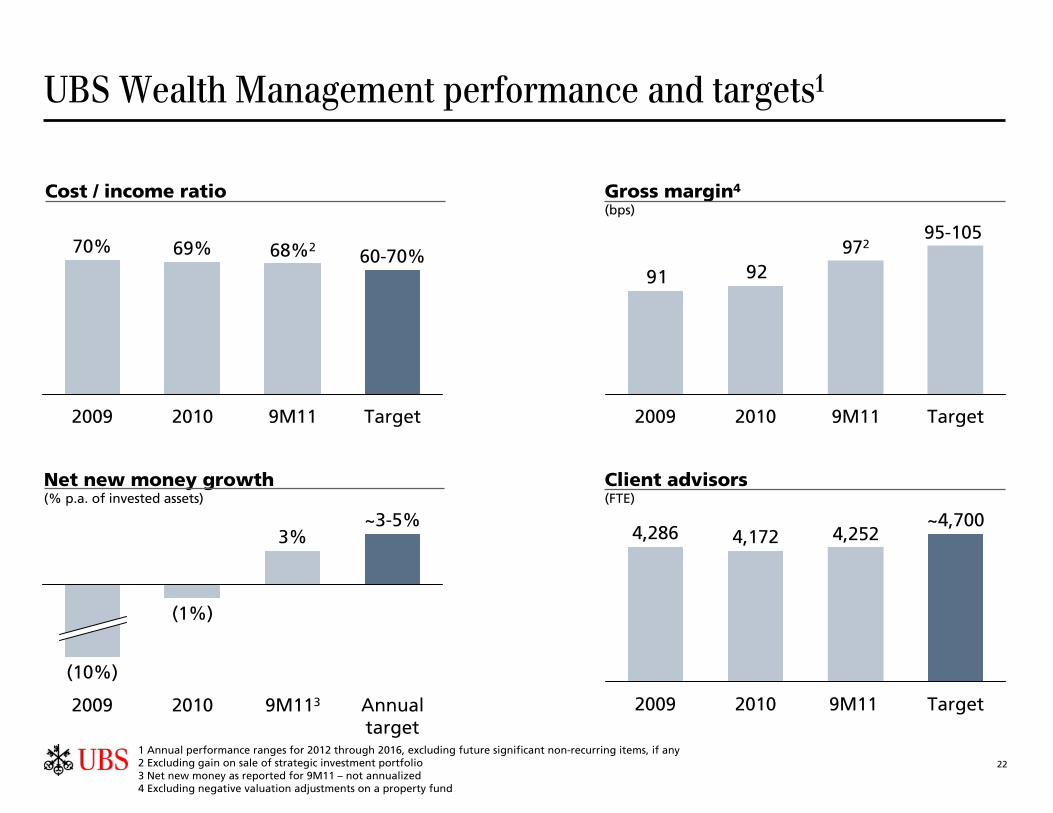
Cost / income ratio Gross margin4
(bps)
UBS Wealth Management performance and targets1
Target
~4,700
9M11
4,252
2010
4,172
2009
4,286
9291
Target
95-105
9M11
972
20102009
1 Annual performance ranges for 2012 through 2016, excluding future significant non-recurring items, if any2 Excluding gain on sale of strategic investment portfolio3 Net new money as reported for 9M11 – not annualized4 Excluding negative valuation adjustments on a property fund
Net new money growth(% p.a. of invested assets)
Client advisors(FTE)
Annualtarget
~3-5%
9M113
3%
2010
(1%)
2009
(10%)
Target
60-70%
9M11
68%2
2010
69%
2009
70%
23
Net new money growth
Efficiency
Revenue increase
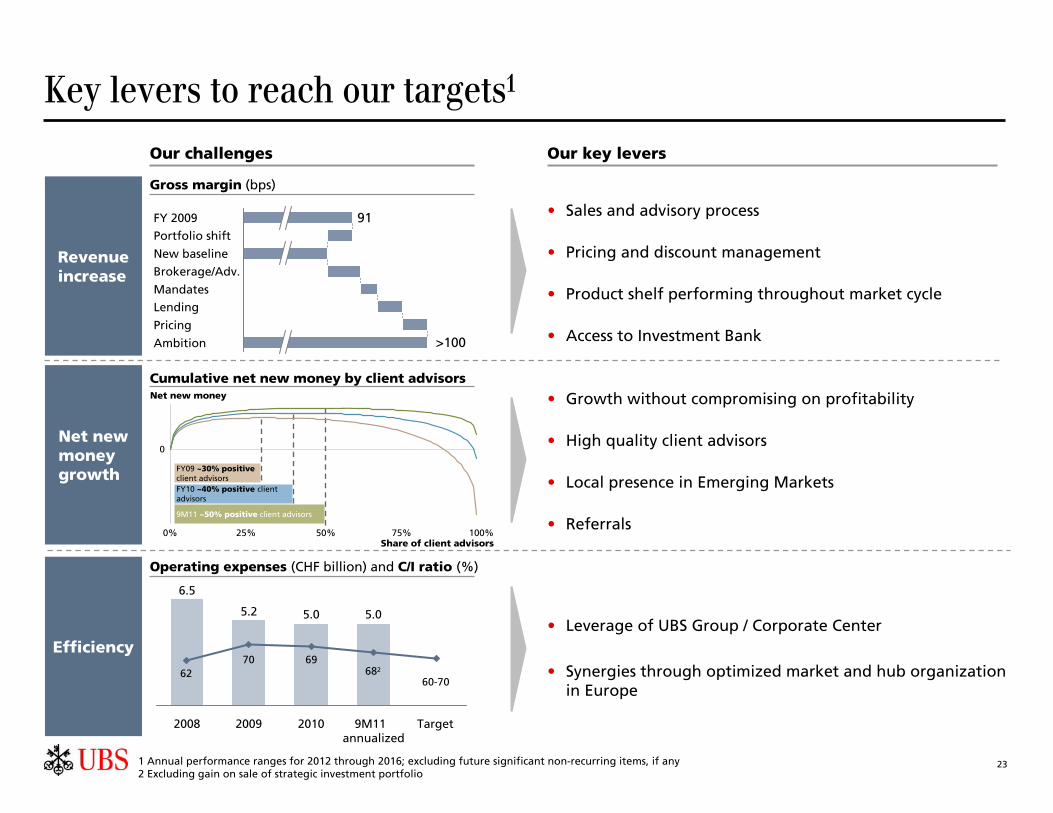
Our challenges
Key levers to reach our targets1
Our key levers
• Sales and advisory process
• Pricing and discount management
• Product shelf performing throughout market cycle
• Access to Investment Bank
Cumulative net new money by client advisors
Gross margin (bps)
Operating expenses (CHF billion) and C/I ratio (%)
• Growth without compromising on profitability
• High quality client advisors
• Local presence in Emerging Markets
• Referrals
• Leverage of UBS Group / Corporate Center
• Synergies through optimized market and hub organization in Europe
1 Annual performance ranges for 2012 through 2016; excluding future significant non-recurring items, if any2 Excluding gain on sale of strategic investment portfolio
Net new money
0
50%0% 100%
9M11 ~50% positive client advisors
FY10 ~40% positive client advisors
FY09 ~30% positiveclient advisors
25% 75%Share of client advisors
5.0
20092008 Target9M11 annualized
5.0
2010
6269
682
60-70
70
5.2
6.5
>100
91
Brokerage/Adv.
Pricing
Mandates
Lending
FY 2009
Ambition
Portfolio shift
New baseline

24
• Earnings quality (RoA)• NNM turnaround• Focused investments
• Retention• Cost management• Rigorous compliance
framework
• Investment Management and Advisory
• Accelerated growth• Fully exploit
group potential
Execute and
Perform
Pursuing our successful trajectory
Profit margin(Pre-tax profit in % of Income)
Stabilize and
Reposition
Transform and
Outperform
~40
2009 2010 Ambition2011
UBS WM
WM peers2
1 Excluding gain on sale of strategic investment portfolio, based on 9M11 for UBS WM and 1H11 for peers2 Invested asset weighted average includes Barclays, Crédit Agricole, Credit Suisse, EFG International, HSBC, Julius Bär, RBS, Sarasin, Société Générale, Vontobel
26.432.01
27.031.428.130.7

25
Key messages
We have delivered stronger profits in a difficult environment
We are strongly positioned to grow
We aspire to higher profitability
We are putting Investment Management & Advisory at the heart of our business