we create chemistry for a sustainable future - basf … create chemistry for a sustainable future...
TRANSCRIPT
We create chemistry for a sustainable future
Michael HeinzMember of the Board of
Executive Directors
Investor Visit
Hermes
September 29, 2017
BASF Capital Market Story, September 2017 2
Cautionary note regarding
forward-looking statements
This presentation contains forward-looking statements. These forward-looking statements are based
on current estimates and projections of the Board of Executive Directors and on currently available
information. These forward-looking statements are not guarantees of the future developments and
results outlined therein. Rather, they depend on a number of factors, involve various risks and
uncertainties, and are based on assumptions that may not prove to be accurate. Such risk factors
particularly include those discussed on pages 111 to 118 of the BASF Report 2016. The BASF
Report is available online at basf.com/report. BASF does not assume any obligation to update the
forward-looking statements contained in this presentation.
BASF Capital Market Story, September 2017 3
Agenda
At a glance1
Strategic levers2
Segments3
BASF Capital Market Story, September 2017 4
▪ Growth above chemical industry average – driven by innovative and sustainable products
and solutions
▪ Unique Verbund concept – competitive advantage based on integrated sites, operational
excellence and best-in-class technologies
▪ Broad and resilient portfolio – with global market access and strong customer relationships
▪ Earnings growth and strong cash flow generation – based on operational and financial
strength
▪ Long-term value creation with progressive dividend policy – grow or at least maintain
dividend at the previous year’s level
BASF shares – an attractive investment
BASF Capital Market Story, September 2017 5
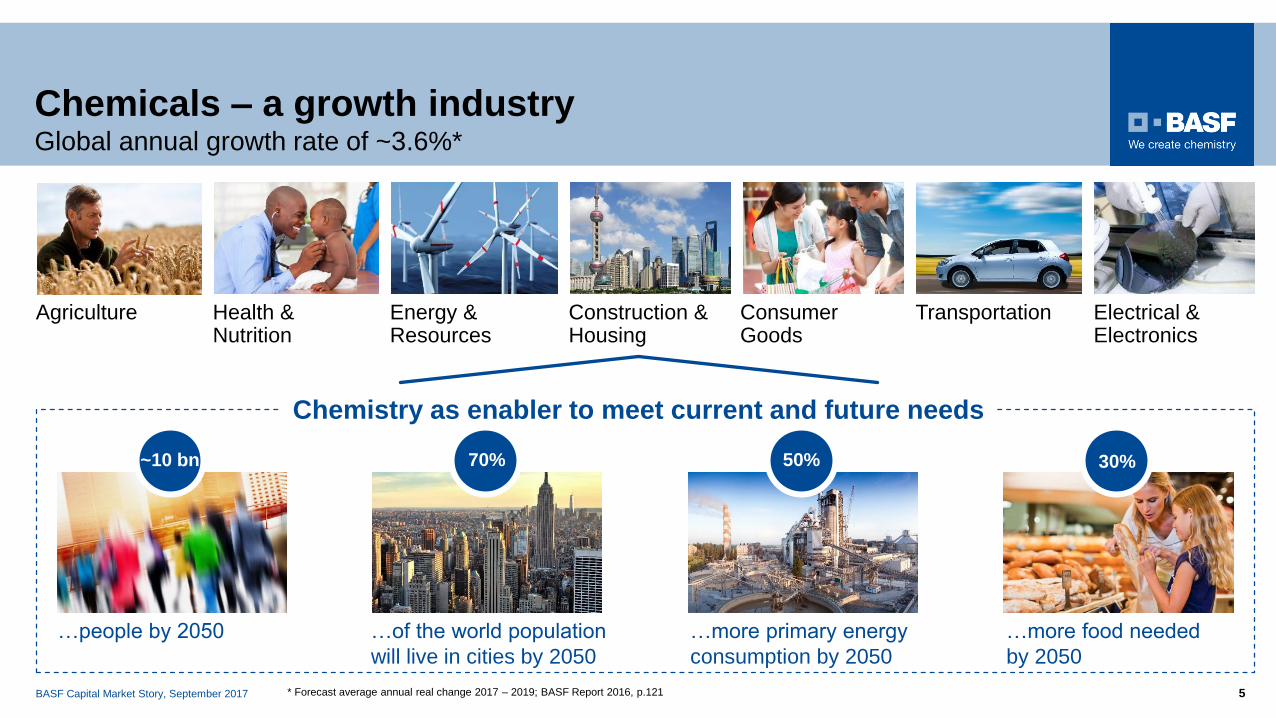
Chemicals – a growth industryGlobal annual growth rate of ~3.6%*
…more food needed
by 2050
…more primary energy
consumption by 2050
…of the world population
will live in cities by 2050
Agriculture Health & Nutrition
Energy & Resources
TransportationConstruction &Housing
Consumer Goods
…people by 2050
Electrical & Electronics
Chemistry as enabler to meet current and future needs
70% 50%~10 bn 30%
* Forecast average annual real change 2017 – 2019; BASF Report 2016, p.121
BASF Capital Market Story, September 2017 6
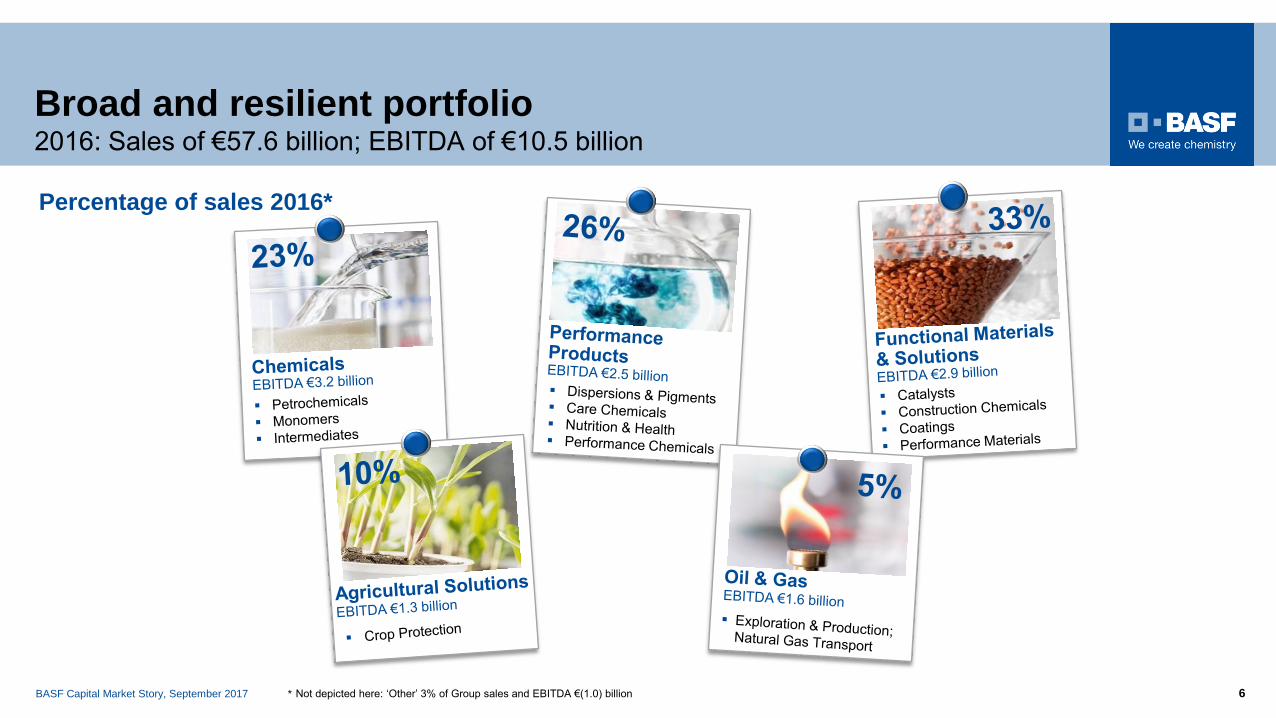
Broad and resilient portfolio2016: Sales of €57.6 billion; EBITDA of €10.5 billion
Percentage of sales 2016*
* Not depicted here: ‘Other’ 3% of Group sales and EBITDA €(1.0) billion
BASF Capital Market Story, September 2017 7
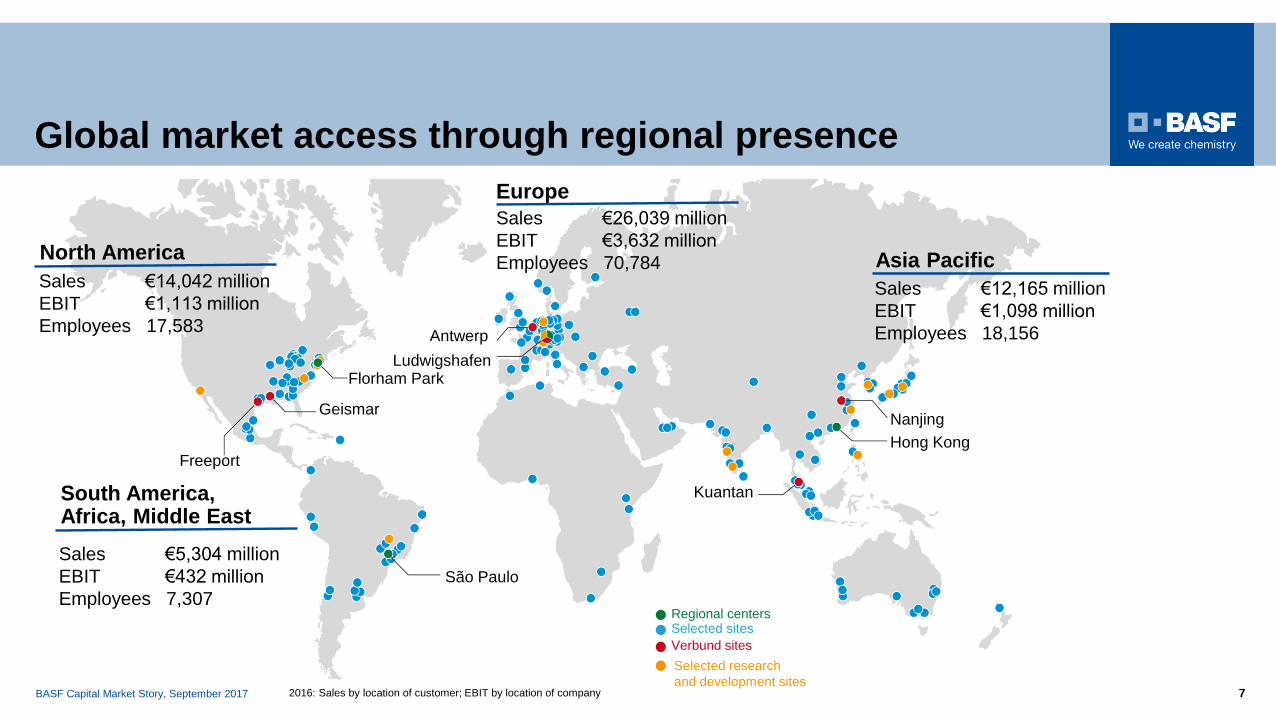
Global market access through regional presence
Kuantan
Hong Kong
Nanjing
Freeport
Florham Park
Geismar
Ludwigshafen
Antwerp
São Paulo
Regional centersSelected sites
Verbund sites
Selected research
and development sites
Asia Pacific
Europe
South America, Africa, Middle East
North America
Sales €14,042 million
EBIT €1,113 million
Employees 17,583
Sales €26,039 million
EBIT €3,632 million
Employees 70,784
Sales €12,165 million
EBIT €1,098 million
Employees 18,156
Sales €5,304 million
EBIT €432 million
Employees 7,307
2016: Sales by location of customer; EBIT by location of company
BASF Capital Market Story, September 2017 8
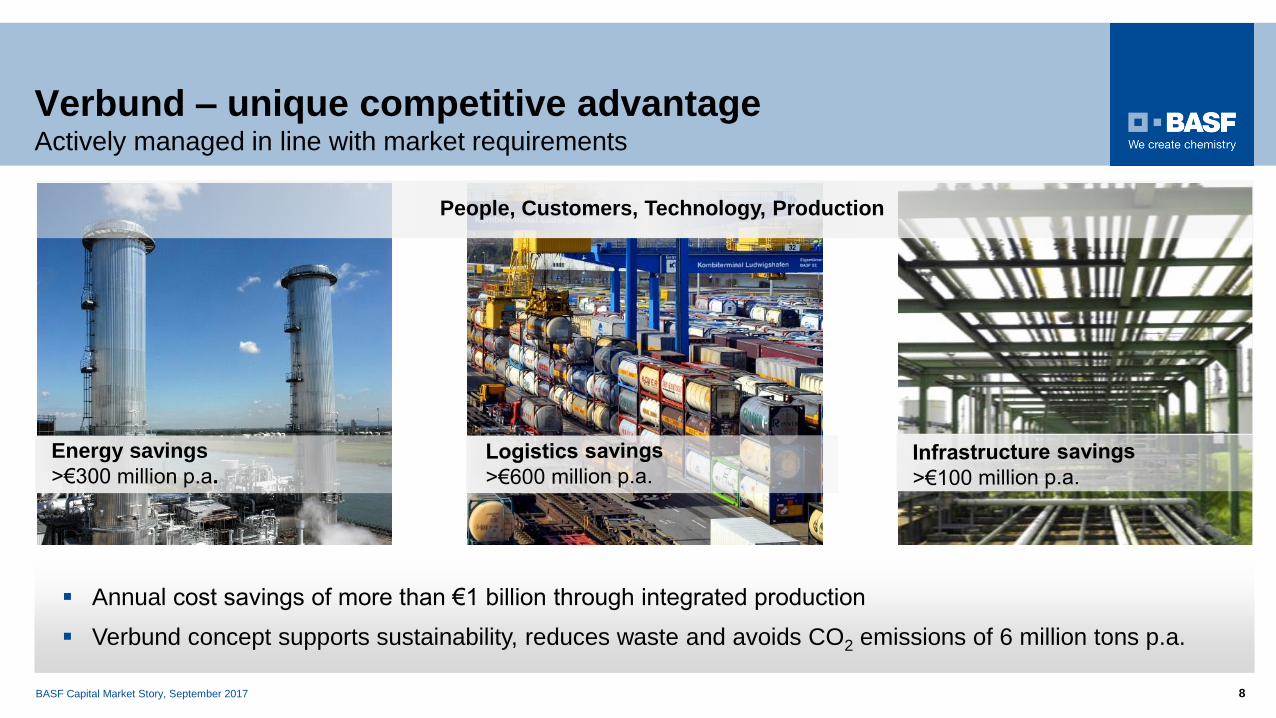
Verbund – unique competitive advantageActively managed in line with market requirements
▪ Annual cost savings of more than €1 billion through integrated production
▪ Verbund concept supports sustainability, reduces waste and avoids CO2 emissions of 6 million tons p.a.
Energy savings
>€300 million p.a.
People, Customers, Technology, Production
BASF Capital Market Story, September 2017 9
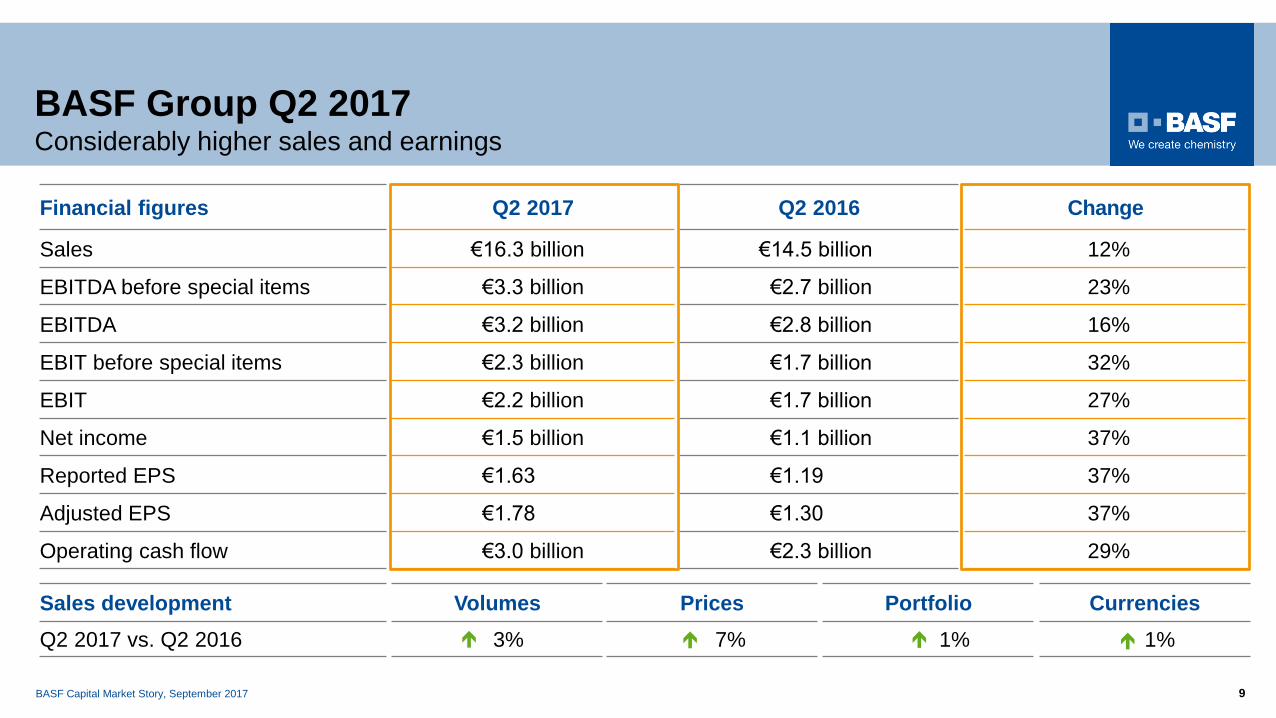
BASF Group Q2 2017Considerably higher sales and earnings
Financial figures Q2 2017 Q2 2016 Change
Sales €16.3 billion €14.5 billion 12%
EBITDA before special items €3.3 billion €2.7 billion 23%
EBITDA €3.2 billion €2.8 billion 16%
EBIT before special items €2.3 billion €1.7 billion 32%
EBIT €2.2 billion €1.7 billion 27%
Net income €1.5 billion €1.1 billion 37%
Reported EPS €1.63 €1.19 37%
Adjusted EPS €1.78 €1.30 37%
Operating cash flow €3.0 billion €2.3 billion 29%
Sales development Volumes Prices Portfolio Currencies
Q2 2017 vs. Q2 2016 3% 7% 1% 1%

BASF Capital Market Story, September 2017 10
Stepwise increase of earnings level
EBIT and EBITDA*
billion €, 2001–2016
3.7
4.7 4.6
7.0 7.28.4
8.9
7.7
6.5
9.9
11.2
10.010.4
11.010.6 10.5
6.7
0
2
4
6
8
10
12
2001 2002 2003 2004 2005 2006 2007 2008 2009 2010 2011 2012 2013 2014 2015 2016 H1 2017
EBIT EBITDA
0.7
2.2 2.2
4.5 4.85.5
6.0
4.6
2.8
6.7
8.0
6.7 7.27.6
6.2 6.3
4.6
CAGREBITDA
7%CAGREBIT
16%
* 2010, 2011 indicative, adjusted for IFRS 10 & 11; 2001–2009 as reported, without non-compensable foreign income taxes on oil production
Avg. EBITDA level in depicted years
6.7
BASF Capital Market Story, September 2017 11
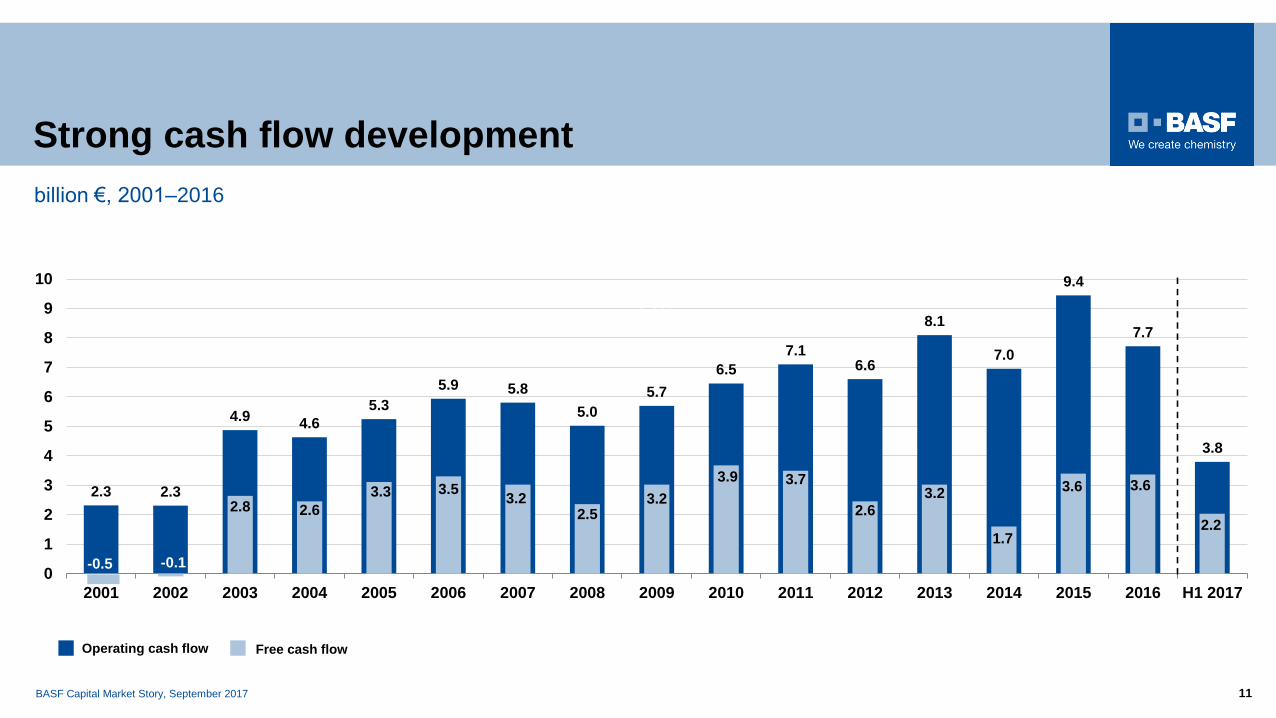
billion €, 2001–2016
2.3 2.3
4.94.6
5.3
5.9 5.8
5.0
5.7
6.5
7.16.6
8.1
7.0
9.4
7.7
3.8
0
1
2
3
4
5
6
7
8
9
10
2001 2002 2003 2004 2005 2006 2007 2008 2009 2010 2011 2012 2013 2014 2015 2016 H1 2017
Free cash flowOperating cash flow
-0.5 -0.1
2.8 2.6
3.3 3.53.2
2.53.2
3.9 3.7
2.6
3.2
1.7
3.6 3.6
2.2
6.3%
Strong cash flow development
BASF Capital Market Story, September 2017 12
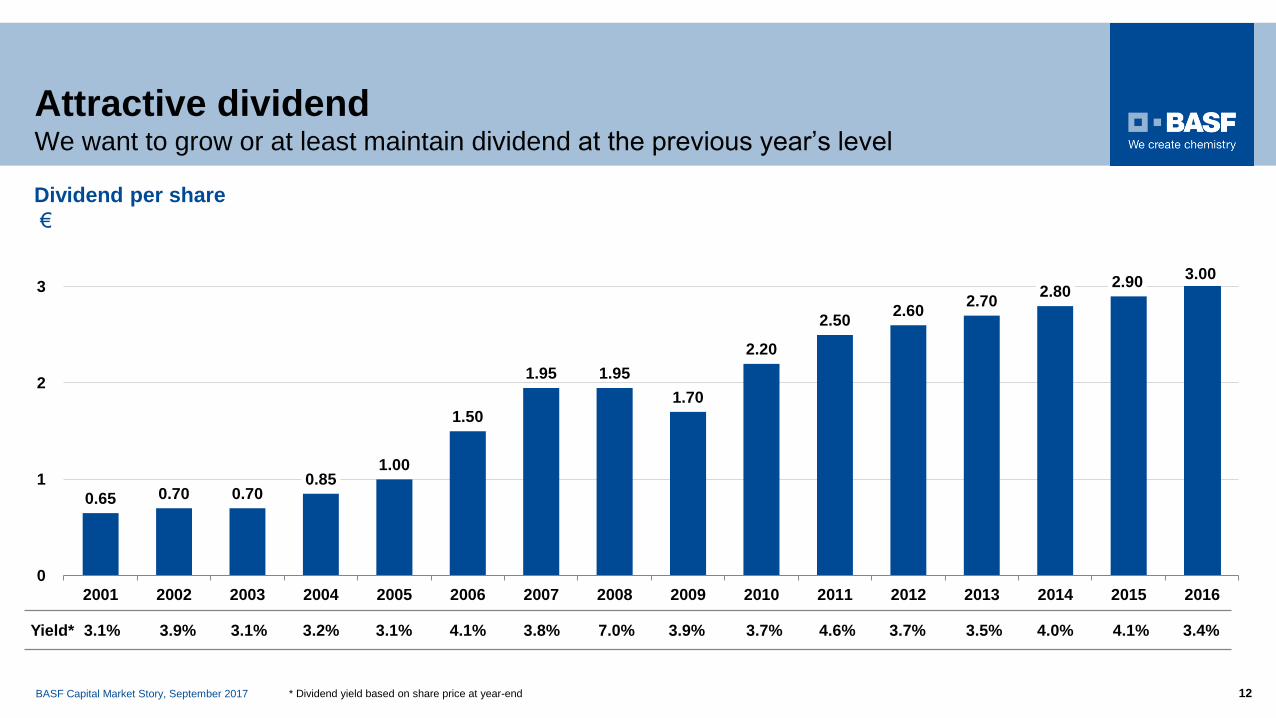
Attractive dividendWe want to grow or at least maintain dividend at the previous year’s level
* Dividend yield based on share price at year-end
Dividend per share
€
0.65 0.70 0.700.85
1.00
1.50
1.95 1.95
1.70
2.20
2.502.60
2.702.80
2.90
0
1
2
3
2001 2002 2003 2004 2005 2006 2007 2008 2009 2010 2011 2012 2013 2014 2015 2016
Yield* 3.1% 3.9% 3.1% 3.2% 3.1% 4.1% 3.8% 7.0% 3.9% 3.7% 4.6% 3.7% 3.5% 4.0% 4.1% 3.4%
3.00

BASF Capital Market Story, September 2017 13
Delivering consistent, long-term valueCurrent market capitalization: €75 billion*
Average annual performance
(with dividends reinvested)
0 2 4 6 8 10 12 14
Euro Stoxx 50
DAX 30
MSCI World
Chemicals
+4.7%
BASF
+6.4%
+0.8%
+9.5%
Last 10 years
September 2007 – August 2017
0 2 4 6 8 10 12 14
Last 5 years
September 2012 – August 2017
+9.4%
+10.0%
+11.6%
+11.6%
* As of August 31, 2017
BASF Capital Market Story, September 2017 14
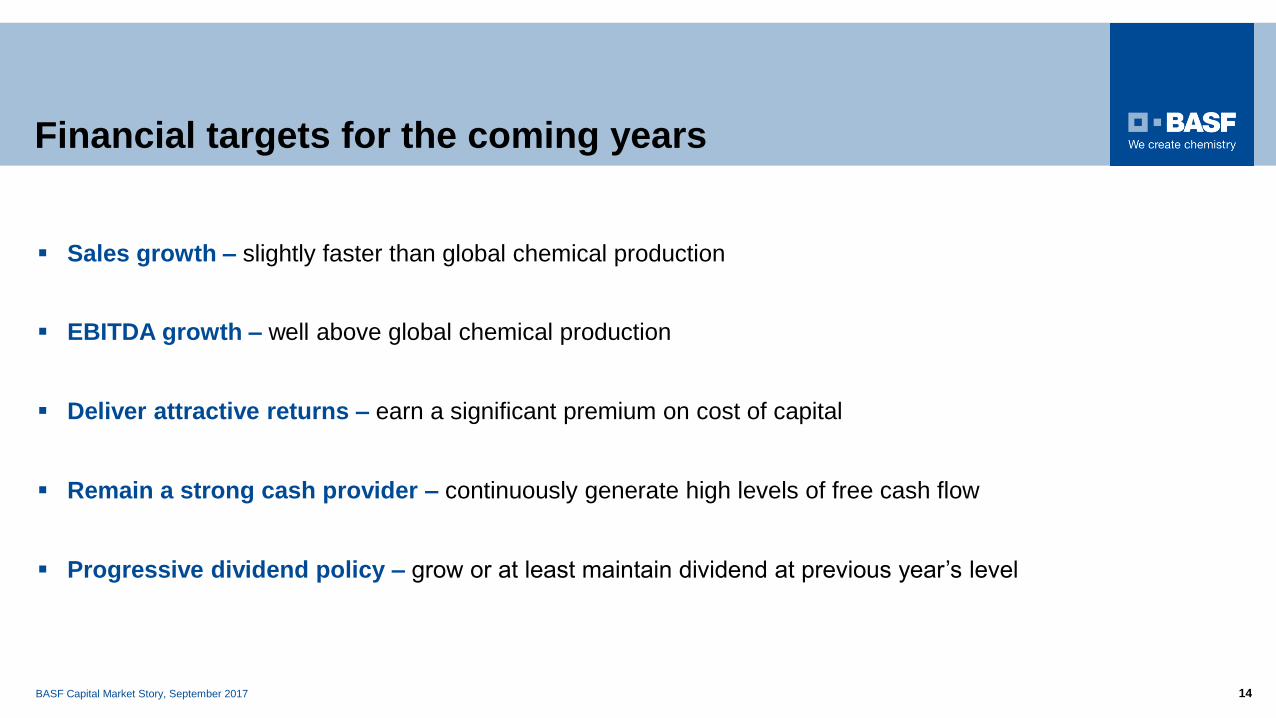
▪ Sales growth – slightly faster than global chemical production
▪ Deliver attractive returns – earn a significant premium on cost of capital
▪ EBITDA growth – well above global chemical production
▪ Remain a strong cash provider – continuously generate high levels of free cash flow
▪ Progressive dividend policy – grow or at least maintain dividend at previous year’s level
Financial targets for the coming years

BASF Capital Market Story, September 2017 15
▪ Innovations for a sustainable future
▪ Investments in organic growth
▪ M&A opportunities and portfolio pruning measures
Our priorities
▪ Operational excellence and cost discipline
We aim to grow sales and earnings faster than global chemical production
in the coming years, driven by
BASF Capital Market Story, September 2017 16
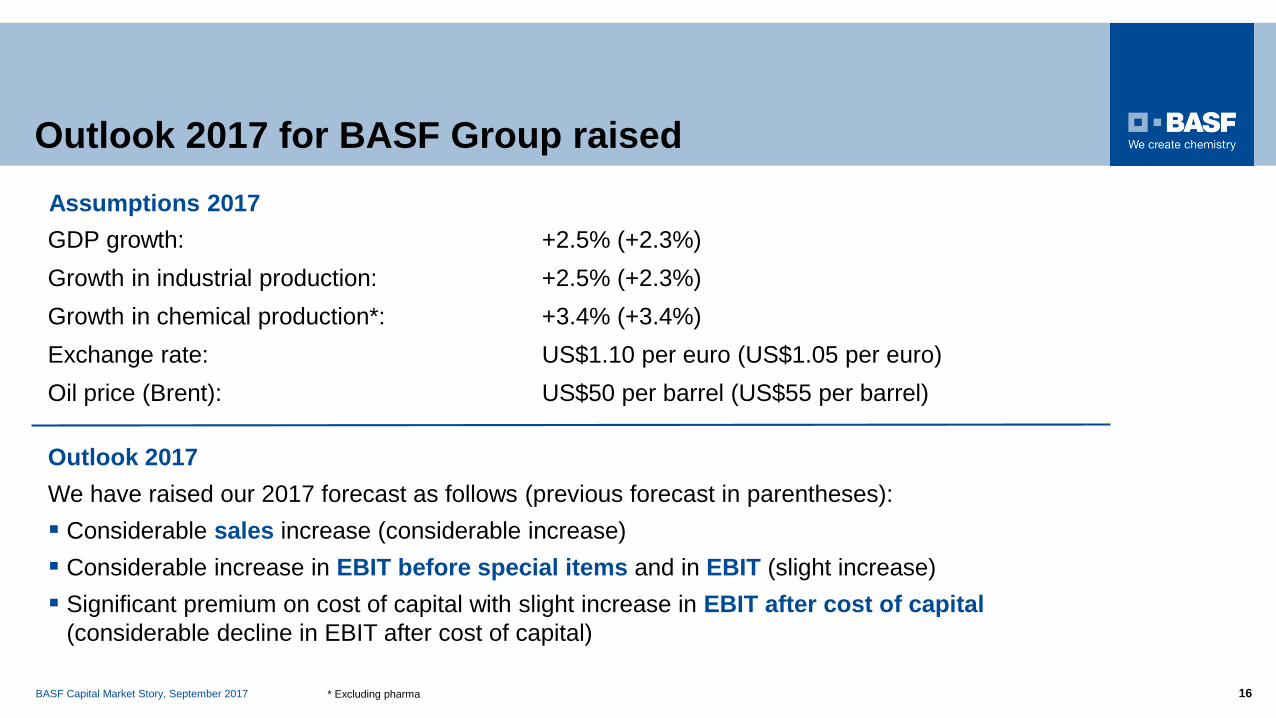
Outlook 2017 for BASF Group raised
Outlook 2017
We have raised our 2017 forecast as follows (previous forecast in parentheses):
▪ Considerable sales increase (considerable increase)
▪ Considerable increase in EBIT before special items and in EBIT (slight increase)
▪ Significant premium on cost of capital with slight increase in EBIT after cost of capital
(considerable decline in EBIT after cost of capital)
GDP growth: +2.5% (+2.3%)
Growth in industrial production: +2.5% (+2.3%)
Growth in chemical production*: +3.4% (+3.4%)
Exchange rate: US$1.10 per euro (US$1.05 per euro)
Oil price (Brent): US$50 per barrel (US$55 per barrel)
* Excluding pharma
Assumptions 2017
BASF Capital Market Story, September 2017 17
Agenda
At a glance1
Strategic levers2
Segments3
► Portfolio development
► Investments
► Innovation
► Sustainability
► Operational excellence

BASF Capital Market Story, September 2017 18
Continuous global portfolio development
target(in % of sales*)~50% ~50%
Maintaining a balanced portfolio
Divestment of
businesses,
e.g., due to loss
of differentiation
Divestment of
businesses,
e.g., due to lower
market attractiveness
Commoditization leads to
restructuring
Growth fields
Innovation
pipeline
Acquisitions
Specialties and solutions Differentiated commodities
▪ Attractive markets
▪ Differentiation by process
technologies and integration
▪ Attractive markets
▪ Differentiation by customer
proximity and innovations
* Excluding Oil & Gas sales
BASF Capital Market Story, September 2017 19
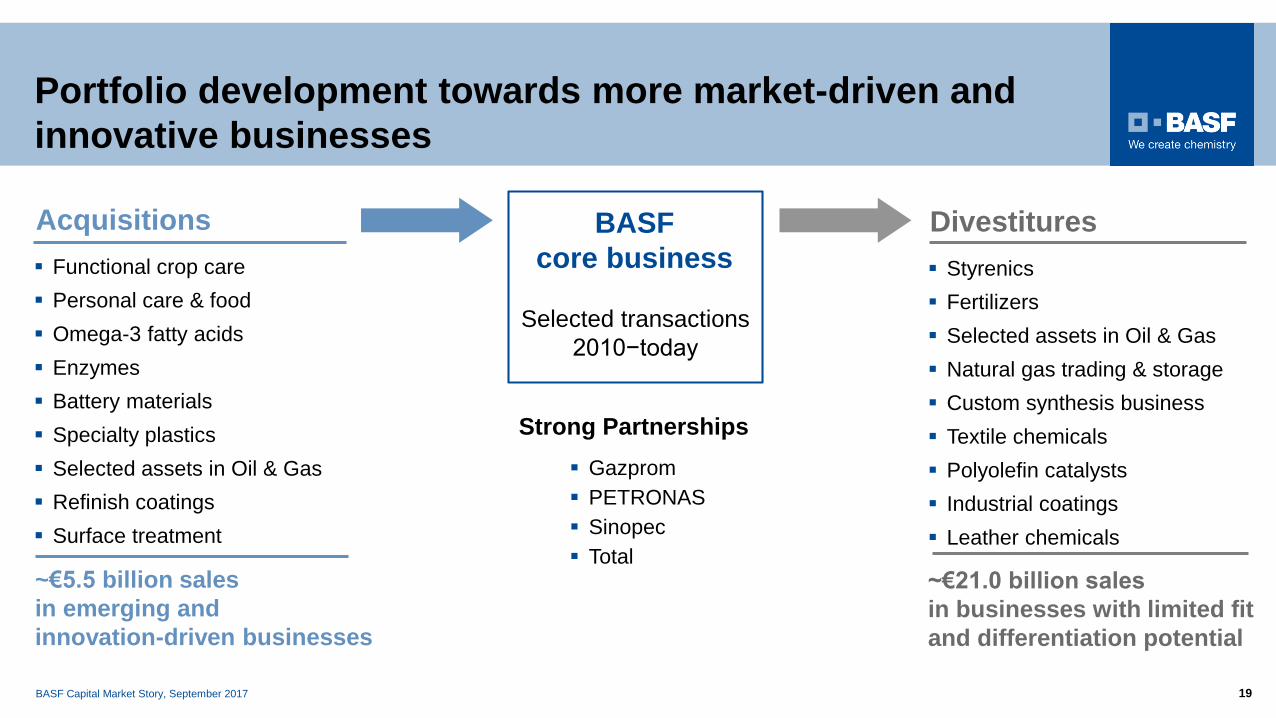
Portfolio development towards more market-driven and
innovative businesses
Strong Partnerships
▪ Gazprom
▪ PETRONAS
▪ Sinopec
▪ Total
Selected transactions
2010−today
BASF
core business
~€5.5 billion sales
in emerging and
innovation-driven businesses
Acquisitions
▪ Functional crop care
▪ Personal care & food
▪ Omega-3 fatty acids
▪ Enzymes
▪ Battery materials
▪ Specialty plastics
▪ Selected assets in Oil & Gas
▪ Refinish coatings
▪ Surface treatment
Divestitures
~€21.0 billion sales
in businesses with limited fit
and differentiation potential
▪ Styrenics
▪ Fertilizers
▪ Selected assets in Oil & Gas
▪ Natural gas trading & storage
▪ Custom synthesis business
▪ Textile chemicals
▪ Polyolefin catalysts
▪ Industrial coatings
▪ Leather chemicals
BASF Capital Market Story, September 2017 20
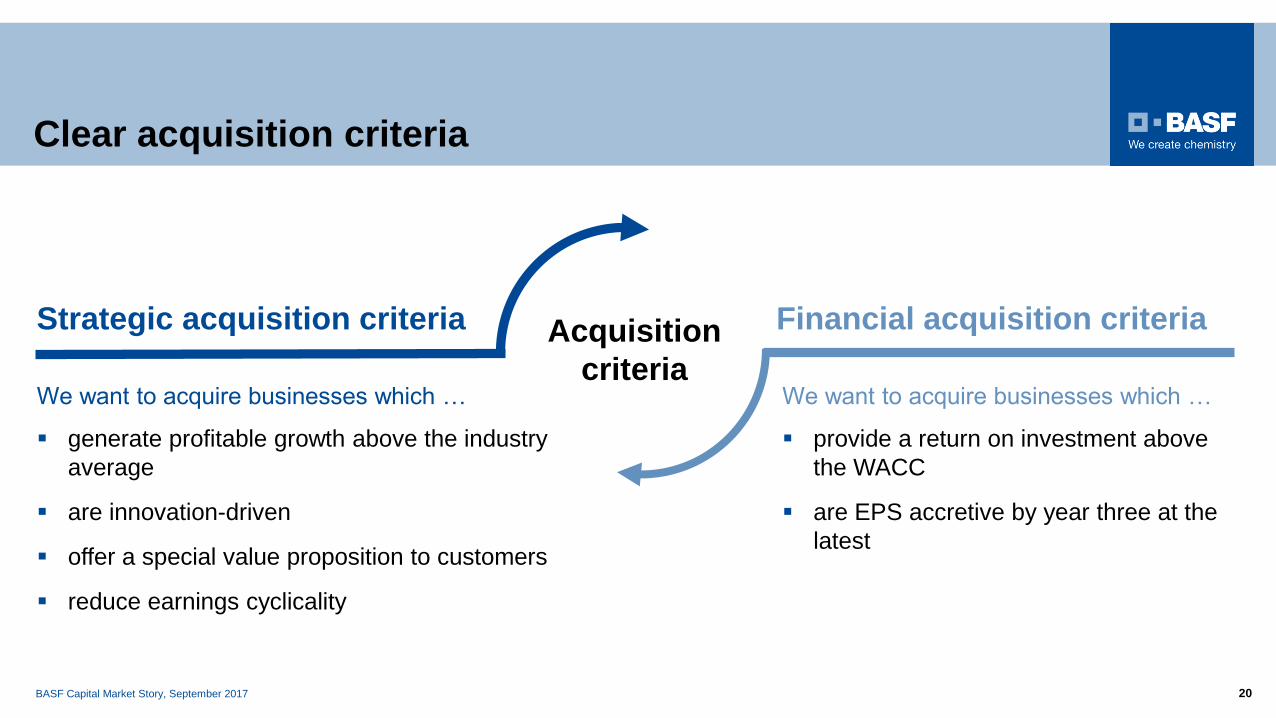
Clear acquisition criteria
We want to acquire businesses which …
▪ provide a return on investment above
the WACC
▪ are EPS accretive by year three at the
latest
We want to acquire businesses which …
▪ generate profitable growth above the industry
average
▪ are innovation-driven
▪ offer a special value proposition to customers
▪ reduce earnings cyclicality
Acquisition
criteria
Strategic acquisition criteria Financial acquisition criteria

BASF Capital Market Story, September 2017 21
Chemetall – a global leader in surface treatment
products and services
Key facts
▪ One of the strongest globally managed
brands in the sector
▪ Proprietary manufacturing technologies,
rigorous product quality and
performance standards
▪ Leading market positions in the
automotive, aerospace and cold
forming segments
▪ Long-standing, service-intensive
customer relationships
▪ Track record of strong growth and high
profitability
An excellent strategic fit for BASF Coatings
Significant global presence and record of accelerated expansion in emerging markets
BASF Coatings site Chemetall site
BASF Capital Market Story, September 2017 22
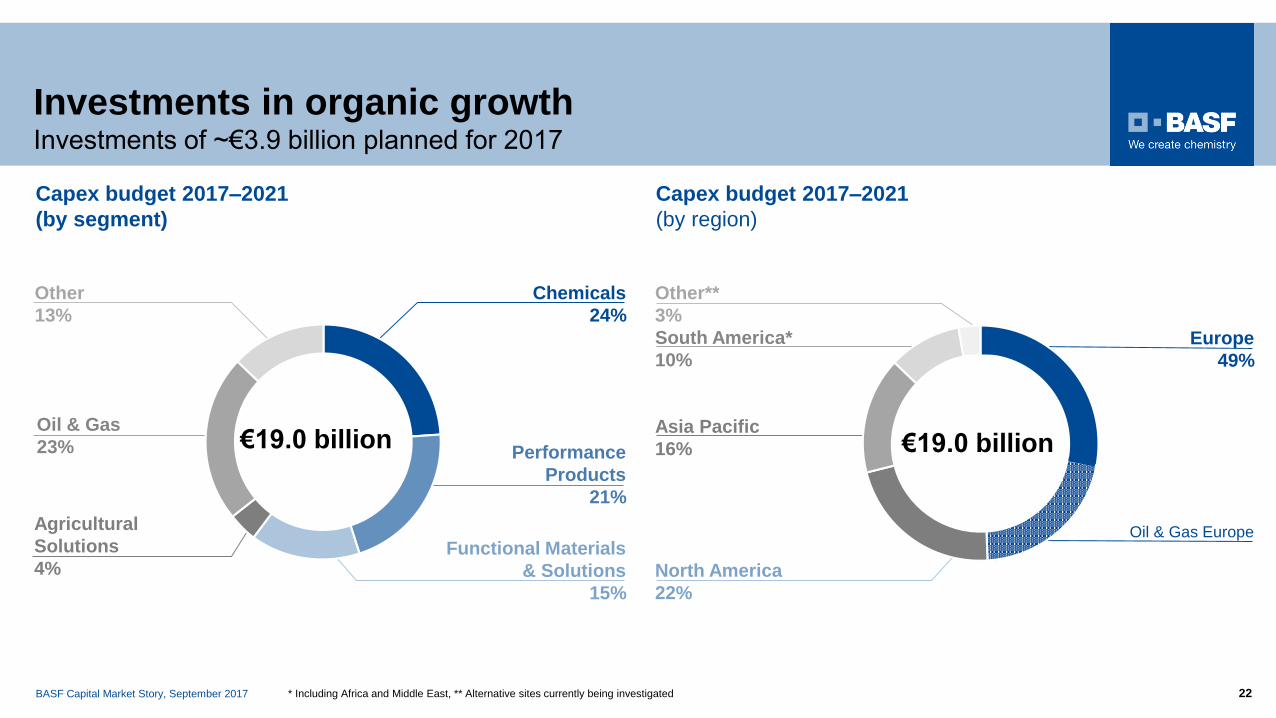
Investments in organic growthInvestments of ~€3.9 billion planned for 2017
Performance
Products
21%
Oil & Gas
23% €19.0 billion
Capex budget 2017–2021
(by segment)
Other
13%
Chemicals
24%
Capex budget 2017–2021
(by region)
Asia Pacific
16%
North America
22%
Agricultural
Solutions
4%
Other**
3%
Functional Materials
& Solutions
15%
€19.0 billion
South America*
10%
* Including Africa and Middle East, ** Alternative sites currently being investigated
Europe
49%
Oil & Gas Europe

BASF Capital Market Story, September 2017 23
Investment projects with startup in 2017
Aroma ingredients complex
Kuantan, Malaysia
▪ BASF and PETRONAS further
expand joint activities in Malaysia
▪ Investment: around €500 million
Ammonia plant
Freeport, Texas
▪ BASF and Yara are building world-
scale ammonia plant in the U.S.
▪ 750,000 tons per year;
hydrogen-based process
Engineering plastics
Schwarzheide, Germany
▪ Expansion of annual capacity
by 70,000 tons
▪ Increasing BASFʼs global compounding
capacity to more than 700,000 tons

BASF Capital Market Story, September 2017 24
Oil & Gas
2%
Innovation will drive future growth
Agricultural
Solutions
26%
Chemicals
10%
Performance Products
20%
Corporate Research
21%
Key facts
€1.86 billion R&D expenditures in 2016
R&D expense to sales ratio ~3%
~10,000 employees in R&D
~3,000 projects
~850 new patents in 2016
Research Verbund:
Cooperations with more than 600
excellent partners from universities,
startups and industry
In 2016, sales of >€10 billion from
innovations on the market since 2011
R&D expenditures 2016
€1.86 billion
Functional Materials
& Solutions
21%
BASF Capital Market Story, September 2017 25
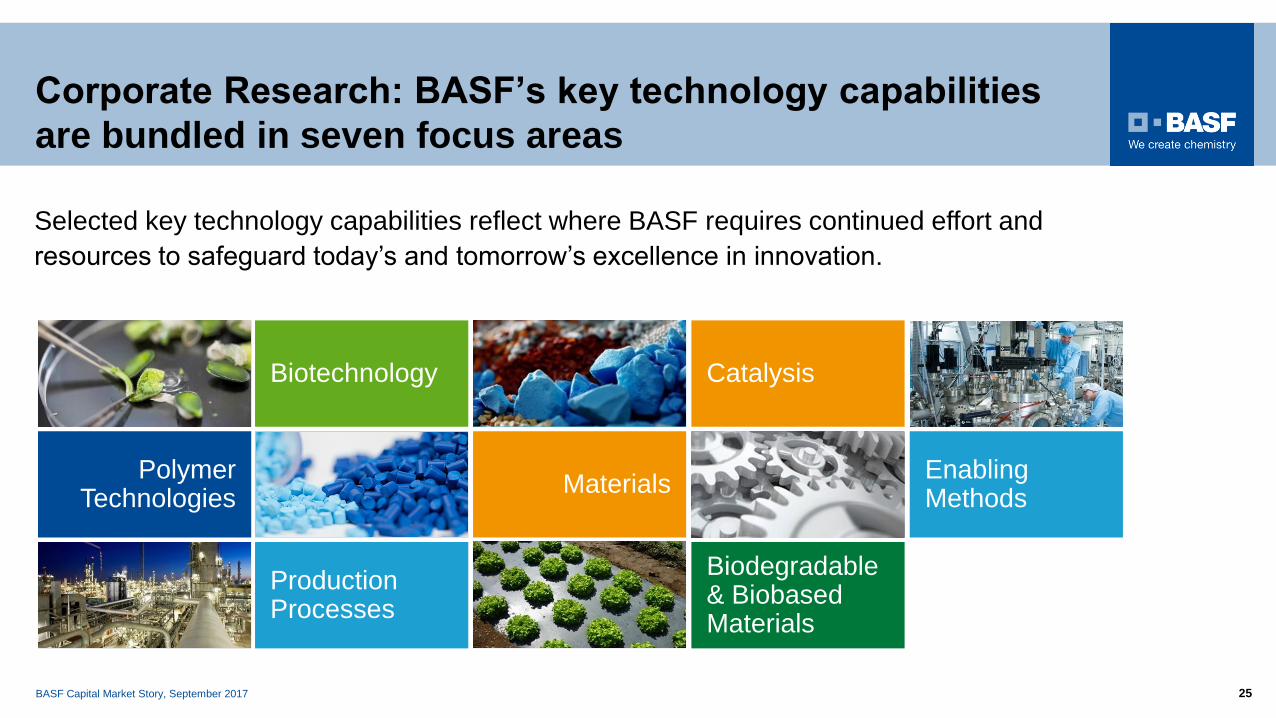
Polymer Technologies
Biotechnology
Production Processes
Materials
Catalysis
Biodegradable & BiobasedMaterials
Enabling Methods
Corporate Research: BASF’s key technology capabilities
are bundled in seven focus areas
Selected key technology capabilities reflect where BASF requires continued effort and
resources to safeguard today’s and tomorrow’s excellence in innovation.

BASF Capital Market Story, September 2017 26
Sustainable Solution Steering®
Novel methodology to screen and steer our portfolio
4.2% 0.3%
▪ >60,000 product applications analyzed
▪ 27.2% Accelerators
– outgrow their markets
– deliver margins above the average
– represent majority of BASF’s R&D
pipeline
▪ 68.3% Performers
▪ <1% Challenged products
Increase the share of Accelerators from 23% in 2014 to 28% by 2020
27.2%
68.3%
Substantial sustainability
contribution in the value chain
Meets basic sustainability
standards on the market
Specific sustainability issues
which are being actively addressed
Significant sustainability concern,
action plan developed
Sustainable
Solution
Steering
Percentage of
sales 2016
BASF Capital Market Story, September 2017 27
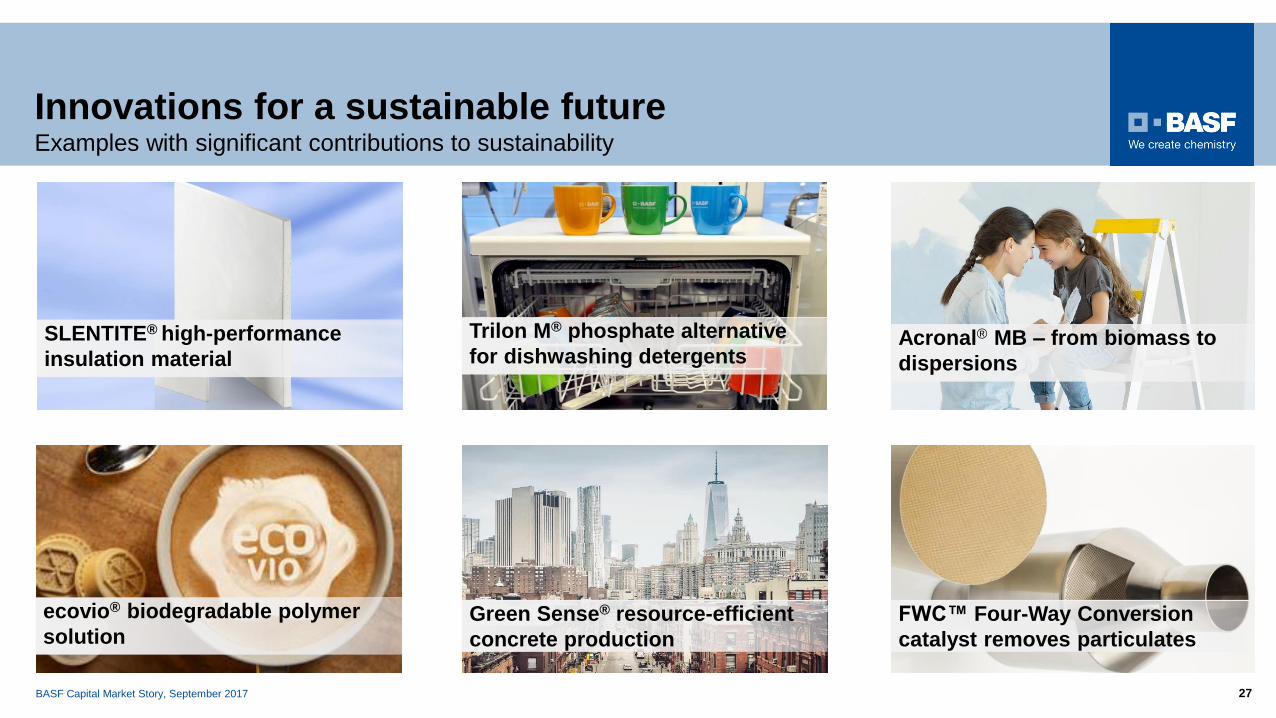
Innovations for a sustainable futureExamples with significant contributions to sustainability
FWC™ Four-Way Conversion
catalyst removes particulates
Acronal® MB – from biomass to
dispersions
Trilon M® phosphate alternative
for dishwashing detergentsSLENTITE® high-performance
insulation material
Green Sense® resource-efficient
concrete production
ecovio® biodegradable polymer
solution

BASF Capital Market Story, September 2017 28
Carbon efficiencyResponsible use of raw materials by the chemical industry
▪ BASF uses raw materials responsibly: ~80% of carbon
converted to products, ~20% needed for processes*
▪ Continuous efficiency improvements
▪ 22 million tons CO2 emissions by BASF in 2016 compared to
10–30 million tons p.a. for one coal-fired power plant
▪ Chemical industry: only ~10% of global consumption of fossil resources**
▪ Growing world population needs access to energy, housing,
healthcare and food
▪ Consumption of resources has to be reduced in order to limit global
warming to <2°C
▪ Chemistry as enabler for low-carbon technologies
(e.g., lightweight parts, battery materials, insulation, etc.) 20%
CO280%
products
* BASF carbon mass balance calculation (2016, non-audited) **IEA 2015
BASF Capital Market Story, September 2017 29
0
0,.001
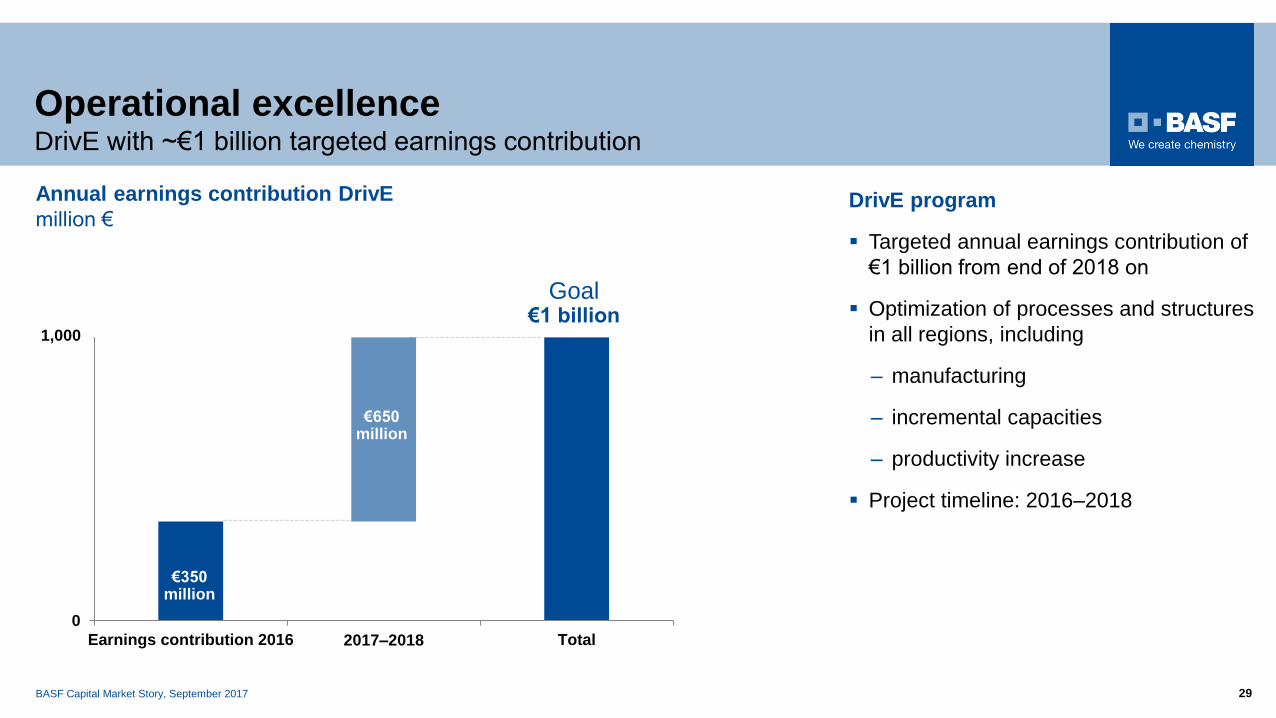
Earnings contribution 2016 2017–2018 Total
Operational excellenceDrivE with ~€1 billion targeted earnings contribution
DrivE program
▪ Targeted annual earnings contribution of
€1 billion from end of 2018 on
▪ Optimization of processes and structures
in all regions, including
– manufacturing
– incremental capacities
– productivity increase
▪ Project timeline: 2016–2018
€350 million
€650 million
Goal €1 billion
Annual earnings contribution DrivE
million €
1,000
BASF Capital Market Story, September 2017 30
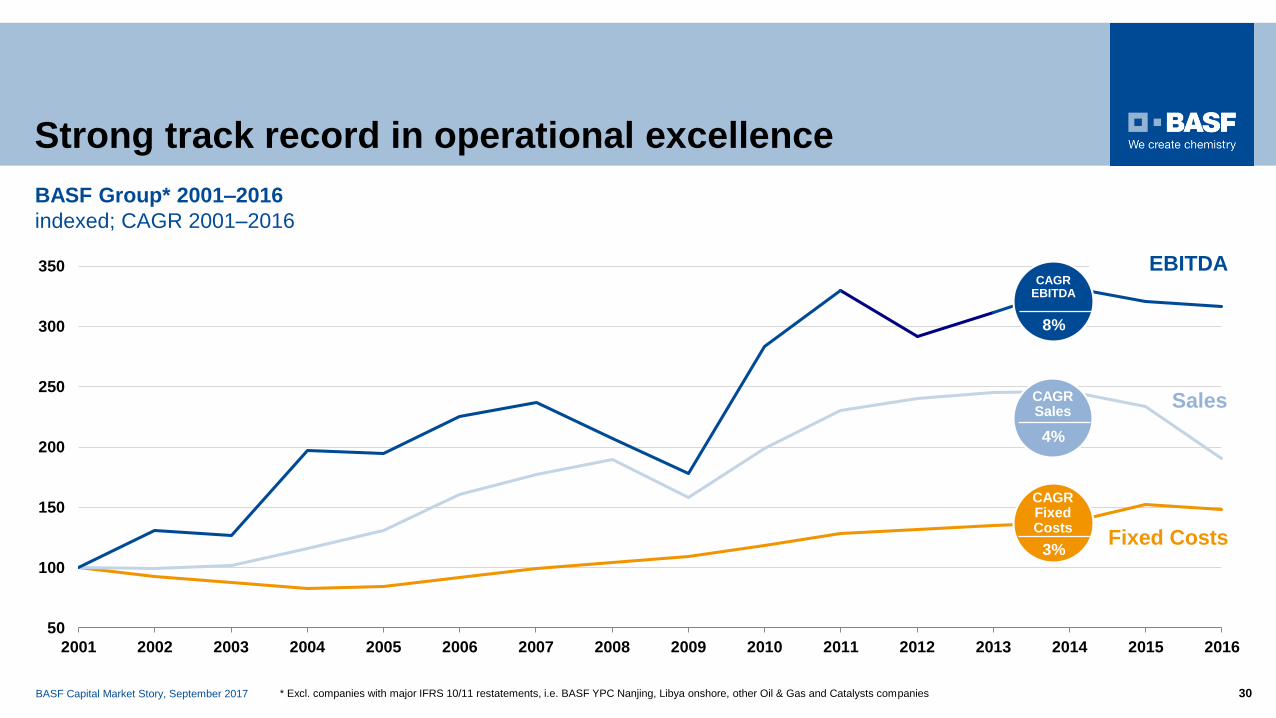
Strong track record in operational excellence
* Excl. companies with major IFRS 10/11 restatements, i.e. BASF YPC Nanjing, Libya onshore, other Oil & Gas and Catalysts companies
50
100
150
200
250
300
350
2001 2002 2003 2004 2005 2006 2007 2008 2009 2010 2011 2012 2013 2014 2015 2016
EBITDA
Sales
Fixed Costs
CAGREBITDA
8%
CAGRSales
4%
3%
CAGRFixed Costs
BASF Group* 2001–2016
indexed; CAGR 2001–2016
BASF Capital Market Story, September 2017 31
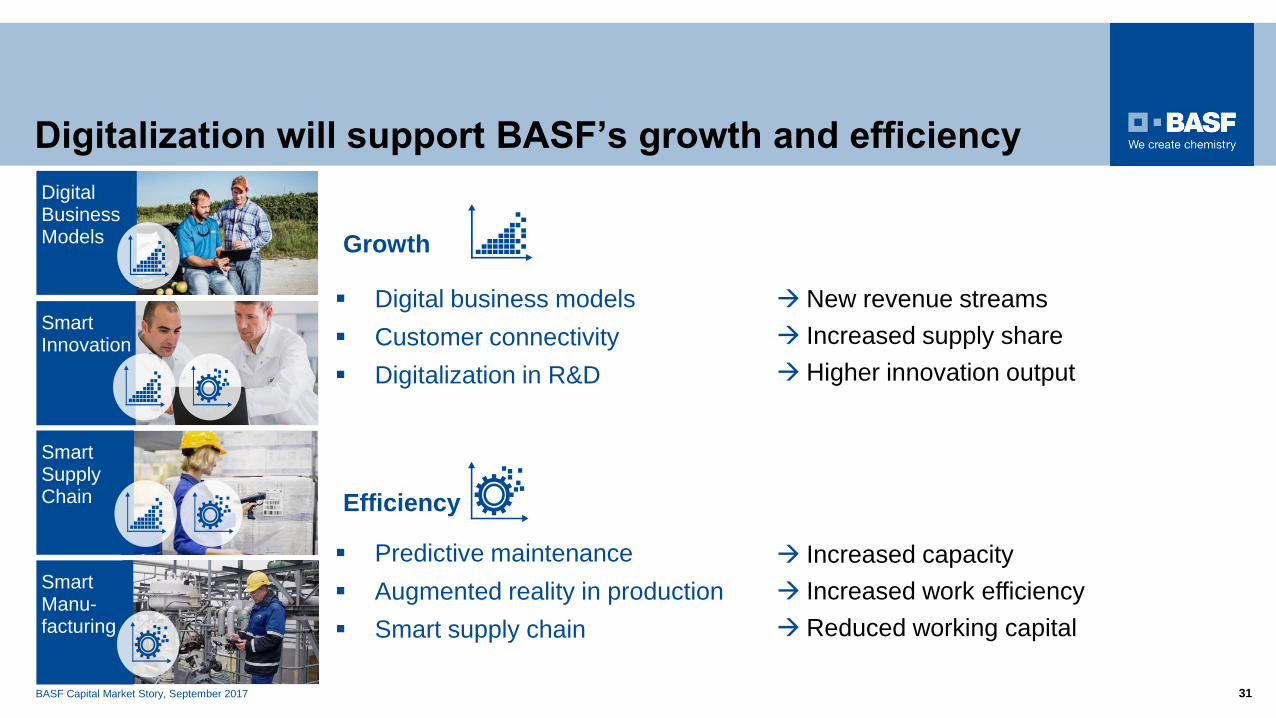
Digitalization will support BASF’s growth and efficiency
Digital Business Models
Smart Innovation
Smart Supply Chain
Smart Manu-facturing
Growth
▪ Digital business models
▪ Customer connectivity
▪ Digitalization in R&D
New revenue streams
Increased supply share
Higher innovation output
▪ Predictive maintenance
▪ Augmented reality in production
▪ Smart supply chain
Increased capacity
Increased work efficiency
Reduced working capital
Efficiency
BASF Capital Market Story, September 2017 32
Agenda
At a glance1
Strategic levers2
Segments3► Chemicals
► Performance Products
► Functional Materials & Solutions
► Agricultural Solutions
► Oil & Gas
BASF Capital Market Story, September 2017 33
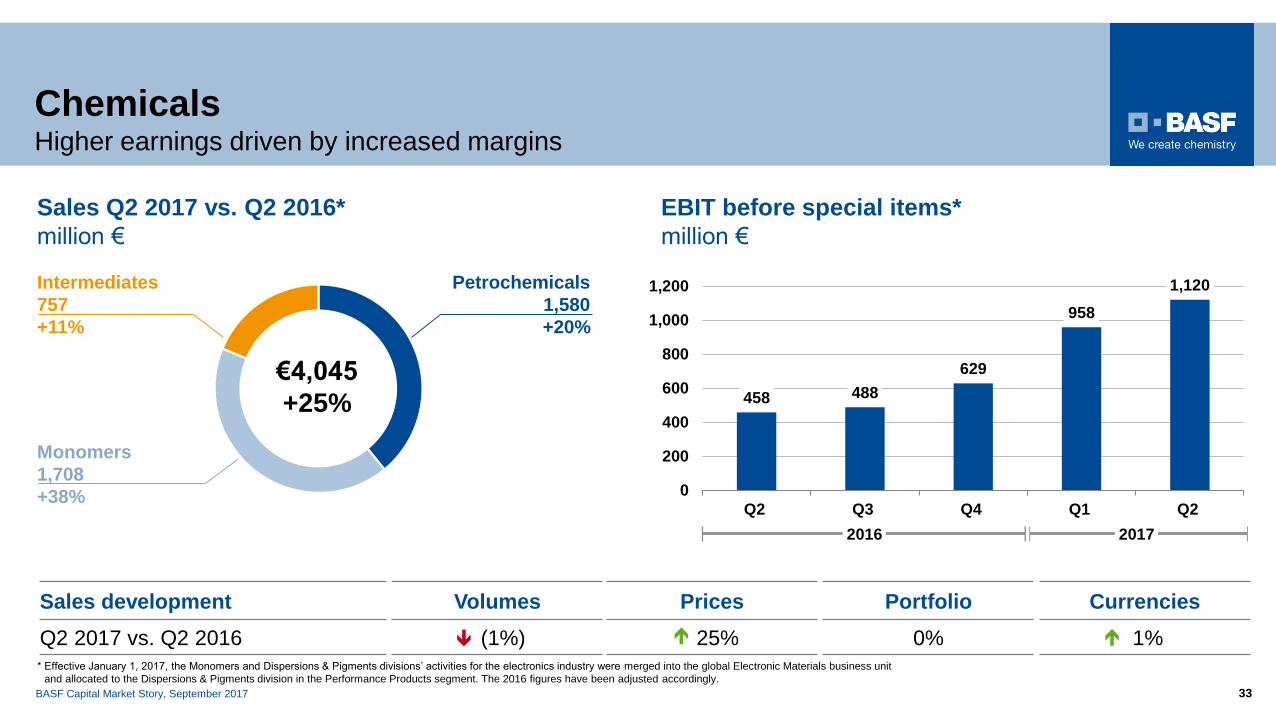
ChemicalsHigher earnings driven by increased margins
Intermediates
757
+11%
Monomers
1,708
+38%
Petrochemicals
1,580
+20%
€4,045
+25%
Sales Q2 2017 vs. Q2 2016*
million €
EBIT before special items*
million €
458 488
629
958
1,120
0
200
400
600
800
1,000
1,200
Q2 Q3 Q4 Q1 Q2
Sales development Volumes Prices Portfolio Currencies
Q2 2017 vs. Q2 2016 (1%) 25% 0% 1%
2016 2017
* Effective January 1, 2017, the Monomers and Dispersions & Pigments divisions’ activities for the electronics industry were merged into the global Electronic Materials business unit
and allocated to the Dispersions & Pigments division in the Performance Products segment. The 2016 figures have been adjusted accordingly.

BASF Capital Market Story, September 2017 34
Performance ProductsSales increased, earnings declined due to lower margins
Performance Chemicals
980
+2%
Nutrition & Health
464
(7%)
Care Chemicals
1,263
+7%
€4,142
+4%
Sales development Volumes Prices Portfolio Currencies
Q2 2017 vs. Q2 2016 2% 2% (1%) 1%
512473
237
515
405
0
200
400
600
800
Q2 Q3 Q4 Q1 Q2
EBIT before special items*
million €
Sales Q2 2017 vs. Q2 2016*
million €
2016 2017
Dispersions & Pigments
1,435
+6%
* Effective January 1, 2017, the Monomers and Dispersions & Pigments divisions’ activities for the electronics industry were merged into the global Electronic Materials business unit
and allocated to the Dispersions & Pigments division in the Performance Products segment. The 2016 figures have been adjusted accordingly.

BASF Capital Market Story, September 2017 35
Functional Materials & Solutions Sales growth on good demand, earnings affected by lower margins overall
and higher fixed costs
Coatings
998
+25%
Catalysts
1,674
+11%
Construction
Chemicals
646
+3%
Performance Materials
1,943
+10%
€5,261
+12%
535497
458531
422
0
200
400
600
800
Q2 Q3 Q4 Q1 Q2
EBIT before special items
million €
Sales development Volumes Prices Portfolio Currencies
Q2 2017 vs. Q2 2016 4% 3% 3% 2%
Sales Q2 2017 vs. Q2 2016
million €
2016 2017

BASF Capital Market Story, September 2017 36
1,459 1,526
3,239 3,381
0
1,000
2,000
3,000
4,000
Q2 2016 Q2 2017 H1 2016 H1 2017
Agricultural SolutionsSales increased, earnings impacted by lower average margins due to different product mix
320272
911
805
0
200
400
600
800
1,000
Q2 2016 Q2 2017 H1 2016 H1 2017
EBIT before special items Q2 2017 vs. Q2 2016 and
H1 2017 vs. H1 2016, million €
Sales development Volumes Prices Portfolio Currencies
Q2 2017 vs. Q2 2016 5% (2%) 0% 2%
Sales Q2 2017 vs. Q2 2016 and
H1 2017 vs. H1 2016, million €
+5%
+4%
(15%)
(12%)

BASF Capital Market Story, September 2017 37
Oil & GasSales and earnings up, mainly due to higher volumes and prices
Sales Q2 2017 vs. Q2 2016
million €
94
183
100122
0
100
200
300
Q2 2016 Q2 2017
EBIT before special items, net income
million €
Sales development Volumes Prices/Currencies Portfolio
Q2 2017 vs. Q2 2016 22% 10% 0%
EBIT before special items Net income
+32%
617
814
0
500
1,000
Q2 2016 Q2 2017
BASF Capital Market Story, September 2017 38
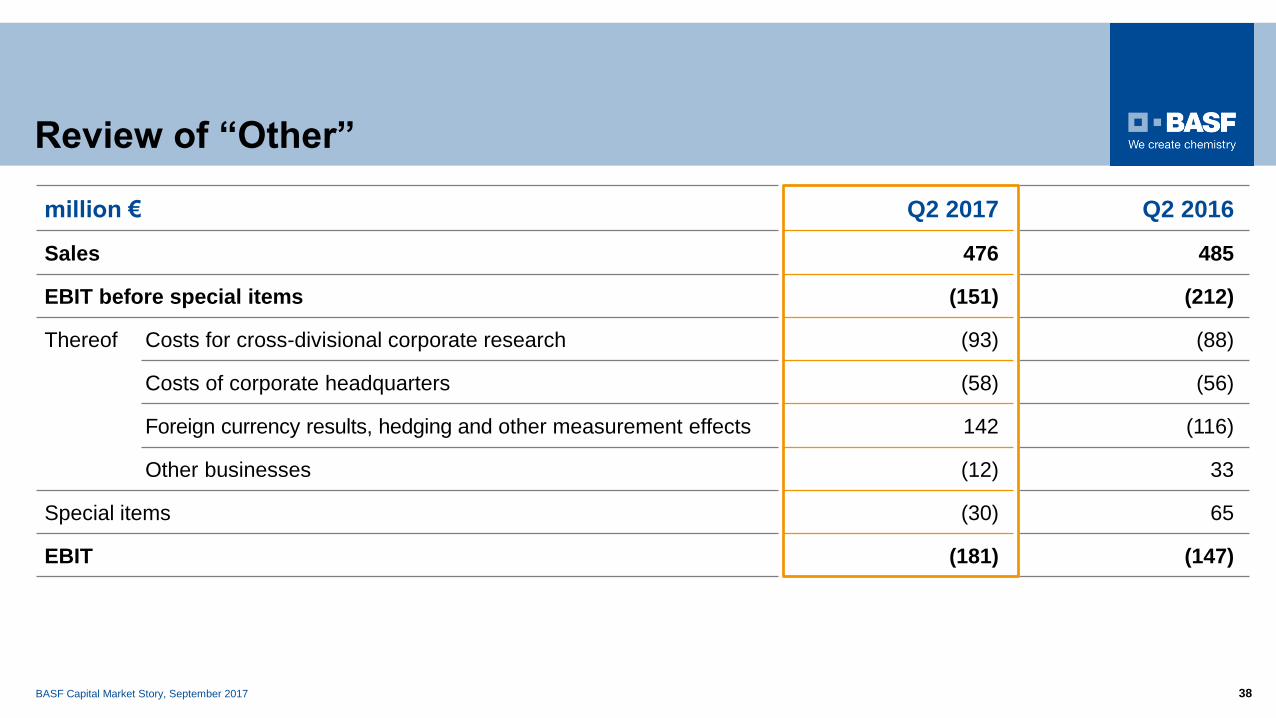
Review of “Other”
million € Q2 2017 Q2 2016
Sales 476 485
EBIT before special items (151) (212)
Thereof Costs for cross-divisional corporate research (93) (88)
Costs of corporate headquarters (58) (56)
Foreign currency results, hedging and other measurement effects 142 (116)
Other businesses (12) 33
Special items (30) 65
EBIT (181) (147)
BASF Capital Market Story, September 2017 39
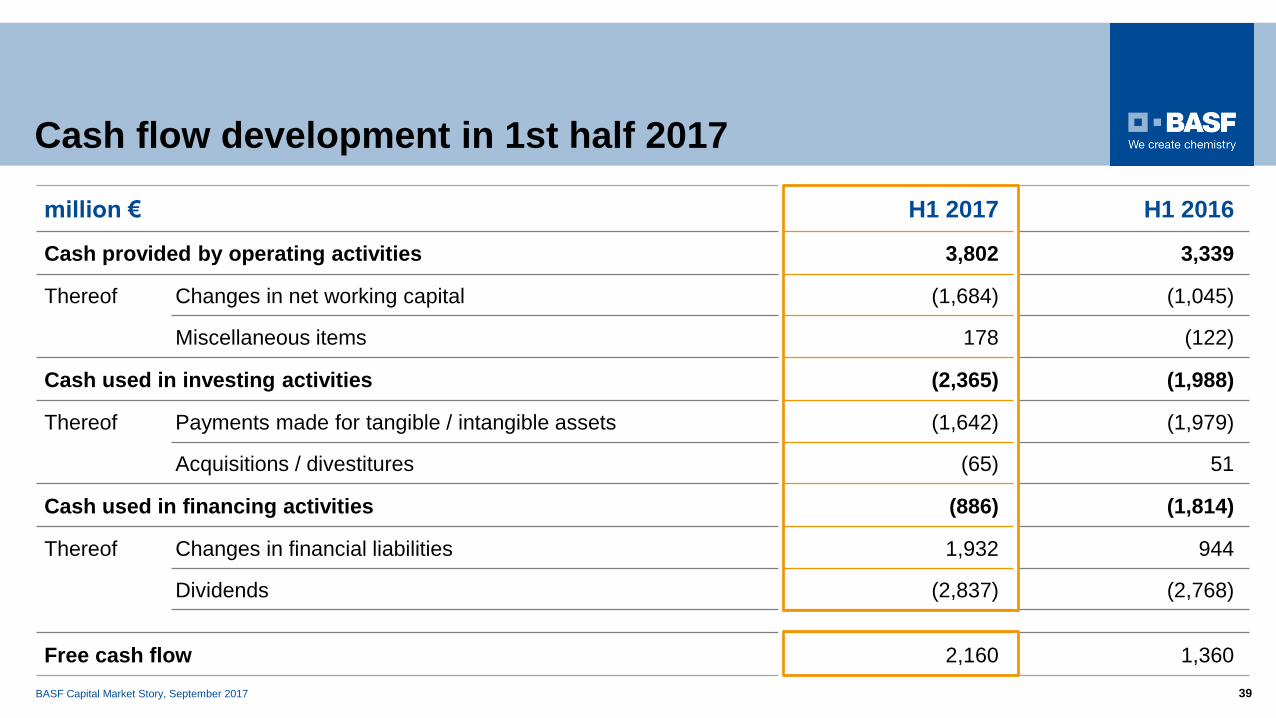
Cash flow development in 1st half 2017
million € H1 2017 H1 2016
Cash provided by operating activities 3,802 3,339
Thereof Changes in net working capital (1,684) (1,045)
Miscellaneous items 178 (122)
Cash used in investing activities (2,365) (1,988)
Thereof Payments made for tangible / intangible assets (1,642) (1,979)
Acquisitions / divestitures (65) 51
Cash used in financing activities (886) (1,814)
Thereof Changes in financial liabilities 1,932 944
Dividends (2,837) (2,768)
Free cash flow 2,160 1,360
BASF Capital Market Story, September 2017 40BASF Investor Day 2015 – Keynote speech 40