we are here today to discuss.… - ventura, ca
TRANSCRIPT
Ven
1009
i1-8
144.
ppt/1
Ven
1009
i1-8
144.
ppt/2
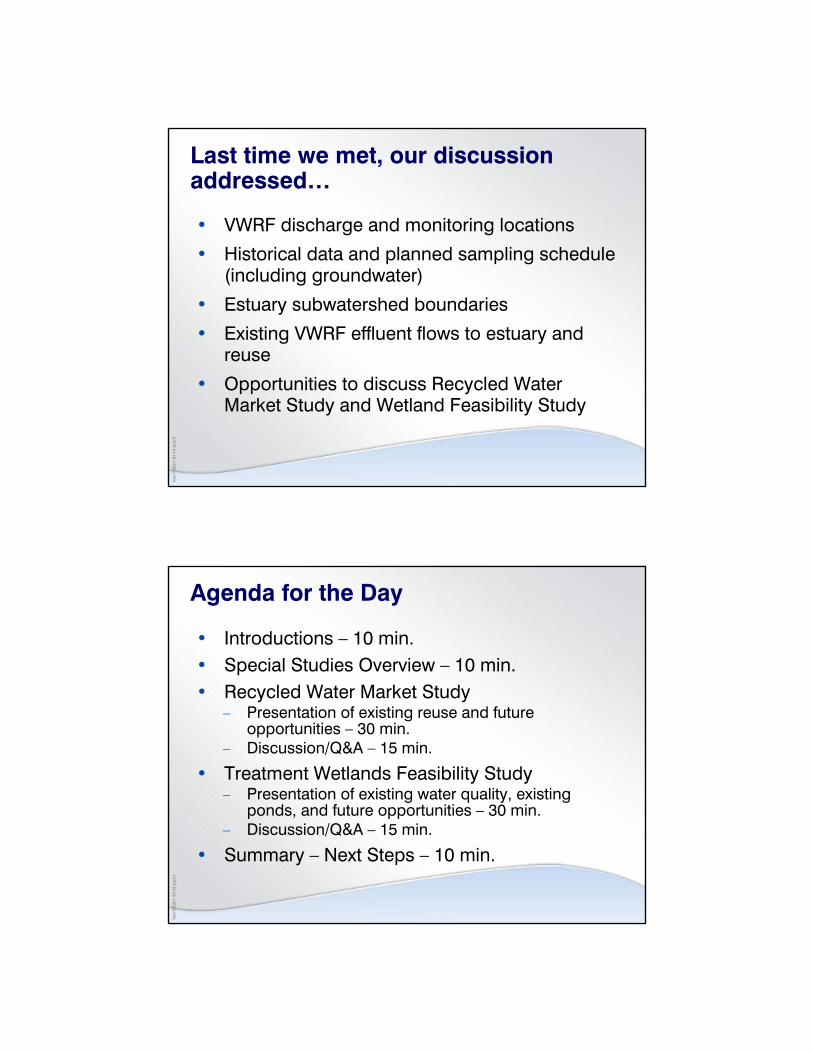
We are here today to discuss.…
• The Santa Clara River Estuary Special Studies
• What these studies are about
• Provide an update on work to date
• Get input from you, the Stakeholders
Ven
1009
i1-8
144.
ppt/3
Last time we met, our discussion addressed…
• VWRF discharge and monitoring locations
• Historical data and planned sampling schedule (including groundwater)
• Estuary subwatershed boundaries
• Existing VWRF effluent flows to estuary and reuse
• Opportunities to discuss Recycled Water Market Study and Wetland Feasibility Study
Ven
1009
i1-8
144.
ppt/4
Agenda for the Day
• Introductions – 10 min.• Special Studies Overview – 10 min.• Recycled Water Market Study
– Presentation of existing reuse and future opportunities – 30 min.
– Discussion/Q&A – 15 min.
• Treatment Wetlands Feasibility Study– Presentation of existing water quality, existing
ponds, and future opportunities – 30 min.– Discussion/Q&A – 15 min.
• Summary – Next Steps – 10 min.
Ven
1009
i1-8
144.
ppt/5
The Special Studies will answer ….
…What is the best use of the treated water resources from the Ventura Water Reclamation Facilities to protect the health of the Santa Clara River Estuary?
Ven
1009
i1-8
144.
ppt/6
What we want from you…
• Listen to presentations on projects to learn about options and issues/benefits of additional reuse and/or wetlands
• Provide input on work- to- date– Is it providing the information you need/hoped for?
• Provide input on your interests about:– Type of reuse for future– Uses of on-site ponds– Potential locations for offsite wetlands
Ven
1009
i1-8
144.
ppt/7
Introductions - Please tell us ….
• Your Name
• Your Affiliation
• Why you are here. What is your interest in this project. (one person from each group – why agency interested in this project)
Ven
1009
i1-8
144.
ppt/8
Special Studies Overview
Ven
1009
i1-8
144.
ppt/9
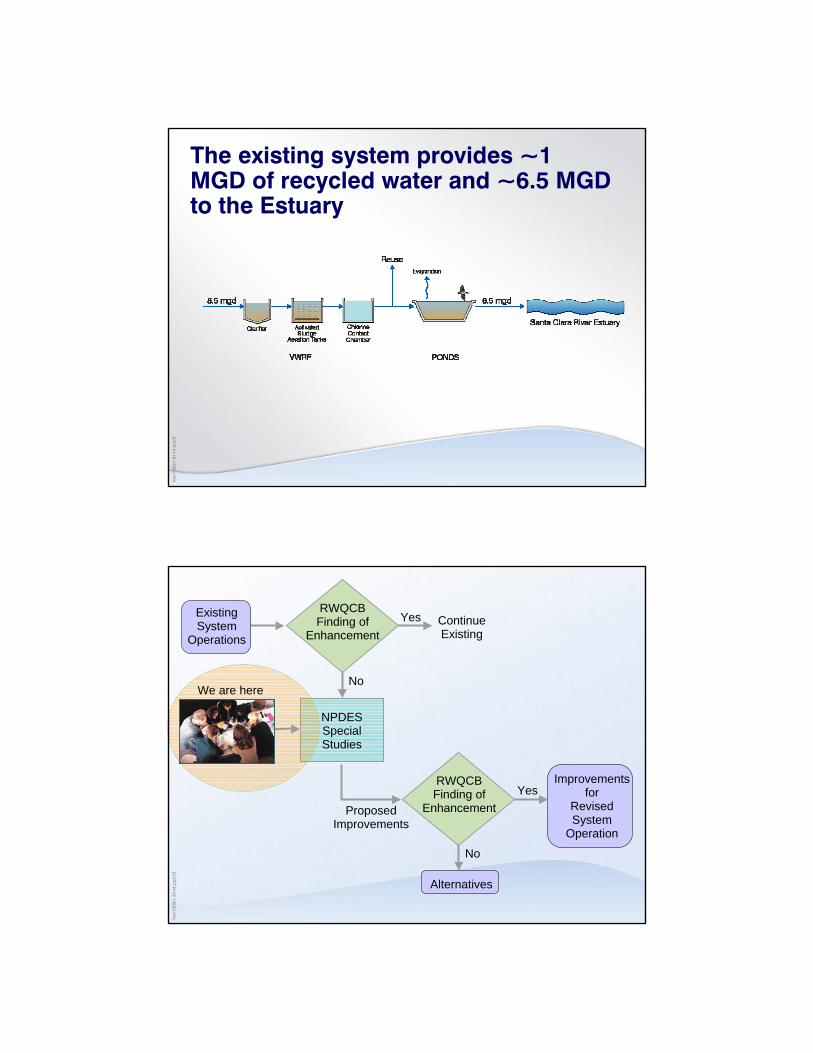
The existing system provides ~1 MGD of recycled water and ~6.5 MGD to the Estuary
Ven
1009
i1-8
144.
ppt/1
0
RWQCB Finding of
Enhancement
Existing System
OperationsContinueExisting
Yes
RWQCB Finding of
Enhancement
Improvements for
Revised System
Operation
Alternatives
Yes
No
NPDES Special Studies
Proposed Improvements
No
We are here
Ven
1009
i1-8
144.
ppt/1
1
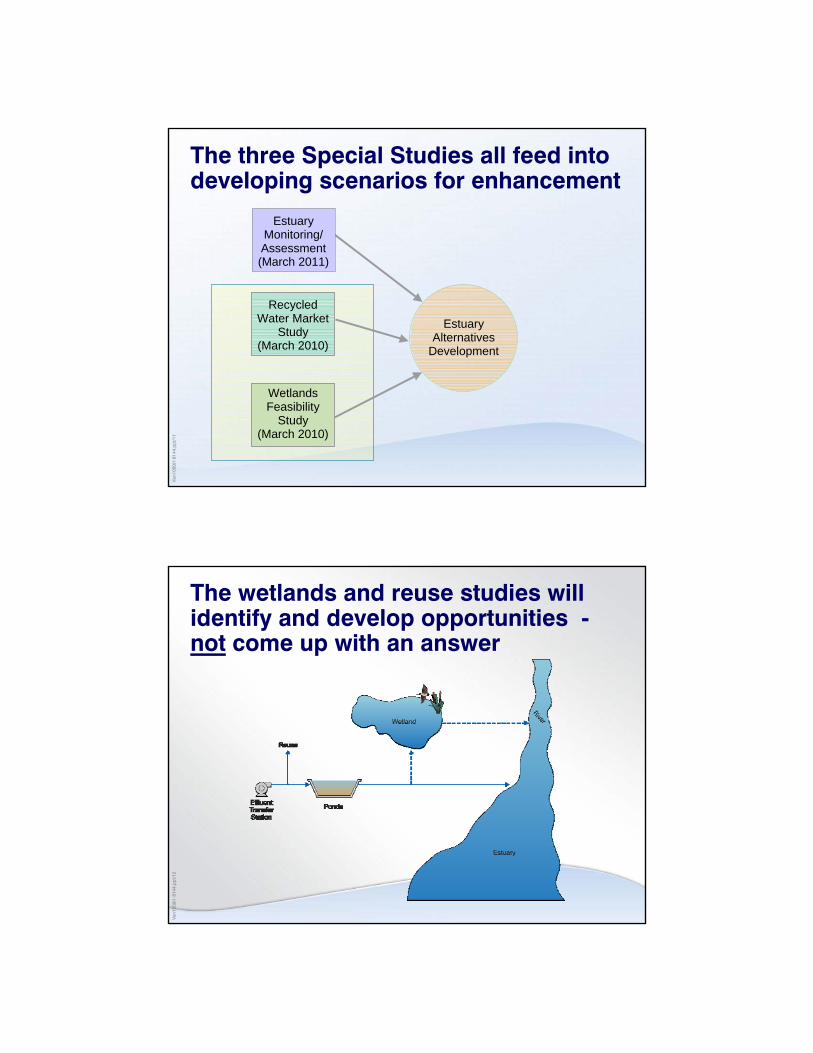
Recycled Water Market
Study(March 2010)
Wetlands Feasibility
Study(March 2010)
EstuaryMonitoring/ Assessment (March 2011)
EstuaryAlternatives
Development
The three Special Studies all feed into developing scenarios for enhancement
Ven
1009
i1-8
144.
ppt/1
2
The wetlands and reuse studies will identify and develop opportunities -not come up with an answer
Ven
1009
i1-8
144.
ppt/1
3
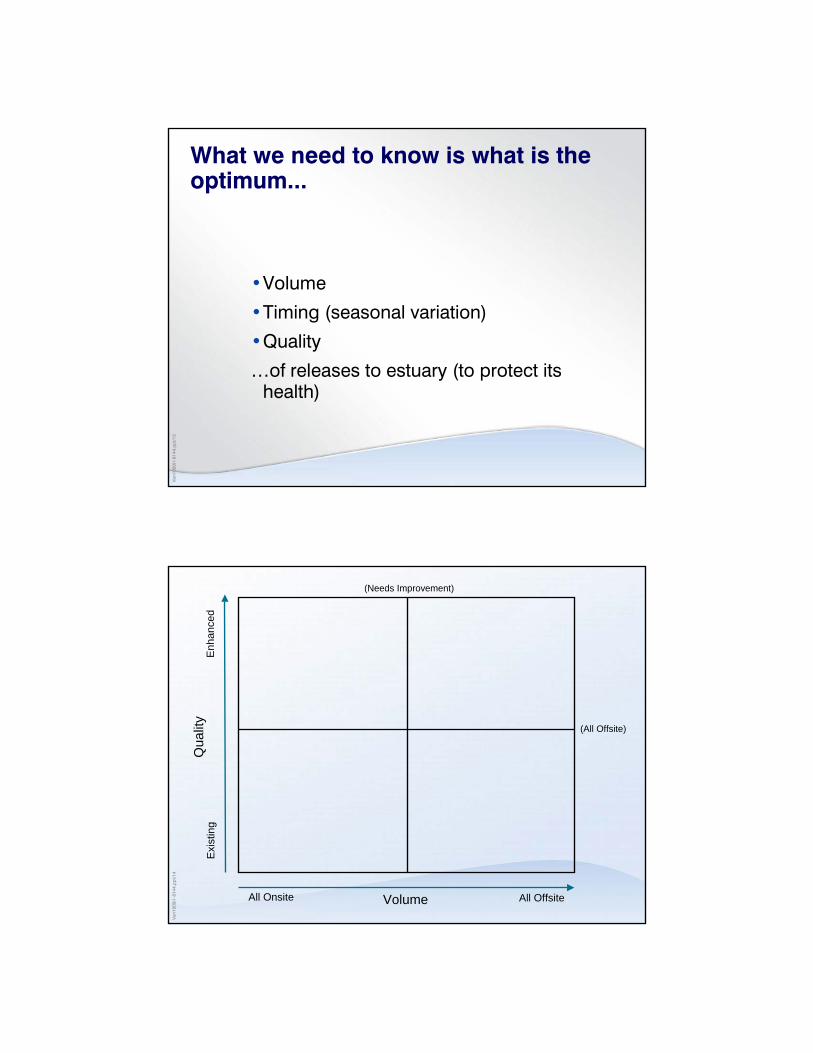
What we need to know is what is the optimum...
•Volume
•Timing (seasonal variation)
•Quality
…of releases to estuary (to protect its health)
Ven
1009
i1-8
144.
ppt/1
4
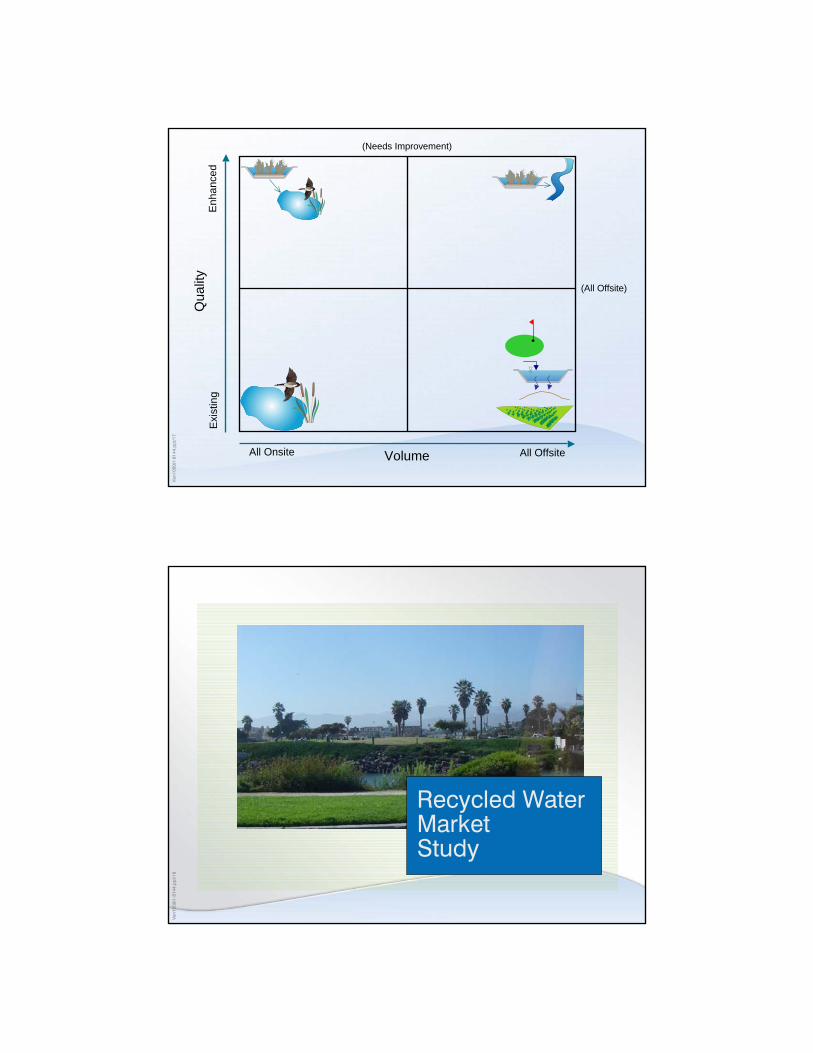
Volume
(Needs Improvement)
(All Offsite)
Exi
stin
g
All Onsite All Offsite
Qua
lity
Enh
ance
d
Ven
1009
i1-8
144.
ppt/1
5
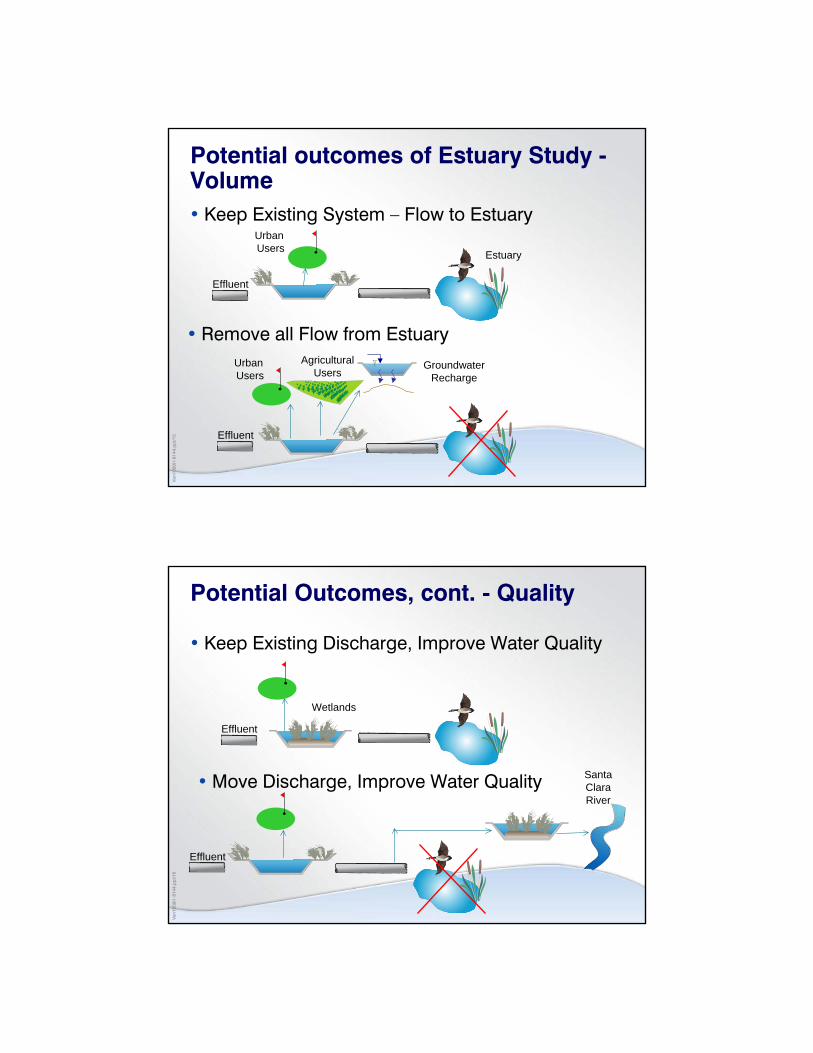
Potential outcomes of Estuary Study -Volume• Keep Existing System – Flow to Estuary
• Remove all Flow from Estuary
Effluent
Effluent
Urban Users Estuary
Urban Users
AgriculturalUsers
Groundwater Recharge
Ven
1009
i1-8
144.
ppt/1
6
Potential Outcomes, cont. - Quality
• Keep Existing Discharge, Improve Water Quality
• Move Discharge, Improve Water Quality
Effluent
Effluent
Wetlands
Santa ClaraRiver
Ven
1009
i1-8
144.
ppt/1
7
Volume
(Needs Improvement)
(All Offsite)
Enh
ance
d
All Onsite All Offsite
Qua
lity
Exi
stin
g
Ven
1009
i1-8
144.
ppt/1
8
Recycled Water Market Study
Ven
1009
i1-8
144.
ppt/1
9
Study Objectives
• Identify the recycled water opportunities within a 5 mile radius
– Developing alternatives for serving potential users– Developing costs to implement alternatives
Ven
1009
i1-8
144.
ppt/2
0
There are several direct and indirect benefits of expanding the City’s recycled water system
• Decrease the wastewater discharge to the estuary
• Offset potable water demands in the City’s service area
• Offset groundwater demands for agricultural irrigation
Ven
1009
i1-8
144.
ppt/2
1
Stepwise approach was designed to meet study objectives
• Review Existing Recycled Water System
• Identify Opportunities for Expansion– Location and Demands– Regulatory Requirements– Specific Water Quality Objectives– Additional Treatment Needs
• Develop Alternatives– Pipeline Alignments– Additional Treatment (if needed)– Costs
Ven
1009
i1-8
144.
ppt/2
2
Existing Recycled Water System
Ven
1009
i1-8
144.
ppt/2
3
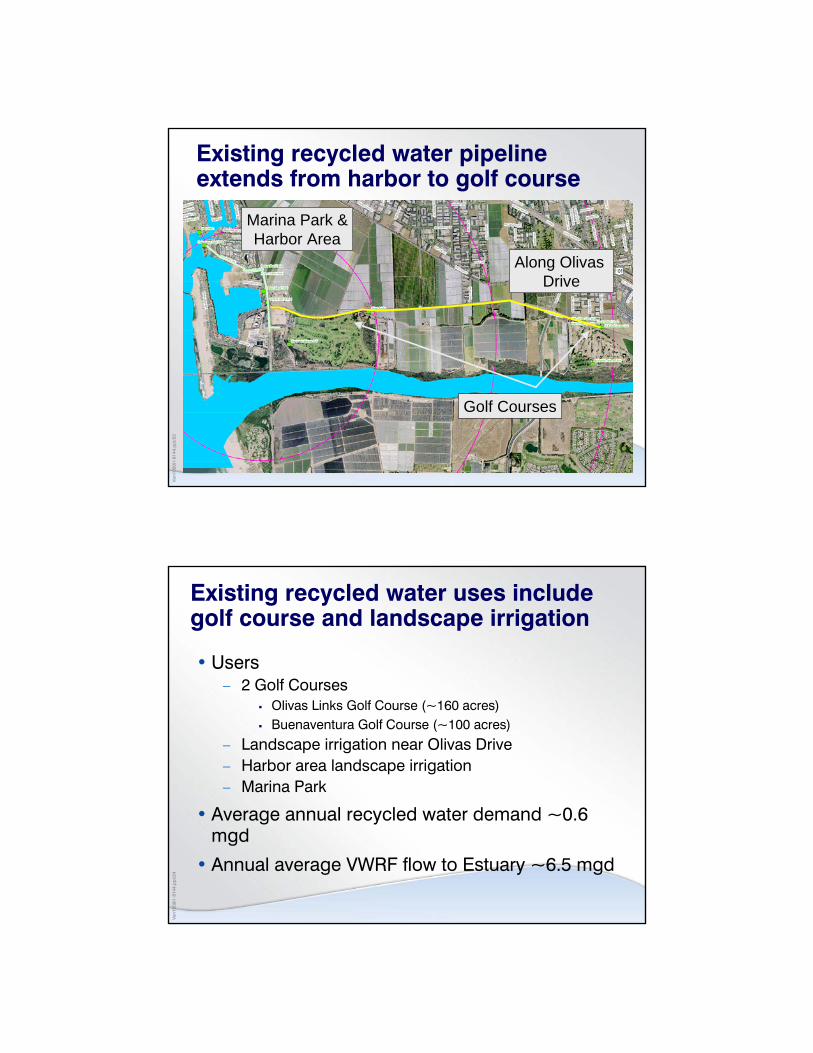
Existing recycled water pipeline extends from harbor to golf course
Golf Courses
Marina Park &Harbor Area
Along Olivas Drive
Ven
1009
i1-8
144.
ppt/2
4
Existing recycled water uses include golf course and landscape irrigation
• Users– 2 Golf Courses
Olivas Links Golf Course (~160 acres)Buenaventura Golf Course (~100 acres)
– Landscape irrigation near Olivas Drive– Harbor area landscape irrigation– Marina Park
• Average annual recycled water demand ~0.6 mgd
• Annual average VWRF flow to Estuary ~6.5 mgd
Ven
1009
i1-8
144.
ppt/2
5
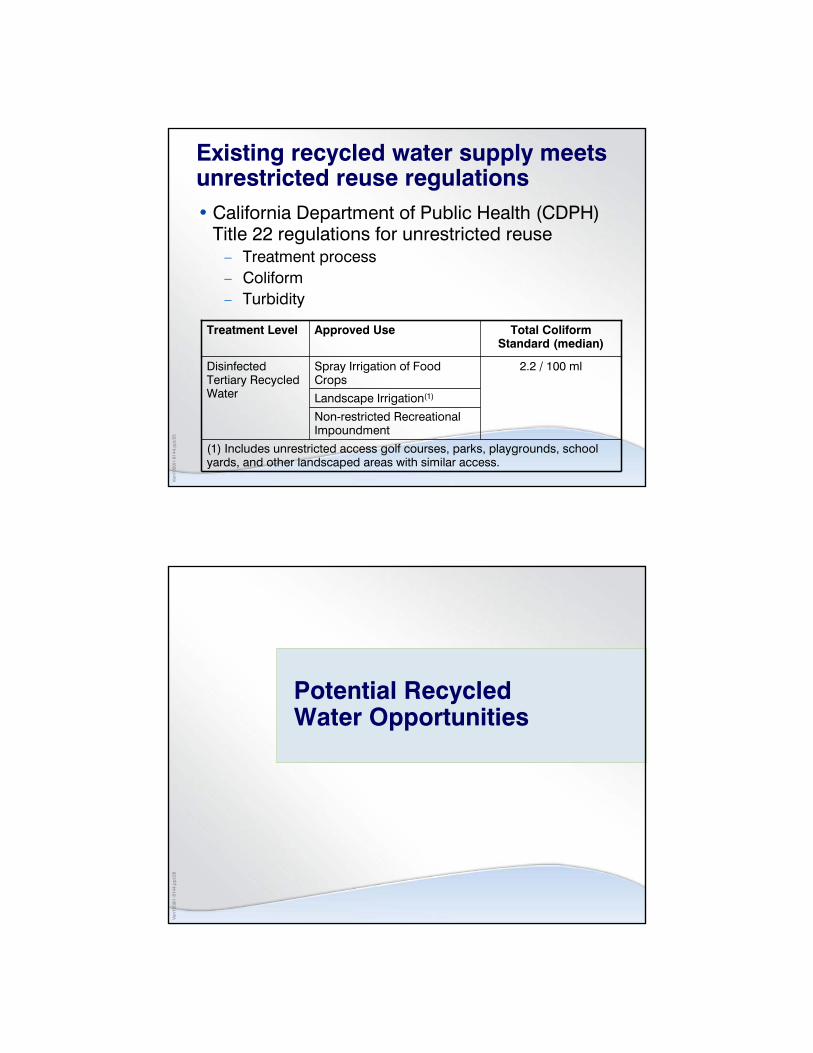
Existing recycled water supply meets unrestricted reuse regulations• California Department of Public Health (CDPH)
Title 22 regulations for unrestricted reuse– Treatment process– Coliform– Turbidity
(1) Includes unrestricted access golf courses, parks, playgrounds, school yards, and other landscaped areas with similar access.
Non-restricted Recreational Impoundment
Landscape Irrigation(1)
2.2 / 100 ml Spray Irrigation of Food Crops
Disinfected Tertiary Recycled Water
Total ColiformStandard (median)
Approved UseTreatment Level
Ven
1009
i1-8
144.
ppt/2
6
Potential Recycled Water Opportunities
Ven
1009
i1-8
144.
ppt/2
7
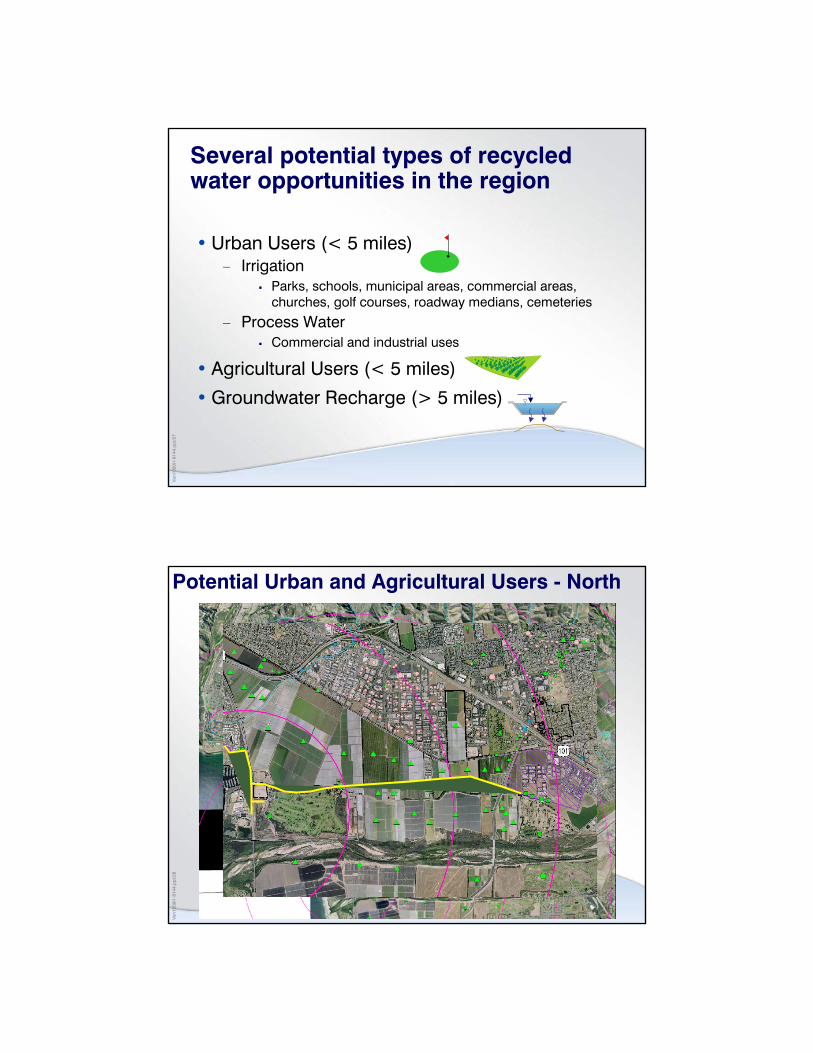
Several potential types of recycled water opportunities in the region
• Urban Users (< 5 miles)– Irrigation
Parks, schools, municipal areas, commercial areas, churches, golf courses, roadway medians, cemeteries
– Process Water Commercial and industrial uses
• Agricultural Users (< 5 miles)
• Groundwater Recharge (> 5 miles)
Ven
1009
i1-8
144.
ppt/2
8
Potential Urban and Agricultural Users - North
Ven
1009
i1-8
144.
ppt/2
9
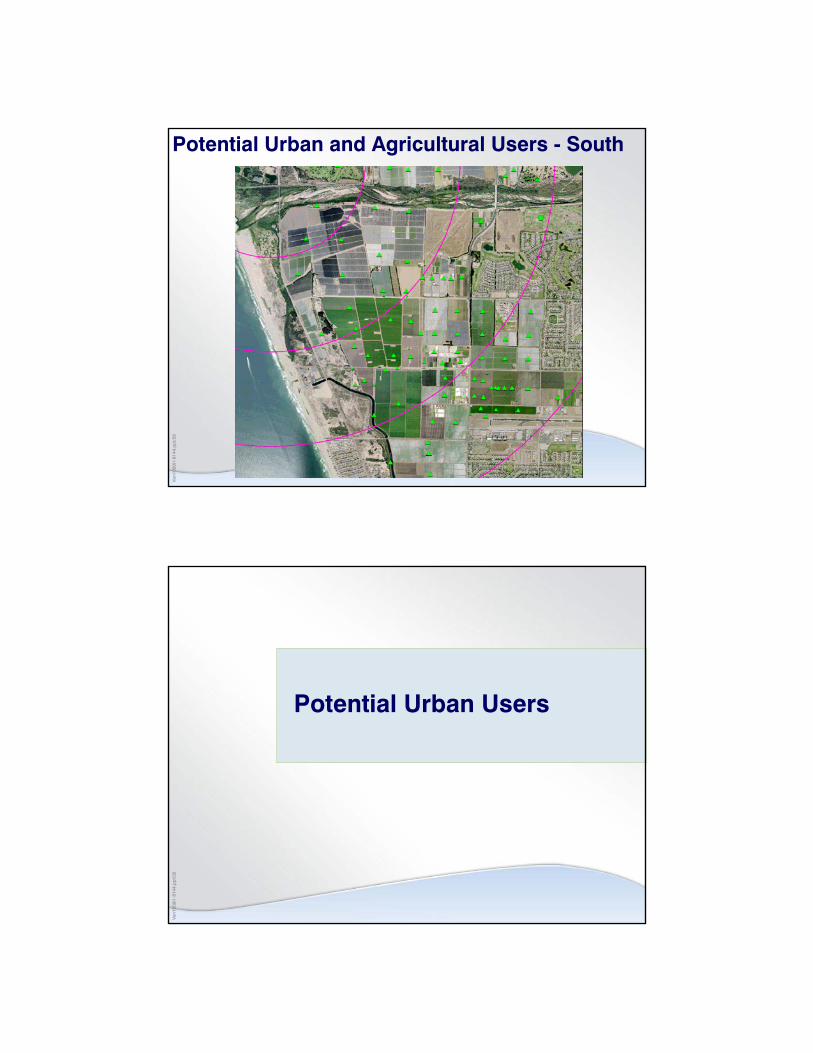
Potential Urban and Agricultural Users - SouthV
en10
09i1
-814
4.pp
t/30
Potential Urban Users

Ven
1009
i1-8
144.
ppt/3
1Approach and assumptions for developing potential urban demands
• Approach– Provide recycled water to users in Recycled Water
Focus Area– Expand system by targeting largest potential
demands
• Assumptions– Irrigation accounts can be converted to recycled
water– Other potential demands identified– Industrial users not included
Ven
1009
i1-8
144.
ppt/3
2
Urban landscape irrigation regulated under Title 22 regulations for unrestricted reuse
• California Department of Public Health – Title 22– Regulations for Unrestricted Reuse
• Attainment of Regulations– Expected based on existing system performance
Ven
1009
i1-8
144.
ppt/3
3
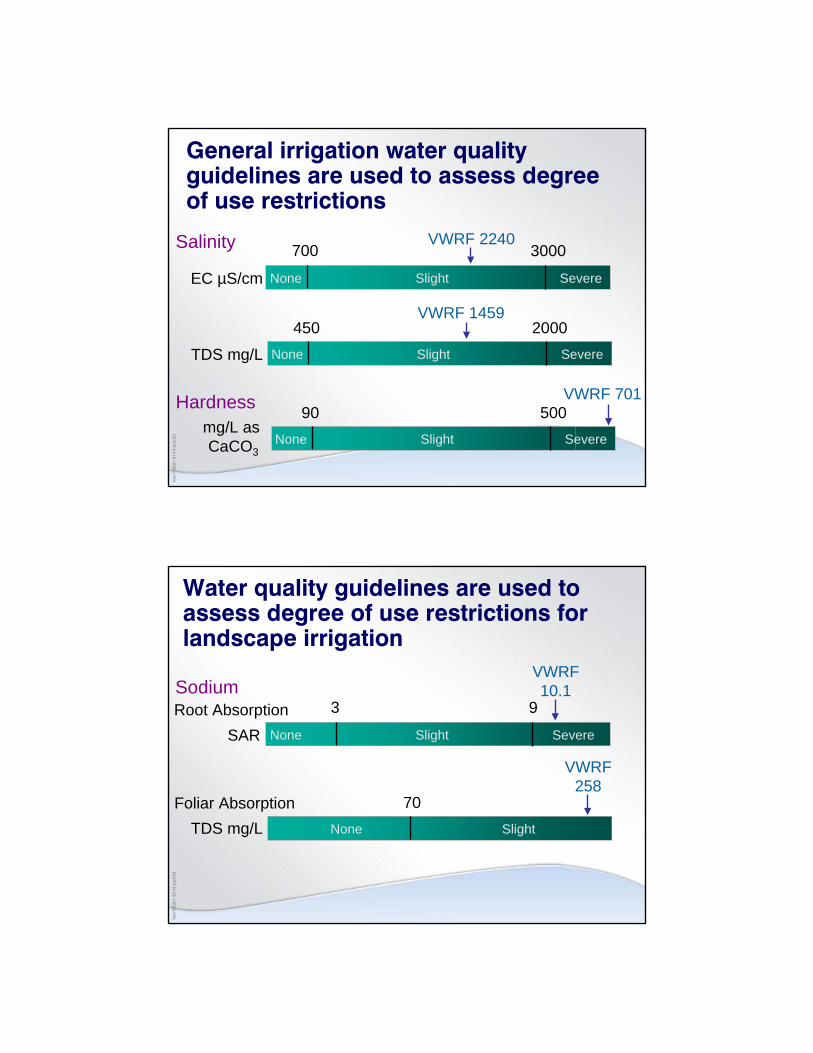
General irrigation water quality guidelines are used to assess degree of use restrictions
700 3000
EC µS/cm None SevereSlight
450 2000
TDS mg/L None SevereSlight
Salinity VWRF 2240
VWRF 1459
90 500mg/L as CaCO3
None SevereSlight
VWRF 701Hardness
Ven
1009
i1-8
144.
ppt/3
4
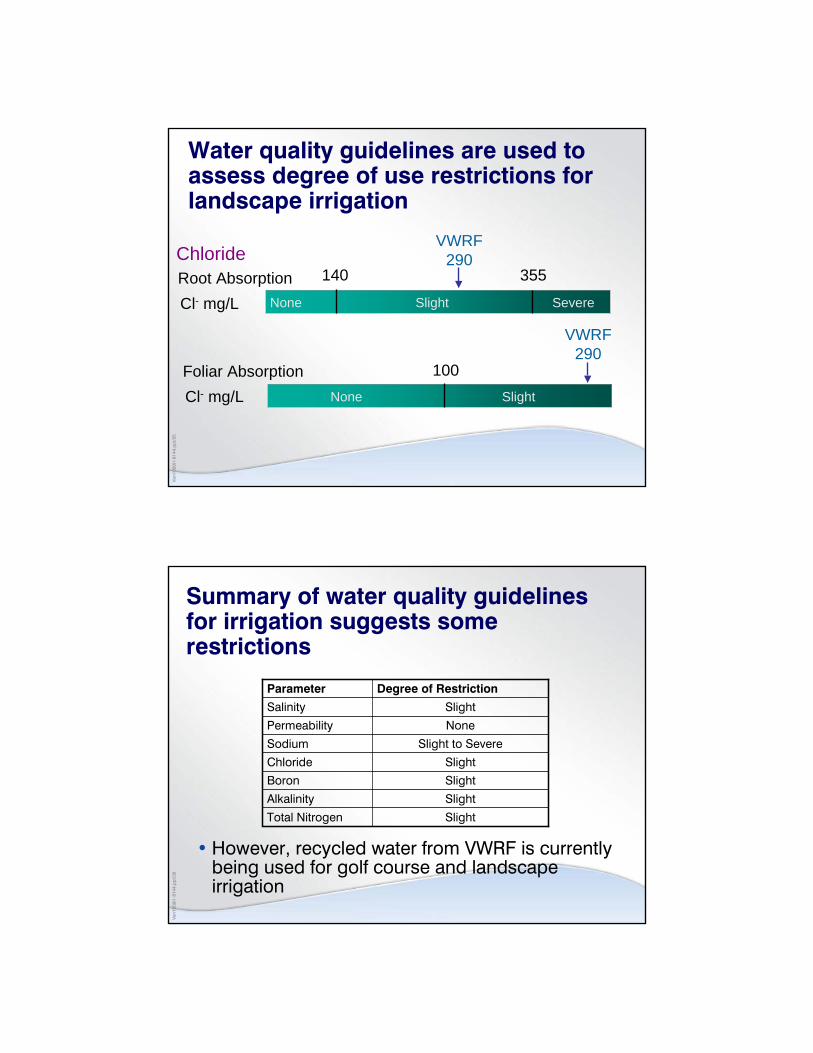
Water quality guidelines are used to assess degree of use restrictions for landscape irrigation
3 9
None SevereSlight
70TDS mg/L None Slight
SodiumVWRF10.1
VWRF258
Foliar Absorption
SARRoot Absorption
Ven
1009
i1-8
144.
ppt/3
5
Water quality guidelines are used to assess degree of use restrictions for landscape irrigation
140 355
None SevereSlight
100None Slight
ChlorideVWRF
290
VWRF290
Cl- mg/LRoot Absorption
Cl- mg/LFoliar Absorption
Ven
1009
i1-8
144.
ppt/3
6
Summary of water quality guidelines for irrigation suggests some restrictions
SlightTotal Nitrogen
SlightAlkalinity
SlightBoron
SlightChloride
Slight to SevereSodium
NonePermeability
SlightSalinity
Degree of RestrictionParameter
• However, recycled water from VWRF is currently being used for golf course and landscape irrigation
Ven
1009
i1-8
144.
ppt/3
7
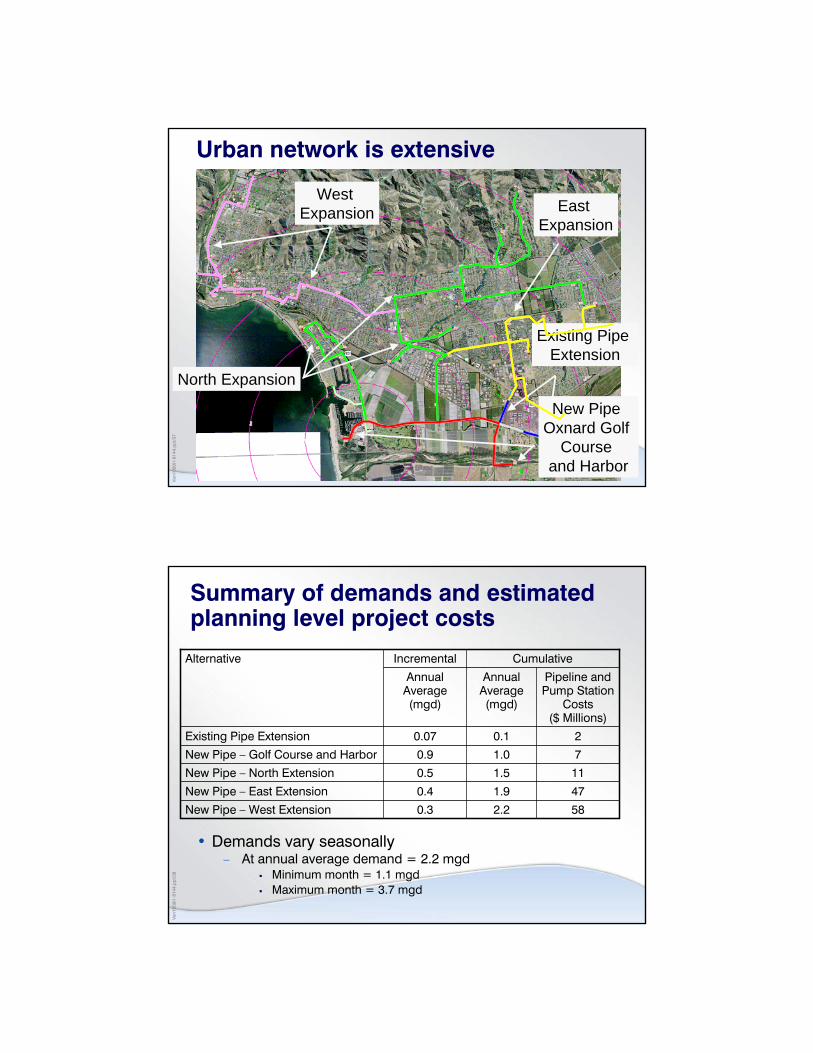
Urban network is extensive
Existing Pipe Extension
New Pipe Oxnard Golf
Course and Harbor
North Expansion
East Expansion
West Expansion
Ven
1009
i1-8
144.
ppt/3
8
Summary of demands and estimated planning level project costs
58
47
11
7
2
Pipeline and Pump Station
Costs($ Millions)
2.2
1.9
1.5
1.0
0.1
Annual Average (mgd)
CumulativeIncremental
New Pipe – West Extension
New Pipe – East Extension
New Pipe – North Extension
New Pipe – Golf Course and Harbor
Existing Pipe Extension
Alternative
0.3
0.4
0.5
0.9
0.07
Annual Average (mgd)
• Demands vary seasonally– At annual average demand = 2.2 mgd
Minimum month = 1.1 mgdMaximum month = 3.7 mgd
Ven
1009
i1-8
144.
ppt/3
9
Potential Agricultural Users
Ven
1009
i1-8
144.
ppt/4
0
Approach and assumptions for developing agricultural demands
• Approach– Expand system by targeting largest potential
demands
• Assumptions– Predominant crops are row crops, strawberries,
lemons and avocados– Water usage = 2.5 AF/AC per year– Monthly usage percentages based on regional data
Ven
1009
i1-8
144.
ppt/4
1
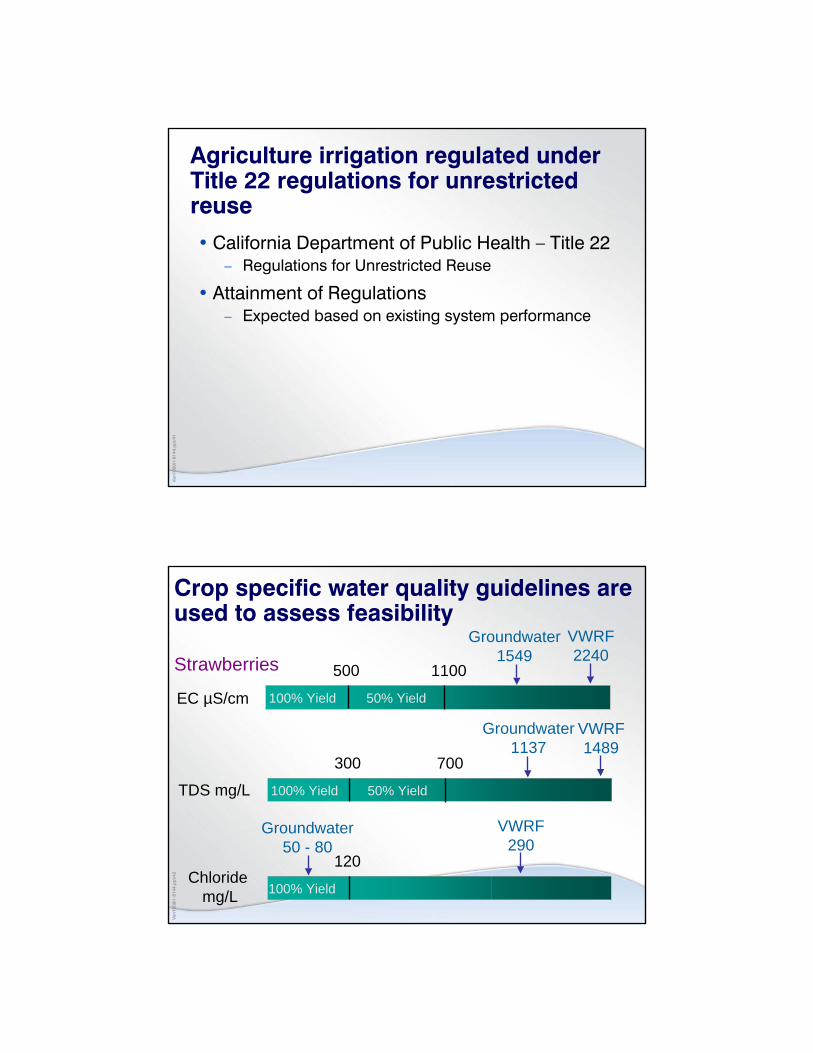
Agriculture irrigation regulated under Title 22 regulations for unrestricted reuse
• California Department of Public Health – Title 22– Regulations for Unrestricted Reuse
• Attainment of Regulations– Expected based on existing system performance
Ven
1009
i1-8
144.
ppt/4
2
Crop specific water quality guidelines are used to assess feasibility
500 1100
EC µS/cm 100% Yield 50% Yield
TDS mg/L
StrawberriesVWRF2240
Groundwater1549
300 700
100% Yield 50% Yield
VWRF1489
Groundwater1137
120
100% YieldChloride
mg/L
Groundwater50 - 80
VWRF290
Ven
1009
i1-8
144.
ppt/4
3
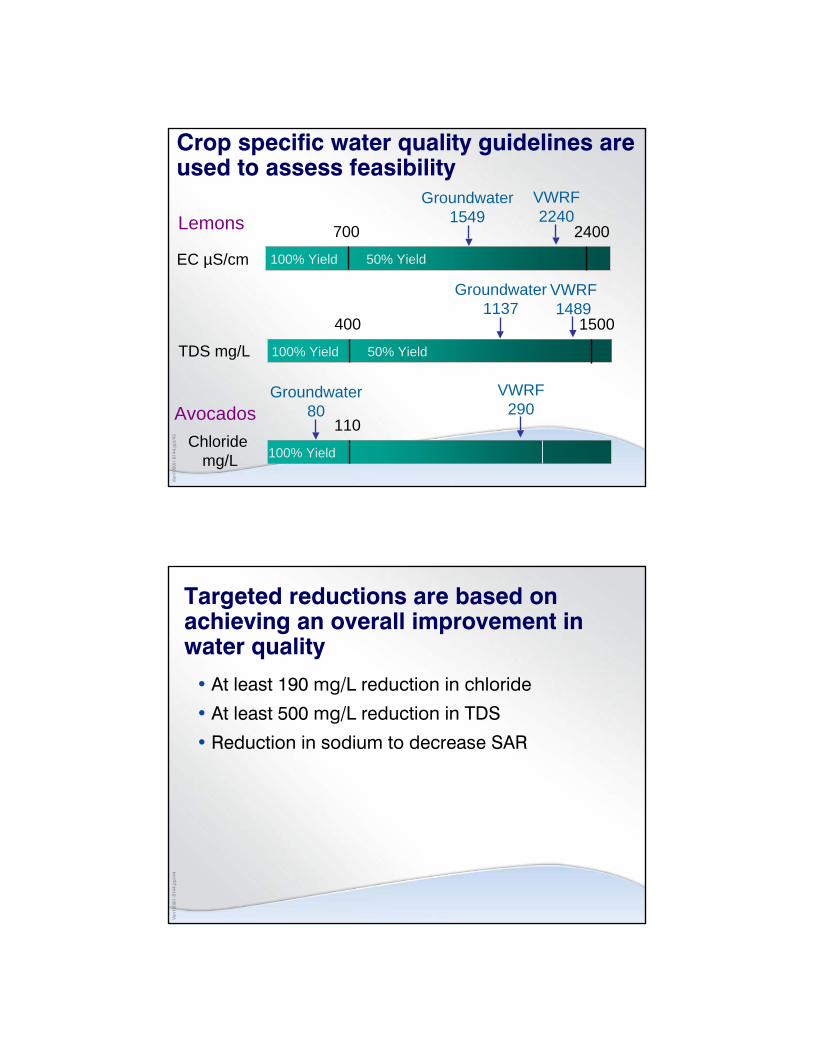
Crop specific water quality guidelines are used to assess feasibility
700 2400
EC µS/cm 100% Yield 50% Yield
TDS mg/L
LemonsVWRF2240
Groundwater1549
400 1500
100% Yield 50% Yield
VWRF1489
Groundwater1137
110
100% YieldChloride
mg/L
Groundwater80
VWRF290Avocados
Ven
1009
i1-8
144.
ppt/4
4
Targeted reductions are based on achieving an overall improvement in water quality
• At least 190 mg/L reduction in chloride
• At least 500 mg/L reduction in TDS
• Reduction in sodium to decrease SAR

Ven
1009
i1-8
144.
ppt/4
5
Water quality can be improved through source control and treatment
• Source control for TDS and chlorides– Potable source water
Estimated average TDS = >700 mg/LSignificant changes in quality not expected
– Self regenerating water softeners~ 50 mg/L chloride reduction~ 200 mg/L TDS reduction
• Treatment– VWRF effluent – Point of Use– Potable supply
Ven
1009
i1-8
144.
ppt/4
6
TDS and chloride can be removed from VWRF effluent by microfiltration followed by reverse osmosis (RO)
Agricultural Users
VWRFEffluent MF/RO
BrineConcentration
and Land Disposal
Reduction in chlorides (to 190 mg/L) controls RO treatment flow
30% of Flow
70% of Flow
Surface Water, Injection,
Sewer
Or
Ven
1009
i1-8
144.
ppt/4
7
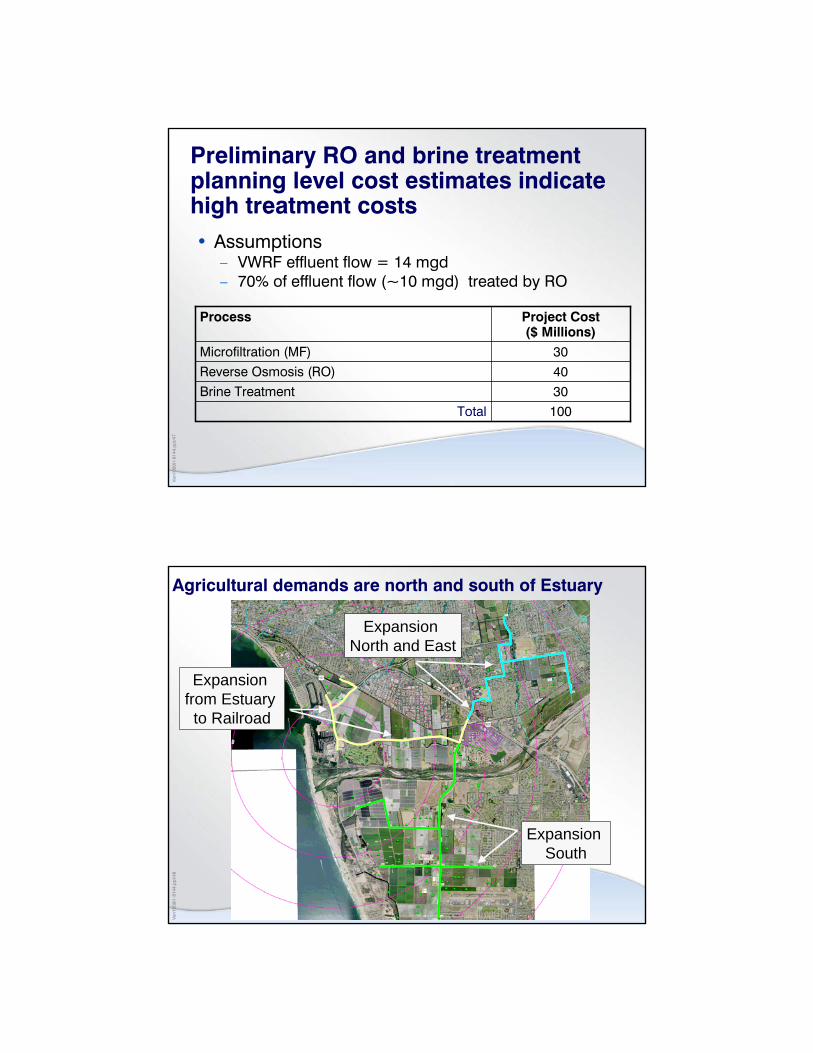
Preliminary RO and brine treatment planning level cost estimates indicate high treatment costs• Assumptions
– VWRF effluent flow = 14 mgd– 70% of effluent flow (~10 mgd) treated by RO
Project Cost ($ Millions)
30Microfiltration (MF)
1003040
TotalBrine TreatmentReverse Osmosis (RO)
Process
Ven
1009
i1-8
144.
ppt/4
8
Agricultural demands are north and south of Estuary
Expansion from Estuary to Railroad
Expansion North and East
Expansion South
Ven
1009
i1-8
144.
ppt/4
9
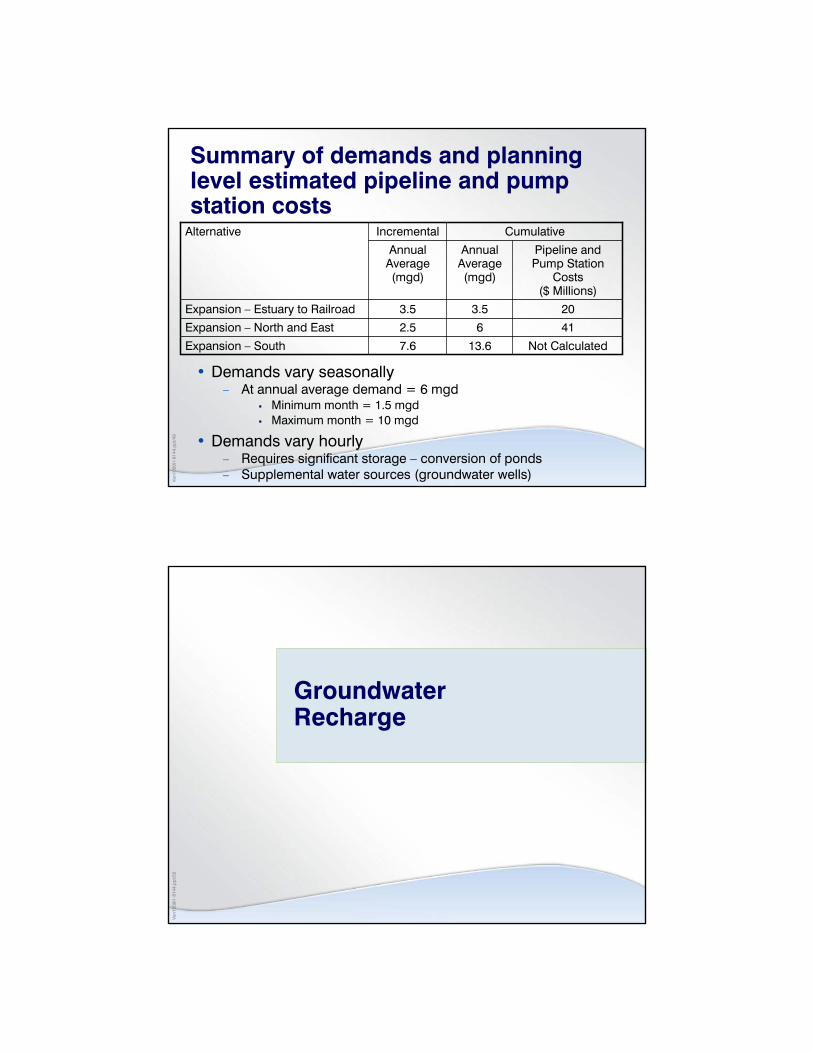
Summary of demands and planning level estimated pipeline and pump station costs
Not Calculated13.67.6Expansion – South
4162.5Expansion – North and East
20
Pipeline and Pump Station
Costs($ Millions)
3.5
Annual Average (mgd)
CumulativeIncremental
Expansion – Estuary to Railroad
Alternative
3.5
Annual Average (mgd)
• Demands vary seasonally– At annual average demand = 6 mgd
Minimum month = 1.5 mgdMaximum month = 10 mgd
• Demands vary hourly– Requires significant storage – conversion of ponds– Supplemental water sources (groundwater wells)
Ven
1009
i1-8
144.
ppt/5
0
Groundwater Recharge
Ven
1009
i1-8
144.
ppt/5
1
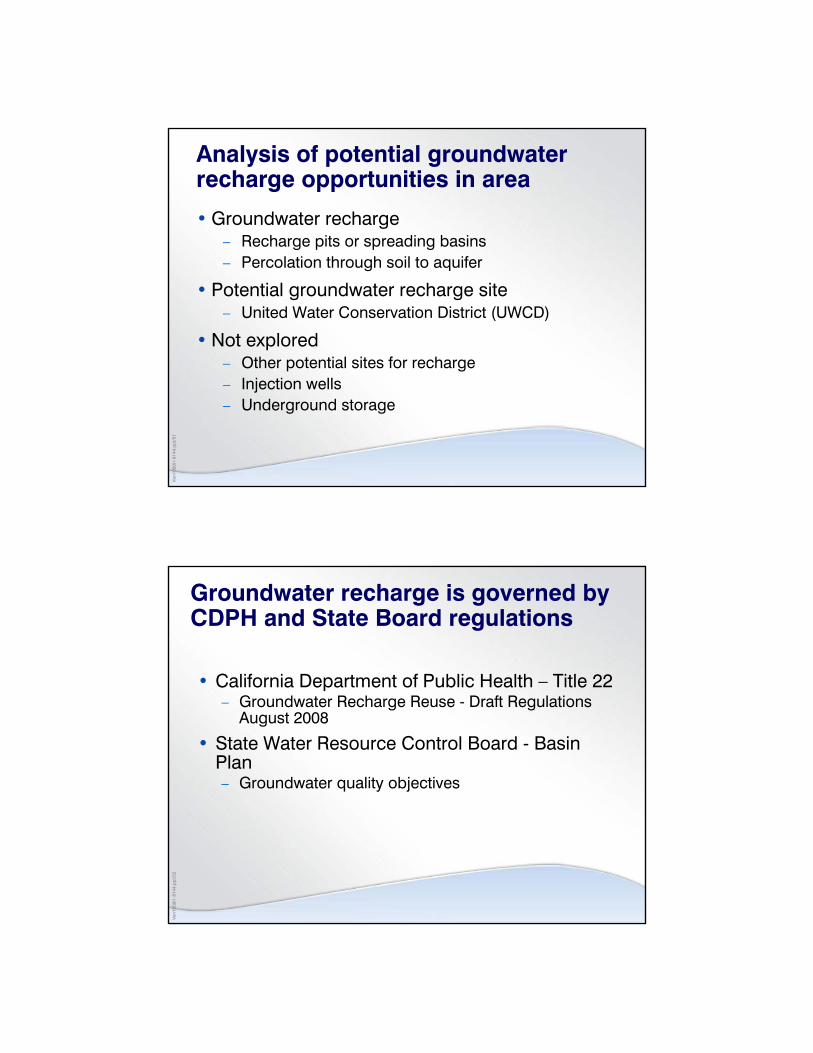
Analysis of potential groundwater recharge opportunities in area
• Groundwater recharge– Recharge pits or spreading basins– Percolation through soil to aquifer
• Potential groundwater recharge site– United Water Conservation District (UWCD)
• Not explored– Other potential sites for recharge– Injection wells– Underground storage
Ven
1009
i1-8
144.
ppt/5
2
Groundwater recharge is governed by CDPH and State Board regulations
• California Department of Public Health – Title 22– Groundwater Recharge Reuse - Draft Regulations
August 2008
• State Water Resource Control Board - Basin Plan– Groundwater quality objectives
Ven
1009
i1-8
144.
ppt/5
3
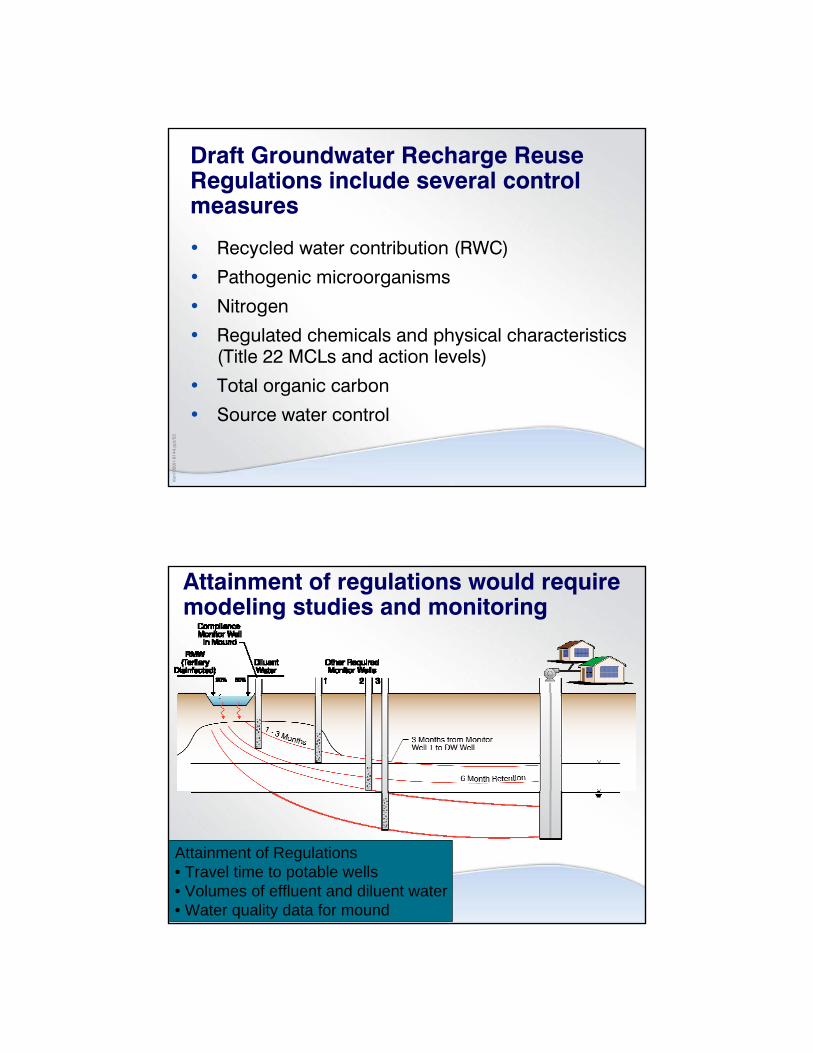
Draft Groundwater Recharge Reuse Regulations include several control measures
• Recycled water contribution (RWC)
• Pathogenic microorganisms
• Nitrogen
• Regulated chemicals and physical characteristics (Title 22 MCLs and action levels)
• Total organic carbon
• Source water control
Ven
1009
i1-8
144.
ppt/5
4
Attainment of Regulations• Travel time to potable wells• Volumes of effluent and diluent water• Water quality data for mound
Attainment of regulations would require modeling studies and monitoring
Ven
1009
i1-8
144.
ppt/5
5
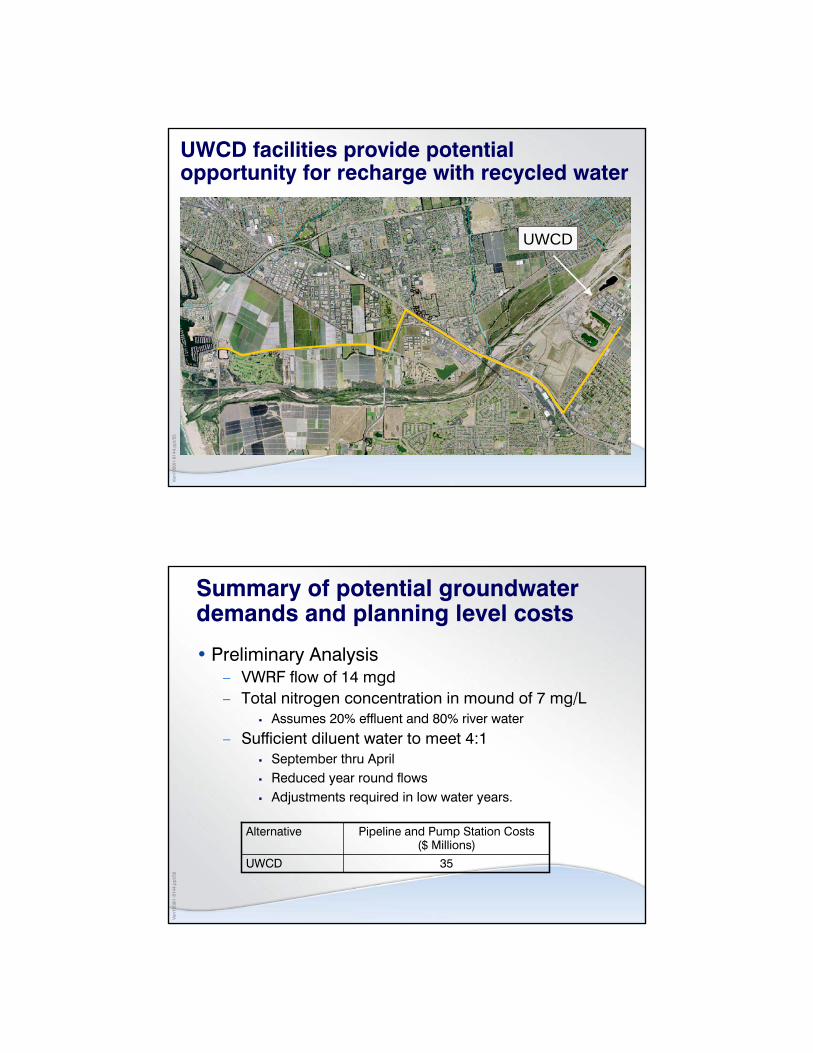
UWCD facilities provide potential opportunity for recharge with recycled water
UWCD
Ven
1009
i1-8
144.
ppt/5
6
Summary of potential groundwater demands and planning level costs
• Preliminary Analysis– VWRF flow of 14 mgd– Total nitrogen concentration in mound of 7 mg/L
Assumes 20% effluent and 80% river water
– Sufficient diluent water to meet 4:1September thru AprilReduced year round flowsAdjustments required in low water years.
UWCD
Alternative
35
Pipeline and Pump Station Costs($ Millions)
Ven
1009
i1-8
144.
ppt/5
7
Summary of Opportunities and Challenges
Ven
1009
i1-8
144.
ppt/5
8
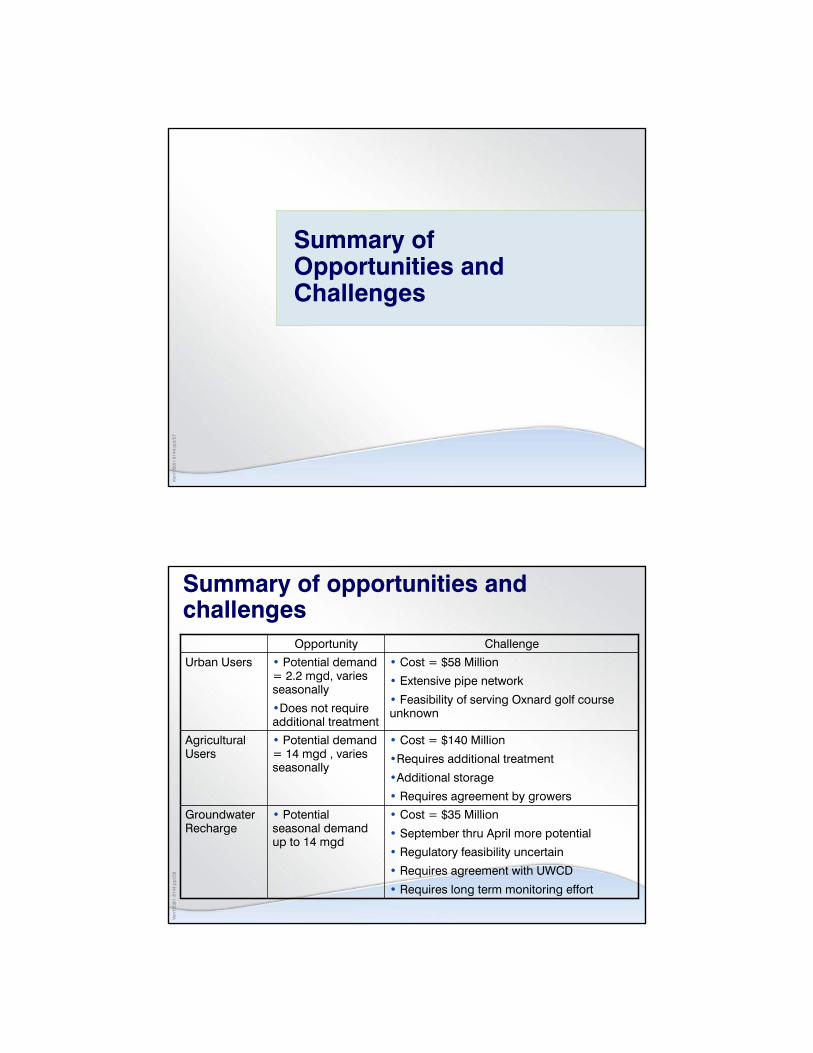
Summary of opportunities and challenges
Groundwater Recharge
Agricultural Users
Urban Users
• Cost = $35 Million
• September thru April more potential
• Regulatory feasibility uncertain
• Requires agreement with UWCD
• Requires long term monitoring effort
• Cost = $140 Million
•Requires additional treatment
•Additional storage
• Requires agreement by growers
• Cost = $58 Million
• Extensive pipe network
• Feasibility of serving Oxnard golf course unknown
Challenge
• Potential seasonal demand up to 14 mgd
• Potential demand = 14 mgd , varies seasonally
• Potential demand = 2.2 mgd, varies seasonally
•Does not require additional treatment
Opportunity
Ven
1009
i1-8
144.
ppt/5
9
Discussion/Q&A
Ven
1009
i1-8
144.
ppt/6
0
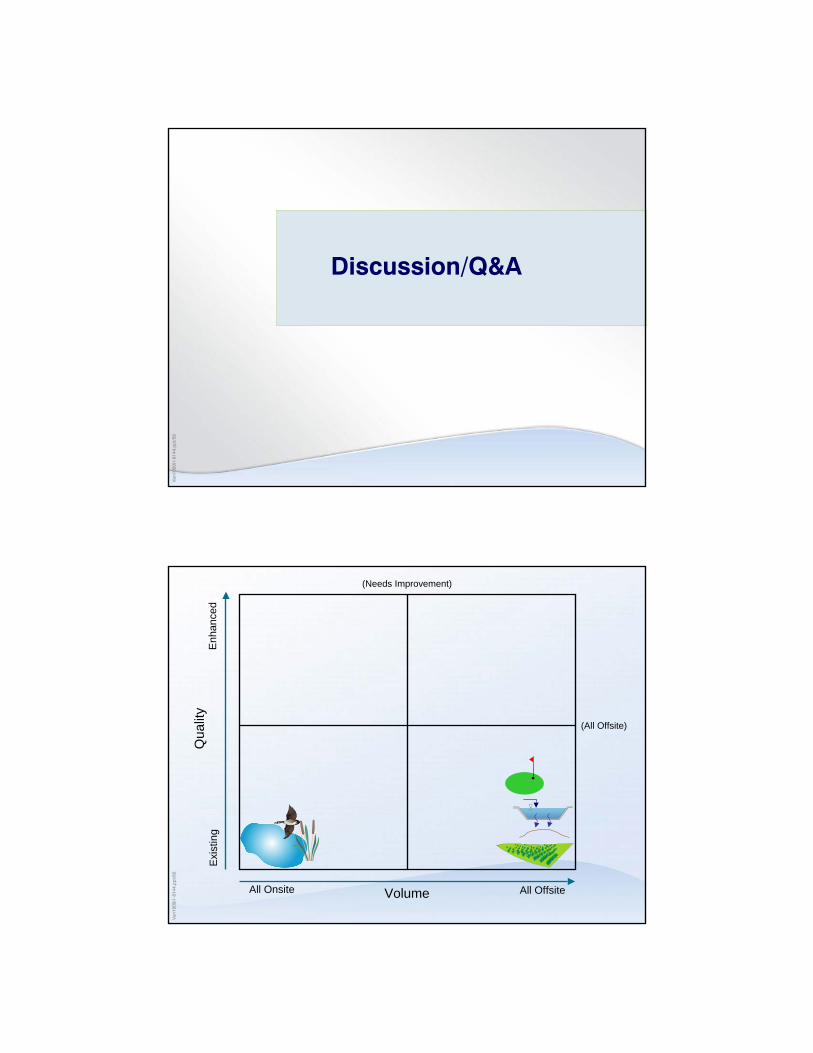
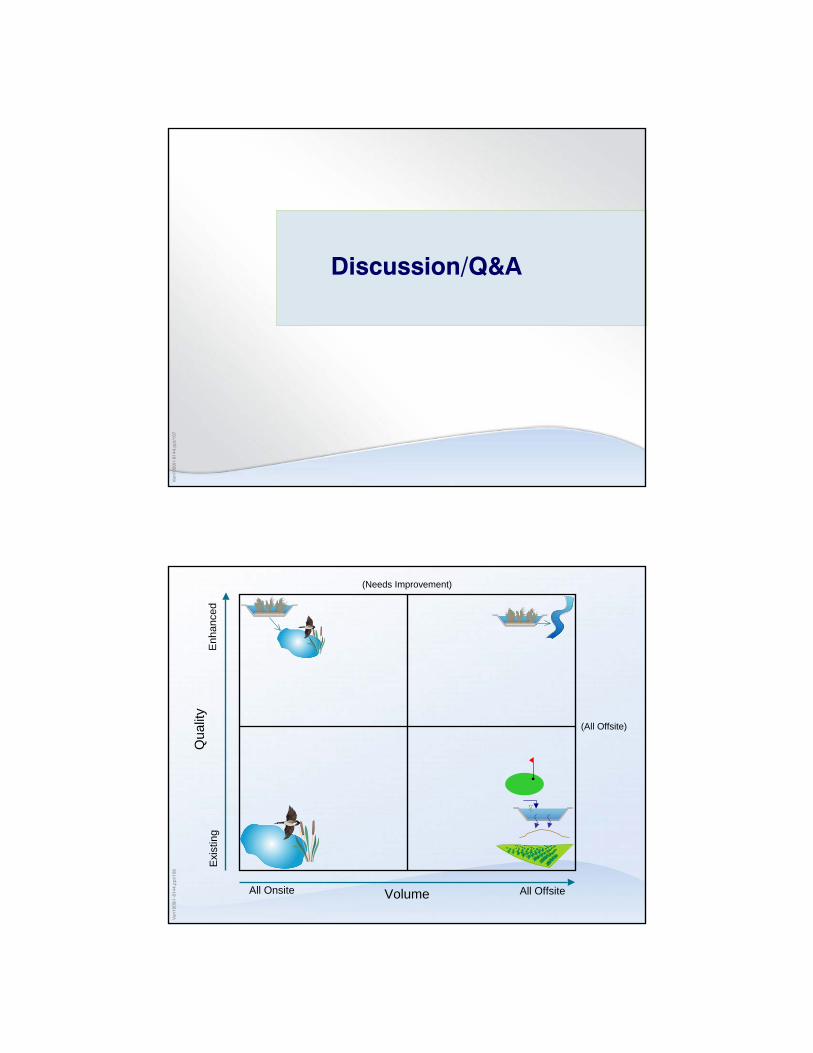
Volume
(Needs Improvement)
(All Offsite)
Enh
ance
d
All Onsite All Offsite
Qua
lity
Exi
stin
g
Ven
1009
i1-8
144.
ppt/6
1
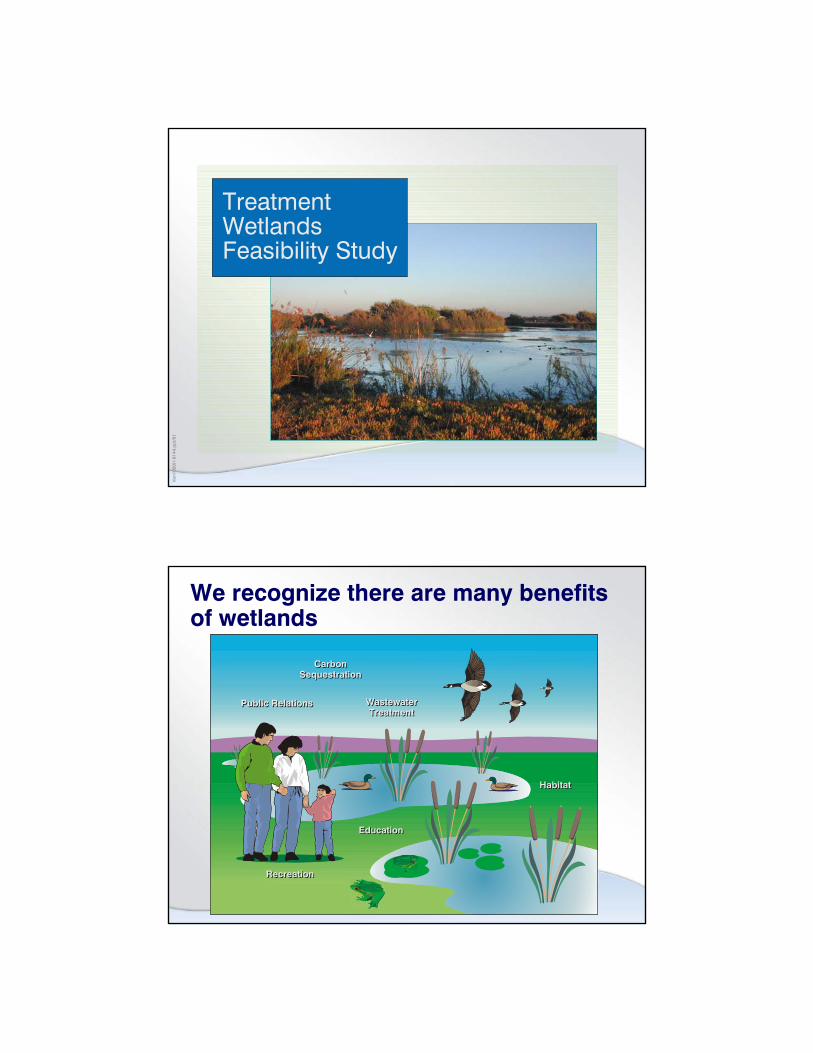
Treatment Wetlands Feasibility Study
We recognize there are many benefits of wetlands
Public RelationsPublic Relations
RecreationRecreation
CarbonSequestration
CarbonSequestration
WastewaterTreatment
WastewaterTreatment
EducationEducation
HabitatHabitat
Ven
1009
i1-8
144.
ppt/6
3
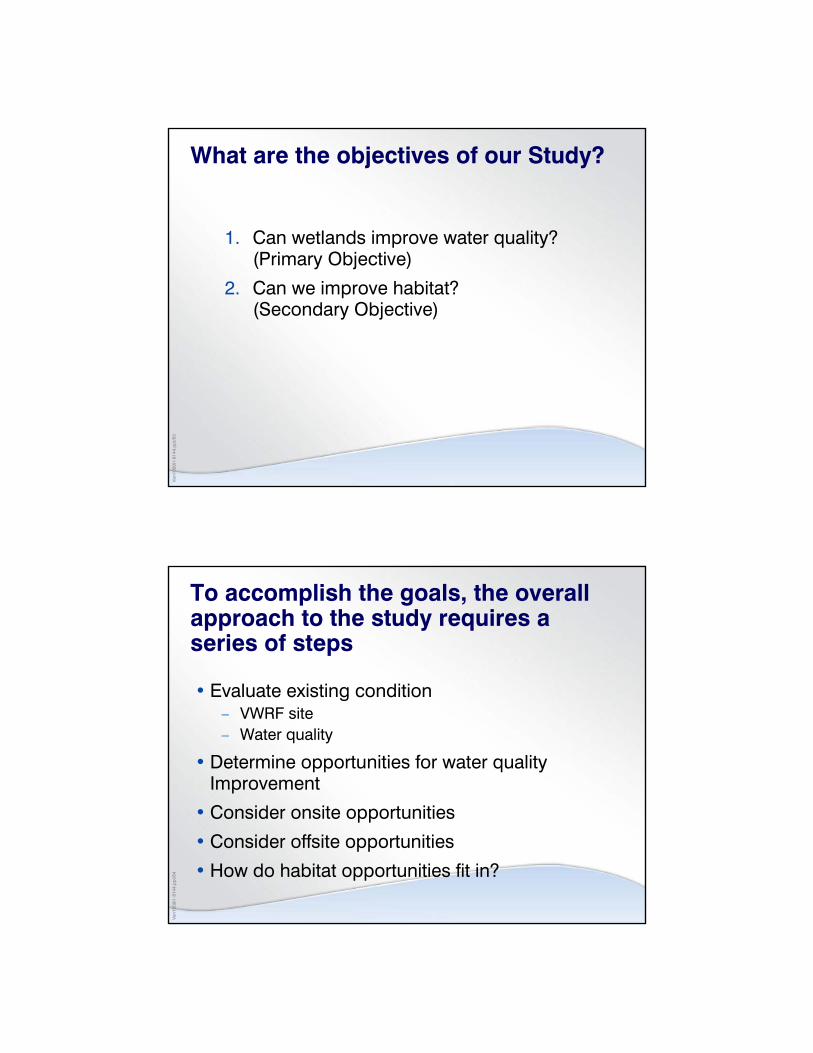
What are the objectives of our Study?
1. Can wetlands improve water quality? (Primary Objective)
2. Can we improve habitat? (Secondary Objective)
Ven
1009
i1-8
144.
ppt/6
4
To accomplish the goals, the overall approach to the study requires a series of steps
• Evaluate existing condition– VWRF site– Water quality
• Determine opportunities for water quality Improvement
• Consider onsite opportunities
• Consider offsite opportunities
• How do habitat opportunities fit in?
Ven
1009
i1-8
144.
ppt/6
5
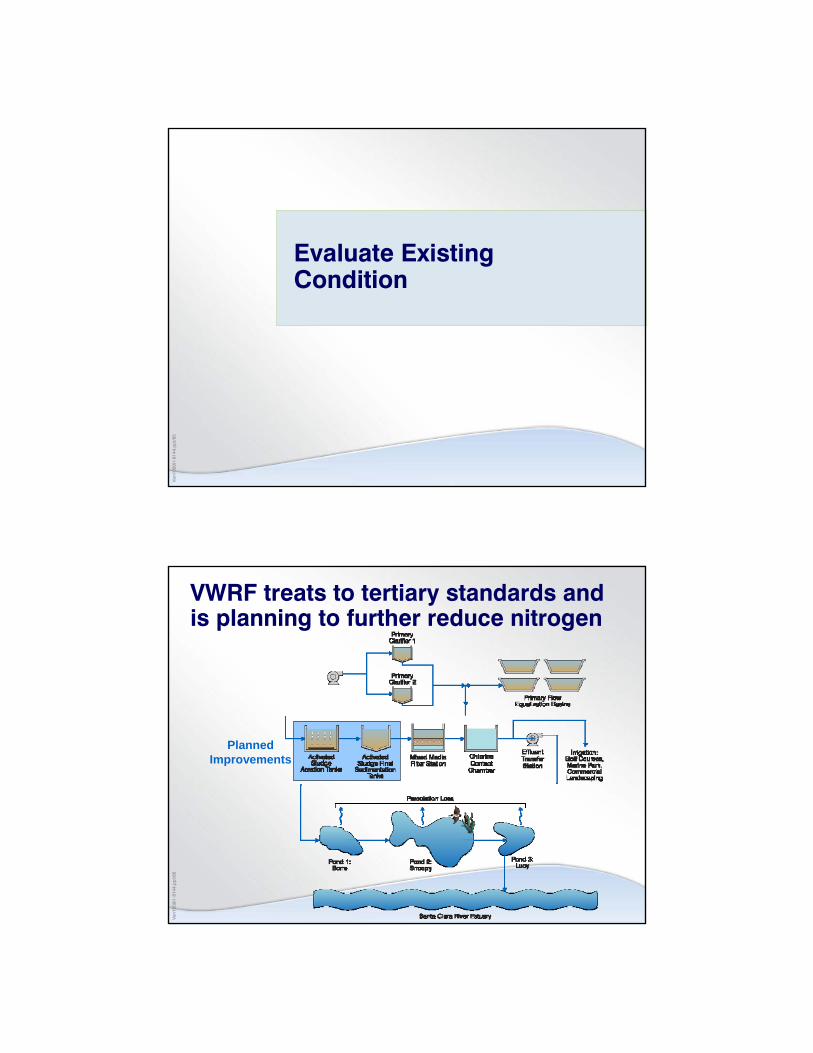
Evaluate Existing Condition
Ven
1009
i1-8
144.
ppt/6
6
PlannedImprovements
VWRF treats to tertiary standards and is planning to further reduce nitrogen
Ven
1009
i1-8
144.
ppt/6
7
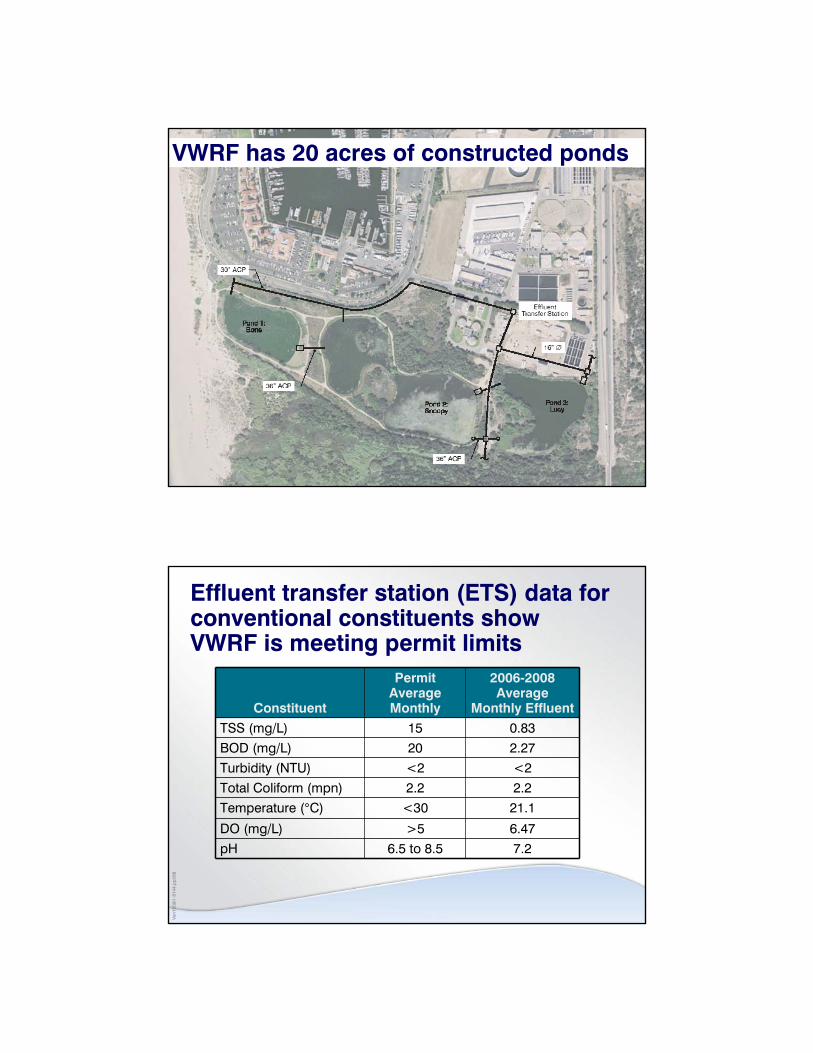
VWRF has 20 acres of constructed pondsV
en10
09i1
-814
4.pp
t/68
Effluent transfer station (ETS) data for conventional constituents show VWRF is meeting permit limits
Constituent
Permit Average Monthly
2006-2008 Average
Monthly Effluent
TSS (mg/L) 15 0.83BOD (mg/L) 20 2.27Turbidity (NTU) <2 <2Total Coliform (mpn) 2.2 2.2Temperature (°C) <30 21.1
DO (mg/L) >5 6.47pH 6.5 to 8.5 7.2
Ven
1009
i1-8
144.
ppt/6
9
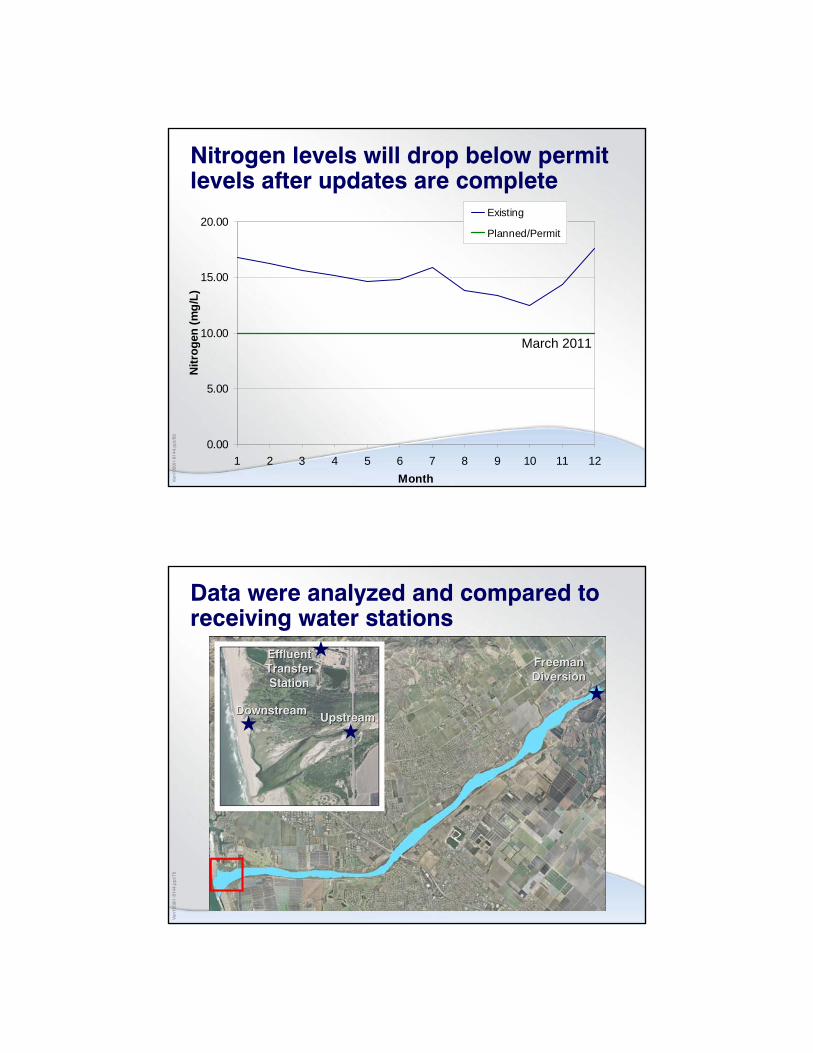
0.00
5.00
10.00
15.00
20.00
1 2 3 4 5 6 7 8 9 10 11 12Month
Nitr
ogen
(mg/
L)Existing
Planned/Permit
Nitrogen levels will drop below permit levels after updates are complete
March 2011
Ven
1009
i1-8
144.
ppt/7
0
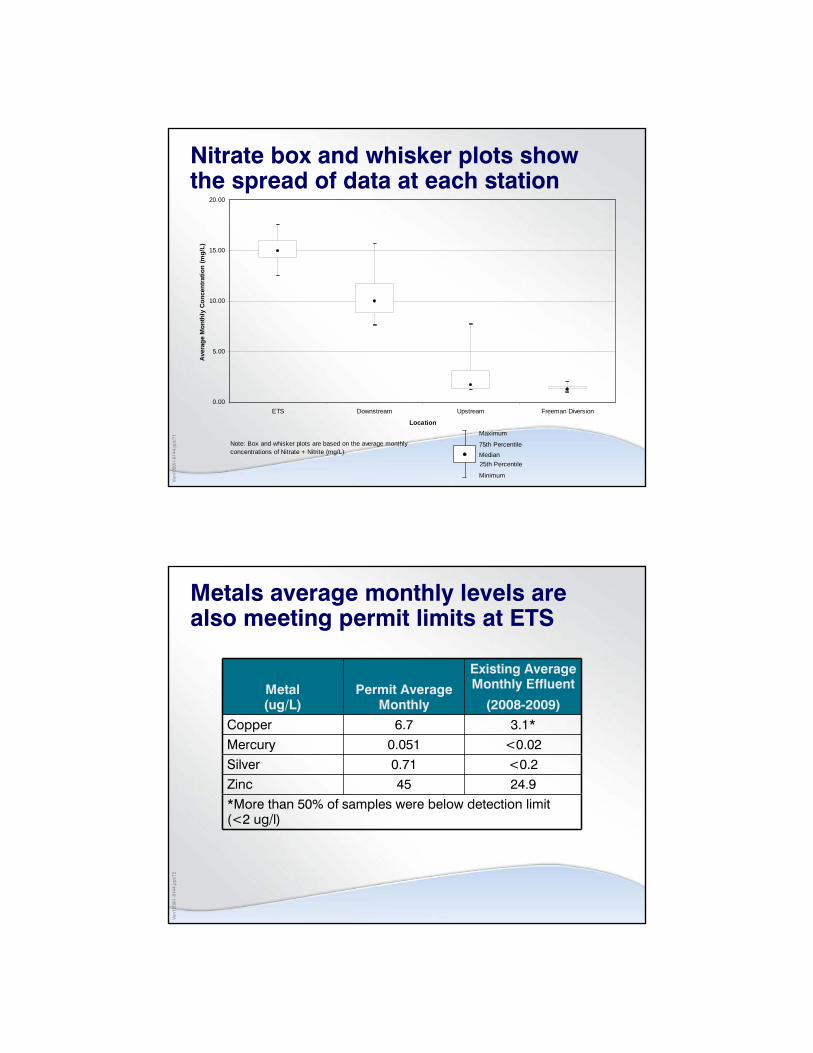
Data were analyzed and compared to receiving water stations
DownstreamDownstreamUpstreamUpstream
Effluent Effluent Transfer Transfer StationStation
Freeman Freeman DiversionDiversion
Ven
1009
i1-8
144.
ppt/7
1
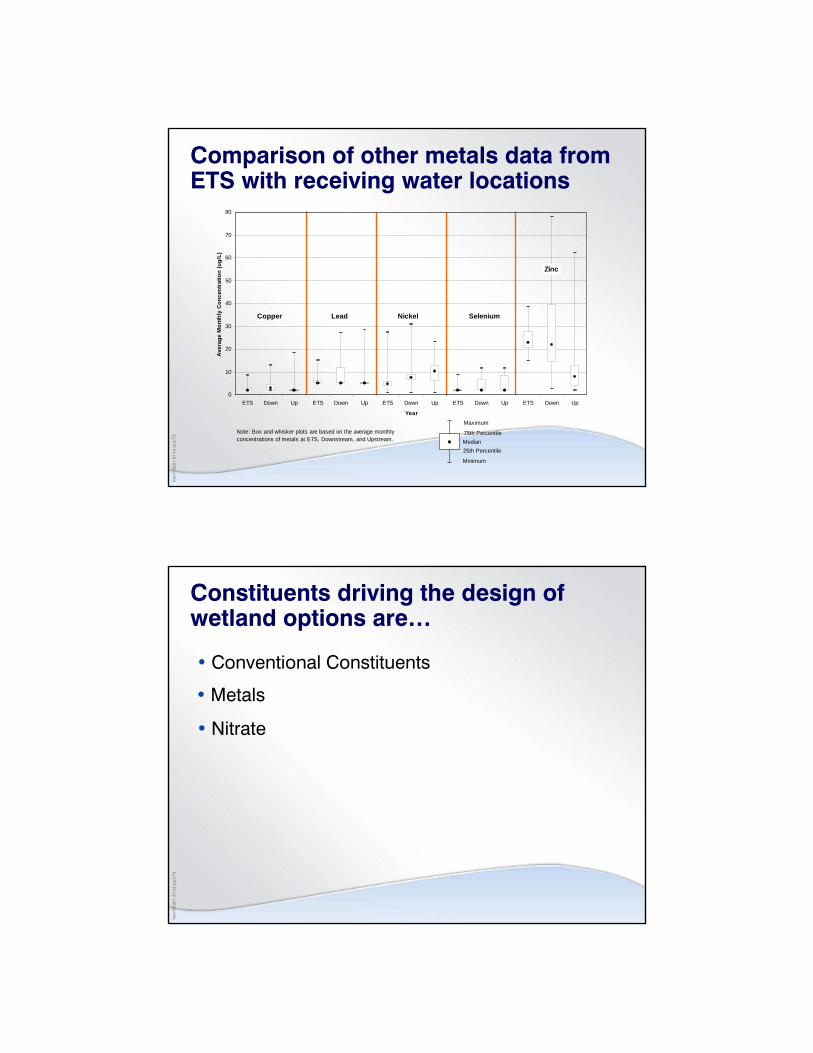
Nitrate box and whisker plots show the spread of data at each station
0.00
5.00
10.00
15.00
20.00
ETS Downstream Upstream Freeman Diversion
Location
Ave
rage
Mon
thly
Con
cent
ratio
n (m
g/L)
Maximum
75th PercentileMedian25th Percentile
Minimum
Note: Box and whisker plots are based on the average monthlyconcentrations of Nitrate + Nitrite (mg/L).
Ven
1009
i1-8
144.
ppt/7
2
Metals average monthly levels are also meeting permit limits at ETS
*More than 50% of samples were below detection limit (<2 ug/l)
Metal (ug/L)
Permit Average Monthly
Existing Average Monthly Effluent
(2008-2009)
Copper 6.7 3.1*Mercury 0.051 <0.02Silver 0.71 <0.2Zinc 45 24.9
Ven
1009
i1-8
144.
ppt/7
3
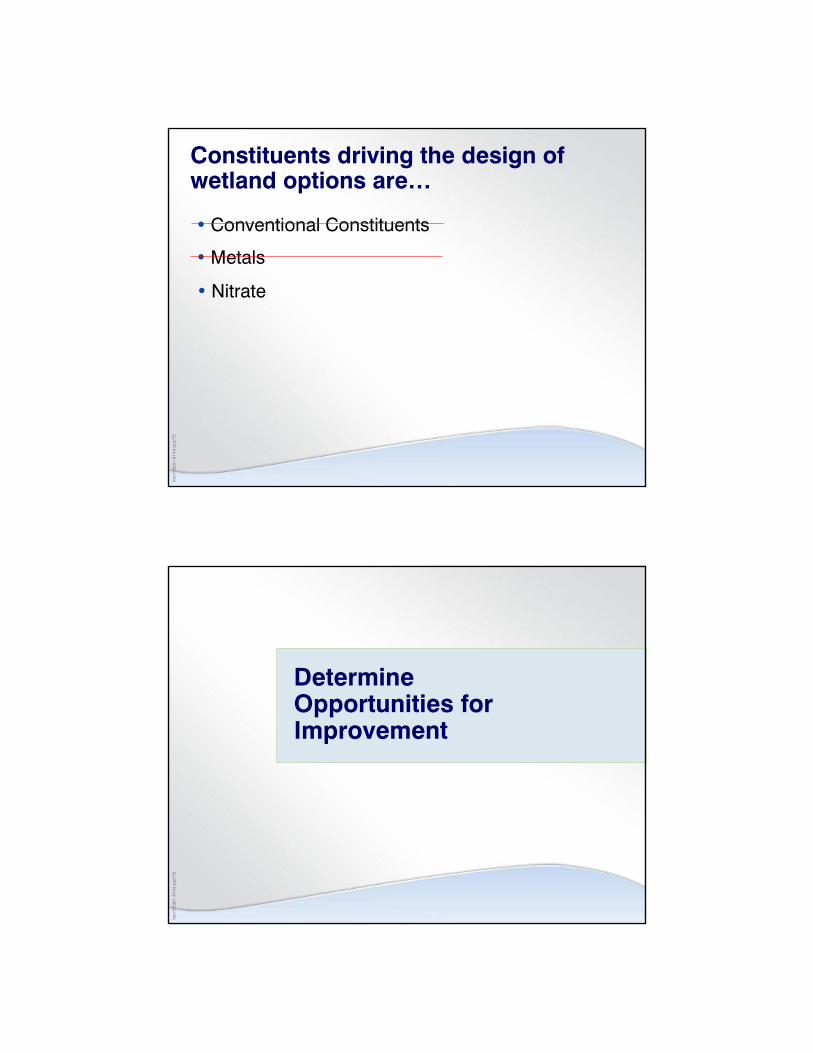
Comparison of other metals data from ETS with receiving water locations
0
10
20
30
40
50
60
70
80
ETS Down Up ETS Down Up ETS Down Up ETS Down Up ETS Down Up
Year
Aver
age
Mon
thly
Con
cent
ratio
n (u
g/L)
Maximum
75th PercentileMedian25th Percentile
Minimum
Note: Box and whisker plots are based on the average monthly concentrations of metals at ETS, Downstream, and Upstream.
Copper Lead Nickel Selenium
Zinc
Ven
1009
i1-8
144.
ppt/7
4
Constituents driving the design of wetland options are…
• Conventional Constituents
• Nitrate
• Metals
Ven
1009
i1-8
144.
ppt/7
5
Constituents driving the design of wetland options are…
• Conventional Constituents
• Nitrate
• Metals
Ven
1009
i1-8
144.
ppt/7
6
Determine Opportunities for Improvement
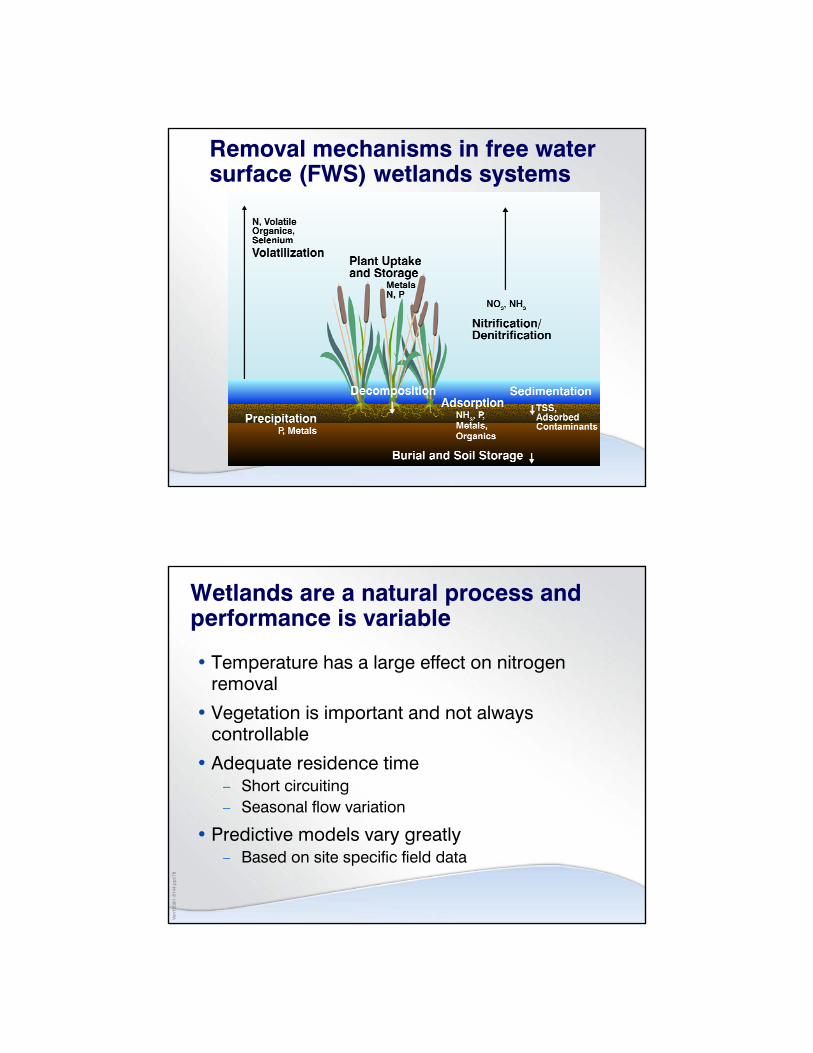
Removal mechanisms in free water surface (FWS) wetlands systems
Ven
1009
i1-8
144.
ppt/7
8
Wetlands are a natural process and performance is variable
• Temperature has a large effect on nitrogen removal
• Vegetation is important and not always controllable
• Adequate residence time– Short circuiting– Seasonal flow variation
• Predictive models vary greatly– Based on site specific field data
Ven
1009
i1-8
144.
ppt/7
9
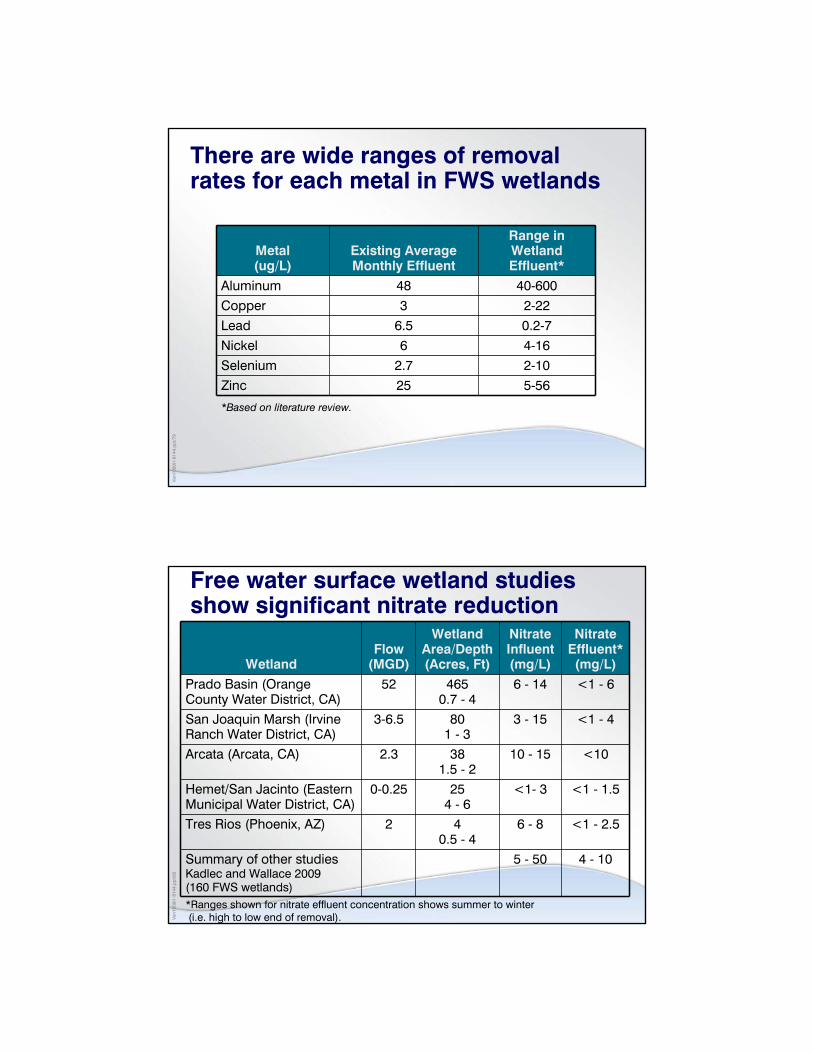
There are wide ranges of removal rates for each metal in FWS wetlands
Metal (ug/L)
Existing Average Monthly Effluent
Range in Wetland Effluent*
Aluminum 48 40-600Copper 3 2-22Lead 6.5 0.2-7Nickel 6 4-16Selenium 2.7 2-10Zinc 25 5-56
*Based on literature review.
Ven
1009
i1-8
144.
ppt/8
0
Free water surface wetland studies show significant nitrate reduction
<1 - 2.56 - 840.5 - 4
2Tres Rios (Phoenix, AZ)
WetlandFlow
(MGD)
Wetland Area/Depth (Acres, Ft)
Nitrate Influent (mg/L)
Nitrate Effluent* (mg/L)
Prado Basin (Orange County Water District, CA)
52 4650.7 - 4
6 - 14 <1 - 6
San Joaquin Marsh (Irvine Ranch Water District, CA)
3-6.5 801 - 3
3 - 15 <1 - 4
Arcata (Arcata, CA) 2.3 381.5 - 2
10 - 15 <10
Hemet/San Jacinto (Eastern Municipal Water District, CA)
0-0.25 254 - 6
<1- 3 <1 - 1.5
Summary of other studies Kadlec and Wallace 2009 (160 FWS wetlands)
5 - 50 4 - 10
*Ranges shown for nitrate effluent concentration shows summer to winter (i.e. high to low end of removal).
Ven
1009
i1-8
144.
ppt/8
1
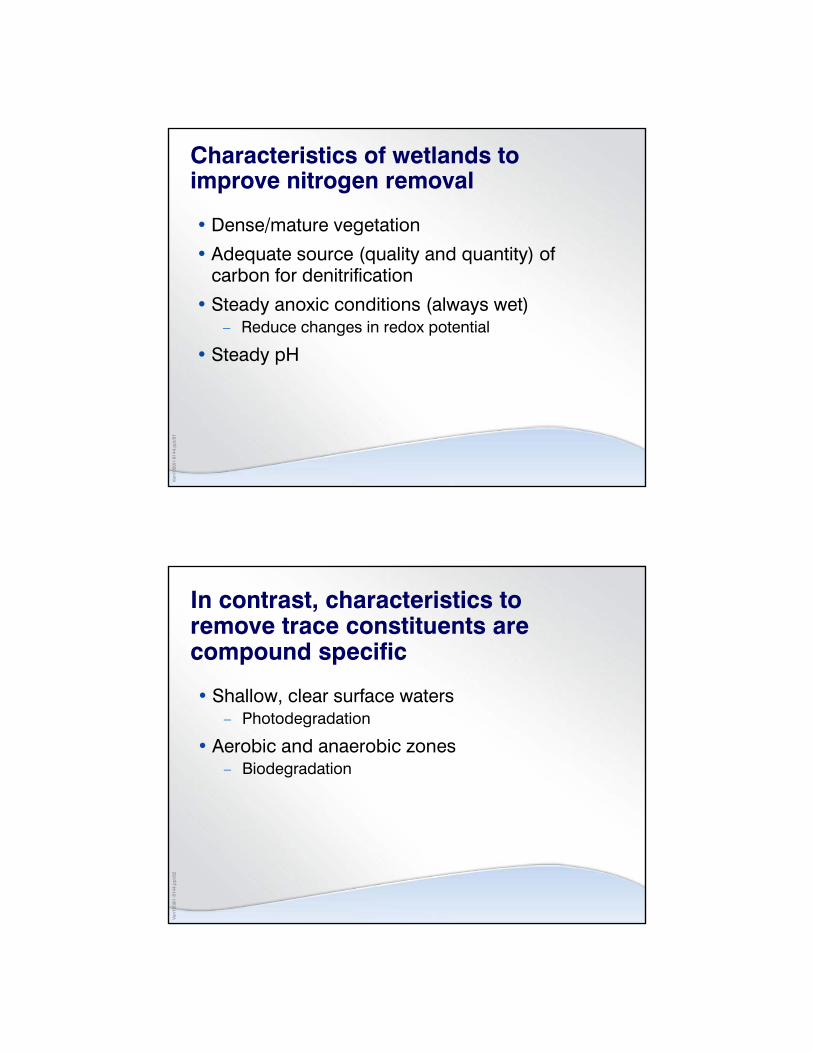
Characteristics of wetlands to improve nitrogen removal
• Dense/mature vegetation
• Adequate source (quality and quantity) of carbon for denitrification
• Steady anoxic conditions (always wet)– Reduce changes in redox potential
• Steady pH
Ven
1009
i1-8
144.
ppt/8
2
In contrast, characteristics to remove trace constituents are compound specific
• Shallow, clear surface waters– Photodegradation
• Aerobic and anaerobic zones– Biodegradation

Ven
1009
i1-8
144.
ppt/8
3
Onsite Treatment Wetlands Opportunities
Ven
1009
i1-8
144.
ppt/8
4
VWRF has 20 acres of constructed ponds

Ven
1009
i1-8
144.
ppt/8
5
The existing constructed ponds could be converted partially or completely into constructed wetlands…
PondArea
(acres)Depth (feet) Type
Pond 1: Bone 4.46 4 Open
Pond 2: Snoopy 10.16 4 Open
Pond 3: Lucy 5.74 8 Open
Ven
1009
i1-8
144.
ppt/8
6
The hydraulics of the ponds will drive the process used to develop potential onsite wetland options
Ven
1009
i1-8
144.
ppt/8
7
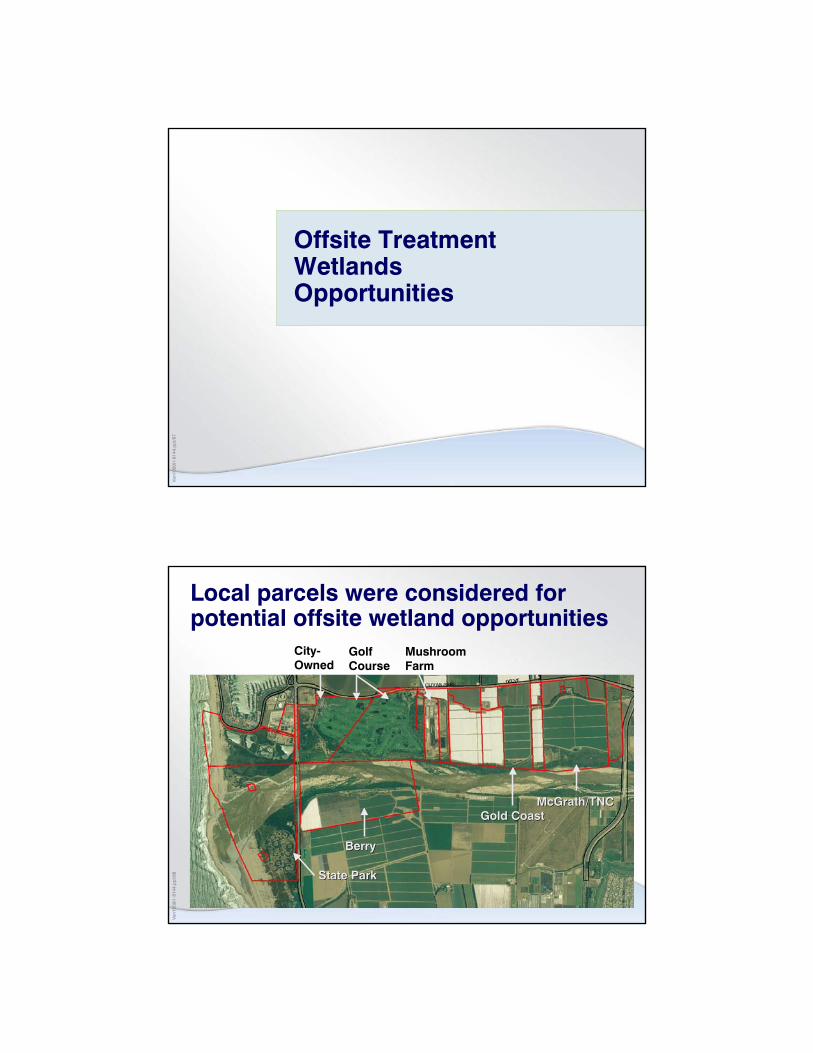
Offsite Treatment Wetlands Opportunities
Ven
1009
i1-8
144.
ppt/8
8
Local parcels were considered for potential offsite wetland opportunities
Mushroom Farm
Gold CoastGold CoastMcGrath/TNCMcGrath/TNC
City-Owned
Golf Course
BerryBerry
State ParkState Park
Ven
1009
i1-8
144.
ppt/8
9
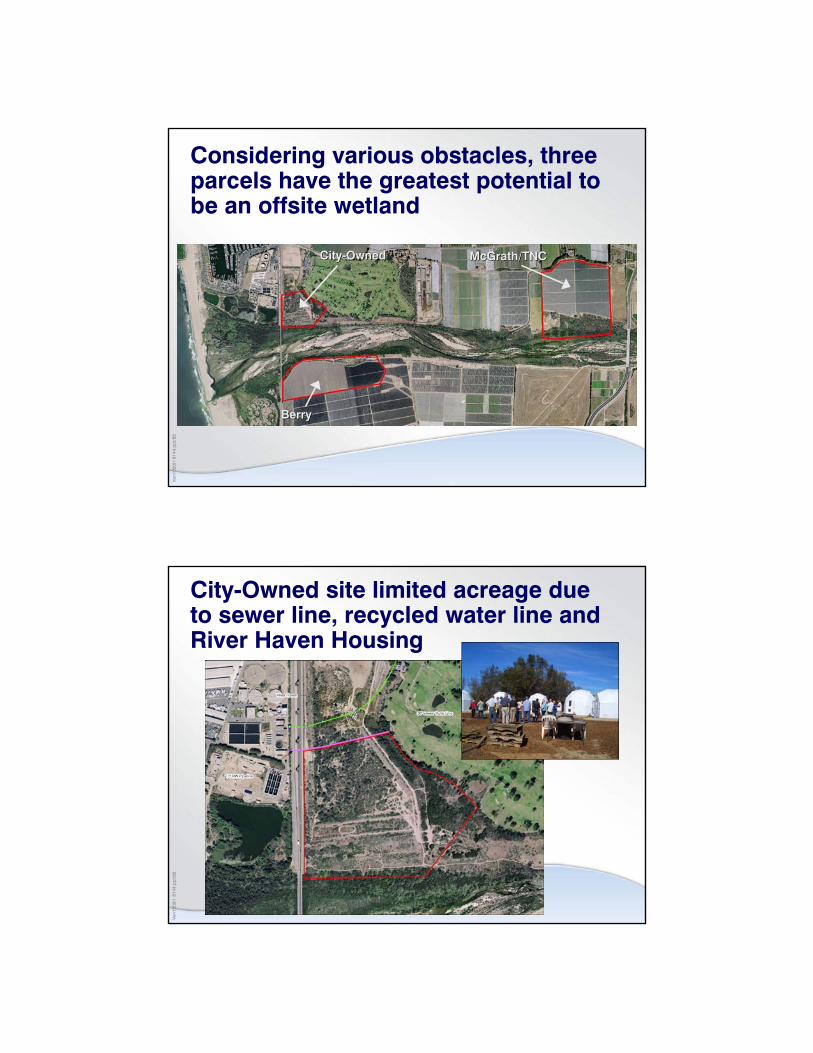
Considering various obstacles, three parcels have the greatest potential to be an offsite wetland
BerryBerry
McGrath/TNCMcGrath/TNCCityCity--OwnedOwned
Ven
1009
i1-8
144.
ppt/9
0
City-Owned site limited acreage due to sewer line, recycled water line and River Haven Housing
Ven
1009
i1-8
144.
ppt/9
1
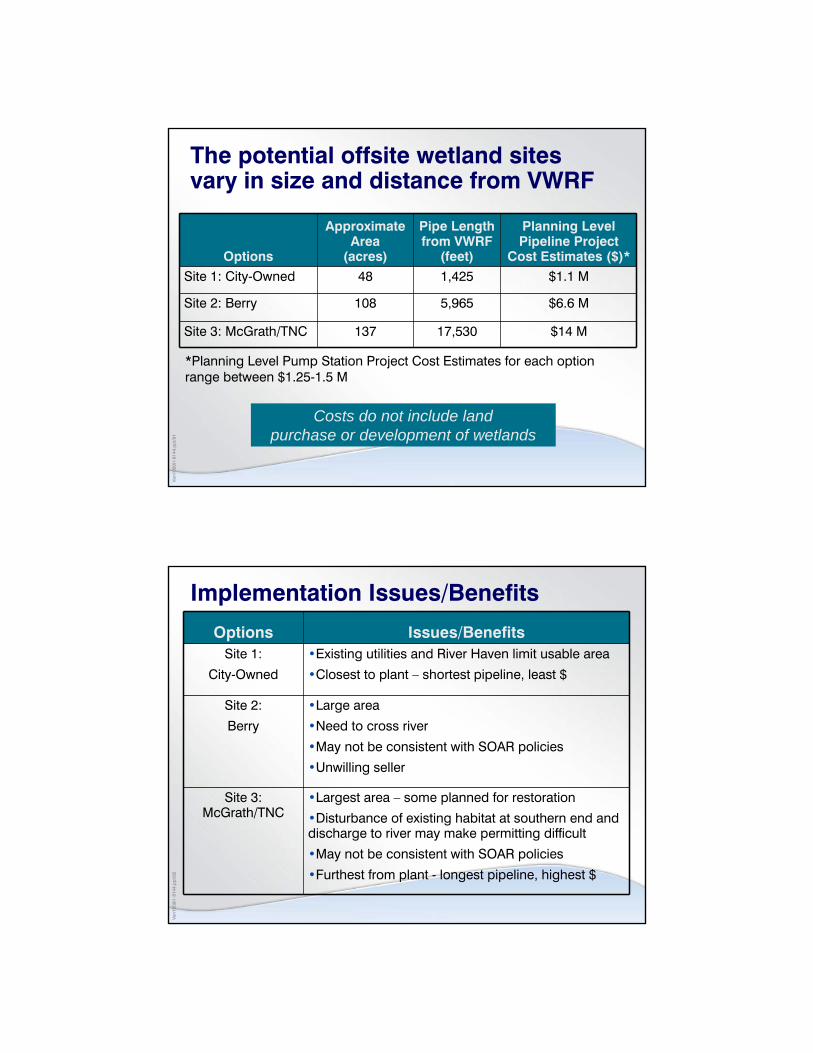
The potential offsite wetland sites vary in size and distance from VWRF
Options
Approximate Area
(acres)
Pipe Length from VWRF
(feet)
Planning Level Pipeline Project
Cost Estimates ($)*Site 1: City-Owned 48 1,425 $1.1 M
Site 2: Berry 108 5,965 $6.6 M
Site 3: McGrath/TNC 137 17,530 $14 M
*Planning Level Pump Station Project Cost Estimates for each option range between $1.25-1.5 M
Costs do not include land purchase or development of wetlands
Ven
1009
i1-8
144.
ppt/9
2
Implementation Issues/Benefits
Options Issues/BenefitsSite 1:
City-Owned
•Existing utilities and River Haven limit usable area
•Closest to plant – shortest pipeline, least $
Site 2:
Berry
•Large area
•Need to cross river
•May not be consistent with SOAR policies
•Unwilling seller
Site 3: McGrath/TNC
•Largest area – some planned for restoration
•Disturbance of existing habitat at southern end and discharge to river may make permitting difficult
•May not be consistent with SOAR policies
•Furthest from plant - longest pipeline, highest $
Ven
1009
i1-8
144.
ppt/9
3
Habitat Opportunities
Ven
1009
i1-8
144.
ppt/9
4
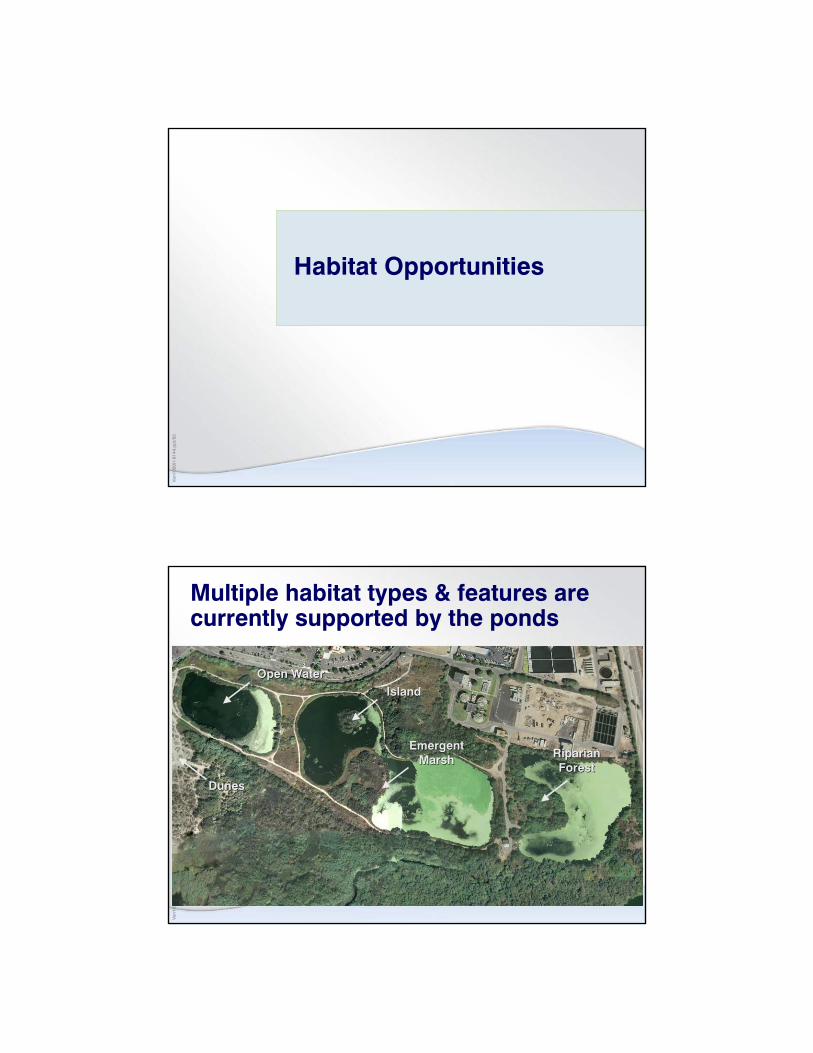
Multiple habitat types & features are currently supported by the ponds
Open WaterOpen Water
Emergent Emergent MarshMarsh Riparian Riparian
ForestForest
IslandIsland
DunesDunes
Ven
1009
i1-8
144.
ppt/9
5
A wide variety of wildlife species are associated with the habitats
Open water Western pond turtles*, dabbling ducks, diving ducks, gulls, phalaropes, grebes, swallows
Emergent marsh Tri-colored blackbird*, rails, herons, egrets, shorebirds, marsh wren, common yellowthroat, song sparrows, Pacific chorus frogs, garter snakes
Riparian forest Southwestern willow flycatcher*, yellow warbler*, yellow-breasted chat*, Least Bell's vireo*, black phoebe, bushtit, Pacific-slope flycatcher, yellow-breasted chat, black-headed grosbeak, Swainson’s thrush, bats
Dunes California least tern*, western snowy plover*, killdeer, western fence lizard, side-blotched lizard
*special-status species (none documented at site except western snowy plover and California least tern)
Ven
1009
i1-8
144.
ppt/9
6
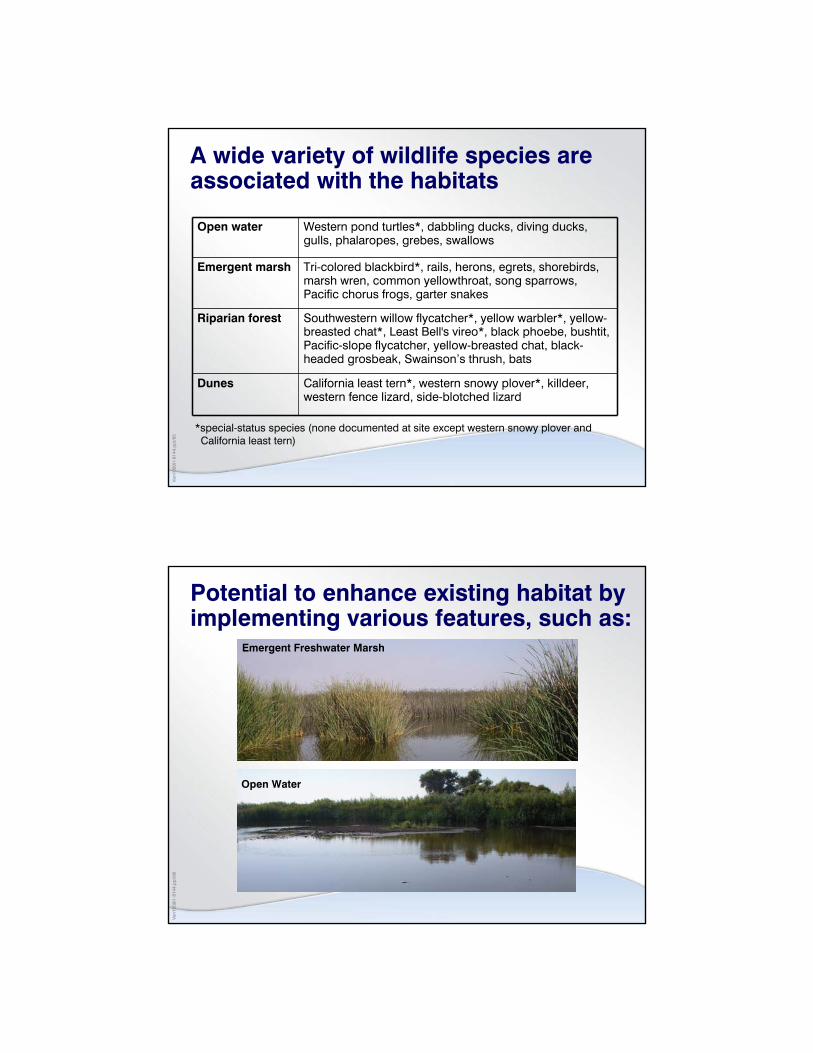
Potential to enhance existing habitat by implementing various features, such as:
Emergent Freshwater Marsh
Open Water
Ven
1009
i1-8
144.
ppt/9
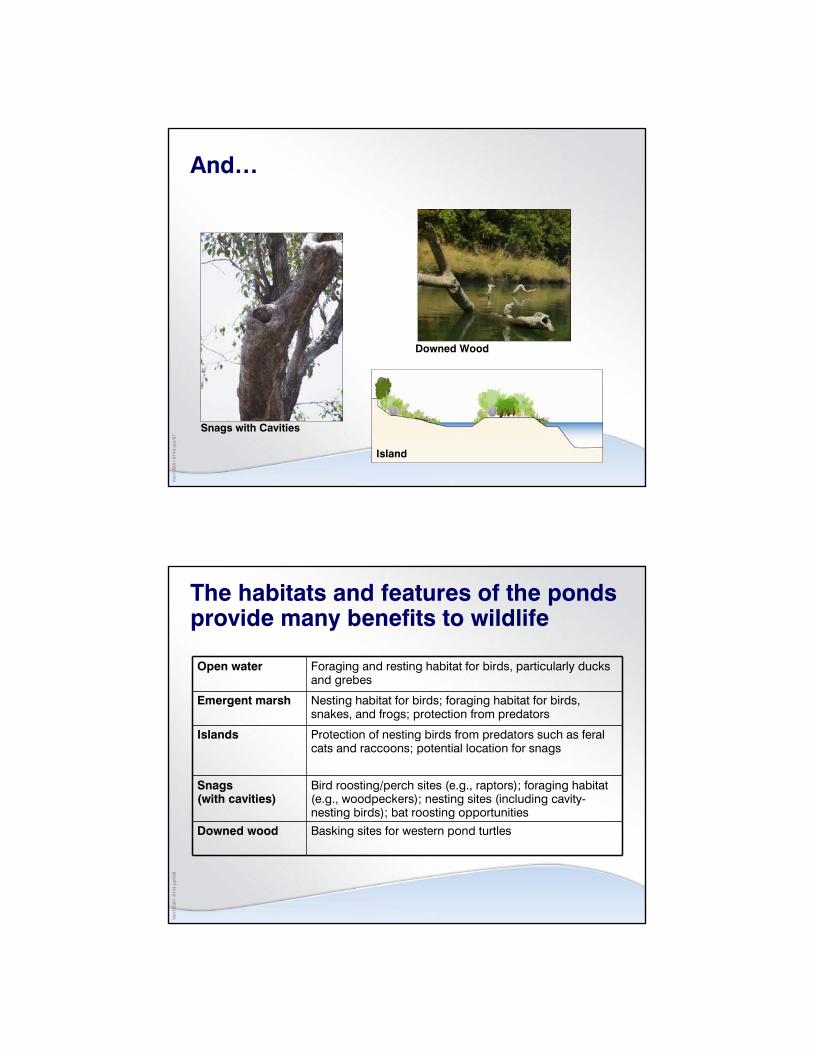
7And…
Downed Wood
Snags with Cavities
Island
Ven
1009
i1-8
144.
ppt/9
8
The habitats and features of the ponds provide many benefits to wildlife
Open water Foraging and resting habitat for birds, particularly ducks and grebes
Emergent marsh Nesting habitat for birds; foraging habitat for birds, snakes, and frogs; protection from predators
Islands Protection of nesting birds from predators such as feral cats and raccoons; potential location for snags
Snags (with cavities)
Bird roosting/perch sites (e.g., raptors); foraging habitat (e.g., woodpeckers); nesting sites (including cavity-nesting birds); bat roosting opportunities
Downed wood Basking sites for western pond turtles

Ven
1009
i1-8
144.
ppt/9
9
Summary of Key Findings
Ven
1009
i1-8
144.
ppt/1
00
Summary of key findings from the treatment wetlands feasibility study
• Little opportunity for water quality improvement for conventional constituents or metals
• Some opportunity for improvement of nutrients
• Wetland can achieve TN (3-8 mg/L) depending on the season/temperature
• Final water quality from onsite ponds depends on flow and season
• Onsite opportunities are limited by the existing pond area and depths, as well as competing habitat goals
• Offsite opportunities are limited by costs, land use policies, willing sellers, and permitting hurdles
Ven
1009
i1-8
144.
ppt/1
01
Volume
(Needs Improvement)
(All Offsite)
Enh
ance
d
All Onsite All Offsite
Qua
lity
Exi
stin
g
Ven
1009
i1-8
144.
ppt/1
02
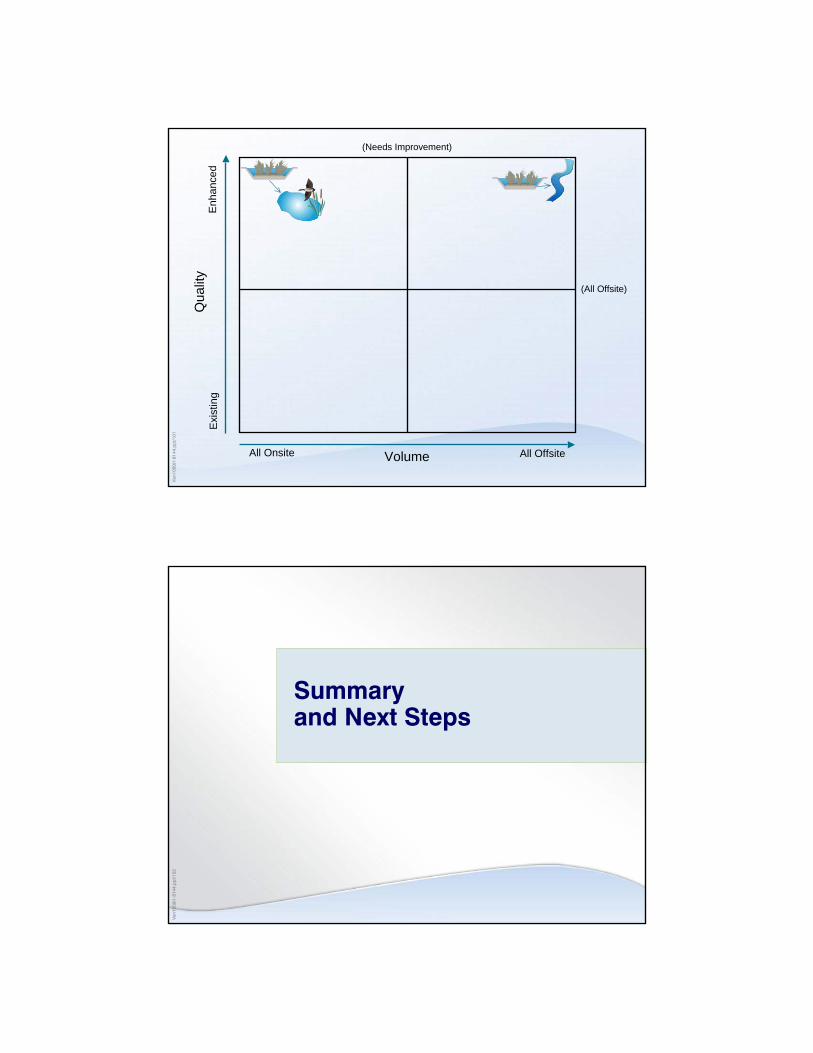
Summary and Next Steps
Ven
1009
i1-8
144.
ppt/1
03
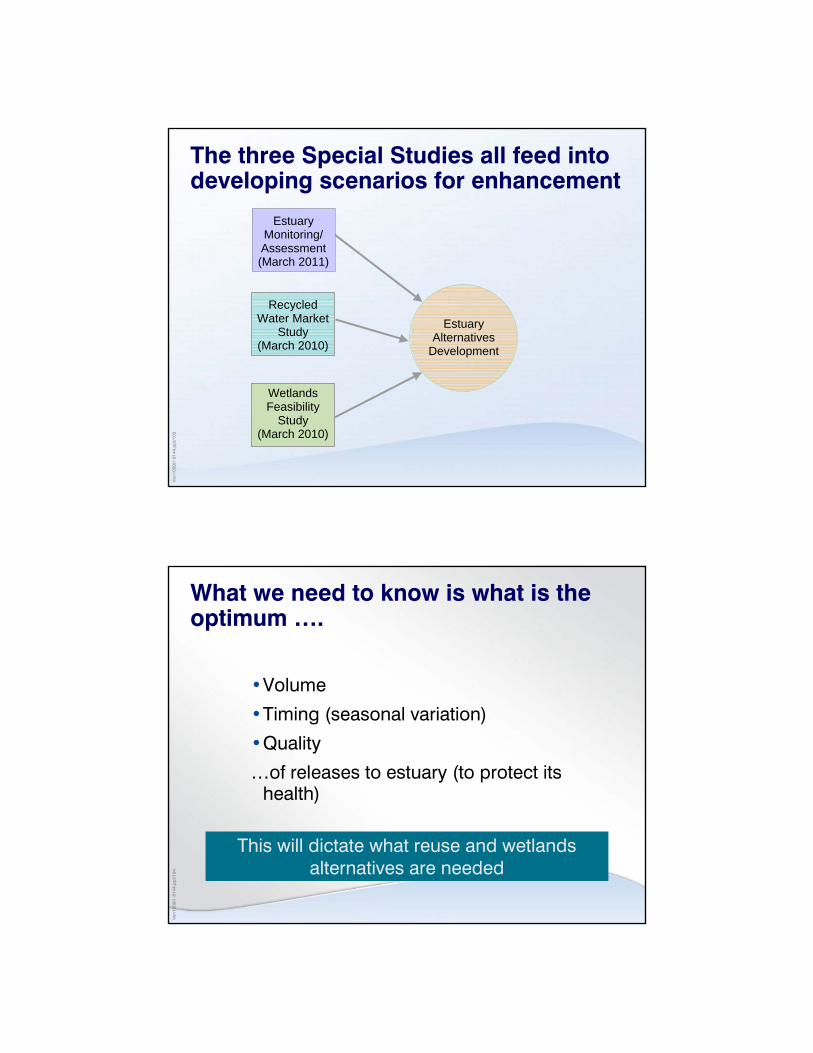
Recycled Water Market
Study(March 2010)
Wetlands Feasibility
Study(March 2010)
EstuaryMonitoring/ Assessment (March 2011)
EstuaryAlternatives
Development
The three Special Studies all feed into developing scenarios for enhancement
Ven
1009
i1-8
144.
ppt/1
04
This will dictate what reuse and wetlands alternatives are needed
What we need to know is what is the optimum ….
•Volume
•Timing (seasonal variation)
•Quality
…of releases to estuary (to protect its health)
Ven
1009
i1-8
144.
ppt/1
05
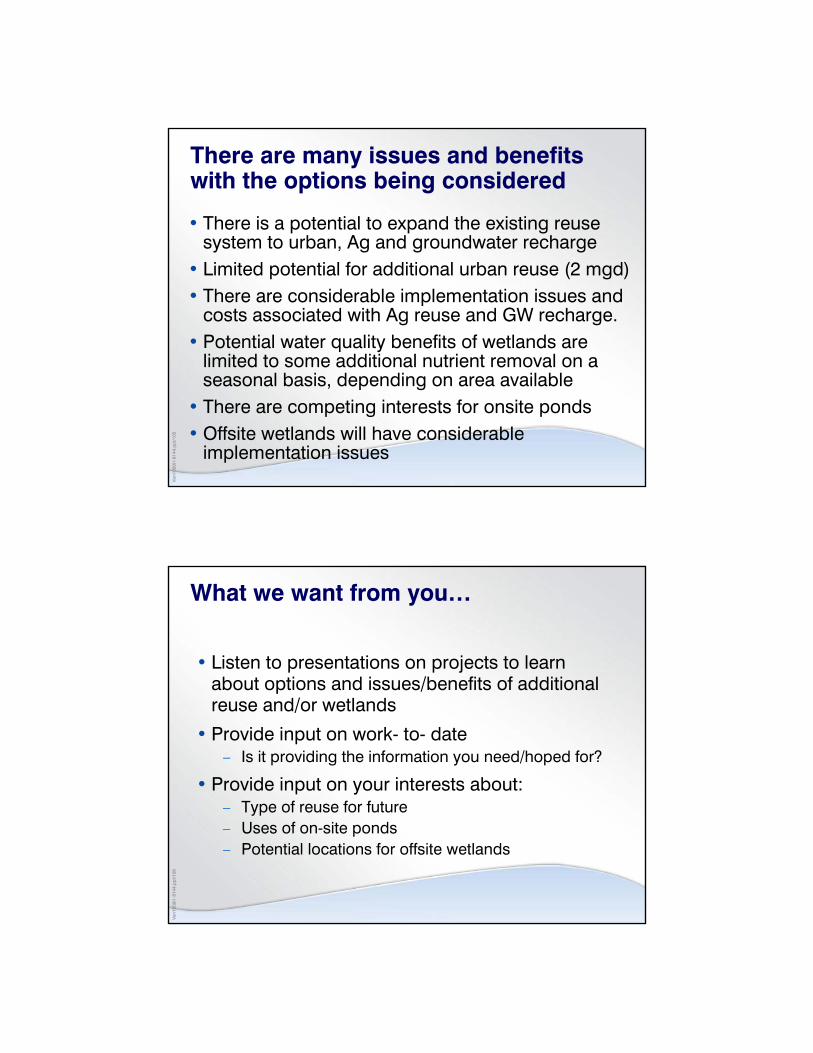
There are many issues and benefits with the options being considered
• There is a potential to expand the existing reuse system to urban, Ag and groundwater recharge
• Limited potential for additional urban reuse (2 mgd)• There are considerable implementation issues and
costs associated with Ag reuse and GW recharge. • Potential water quality benefits of wetlands are
limited to some additional nutrient removal on a seasonal basis, depending on area available
• There are competing interests for onsite ponds• Offsite wetlands will have considerable
implementation issues
Ven
1009
i1-8
144.
ppt/1
06
What we want from you…
• Listen to presentations on projects to learn about options and issues/benefits of additional reuse and/or wetlands
• Provide input on work- to- date– Is it providing the information you need/hoped for?
• Provide input on your interests about:– Type of reuse for future– Uses of on-site ponds– Potential locations for offsite wetlands
Ven
1009
i1-8
144.
ppt/1
07
Discussion/Q&A
Ven
1009
i1-8
144.
ppt/1
08
Volume
(Needs Improvement)
(All Offsite)
Enh
ance
d
All Onsite All Offsite
Qua
lity
Exi
stin
g
Ven
1009
i1-8
144.
ppt/1
09
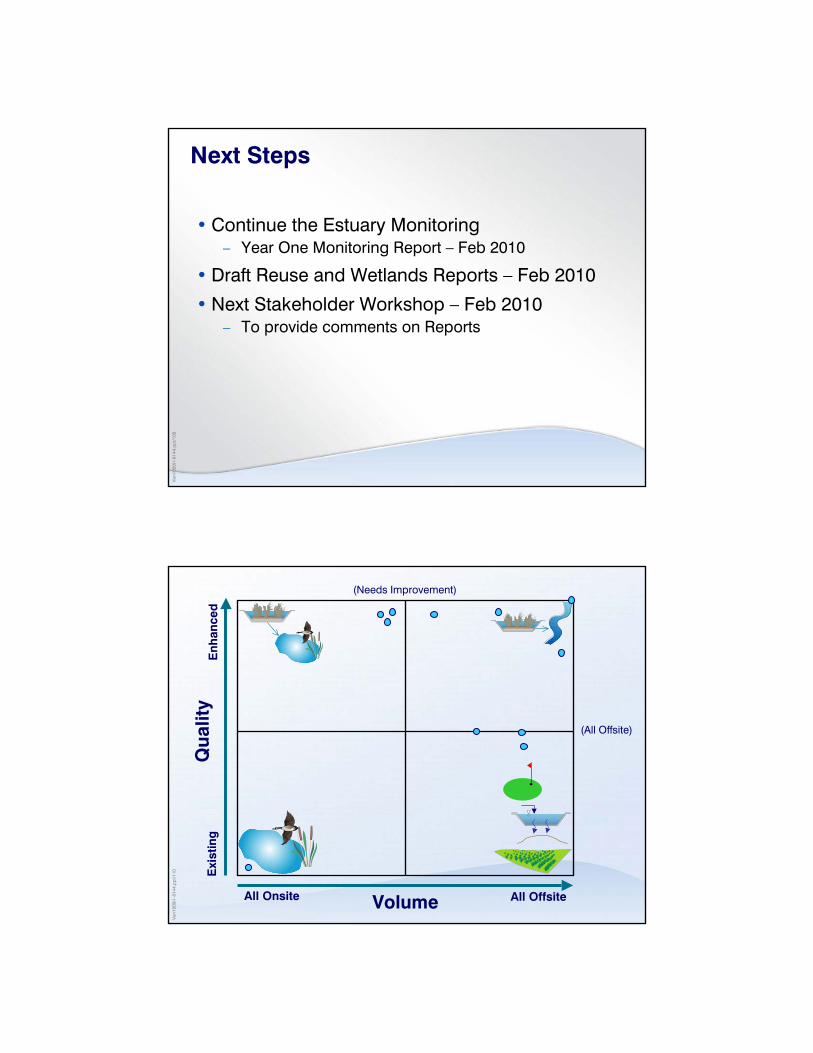
Next Steps
• Continue the Estuary Monitoring– Year One Monitoring Report – Feb 2010
• Draft Reuse and Wetlands Reports – Feb 2010
• Next Stakeholder Workshop – Feb 2010– To provide comments on Reports
Ven
1009
i1-8
144.
ppt/1
10
Volume
(Needs Improvement)
(All Offsite)
Enh
ance
d
All Onsite All Offsite
Qua
lity
Exi
stin
g
Ven
1009
i1-8
144.
ppt/1
11
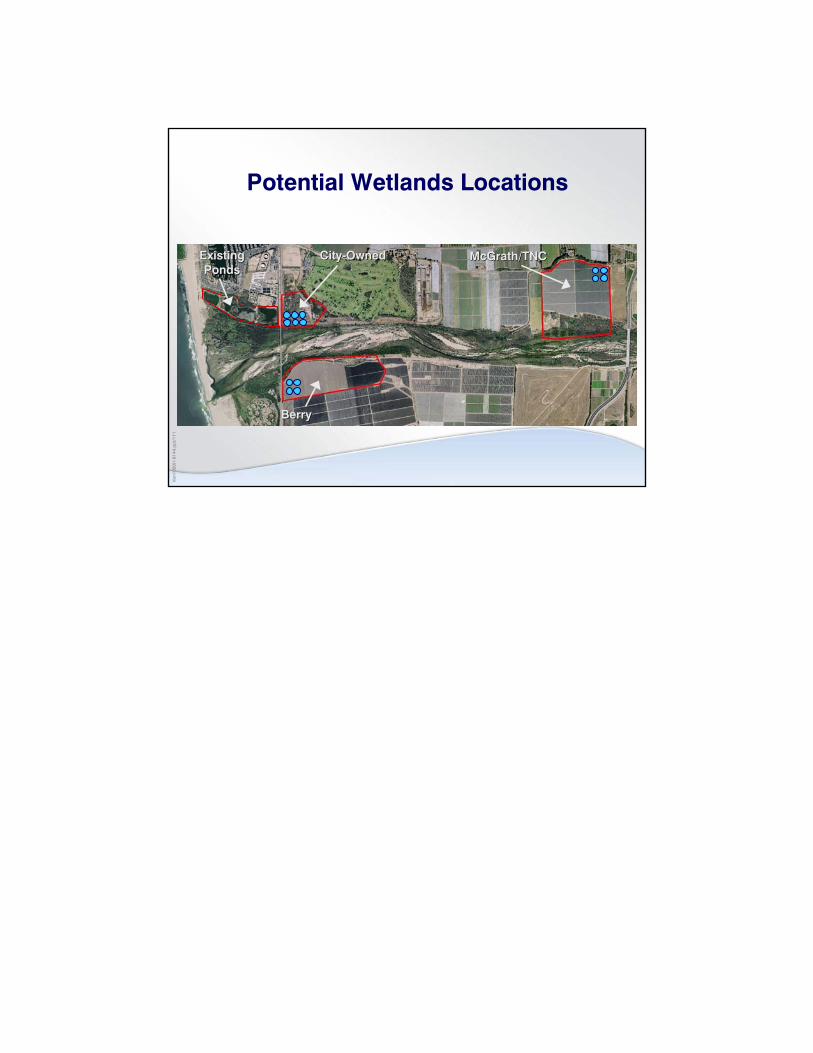
Potential Wetlands Locations
BerryBerry
McGrath/TNCMcGrath/TNCCityCity--OwnedOwnedExisting Existing PondsPonds